 Yantao Guo
 Weili Jiao1,3*
94% of researchers rate our articles as excellent or good
Learn more about the work of our research integrity team to safeguard the quality of each article we publish.
Find out more
ORIGINAL RESEARCH article
Front. Environ. Sci., 13 July 2022
Sec. Environmental Informatics and Remote Sensing
Volume 10 - 2022 | https://doi.org/10.3389/fenvs.2022.939151
This article is part of the Research TopicMethods and Applications in Environmental Informatics and Remote SensingView all 9 articles
The Qinghai–Tibet Plateau (QTP) plays a significant role in global climate change and biodiversity conservation. As the third pole of the Earth, it has a wide range and complex terrain. QTP has a vertical distribution of vegetation, and its forest ecosystems play a key role in the region. Forest extraction in this region is still a comprehensive problem because of the phenological periods of different forest types in distinct regions of the QTP and the characteristics of frequent rain and cloudy weather in the south. Taking these factors into consideration, multiple features, including reflectance, spectral indices, statistical backscattering coefficients, topographic slope, and aspect, derived from a multisource dataset incorporating optical remote sensing data, synthetic radar, and digital elevation models, were applied to extract forest in the QTP based on the random forest (RF) classification method. As more than 30 features were involved, the 5-folded cross-validation method was used to determine the optimal parameters and features for the RF model. Using 14,919 forest samples and a multifeature optimized RF classification model, a 10-m resolution forest cover map of QTP in 2021 was generated based on the Sentinel series of satellite datasets and digital elevation model datasets on the Google Earth Engine (GEE) platform. After verification, the overall accuracy of the forest cover map generated in this article is 98.3%, and the Kappa coefficient is 0.95, which is better than the European Space Agency (ESA) WorldCover forest layer.
As the primary component of the terrestrial ecosystem, the forest is one of the key indicators of global warming and carbon storage changes (Fang et al., 2001; Gao et al., 2022). The growth status and cover area of the forest ecosystem have a certain relation to a series of global and regional changes, such as temperature shift and water regulation, biodiversity disturbance, and human settlement construction (Pickell et al., 2016; Li et al., 2022; Su et al., 2022). Forest cover extraction is an intuitive observation element for forest ecosystems in the fields of global warming and changes in the human living environment. Therefore, accurate and quick extraction of the forest cover is quite meaningful for scientific research and political decision on global climate change and human activity.
As the third pole, the Qinghai–Tibet Plateau (QTP) is the largest geographic area with the highest elevation on the Earth and acts as an important indicator for climate warming, hydrological cycle, and phenological changes in east Asia and even for the whole world (Yang et al., 2011; Qiu, 2012; Yao et al., 2012; Liu et al., 2017). The plateau shows significant environmental features, such as cold climate in a high elevation region and unique ecological patterns known as “Tibetan zonation” (Mo et al., 2004). The QTP region has a large variety of ecosystem types, from the subtropical broadleaf forest in the southeast mountain region and mixed coniferous forest in the east mountain region to alpine grassland in the northwest desert region (Zhang, 1978; Chen et al., 2014). Meanwhile, climate change has an obvious effect on the phenological information of coniferous forests and broadleaf forests in the QTP region, such as temperature, precipitation, and radiation (Wang et al., 2020). For example, the shift of temperature at the start and end of the growing season has the main effect on the extent of trees in the forested area across the QTP (Wang et al., 2020). Moreover, global warming brings forward the growth period of forests in nontropical regions of the northern hemisphere, which forces forests to face the water stress or frost risk and suppresses the forest growth in the dry region of Qinghai–Tibet Plateau (Yang et al., 2017). Therefore, the forest cover extraction helps researchers to understand the response of the QTP ecosystems to global change.
In the field of forest information extraction, remote sensing is an accurate and efficient technology to obtain large-scale forest cover mapping. For forest cover extraction in the large-scale region, the various models of support vector machine, decision trees, and random forest (RF) were proposed to serve for the experiments, while the RF algorithm has the balance between the classification accuracy and operation efficiency (Belgiu and Drăguţ, 2016). Since Google Earth Engine (GEE) was designed to make planetary-scale remote sensing analysis feasible, this cloud-based platform for geospatial research provides access to abundant multisource datasets and the capacity to utilize cloud computing resources (Gorelick et al., 2017). According to the packaged machine learning algorithms in the GEE platform, remote sensing applications over a large area, involving large volumes of data, are becoming more prevalent (Rogan et al., 2008). In recent years, there are many types of research implemented to enlarge the forest cover extraction in the GEE platform by the RF algorithm (Long et al., 2019; Zhang et al., 2020; Hu et al., 2021). Chen et al. (2019) developed the first Sentinel-2 10-m resolution global land cover map (FROM-GLC10) in 2017, which is generated by the global training samples from Landsat images. FROM-GLC10 utilized all the spectral bands but the atmospheric bands from Sentinel-2 images and the elevation, slope, and aspect data from the Shuttle Radar Topographic Mission as the source datasets. As the multisource forest cover map, FROM-GLC10 has the benefit of more training features and better distinguishing forests from shrubs or grasslands, compared with the single data source products. However, the parameters of the random forest model for the large-scale forest cover were not discussed in the research. The performance of the random forest model was not fully explored.
As the mapping forest cover over large areas is concerned, some questions are needed to discuss the parameters and features of the classification model in the remote sensing field. As an ensemble classifier producing multiple decision trees, RF has the capacity of handling high-dimensional and multicollinearity data, as well as achieving fast and insensitive to overfitting (Belgiu and Drăguţ, 2016). The trees of the RF are created by drawing a series of training samples through a bagging approach, which denotes that the training samples could be selected randomly from the dataset and construct the variability of trees and stability of RF. The structure of the RF model is defined by the tree number, maximum depth of the tree, minimum sample number to split an internal node, and minimum sample number to be at a leaf node (Breiman, 2001). Since the RF classifier has been applied for land cover, there are still some contents to research about the influence of the classifier parameters and feature importance on the classification results of forest cover extraction in the QTP region. When the sample number becomes enormous and the classification region becomes large-scale, the parameters of RF in the process decide the stability and accuracy of the result. The combination of features from the multisource data influences the balance of precision and efficiency in the RF classifier.
The objective of this article was to quantify and analyze the parameter usage of the RF model in mapping the forest cover in the QTP region and to explore its parameterization and sensitivities to changes in sampling combinations. Section 2 presents the study area and datasets of the Qinghai–Tibet Plateau forest cover extraction experiment. In Section 3, the method of training features and RF classifier generated in the experiment is presented. The results and analysis of forest cover extraction parameters and quantitative comparison in the QTP region are shown in Section 4. Conclusions are presented in Section 5.
The Qinghai–Tibet Plateau (QTP) is located in southwest China and has the largest high altitude area on Earth. The extent of the QTP region is from 73.48° to 105.63° east longitude and 24.65°–40.66° north latitude. As the “Third Pole of the Earth” after the Antarctic and Arctic, the QTP has the greatest variety in climate types, biological species, and ecological types in the world (Fu et al., 2010; Gao et al., 2016). The main mountain range in the QTP shows the tendency of extending from east to west, while the terrain is high in the northwest and low in the southeast. Since the winter season is affected by the high-altitude west wind, and the summer season is affected by the south humid airflow, the QTP has formed regional differences between the humid climate in the southeast and the arid climate in the northwest. In addition, the northwest is adjacent to the central Asian desert, and there is little precipitation from the north. The abovementioned topographic pattern and atmospheric circulation characteristics constitute the difference in the geographical combination of temperature and moisture conditions on the plateau, showing a general trend of a gradual change from a warm and humid climate in the southeast region to the cold and arid climate in the northwest region. In the distribution of the vegetation ecosystem, it is shown as the incremental change of forest, meadow, grassland, and desert, which distributes roughly from east to west in latitude. The study area is shown in Figure 1. The forest examples in the eastern, southern, and northern regions of the QTP are presented in Figure 2.
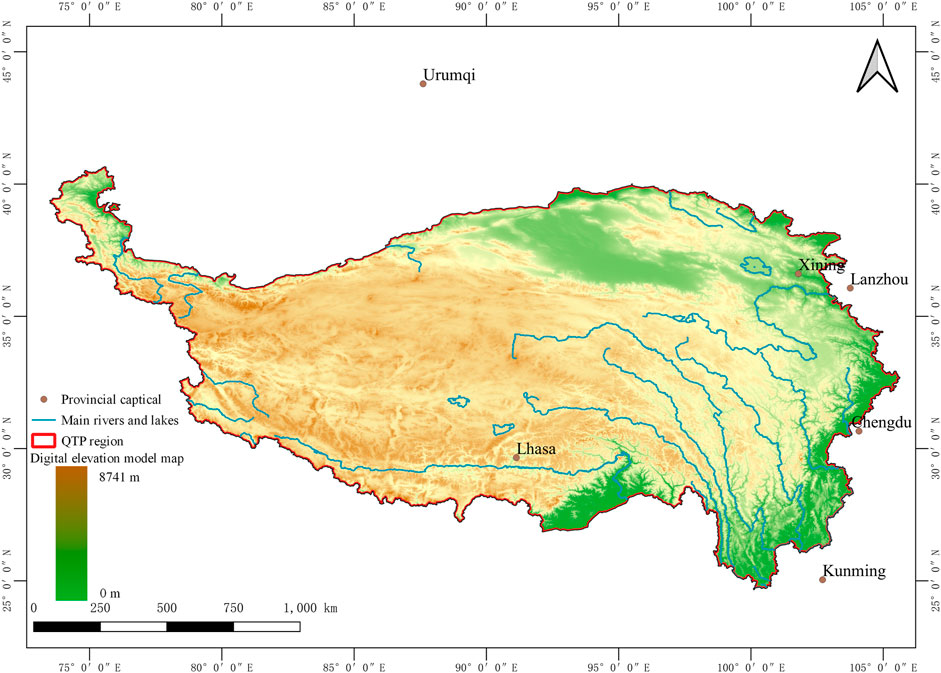
FIGURE 1. Information on the elevation and main rivers in the QTP region.
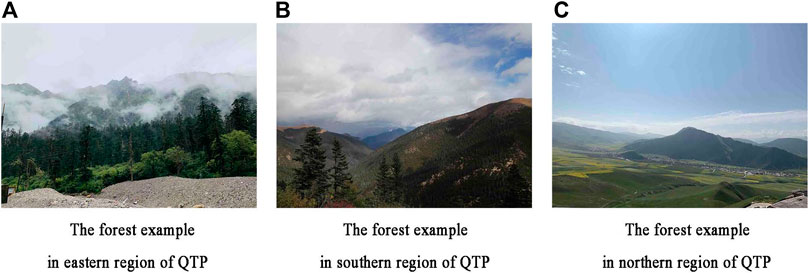
FIGURE 2. (A–C) Forest examples in the eastern, southern, and northern regions of QTP.
The Google Earth Engine platform provides the Sentinel series dataset after terrain correction and radiometric correction. The annual time-series dataset of Sentinel surface reflectance was used to obtain the cloud-free pixels for the image mosaic. The Sentinel-2 surface reflectance was acquired from the GEE platform (Gorelick et al., 2017). The Sentinel-2 multi-spectral dataset in the GEE platform provides wide swath and high-resolution imagery. Due to the flying regulation of the twin satellites in the same orbit and opposite phase, Sentinel-2 has the advantage of obtaining a revisit frequency of 5 days. The Sentinel-2 dataset has 13 spectral bands which include four bands at 10 m, six bands at 20 m, and three bands at 60 m spatial resolution. The Sentinel-2 dataset provides abundant imagery of high temporal and spatial resolution, which ensures the most cloud-free mosaic and appropriate selection for forest phenological time. The Sentinel-1 synthetic radar datasets (SAR) and Sentinel-2 multispectral instrument (MSI) datasets were selected to mosaic the remote sensing image for classifying training and forest cover mapping. The Sentinel-1 SAR ground range-detected (GRD) dataset in the GEE platform provides the ability of dual polarization detection, high temporal resolution, and rapid product delivery. The Synthetic radar dataset has the advantage of operating at wavelengths detecting information of clouds or shadow regions and the cloud acquires ground data during day or nighttime under all weather conditions. The Sentinel-1 dataset contains C-band imagery operating in four exclusive imaging modes with three resolutions, four scene polarization combinations, and three instrument modes. Therefore, the Sentinel-1 dataset could extract trees under clouds existing in the multispectral dataset.
The previous studies presented that the elevation and warmth have a considerable influence on the distribution and growth of trees (Acharya et al., 2011; Gao et al., 2017). For example, population that declines in the low-elevation forest were more impressionable than the high-elevation forest by the warming-driven declines (Conlisk et al., 2017). Hence, a digital elevation model (DEM) was applied to add the information on gorges, mountains, and hills for forest classification in the plateau. In the study, we chose the Shuttle Radar Topography Mission (SRTM) dataset (Farr et al., 2007) as the DEM on the QTP. The SRTM dataset is a global topographic dataset at a resolution of 30 m provided by the NASA Jet Propulsion Laboratory.
To remove the opaque and cirrus clouds pixels in the dataset, the QA60 band of Sentinel-2 multispectral surface reflectance was used to mask most clouds and cloud shadows. In addition, the cloud-like pixels, which are close to bright white in visible bands, are removed to ensure that the dataset is cloud-free. Then, the images of the dataset from April to September were selected to ensure the growth state of the forest present in the mosaic map. The mosaic QTP multispectral image was produced by the median value of the filtered dataset. In the mosaic multispectral image, there was some empty area lacking cloud-free values in the filter condition. Thus, the median value of the full-time annual multispectral dataset was filtered by the QA60 band to mask clouds and fill up the empty area. This method finally produced a mosaic map, which chose the growth state of the forest presented in the map.
The accuracy of the classification model is influenced by the reliability and diversity of training data in the samples. In the classification process, the key to forest cover extraction research is how to identify forests from the features which have similar spectral information, such as shrubland, grassland, or farmland. In addition, the extraction of forest cover in the mountain shadow is an influencing factor of accuracy. To address the problems, 33 types of features were generated from the Sentinel-1 SAR, Sentinel-2 MSI, and SRTM datasets. For multispectral indices, we selected the normalized difference vegetation index (NDVI), soil-adjusted vegetation index (SAVI), normalized difference moisture index (NDMI), normalized difference water index (NDWI), and global environmental monitoring index (GEMI). For the synthetic aperture radar, we selected the origin value, median value, mean value, and standard deviation of interferometric wide (IW) swath different polarization datasets. For the digital elevation model, we selected the topographic slope and aspect of SRTM as the DEM indexes. In addition, the 10 spectral bands of Sentinel-2 surface reflectance are selected in this research. The spatial resolution of Sentinel-1 is 10 m, while spatial resolution of Sentinel-2 is 10 and 20 m, and the spatial resolution of SRTM is 30 m. The different metrics of the multisource datasets are interpolated to the spatial resolution of 10 m. The revisit times of Sentinel satellites are six and five days, respectively. The median value pixels of different satellites were selected to mosaic the training feature dataset. The major information of the multiple features selected in Sentinel-1, Sentinel-2, and SRTM is listed in Table 1. The flowchart of multiple features dataset generation is shown in Figure 3.
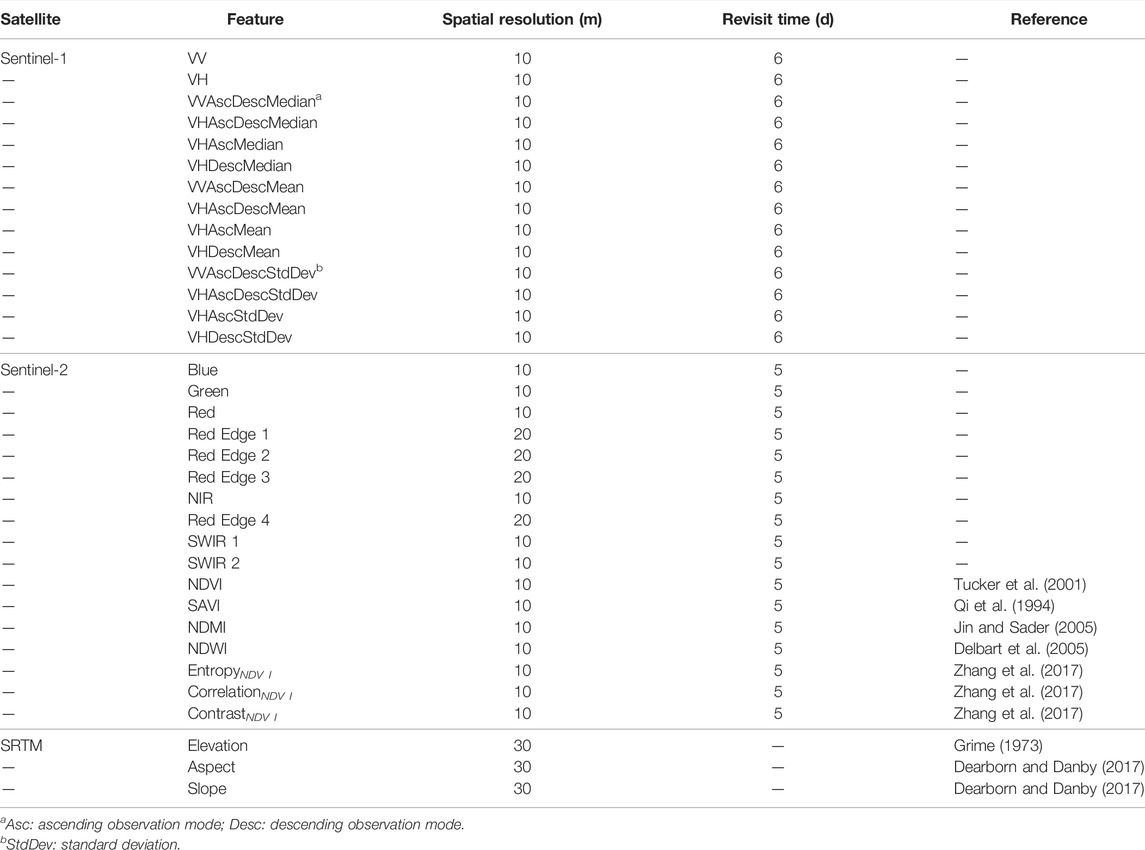
TABLE 1. Major information of multifeatures selected in Sentinel-1, Sentinel-2, and Shuttle Radar Topography Mission (SRTM).

FIGURE 3. Flowchart of multiple feature dataset generation.
1) NDVI
NDVI is a usable index showing the relation of photosynthetic activity and growing season length at the high northern latitude (Tucker et al., 2001). NDVI is calculated by Eq. 1.
where ρNIR and ρRed denote the surface reflectance of near-infrared (NIR) and red bands, respectively.
2) SAVI
Aiming to reduce the influence of soil on canopy spectra, SAVI was created by utilizing the soil adjustment factor L to adjust the NDVI equation (Qi et al., 1994). SAVI is calculated by Eq. 2.
where L represents the amount of green vegetative cover and is defined as 0.5 in the areas with the moderate green vegetation cover.
3) NDMI
NDMI has stable performance in the accuracy of detecting hardwood and softwood forest disturbance (Jin and Sader, 2005). NDMI is calculated by Eq. 3.
where ρSWIR1 is the shortwave infrared (SWIR) 1 band.
4) NDWI
NDWI is an effective index for detecting plant phenology and characterizing the vegetation type in the temperate region (Boles et al., 2004; Delbart et al., 2005). The advantage of NDWI offers it the ability to better obtain the phenological data assessment of vegetation growth than NDVI. Hence, NDWI is selected to assist the forest cover extraction and calculated by Eq. 4.
where ρGreen is the green band.
As dual-polarization SAR satellite data, Sentinel-1 GRD product records backscattering coefficients (VV and VH) and is sensitive to the coniferous and deciduous trees (Rüetschi et al., 2017). Sentinel-1 GRD data have a better detecting ability for bare soils and artificial surfaces due to its different reactions on the surface of these two land cover classes. In addition, the features of SAR data are relevant to vegetation during the leaf-off period, which is attributed to the sensitivity of SAR sensors to the internal structure of elements (Mercier et al., 2019). In the study, the mean, median, and standard deviation values of the annual Sentinel-1 GRD backscattering coefficient products were generated to present the land cover features in the annual range.
In the alpine regions, the richness of forest reaches the highest at mid-elevations and declines at high elevations (Grime, 1973). As far as the aspect is concerned, warmer soil temperatures and deeper active layer in the south-facing slopes have more species compared to the north-facing slopes, while the aspect of north-facing slopes influences on the forest species (Dearborn and Danby, 2017).
The gray level co-occurrence matrix (GLCM) channel is an appropriate and credible method for multispectral imagery to extract the textures of spectral information (Clausi, 2001; Huang et al., 2014). The GLCM is widely applied in the imagery texture analyses and has obtained better results than other texture discrimination methods (Rao et al., 2013; Wang et al., 2015). In the GLCM matrix, the element (i, j) locates in the (i, j) position and expresses the probability of the distance and orientation for the other pixels with gray levels i and j. It presents the quantitative spatial connections of a pixel in an image with the neighbor pixels and describes a square matrix whose scale is equal to the largest grayscale in the image (Fu et al., 2010). Although GLCM can reflect some indexes to an extent, there is still an obstacle to utilizing directly the GLCM as a quantitative measurement of texture (Wang et al., 2015). Instead, the second-order statistical texture features, which are generated by the GLCM, could extract various texture information of the image. The second-order statistical texture features used in the article are entropy, correlation, and contrast of NDVI index, and their respective equations are determined by the GLCM images.
Entropy (ENT) is a measure of image indeterminacy and reflects the degree of disorder in an image. The ENT value of an arable land is larger than that of forest land, so the entropy index presents a dependable ability to separate the forest and arable land (Zhang et al., 2017). The entropy index is calculated by Eqs (5) and (6).
where f(i,j) represents a 2D gray-scale image, g1 and g2 denote the two gray values in the image, while #S is the total amount of two pixels containing a certain spatial relationship within a specified distance. P is defined as the square matrix, and its value shows the probability of the spatial location relationship of the set of pixels (Zhang et al., 2017).
Correlation (COR) presents the horizontal or vertical texture similarity of two pixels in the image, and the value of correlation enlarges as the texture distribution exists in a certain direction. In forest land, the COR value is a bit larger than that of farmland (Zhang et al., 2017). The correlation is calculated by Eqs 7–11.
Contrast (CON) denotes the depth and the smoothness of an image within a certain range, and the stripe pattern makes the contrast value of farmland greater than that of the forest land. The contrast is calculated by Eq. 12.
A multiple features method based on RF classification was used to extract the forest cover for the QTP. The technical flowchart of the extraction method and validation process is shown in Figure 4.
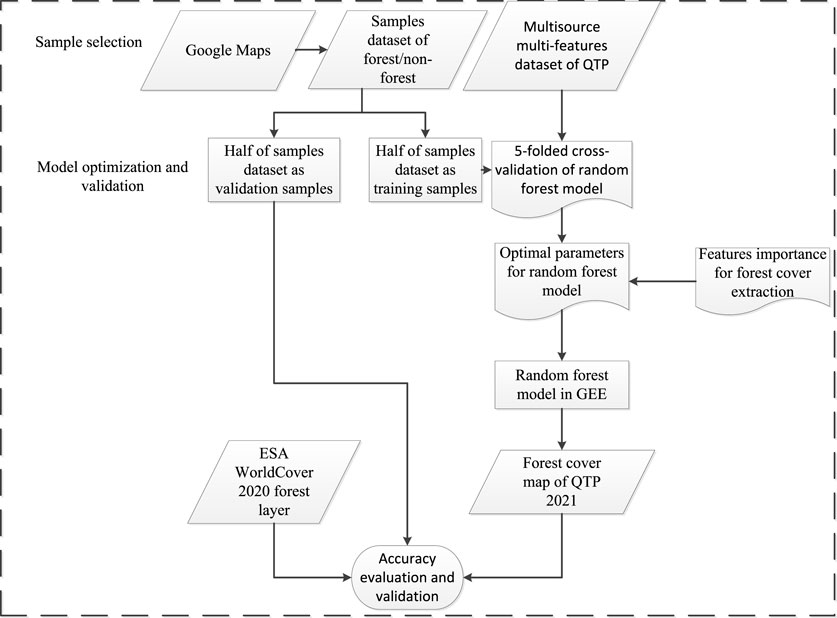
FIGURE 4. Technical flowchart of the classification and validation process.
In the region of the Qinghai–Tibet Plateau, 14,919 sample points were generated randomly with a distance larger than 1 km. To label the samples by the forest and nonforest types, the sample points are labeled based on the high-resolution satellite image on the Google Map and expert knowledge. In the sample dataset, there are 1,716 forest samples and 13,203 nonforest samples. To ensure uniform distribution of samples, the forest and non-forest samples are randomly divided into training and validation datasets, respectively. Facing the imbalance class dataset, the RF classifier has a stable capacity to control the classification error and sample quantity imbalance (O’Brien and Ishwaran, 2019). The location of samples in the QTP is shown in Figure 5, and the amount of samples is shown in Table 2.
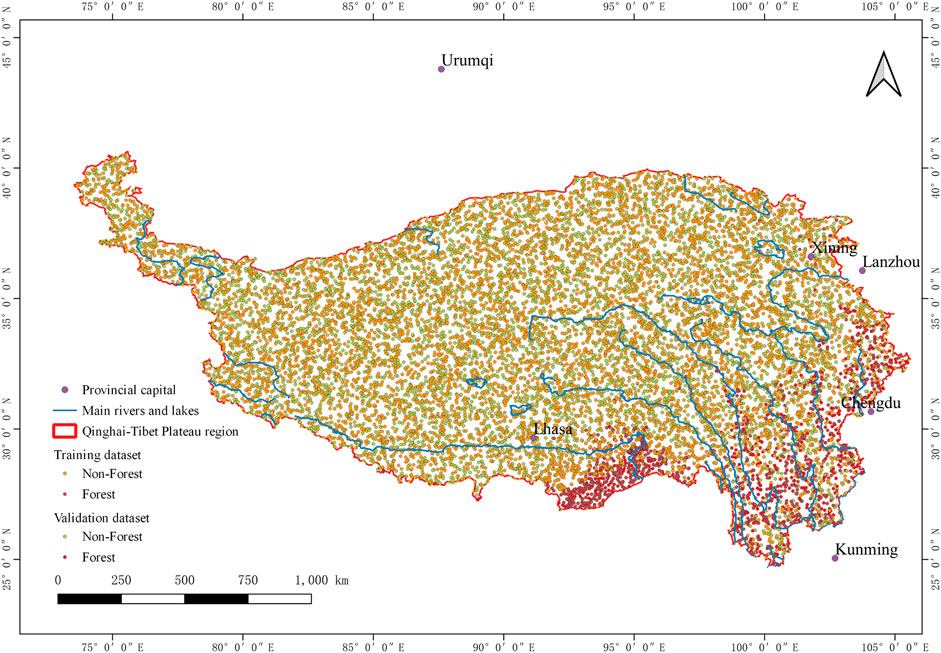
FIGURE 5. Location of samples in the QTP.
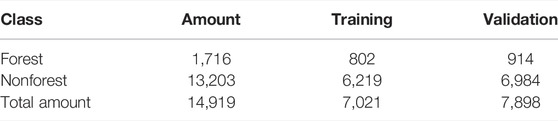
TABLE 2. Amount and class of samples selected in the QTP region.
In the previous studies, the parameter setting of models to map land cover over large areas was a critical work for the algorithm. When the mapping of forest cover over large areas is discussed, there are three challenges to the accuracy of models required to address: 1) to evaluate the parameters with the highest accuracy; 2) to select the best features set used as the input data; and 3) to establish the classifier accuracy over large areas (Belgiu and Drăguţ, 2016). As proposed by Breiman (Breiman, 2001), RF has demonstrated its ability to yield accurate land cover maps with abundant input features (Belgiu and Drăguţ, 2016). RF classifier is an ensemble model created by multiple decision trees and trained by the subset of training sample and variables selected randomly by the trees of RF.
In the theory of the RF model, the maximum depth of trees (MDT), minimum number of samples to split an internal node (MSP), and minimum number of samples to be a leaf node (MSL) mainly determine the classification result. Among the three parameters, the MSL is less correlated with the MSP; therefore, we only adjusted the number of MDT and MSP while keeping MSL as 1 (without any constraint). To obtain the stable results of RF in different parameters, the 5-folded cross-validation technique is applied. In the process of 5-folded cross-validation, the four-fifths of samples dataset were selected randomly and nonrepeatedly to train the RF model, and the remaining fifth validate the overall accuracy of the model. During the test of every set parameter, 10 times 5-folded cross-validation was implemented to get the average value of overall accuracy and standard deviation. In addition, the feature importance of the whole sample dataset was computed to present the reduction created by the feature for the model. In the training process, all the features were selected randomly and nonrepeatedly to act as the split feature combination, and the feature importance was evaluated by the out-of-bag error (OOB) to compute the contribution of the feature to every tree in the RF. The feature importance presents the average impurity decreased by each feature over all the trees in the random forest model, when the features for internal nodes of trees are selected with gini impurity or information gain.
In this article, the RF algorithm provided by the GEE platform was applied to train the classifier and extract the forest cover. The sample dataset is separated randomly from the training dataset with 7,021 samples and the validation dataset with 7,898 samples. The training dataset with 33 features for the mosaic remote sensing imagery is chosen to train the RF model in the GEE platform. In addition, the optimal parameters for the RF model were set by the combination of the best accuracy and standard deviation. In order to validate the accuracy of the forest cover map, the forest cover extraction generated by RF was validated by the validation samples and compared with European Space Agency (ESA) WorldCover map by the validation samples. The results are compared quantitatively by overall accuracy (OA), Kappa coefficient Khat, user accuracy (UA), and producer accuracy (PA), and their equations are listed in Eqs 13)–(16.
where r represents the class types, N represents the number of whole samples, xii represents the number of correctly classified samples, and xi+ and x+i represent the numbers of samples in row i and column i of the confusion matrix, respectively. In this experiment, xii contains the number of forest and nonforest samples classified correctly as their corresponding class. PA is the probability that forest or nonforest samples on the ground are classified as such; UA is the probability that the classified forest or nonforest samples are present on the ground.
In the process of forest cover mapping over large areas, the overall accuracy of the RF model is affected by parameters, such as the MDT, MSP, and MSL. As far as the RF is concerned, the maximum depth determines the maximum depth of the tree in the RF and it is necessary to limit the number of maximum depth when the samples amount and feature number are abundant. The minimum samples split demonstrates the minimum sample number to split an internal node, and the minimum samples leaf decides the minimum samples number to be a leaf node. Through the 10 times 5-folded cross-validation of 14,919 samples with 33 features, the RF was composed of various combinations of maximum depth and minimum samples split, and their average value of overall accuracy and standard deviation are presented in Figure 6.
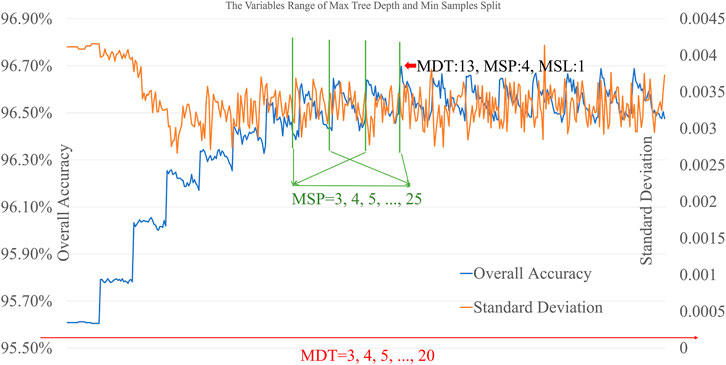
FIGURE 6. Average accuracy and standard deviation for the variable range of maximum depth and minimum sample split. The range of MDT, MSP, and MSL are set from 3 to 20, 3 to 25, and 1, respectively.
The number of minimum samples to be a leaf (MSL) is less than the number of minimum samples to split an internal node (MSP), so the MSL set to 1 means that there is no limitation for the MSP. When controlling the variable of MSL to one, the two variables of the maximum depth of trees (MDT) and MSL are tested according to the accuracy and standard deviation of the RF. As the MDT increases from three to 20 and MSP increases from three to 25, the accuracy has experienced a gradual steady trend after rising and the standard deviation has experienced a gradual steady trend after decreasing, when the MDT arrived at the value of 10. After the value, the accuracy and standard deviation had dynamic stability between the interval section. When the maximum depth and minimum samples split were selected to be 13 and 4, respectively, the average accuracy is achieved at 96.698% and the standard deviation achieved at 0.00319, which was the best result of the whole results. Therefore, the three variables of maximum depth 13, minimum samples split 4, and minimum samples leaf 1 were set as the final parameters of RF in the forest cover mapping process.
After the parameter testing process, the feature importance was computed as the total reduction of the criterion brought by that feature. The feature importance demonstrated the total decrease in the node of tree impurity and was averaged over all trees of the ensemble (Menze et al., 2009). In the features importance ranking, the red edge 1 band, red band, short-wave infrared red band, NDVI, elevation, green band, and SAVI demonstrated significant importance in the rank, which have relevant to spectral and growth characteristics of the forest. When 11 features were removed in the RF, the standard deviation of the classification result increased evidently to 0.004. When 28 features were removed from the classifier, the average precision of the classification result decreased evidently below 96%. The 30 features of the importance rank were selected for the classification. The relation between the features and feature importance is shown in Figure 7, and the accuracy and standard deviation curve after feature removal are shown in Figure 8.
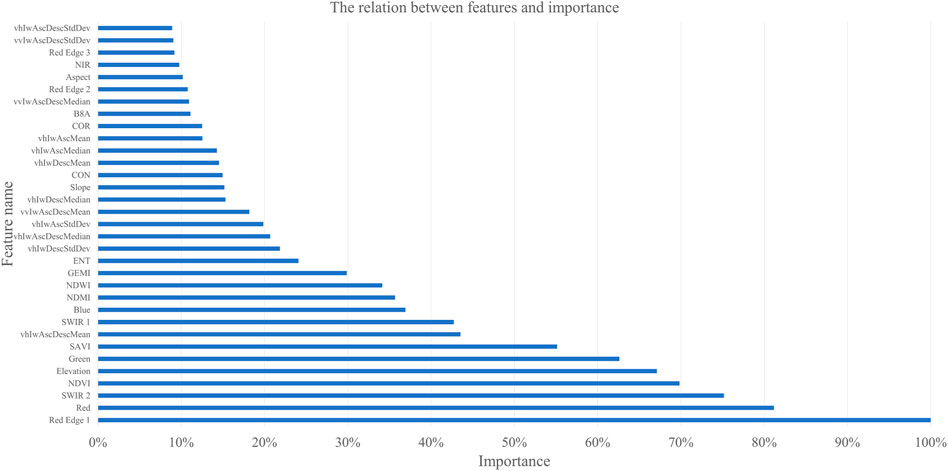
FIGURE 7. Relation between features and feature importance. The feature importance is listed by the Red Edge 1 set as 100%.
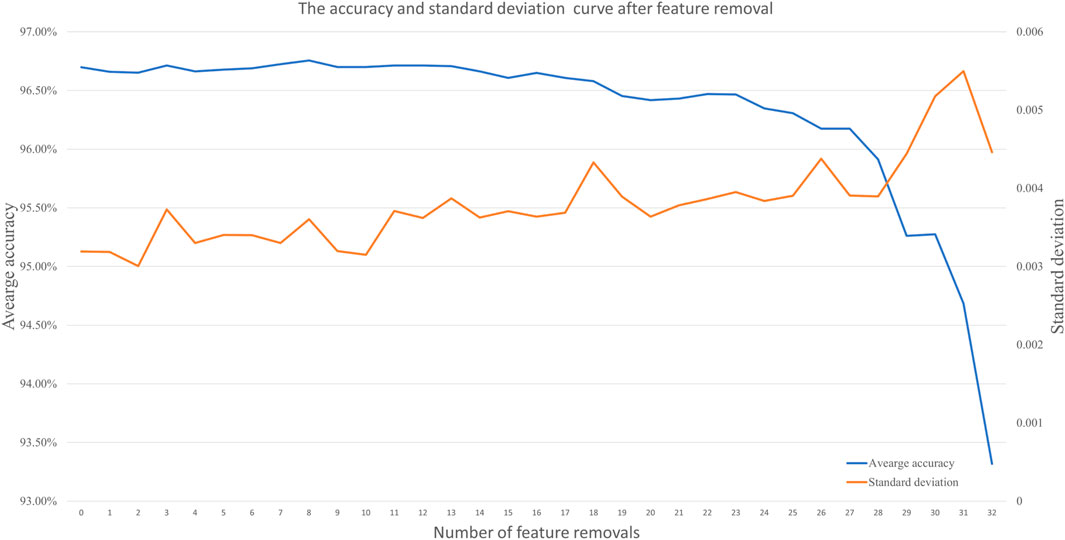
FIGURE 8. Accuracy and standard deviation curve after feature removal. The features are removed by the importance from low to high.
According to the parameters and features selected by the accuracy evaluation and features importance analysis, the forest cover classification result for the year 2021 in the QTP region was generated by the optimal RF model in the GEE platform. Limited by the computation ability in the GEE platform, the training dataset of 7,021 samples was selected randomly to adapt to the computing power. The out-of-bag error (OOB) estimate index of the classification is 0.033, and the Kappa coefficient is 0.99936.
As the famous land cover mapping result generated by Sentinel series satellites, the European Space Agency (ESA) WorldCover 2020 product (Zanaga et al., 2021) is based on the Sentinel-1 C-band SAR GRD data and Sentinel-2 multi-spectral L2A surface reflectance image data. The classifier of the ESA WorldCover product was trained by different models of scenarios with a gradient boosting decision tree algorithm (CatBoost) (Prokhorenkova et al., 2018). In this study, the forest cover layer of the ESA WorldCover 2020 product was selected as the comparison map to evaluate the accuracy of the RF forest cover map. As there is a low-frequency forest cover change, the time difference between the ESA WorldCover 2020 forest layer and the RF forest cover map is ignored in the section.
Since the ESA WorldCover 2020 product contains other types of layers which are nonforest, these layers are classified as the nonforest type in the comparison section to facilitate the calculation of forest extraction in the overall accuracy and Kappa coefficient. In the quantitative evaluation, the RF forest cover map has less forest and nonforest commission and omission error in the validation samples than the ESA forest cover layer. For the forest class extraction, the forest cover map generated by RF has a user accuracy of 97.0%, which is better than that of the ESA WorldCover 2020 forest layer at 85.4%. The confusion matrix of those classifications is shown in Table 3 and Table 4. The forest cover map for the QTP year 2021 is shown in Figure 9, and the forest cover map for the ESA year 2020 is shown in Figure 10.
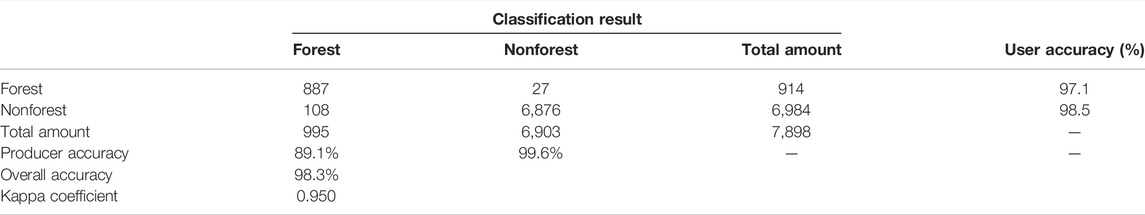
TABLE 3. Confusion matrix of the RF forest cover map.
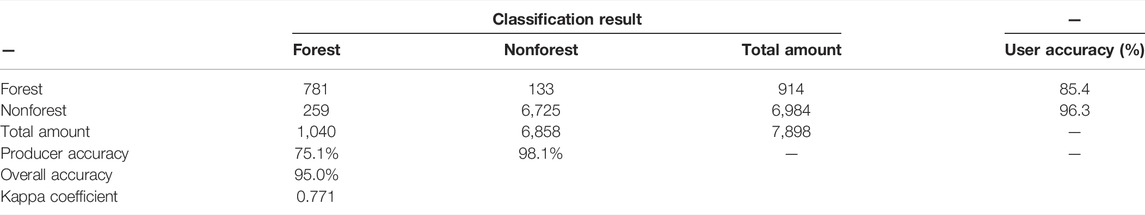
TABLE 4. Confusion matrix of the ESA WorldCover 2020 Forest layer.
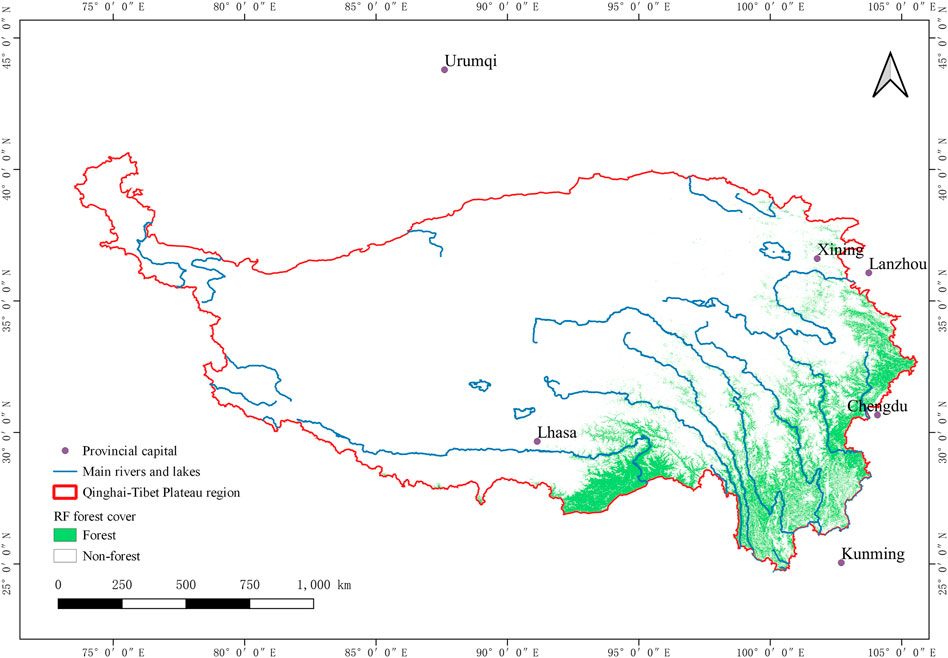
FIGURE 9. Forest cover map for the QTP year 2021.
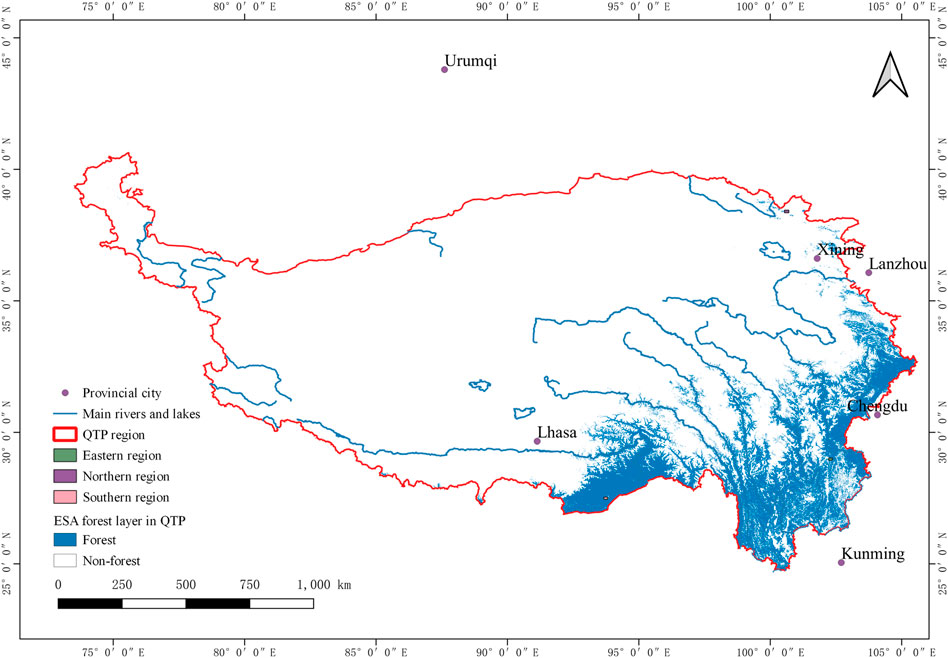
FIGURE 10. Forest layer of ESA WorldCover 2020.
In the forest cover extraction of the Qinghai–Tibet Plateau, the background context of the forest is complex, and the phenology phase of the forest is different. This situation makes it necessary to compare the forest cover extraction in different regions of the Qinghai–Tibet Plateau. In the section, the ground truth, ESA WorldCover, and RF forest cover of the eastern, southern, and northern regions in the QTP are presented in Figure 11.
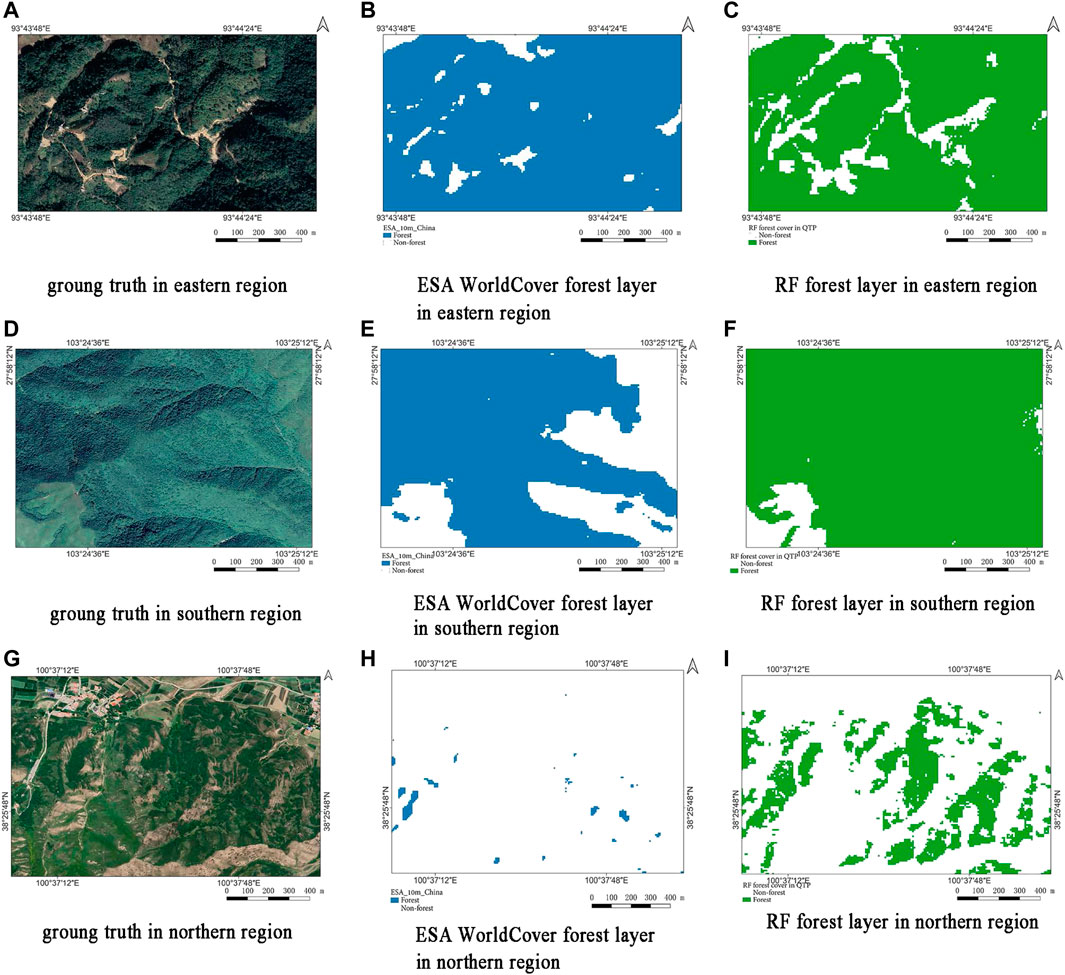
FIGURE 11. Comparison of the ground truth (Google Earth), (B,E,H) ESA WorldCover forest layer, and RF forest layer in the eastern (A,C), southern (D,F), and northern (G,I) regions of the QTP.
In the eastern region of the QTP (a-c), the nonforest cover is well-extracted in the RF WorldCover forest layer, while the ESA forest cover identified some roads and shrubland as forest. In the southern region of the QTP (d-f), the forest cover in the mountain sunny side is better extracted in the RF forest cover result than the ESA WorldCover Forest layer. When the forest type on the dark side and sunny side of the mountain is the same, the ESA WorldCover forest layer loses the forest extraction on the sunny side and the RF model performs the whole forest extraction on the sunny side. This difference is related to the aspect and slope features of the digital elevation model in the RF model. In the northern region of the QTP (g-i), the forest cover near the striped fields of farmland is extracted failed in the ESA WorldCover Forest layer, while the RF forest cover result performs better. The performance has relation to the gray-level correlation matrix features of the RF model, such as entropy and correlation.
The image mosaic in the plateau region is challenging for large-scale forest extraction because of the dense cloud cover and appropriate growing time phase filter. To avoid the cloud cover in the southern Tibet region during the growing time phase, this research selected the nongrowing time phase cloud-free images to fill the map generated primarily from cloud-free images. In the southern Tibet region, the nongrowing season from October to March is characterized by dryness and little rainfall, and the forest during this period remains evergreen. Hence, the forest of the southern Tibetan valley is presented in the images during the rainy growing time phase.
The parameters of the classifier model influence the accuracy and error of multifeature forest extraction in large-scale complex geomorphic areas. The values of maximum depth of trees, minimum samples to split an internal node, and minimum samples to be a leaf are the major parameters of the random forest classifier. As the MDT increased, the accuracy of random forest achieved stability increased. As the MSP increased in the invariant section of MDT, the accuracy of the classifier achieved a trend of first increasing and then decreasing. Because the value of MSL is less than that of MSP, the MSL has a relation to MSP and does not need to be tested. In the test process of MDT and MSP, the accuracy and error have the best results of 96.698% and 0.00319, when the MDT and MSP are selected as 13 and 4, respectively.
As the multisource datasets in the multispectral, synthetic aperture radar, and digital elevation model are imported, the extraction result of the classifier depends on the combination of multifeatures. According to the 5-folded cross-validation, the red edge 1 band, red band, short-wave infrared red band, NDVI, elevation, green band, and SAVI demonstrated importance exceeding 50% of the paramount importance. In addition, 30 features in the importance rank are composed of the best combination of random forest classifiers in the forest cover extraction, when the accuracy and error would not be affected by the combination.
The spectral signature of forest in the mountainous regions depends on the orientation of the surface slope (Proy et al., 1989), and the canopy structural parameters influence the reflectance distribution function of the flat and sloped forest (Wen et al., 2018). The spectral reflectance of the forest cover in the sunny side of the composite slope has a relation with the slope and aspect. The forest cover map of the RF model has the ability of extracting the forest in the sunny side of the mountain with the assistance of the slope and aspect, while the ESA WorldCover Forest layer missed the forest in the sunny side with the absence of aspect. In addition, the training samples in the different aspects of the rugged terrain are included in the classification training dataset.
The current method in this research has a contribution of the forest cover extraction in the different types of terrain but do not extract forest types and attributes, which will be our further study.
In this article, an automated pipeline for generating an annual forest cover map of the Qinghai–Tibet Plateau (QTP) based on a random forest (RF) algorithm on the Google Earth Engine (GEE) platform was proposed. This method took advantage of all the available Sentinel series images to create a cloud-free mosaic image in the QTP region and produced a novel 10-m resolution annual forest cover map for 2021. A method to optimize the parameters and training features of the RF model was created in the study. This method would refine the application of parameters and multifeatures in the RF model. Through the experiment, the optimal parameters for the RF model in forest cover extraction of the QTP region were selected, while the maximum depth of the tree, the minimum sample number to split an internal node, and the minimum sample number to be a leaf were selected as 13, 4, and 1, respectively. For the features trained in the model, there were seven features with the importance exceeding 50%, and they were red edge 1, red, short wavelength infrared band 2, the normalized difference vegetation index, elevation, and green and soil-adjusted vegetation index. The overall accuracy and Kappa coefficient of the forest cover mapping generated by the optimal random forest in the GEE platform were 98.291 and 0.94958, respectively.
The training and validation samples datasets for Qinghai-Tibet Plateau Forest Cover Map 2021 are available on DOI: https://doi.org/10.5281/zenodo.6342708. And the Qinghai-Tibet Plateau Forest Cover Map 2021 is available on DOI: https://doi.org/10.5281/zenodo.6551883.
Conceptualization, YG, WJ, and TL; methodology, YG, WJ, TL, and XZ; validation, YG and TL; formal analysis, YG, WJ, and TL; writing—original draft preparation, YG; writing—review and editing, YG, WJ, and TL; visualization, YG and TL; supervision, WJ and TL; funding acquisition, WJ, TL, and XZ. All authors have read and agreed to the published version of the manuscript.
This research was funded by the Second Tibetan Plateau Scientific Expedition and Research Program (STEP) (2019QZKK0307), the program of the National Natural Science Foundation of China (61731022 and 62101531), the National Key Research and Development Programs of China (2016YFA0600302), and the Strategic Priority Research Program of the Chinese Academy of Sciences (XDA19090300).
The authors declare that the research was conducted in the absence of any commercial or financial relationships that could be construed as a potential conflict of interest.
All claims expressed in this article are solely those of the authors and do not necessarily represent those of their affiliated organizations, or those of the publisher, the editors, and the reviewers. Any product that may be evaluated in this article, or claim that may be made by its manufacturer, is not guaranteed or endorsed by the publisher.
We thank the Google Earth Engine platform and developers for their support. We also thank the journal editors and reviewers for their comments and efforts on this article.
Acharya, B. K., Chettri, B., and Vijayan, L. (2011). Distribution Pattern of Trees along an Elevation Gradient of Eastern Himalaya, india. Acta Oecol. 37, 329–336. doi:10.1016/j.actao.2011.03.005
Belgiu, M., and Drăguţ, L. (2016). Random Forest in Remote Sensing: A Review of Applications and Future Directions. ISPRS J. photogrammetry remote Sens. 114, 24–31. doi:10.1016/j.isprsjprs.2016.01.011
Boles, S. H., Xiao, X., Liu, J., Zhang, Q., Munkhtuya, S., Chen, S., et al. (2004). Land Cover Characterization of Temperate East Asia Using Multi-Temporal Vegetation Sensor Data. Remote Sens. Environ. 90, 477–489. doi:10.1016/j.rse.2004.01.016
Chen, B., Xu, B., Zhu, Z., Yuan, C., Suen, H. P., Guo, J., et al. (2019). Stable Classification with Limited Sample: Transferring a 30-m Resolution Sample Set Collected in 2015 to Mapping 10-m Resolution Global Land Cover in 2017. Sci. Bull. 64, 370–373.
Chen, B., Zhang, X., Tao, J., Wu, J., Wang, J., Shi, P., et al. (2014). The Impact of Climate Change and Anthropogenic Activities on Alpine Grassland over the Qinghai-Tibet Plateau. Agric. For. Meteorology 189-190, 11–18. doi:10.1016/j.agrformet.2014.01.002
Clausi, D. A. (2001). Comparison and Fusion of Co‐occurrence, Gabor and MRF Texture Features for Classification of SAR Sea‐ice Imagery. Atmosphere-ocean 39, 183–194. doi:10.1080/07055900.2001.9649675
Conlisk, E., Castanha, C., Germino, M. J., Veblen, T. T., Smith, J. M., and Kueppers, L. M. (2017). Declines in Low‐elevation Subalpine Tree Populations Outpace Growth in High‐elevation Populations with Warming. J. Ecol. 105, 1347–1357. doi:10.1111/1365-2745.12750
Dearborn, K. D., and Danby, R. K. (2017). Aspect and Slope Influence Plant Community Composition More Than Elevation across Forest-Tundra Ecotones in Subarctic Canada. J. Veg. Sci. 28, 595–604. doi:10.1111/jvs.12521
Delbart, N., Kergoat, L., Le Toan, T., Lhermitte, J., and Picard, G. (2005). Determination of Phenological Dates in Boreal Regions Using Normalized Difference Water Index. Remote Sens. Environ. 97, 26–38. doi:10.1016/j.rse.2005.03.011
Fang, J., Chen, A., Peng, C., Zhao, S., and Ci, L. (2001). Changes in Forest Biomass Carbon Storage in china between 1949 and 1998. Science 292, 2320–2322. doi:10.1126/science.1058629
Farr, T. G., Rosen, P. A., Caro, E., Crippen, R., Duren, R., Hensley, S., et al. (2007). The Shuttle Radar Topography Mission. Rev. Geophys. 45. doi:10.1029/2005rg000183
Fu, Y., Zhang, G., Li, F., and Liu, B. (2010). Countermeasures for Qinghai–Tibet Plateau to Cope with Climate Change and Ecological Environment Safety. Agric. Sci. Tech. 11, 140–146.
Gao, L., Gou, X., Deng, Y., Yang, M., and Zhang, F. (2017). Assessing the Influences of Tree Species, Elevation and Climate on Tree-Ring Growth in the Qilian Mountains of Northwest china. Trees 31, 393–404. doi:10.1007/s00468-015-1294-0
Gao, Q., Guo, Y., Xu, H., Ganjurjav, H., Li, Y., Wan, Y., et al. (2016). Climate Change and its Impacts on Vegetation Distribution and Net Primary Productivity of the Alpine Ecosystem in the Qinghai-Tibetan Plateau. Sci. total Environ. 554-555, 34–41. doi:10.1016/j.scitotenv.2016.02.131
Gao, S., Liang, E., Liu, R., Babst, F., Camarero, J. J., Fu, Y. H., et al. (2022). An Earlier Start of the Thermal Growing Season Enhances Tree Growth in Cold Humid Areas but Not in Dry Areas. Nat. Ecol. Evol. 6, 397–404. doi:10.1038/s41559-022-01668-4
Gorelick, N., Hancher, M., Dixon, M., Ilyushchenko, S., Thau, D., and Moore, R. (2017). Google Earth Engine: Planetary-Scale Geospatial Analysis for Everyone. Remote Sens. Environ. 202, 18–27. doi:10.1016/j.rse.2017.06.031
Grime, J. P. (1973). Competitive Exclusion in Herbaceous Vegetation. Nature 242, 344–347. doi:10.1038/242344a0
Hu, X., Zhang, P., Zhang, Q., and Wang, J. (2021). Improving Wetland Cover Classification Using Artificial Neural Networks with Ensemble Techniques. GIScience Remote Sens. 58, 603–623. doi:10.1080/15481603.2021.1932126
Huang, X., Liu, X., and Zhang, L. (2014). A Multichannel Gray Level Co-occurrence Matrix for Multi/hyperspectral Image Texture Representation. Remote Sens. 6, 8424–8445. doi:10.3390/rs6098424
Jin, S., and Sader, S. A. (2005). Comparison of Time Series Tasseled Cap Wetness and the Normalized Difference Moisture Index in Detecting Forest Disturbances. Remote Sens. Environ. 94, 364–372. doi:10.1016/j.rse.2004.10.012
Li, Y., Liu, Y., Bohrer, G., Cai, Y., Wilson, A., Hu, T., et al. (2022). Impacts of Forest Loss on Local Climate across the Conterminous united states: Evidence from Satellite Time-Series Observations. Sci. Total Environ. 802, 149651. doi:10.1016/j.scitotenv.2021.149651
Liu, S., Cheng, F., Dong, S., Zhao, H., Hou, X., and Wu, X. (2017). Spatiotemporal Dynamics of Grassland Aboveground Biomass on the Qinghai-Tibet Plateau Based on Validated Modis Ndvi. Sci. Rep. 7, 4182. doi:10.1038/s41598-017-04038-4
Long, T., Zhang, Z., He, G., Jiao, W., Tang, C., Wu, B., et al. (2019). 30 M Resolution Global Annual Burned Area Mapping Based on Landsat Images and Google Earth Engine. Remote Sens. 11, 489. doi:10.3390/rs11050489
Menze, B. H., Kelm, B. M., Masuch, R., Himmelreich, U., Bachert, P., Petrich, W., et al. (2009). A Comparison of Random Forest and its Gini Importance with Standard Chemometric Methods for the Feature Selection and Classification of Spectral Data. BMC Bioinforma. 10, 213–216. doi:10.1186/1471-2105-10-213
Mercier, A., Betbeder, J., Rumiano, F., Baudry, J., Gond, V., Blanc, L., et al. (2019). Evaluation of Sentinel-1 and 2 Time Series for Land Cover Classification of Forest-Agriculture Mosaics in Temperate and Tropical Landscapes. Remote Sens. 11, 979. doi:10.3390/rs11080979
Mo, S., Zhang, B., Cheng, W., Tan, Y., Xiao, F., and Wu, H. (2004). Major Environmental Effects of the Tibetan Plateau. Prog. Geogr. 23, 88–96.
O’Brien, R., and Ishwaran, H. (2019). A Random Forests Quantile Classifier for Class Imbalanced Data. Pattern Recognit. 90, 232–249.
Pickell, P. D., Hermosilla, T., Frazier, R. J., Coops, N. C., and Wulder, M. A. (2016). Forest Recovery Trends Derived from Landsat Time Series for North American Boreal Forests. Int. J. Remote Sens. 37, 138–149. doi:10.1080/2150704x.2015.1126375
Prokhorenkova, L., Gusev, G., Vorobev, A., Dorogush, A. V., and Gulin, A. (2018). Catboost: Unbiased Boosting with Categorical Features. Adv. neural Inf. Process. Syst. 31.
Proy, C., Tanre, D., and Deschamps, P. (1989). Evaluation of Topographic Effects in Remotely Sensed Data☆. Remote Sens. Environ. 30, 21–32. doi:10.1016/0034-4257(89)90044-8
Qi, J., Chehbouni, A., Huete, A. R., Kerr, Y. H., and Sorooshian, S. (1994). A Modified Soil Adjusted Vegetation Index. Remote Sens. Environ. 48, 119–126. doi:10.1016/0034-4257(94)90134-1
Rao, C. N., Sastry, S. S., Mallika, K., Tiong, H. S., and Mahalakshmi, K. (2013). Co-occurrence Matrix and its Statistical Features as an Approach for Identification of Phase Transitions of Mesogens. Int. J. Innov. Res. Sci. Eng. Technol. 2, 4531–4538.
Rogan, J., Franklin, J., Stow, D., Miller, J., Woodcock, C., and Roberts, D. (2008). Mapping Land-Cover Modifications over Large Areas: A Comparison of Machine Learning Algorithms. Remote Sens. Environ. 112, 2272–2283. doi:10.1016/j.rse.2007.10.004
Rüetschi, M., Schaepman, M. E., and Small, D. (2017). Using Multitemporal Sentinel-1 C-Band Backscatter to Monitor Phenology and Classify Deciduous and Coniferous Forests in Northern switzerland. Remote Sens. 10, 55.
Su, X., Shen, Y., Zhou, W., Liu, Y., Cheng, H., and Liu, G. (2022). Mapping Forest Disturbance and Recovery for Ecological Security Improvement on the Qinghai-Tibet Plateau: A Case Study from Three Parallel Rivers Region. Glob. Ecol. Conservation 33, e01983. doi:10.1016/j.gecco.2021.e01983
Tucker, C. J., Slayback, D. A., Pinzon, J. E., Los, S. O., Myneni, R. B., and Taylor, M. G. (2001). Higher Northern Latitude Normalized Difference Vegetation Index and Growing Season Trends from 1982 to 1999. Int. J. biometeorology 45, 184–190. doi:10.1007/s00484-001-0109-8
Wang, S., Guo, L., He, B., lyu, Y., and Li, T. (2020). The Stability of Qinghai-Tibet Plateau Ecosystem to Climate Change. Phys. Chem. Earth, Parts A/B/C 115, 102827. doi:10.1016/j.pce.2019.102827
Wang, T., Zhang, H., Lin, H., and Fang, C. (2015). Textural-Spectral Feature-Based Species Classification of Mangroves in Mai Po Nature Reserve from Worldview-3 Imagery. Remote Sens. 8, 24. doi:10.3390/rs8010024
Wen, J., Liu, Q., Xiao, Q., Liu, Q., You, D., Hao, D., et al. (2018). Characterizing Land Surface Anisotropic Reflectance over Rugged Terrain: A Review of Concepts and Recent Developments. Remote Sens. 10, 370. doi:10.3390/rs10030370
Yang, B., He, M., Shishov, V., Tychkov, I., Vaganov, E., Rossi, S., et al. (2017). New Perspective on Spring Vegetation Phenology and Global Climate Change Based on Tibetan Plateau Tree-Ring Data. Proc. Natl. Acad. Sci. U.S.A. 114, 6966–6971. doi:10.1073/pnas.1616608114
Yang, K., Ye, B., Zhou, D., Wu, B., Foken, T., Qin, J., et al. (2011). Response of Hydrological Cycle to Recent Climate Changes in the Tibetan Plateau. Clim. change 109, 517–534. doi:10.1007/s10584-011-0099-4
Yao, T., Thompson, L. G., Mosbrugger, V., Zhang, F., Ma, Y., Luo, T., et al. (2012). Third Pole Environment (Tpe). Environ. Dev. 3, 52–64. doi:10.1016/j.envdev.2012.04.002
Zanaga, D., Van De Kerchove, R., De Keersmaecker, W., Souverijns, N., Brockmann, C., Quast, R., et al. (2021). Esa Worldcover 10 M 2020 V100.
Zhang, X., Cui, J., Wang, W., and Lin, C. (2017). A Study for Texture Feature Extraction of High-Resolution Satellite Images Based on a Direction Measure and Gray Level Co-occurrence Matrix Fusion Algorithm. Sensors 17, 1474. doi:10.3390/s17071474
Zhang, X., Long, T., He, G., Guo, Y., Yin, R., Zhang, Z., et al. (2020). Rapid Generation of Global Forest Cover Map Using Landsat Based on the Forest Ecological Zones. J. Appl. Remote Sens. 14, 022211. doi:10.1117/1.jrs.14.022211
Keywords: Qinghai-Tibet plateau, Google Earth engine, random forest, forest cover map, Sentinel satellite images, multisource dataset
Citation: Guo Y, Jiao W, Long T and Zhang X (2022) Generation of the Forest Cover Map of the Qinghai–Tibet Plateau Based on the Multisource Dataset and Random Forest. Front. Environ. Sci. 10:939151. doi: 10.3389/fenvs.2022.939151
Received: 08 May 2022; Accepted: 24 May 2022;
Published: 13 July 2022.
Edited by:
Peng Liu, Institute of Remote Sensing and Digital Earth (CAS), ChinaReviewed by:
Dalei Hao, Pacific Northwest National Laboratory (DOE), United StatesCopyright © 2022 Guo, Jiao, Long and Zhang. This is an open-access article distributed under the terms of the Creative Commons Attribution License (CC BY). The use, distribution or reproduction in other forums is permitted, provided the original author(s) and the copyright owner(s) are credited and that the original publication in this journal is cited, in accordance with accepted academic practice. No use, distribution or reproduction is permitted which does not comply with these terms.
*Correspondence: Weili Jiao, amlhb3dsQGFpcmNhcy5hYy5jbg==
Disclaimer: All claims expressed in this article are solely those of the authors and do not necessarily represent those of their affiliated organizations, or those of the publisher, the editors and the reviewers. Any product that may be evaluated in this article or claim that may be made by its manufacturer is not guaranteed or endorsed by the publisher.
Research integrity at Frontiers
Learn more about the work of our research integrity team to safeguard the quality of each article we publish.