 Yi Ma1
 Zhipeng Pei
- 1Joint Laboratory of Power Remote Sensing Technology, Yunnan Power Grid Company Ltd., Kunming, China
- 2State Key Laboratory of Information Engineering in Surveying, Mapping and Remote Sensing, Wuhan University, Wuhan, China
- 3Beijing Institute of Spacecraft System Engineering, Beijing, China
In recent years, the frequent fouling accidents have posed a serious threat to people’s life and property safety. Owing to the wide distribution of pollution sources and variable meteorological factors, it is a very time-consuming and labor-intensive task to map the pollution distribution using traditional methods. In this work, a study on the mapping of pollution distribution based on satellite remote sensing is carried out in Yunnan Province, China, as an example. Several machine learning methods (e.g. K-nearest neighbor, support vector machine) are used to analyze the effects of conditions such as multiple air pollution and meteorological data on pollution distribution map levels. The results indicate that the ensemble learning model has the highest accuracy of 72.32% in this application. The new pollution distribution map using this classifier has 5,506 more pixels in the most severe pollution level than the traditional map. Last, the remote sensing-based map and the manual measurement-based map were combined with corresponding experience weight to obtain a weighted pollution distribution map.
1 Introduction
Along with the continuous development of industry, the frequency and severity of heavy polluted weather are currently increasing in urban areas (Shen et al., 2017; Nakata et al., 2018; Ning et al., 2018; Cheng et al., 2022). The occurrence of heavy polluted weather adversely affects the external insulator performance of substation equipment (Nekahi et al., 2015). When fouling on the insulator surface of electrical equipment accumulates to a certain level, the foul flashover phenomenon easily occurs, thereby threatening people’s life and property safety (Zhang et al., 2011; Zhao et al., 2013). “Fouling” here means anything that can be deposited on the surface of the insulator and interferes with its performance (e.g., bird droppings). The ocean is also considered a source of significant impact on the insulator, as sea salt dilutes over long distances in the water to form a conductive film. The sources of pollution in inland cities are mainly from anthropogenic emissions (e.g., carbon emissions and nitrogen emissions).
The traditional pollution distribution map (PDM) is based on the “Drawing method of pollution distribution map for electric power system” (Administration, 2010), which is generally revised once every 4 years. The specific drawing process is as follows: 1. Investigate the distribution of pollution sources in the region and draw the distribution of pollution sources. 2. Investigate and collect the relevant meteorological parameters in the region and draw the meteorological distribution map, which can also be illustrated using text and diagrams. 3. Draw the salt density measurement map according to the salt density measurement (An et al., 2002) and at the same time mark the location of the foul flash fault point in the map. 4. Integrate the above three types of map and combine the equipment operation experience to draw the regional PDM. Although such a general rule is helpful to help determine the level of pollution, determining the actual level of pollution severity at the site is a very complex task, as the local climate must be strongly considered. Owing to the lack of detailed data, past experience plays a decisive role. In addition, with the location of the pollution sources, the intensity of pollution, weather, and other factors, the levels of the PDM vary from year to year, making it very cumbersome to draw, and the technicians are not informed of changes in the PDM in a timely manner. The process is influenced by subjective factors, which affects the objectivity and accuracy of the map. An accurate PDM can help the power supply company optimize the arrangement of monitoring points and promptly clean the more seriously fouled insulators to ensure stable equipment operation (Volpov and Kishcha, 2017). In recent years, more and more polymer insulators have been gradually replacing ceramic insulators, greatly reducing the frequency of fouling and flashing accidents (Verma and Chakraborty, 2018). This is because of its hydrophobic surface, which is not conducive to the formation of conductive films even in the presence of water and contaminants. However, their actual performance, aging rate, hydrophobic loss, and recovery time are closely related to the local meteorological conditions. In any case, PDM is important information for power utilities. Hong et al. (2012) similarly pointed out the disadvantages of a traditional PDM and initially developed a general framework for the standard mapping of electronic pollution distribution.
With the launch of satellites and the continuous improvements in retrieval technique (Xu et al., 2022; Xiang et al., 2021; Pei et al., 2022; Shi et al., 2022), satellite remote sensing has become a promising approach for the monitoring of various atmospheric pollutant concentrations according to certain spectral ranges. For example, the moderate resolution imaging spectroradiometer (MODIS) and the cloud-aerosol lidar and infrared pathfinder satellite observation can acquire the distribution of aerosol optical depth (AOD) using passive remote sensing and laser remote sensing, respectively. Some past studies have used machine learning methods to estimate PM2.5 concentrations using satellite-derived AOD. OMI and TROPOMI can provide the distribution of pollutant gases such as atmospheric nitrogen dioxide (NO2) concentrations (Ogen, 2020; Cooper et al. 2022) and sulfur dioxide (SO2) concentrations. The 7 × 5.5 km2 spatial resolution and short revisit period of TROPOMI provide convenience for many air pollution studies (Pei et al., 2020; Zhang et al. 2022).
Machine learning is widely used in the study of prediction and classification. Common methods such as random forests, neural networks, and support vector machines have been shown to have good performance using remote sensing data (Lary et al., 2016; Maxwell et al., 2018; Yang et al., 2020; Li et al., 2020a; Li et al., 2020b). Machine learning (Jordan and Mitchell, 2015) is a data-driven approach, also known as a “black box” model. The advantage of machine learning is that it does not require knowledge of the mathematical equations between individual natural factors and polluted levels, it can summarize the intrinsic connections from the data and is highly adaptive and resistant to interference. There is no standard or empirical formula for the relationship between natural factors and fouling density (Ruan et al., 2015). Meteorological data are more readily available than equivalent salt deposit density (ESDD) measurements, and the inference of the PDM level from meteorological data enables real-time monitoring of insulator resistance to fouling, avoiding the economic losses and dangers of energized measurements associated with power outages during traditional monitoring.
In this study, first, we tried to predict the PDM level using machine learning methods and compared the accuracy of several common classifiers. Second, the method with the highest accuracy was selected to map the machine learning–derived PDM in the Yunnan Province, China, with an accuracy that meets the engineering needs and can be used by relevant departments. Compared with the traditional PDM, the machine learning–derived PDM with high accuracy could update in time, which can timely find the pollution sources in the areas where no measurement points are deployed. At the same time, the traditional PDM is based on the analysis and summary of a large number of operational experiences. In particular, the pollution levels near manual measurement sites are considered convincing, and the training and test sets are randomly selected from among them. The fusion method proposed in this study can provide a reasonable integration of the two. Figure 1 presents the schematic of this study.
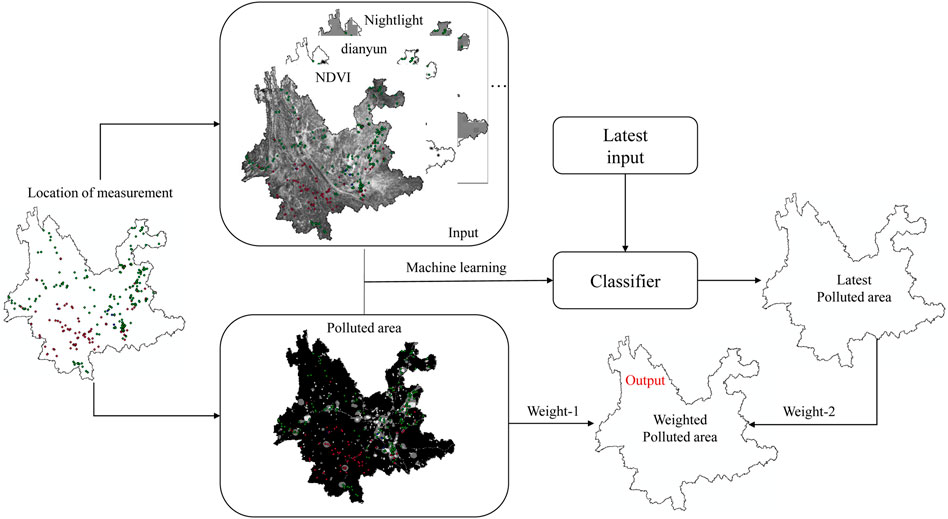
FIGURE 1. Workflow diagram of the proposed framework for estimating the pollution distribution map (PDM).
2 Materials and Methods
2.1 Study Area
Yunnan Province is located in the southwest of China and is a highland mountainous province. Its climate is basically of the subtropical plateau monsoon type, with a distinct three-dimensional climate, small annual temperature differences, large daily temperature differences, and distinct dry and wet seasons. The average annual precipitation across Yunnan Province is 560–2300 mm, and the average annual temperature is 6.9–27.1°C. The wet season is from May to October, and the precipitation is approximately 85% or more of the year. The meteorological conditions of high humidity and low wind speed increase the probability of pollution flashover accidents. For these reasons, Yunnan Electric Power Company has taken several measures to prevent the occurrence of foul flashes. A PDM for this province was defined by evaluating the state of insulators in high-voltage test stations and the contamination they experience. Figure 2 shows a manually drawn PDM in 2018. Pollution level 1 indicates the most heavily polluted area, which requires focused attention and timely cleaning of insulators. Moreover, the number of pixels in level 1 is 1,297 in Figure 2.
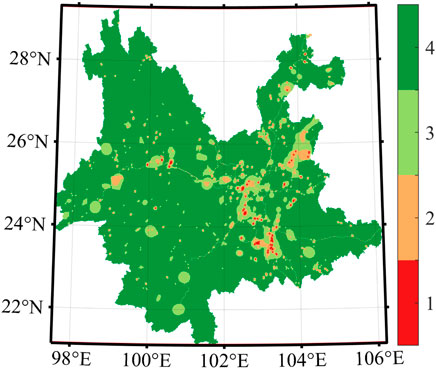
FIGURE 2. Manually drawn map of the pollution distribution in Yunnan Province by the electric power department in 2018.
2.2 Manual Drawing Method of Pollution Distribution Map
The PDM is drawn by each local (municipal) power supply company as the basic unit, and the PDM of the power system in the region is drawn according to the site pollution severity class. In addition, if possible, measurement of ESDD and nonsoluble deposit density (NSDD) on a selected as-is insulator can provide direct information for determining the required creepage distance to that insulator. Likewise, chemical analysis for pollution is sometimes useful. The pollution severity class is based on a combination of three factors: typical environment, operating experience, and site pollution severity. When the three do not agree, it is determined according to operational experience. The mapping department needs to briefly analyze the environmental and atmospheric pollution status, geomorphological features, and pollution characteristics of the region. Figure 3 shows the procedure of manually drawing the PDM. Figure 2 shows a manually drawn PDM in 2018. The main indicator for the current classification of pollution levels is the ESDD.
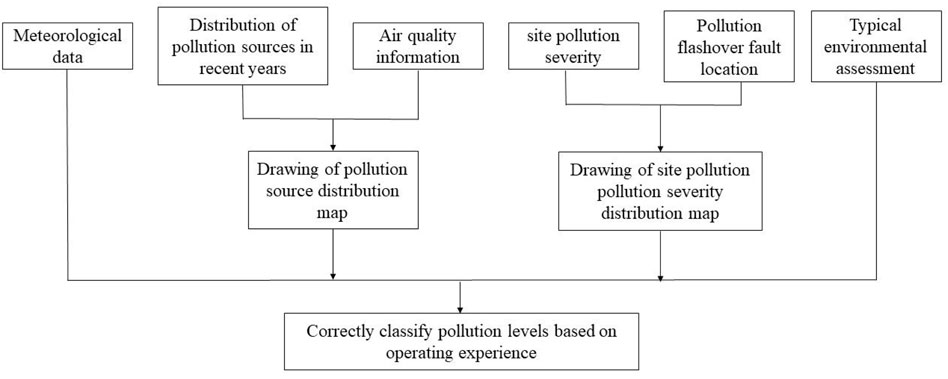
FIGURE 3. Procedure of manually mapping pollution distribution.
Most of the ESDD measurement points are set according to the distribution of lines, substations, and heavy pollution sources, with uneven spatial distribution. In general, 110kV and above transmission lines located in the suburban areas, in principle, every 2.5 km 5 km need to set up a measurement point. Away from the town of farmland areas, generally 5 km 10 km need to set up a measurement point. Measurement points in mountainous and hilly areas without serious environmental pollution can be selected as appropriate. Lines through the local pollution sources should be set up to monitor the point. For areas with significant pollution and complex composition, more measurement points need to be set up (Administration, 2010). In Yunnan Province, there are 354 salt density measurement points from 2017 to 2019, as shown in Figure 4.
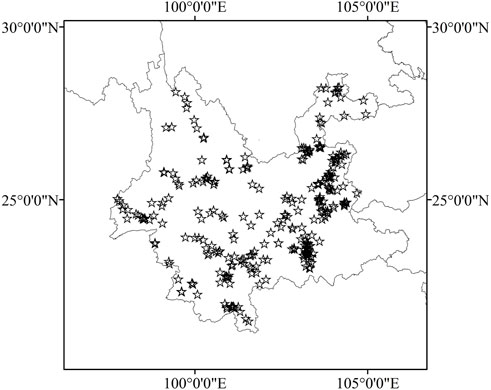
FIGURE 4. Distribution of AOD (A) and NO2 (B) after kriging interpolation.
2.3 Pollution Measurements
The site pollution severity class can be determined by measuring the ESDD and NSDD of reference insulators taken from existing installations or field test station installations. The equivalent amount of attached salt is the equivalent amount of NaCl on the insulating surface. When it and the actual deposit on the insulator surface are each dissolved in a certain amount of water, they will have equal volumetric conductivity. The equivalent amount of salt in milligrams per square centimeters is used to express this. The polluted level is divided into four classes with a salt density of 0.06, 0.01, and 0.25 mg per cm2.
2.4 Data Sources and Preprocessing
The source of dirt is the root cause of the accumulation of dirt on the surface of the equipment. The conductivity of the salts contained in the equipment surface fouling after wetting is the cause of fouling and flashing. The wind and precipitation in the meteorological conditions have an important influence on the amount and rate of the accumulation of fouling on the surface of the equipment. Precipitation is an important condition for the wetting of the equipment surface fouling and is the cause of fouling accidents. Thus, the remote sensing data used in this study include the following: tropospheric NO2 column concentration (Zheng et al., 2019), SO2 column concentration, PM2.5, PM10, Sentinel-2–derived NDVI (D’Odorico et al., 2013), and nightlight (bands 1–6). In addition to these few common pollutants, NDVI can indirectly reflect the degree of vegetation cover and the degree of influence by human activities (Qiu et al., 2022). Nighttime light imagery (Liu et al., 2012; Li et al., 2013) has been used as an indicator of the intensity of human activity in many studies. Li et al., 2017 demonstrated the harshness of the Syrian civil war using the dramatic reduction in the nighttime lighting of Luojia-1. Oda et al. (2018) produced a high spatial resolution global carbon emission inventory using nighttime lights as a proxy. PM2.5 and PM10 were derived from the China High Air Pollutants (CHAP) dataset (Wei et al., 2021), which refers to the long-term, full-coverage, high-resolution, and high-quality ground-level air pollutants in China. Next, emission inventories of various pollutants (bands 7–17) were provided by the Multi-Resolution Emission Inventory for China (MEIC) project, as shown in Table 1. Emissions inventories (Han et al., 2017; Shi et al., 2020; Shi et al., 2021) provide a good representation of the distribution and intensity of anthropogenic emissions. Table 1 shows these remote sensing data as well as specific information on emission inventories (e.g., provider and resolution). In addition, wind speed and precipitation (bands 18 and 19) were provided by meteorological stations. In conclusion, we obtained the pollution source location of Yunnan Province using a web crawler (https://wryjc.cnemc.cn/). The results of kernel density analysis were used as the 20th band.
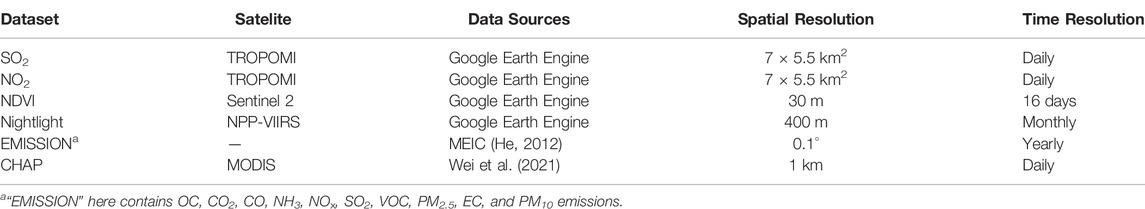
TABLE 1. Datasets information used in this work.
In this study, the remote sensing images were preprocessed using ENVI software. Each band was resampled to 0.1°. Using AOD and NO2 as examples, Figure 5 shows the average results for 2019 in Yunnan. AOD is used to describe the degree of attenuation of light by aerosols (Xu et al., 2022; Liu et al., 2022), also called atmospheric turbidity. Particles in the atmosphere mainly originate from natural sources (e.g., ground dust and volcanic ash) and anthropogenic emissions. The main anthropogenic emissions are the burning of fossil fuels such as oil and coal. High NO2 is located in densely populated cities (Kunming, the capital city of Yunan), owing to the large amount of nitrogen-containing exhaust emissions from cars.
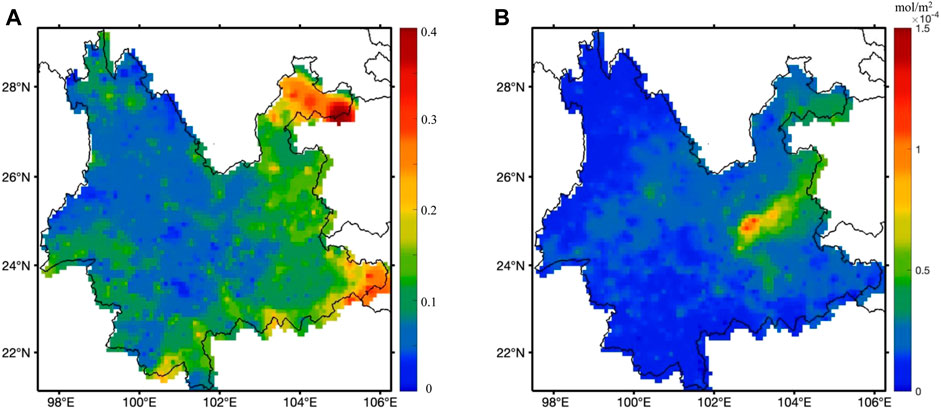
FIGURE 5. The relationship between the error and the distance for different L values.
2.5 Machine Learning
Machine learning (ML) has been widely used in remote sensing fields recently (Li et al., 2021; Smith et al., 2021; Chen et al., 2022b; Song et al., 2022; Chen et al., 2022a; Gui et al., 2020). The K-nearest neighbor (KNN) algorithm (Zhang and Zhou, 2007; Luo et al., 2022) is one of the most basic and simple ML algorithms. It can be used for both classification and regression. It performs classification by measuring the distance between different feature values. The support vector machine (SVM) (Joachims, 1998) is a binary classification model whose basic model is a linear classifier defined by maximizing the margin on the feature space. The naïve Bayes method (Lewis, 1998) is a classification method based on Bayes’ theorem and the assumption of conditional independence of features. The decision tree model is a simple and easy-to-use nonparametric classifier. It does not require any a priori assumptions on the data, and it computes fast. Moreover, the result of the decision tree model is easy to interpret and is robust. The backpropagation neural network (BPNN) (Karsoliya, 2012) is a multilayer feedforward network trained by error backpropagation, and its basic idea is the gradient descent method, which uses the gradient search technique to continuously adjust the parameters in order to minimize the mean square error between the actual and desired output values of the network. BPNNs have extremely strong nonlinear mapping capabilities and can be used to solve classification and regression problems.
The ensemble learning model (ELM) (Dietterich et al., 2002) solves a single prediction problem by building several models. It works by generating several classifiers/models that each learn and make predictions independently. These predictions are finally combined into a combined prediction and therefore outperform any single classification to make a prediction.
2.6 Data Fusion
Traditional manually drawn PDMs are decisions based on extensive operational experience. This is usually considered plausible; however, this is limited to the vicinity of the measurement point. We believe that the error of the manually drawn PDM increases with the distance to the nearest measurement point. Meanwhile, the PDM obtained by ML is considered to have the same error. In conclusion, we propose a reliable method to fuse these two PDMs. This can ensure the accuracy of the area near the measurement point and also take advantage of the ML-based pollution area distribution map. The pollution severity class errors of the ELM-derived PDM were set to 0.5, 1, 2, and 3 when the polluted levels were 1, 2, 3, and 4, respectively. Likewise, the ELM-derived PDM judged to be of high polluted level is considered to have high accuracy. The pollution severity class error of the manual PDM can be expressed by Eq. 1.
where D represents the distance to the nearest measurement point and L needs to be set based on our running experience. It is often called the correlation length in some exponential variance models. The relationship between the error and the distance is shown in Figure 6 for different L values. Here, L is an empirical value. The distribution of pollution is regular, and the pollution level decreases as the distance from the source increases. A measurement point can only reflect the situation in its vicinity. A smaller L means that the manual measurement points only reflect the level of pollution in the closer area and vice versa. The appropriate magnitude of L is important for the fusion results. L was set to 5 km in this study. Note that the units of D and L need to be consistent.
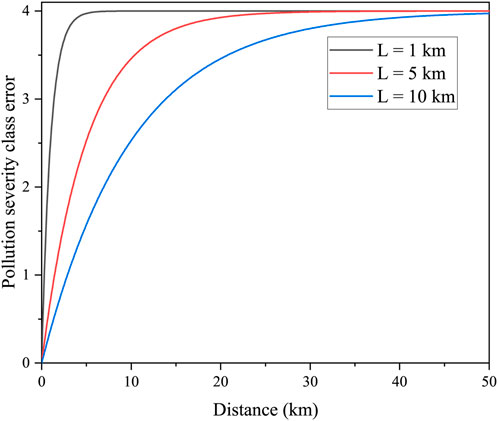
FIGURE 6. Location of manual measurement points.
For two measurements of the same parameter, we can get a fused result based on the error and uncertainty of the measurement. In this work, this is a weighted PDM. The specific fusion method is shown in Eqs 2 and 3. This method not only takes advantage of ML prediction (timely prediction and low cost) but also takes into account the high confidence of the traditional PDM near manual measurement points. In addition, the attached weighted error distribution map can help the power system determine whether the pollution levels at different locations are credible.
where Class1 and Class2 are the pollution severity classes of the ELM-derived PDM and manual PDM, respectively. σ1 and σ2 are the pollution severity class errors of the ELM-derived PDM and manual PDM, respectively.
3 Result
In this study, a total of six common classifiers in ML were used, namely, the ELM, the KNN classifier, the SVM classifier, the naïve Bayes model (NBM) classifier, the decision tree model (DTM) classifier, and the backpropagation neural network (BPNN). The training and test sets were randomly selected from the 354 manual measurement points. In addition, 20 input bands from these 354 locations are the independent variables, and the pollution level is the dependent variable. The independent variables should be normalized. Overall accuracy is evaluated using 10-fold cross-validation, and the time cost, macroprecision, and F1 score of the six classifiers are shown in Table 2. The comparison of PDMs derived from the six models is shown in Figure 7.
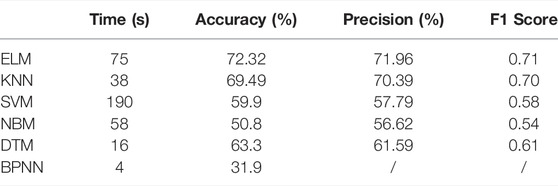
TABLE 2. Comparison of method performance.
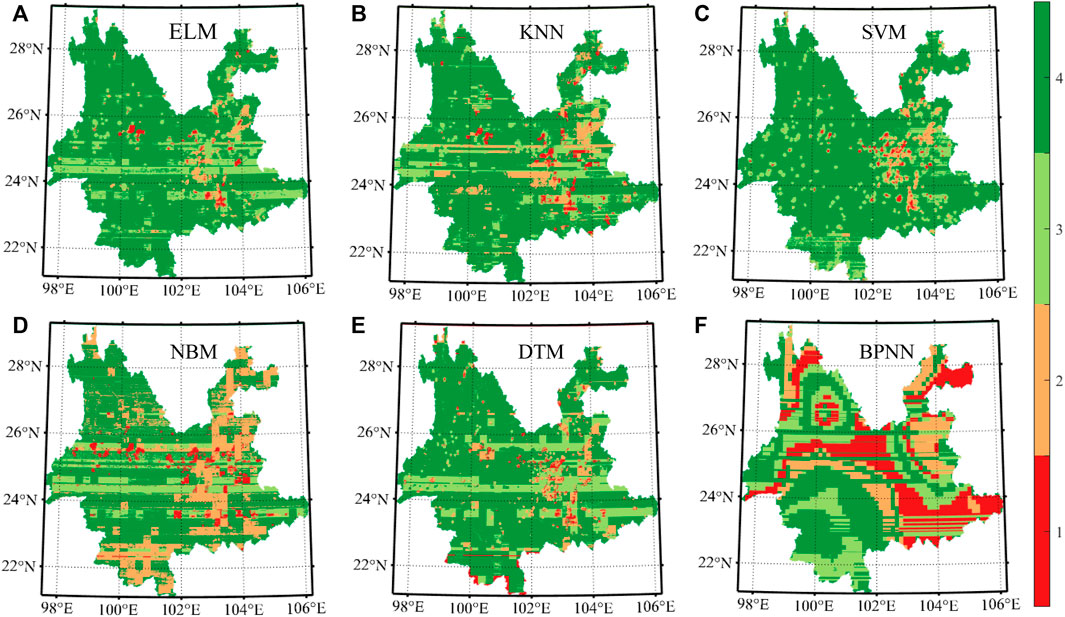
FIGURE 7. The pollution distribution map by ELM (A), KNN (B), SVM (C), NBM (D), DTM (E), and BPNN (F).
As can be seen from the results, the ELM performs best and can achieve an accuracy of 72.32%, although the training time is not short (75 s). The SVM classifier performs well in this application, with the longest training time. The KNN and DTM achieved over 60% accuracy. The BPNN has the shortest training time, but its accuracy is low, and it is not suitable for this application. The ELM predicted the polluted levels in all regions of Yunnan Province, and the results are shown in Figure 7A. The polluted area map based on the ELM model is regarded as a satellite-based result owing to its highest performance. Figure 8 illustrates the percentage of each level of manual PDM and satellite-based PDM. The number of pixels in the newly added polluted level 1 map is 6,803, which is 5,506 more than that of the previous manual drawing. This demonstrates that proxy data such as remote sensing data and emission inventories can help us identify some undetected sources of emissions. However, if a manual measurement point originally existed at a location, then we should still focus on the manually determined level.
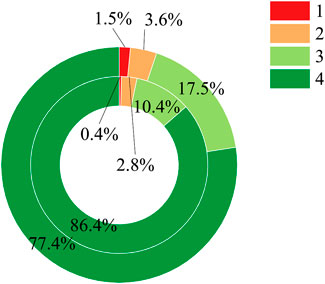
FIGURE 8. Percentage of each level. The inner and outer circles represent the manually drawn and predicted pollution distribution maps in this study, respectively. The numbers (1–4) represent the polluted levels.
Thus, we fused the PDM obtained by the ELM with the manually drawn PDM according to the PDM fusion method described in Section 2.6. The result is shown in Figure 9.
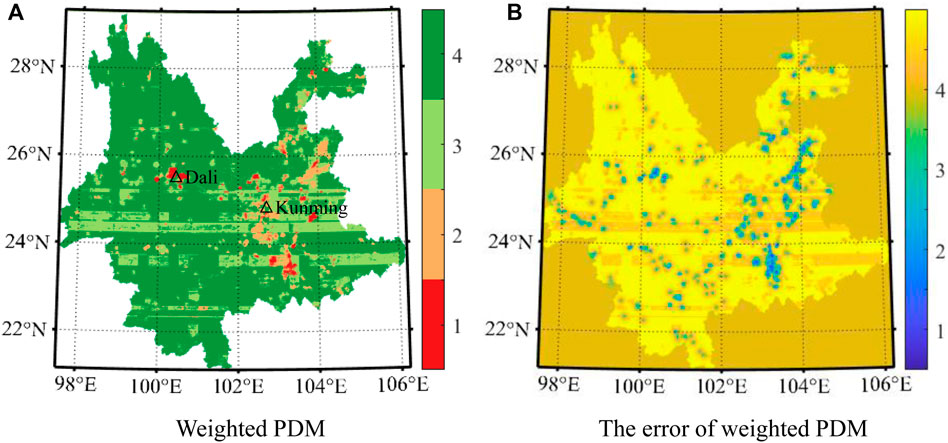
FIGURE 9. The weighted PDM (A) and corresponding error from the ELM-derived PDM (B). The numbers (1–4) represent the polluted levels.
The final PDM comprehensively considers the error of the manually drawn PDM and machine learning–derived PDM. Figure 9 indicates that the PDM after fusion is more practical. The highest polluted level (level 1) of the fused PDM is found in more locations than that of the manual PDM, especially near Dali (25.667°N,100.551°E), which has a large population and much industry. Although the fused PDM shows great potential, it still has obvious drawbacks. For example, the machine learning–derived PDM does not have high enough accuracy, as shown by the squares in Figure 9.
4 Discussion
Compared to prior techniques, the method of satellite-based mapping of pollution distribution proposed in this study enables automatic generation and real-time updating of the PDM, and the PDM levels of the whole region are derived from the credible PDM levels obtained using the actual ESDD measurements through an integrated learner. The method no longer relies on experience and guesswork but has an objective theoretical basis, reducing the impact of human subjectivity on the mapping of the grid. The resulting distribution map reflects more objectively the distribution of pollution in the whole Yunnan Province, which is conducive to better grid dispatching by power dispatchers.
In addition, the fusion method adopted in this study is based on the weight of experience. In the past, some studies have used other fusion methods (Wang et al., 2021), such as using a manual PDM class as the final PDM class in the training data and using a ML class in other places. The method of reasonable error configuration proposed in this study helps to weigh manually measured and ELM-derived PDM. The error map that accompanies the PDM can also provide additional reference to the power system.
However, the method of using ML to obtain the pollution map proposed in this study relies heavily on the training dataset, which comes from some artificial measurement highlights. In order to create a more accurate map, additional salinity measurement points are required, especially around the emission sources. In order to accurately reflect the influence of the pollution sources, measurement points need to be set according to the location of the pollution sources and meteorological factors such as wind direction. In addition, , we can see that in both the machine learning–derived PDM and the fused PDM from Figures 7, 9, there are obvious unexcepted rectangles in them. This is mainly because of the limitation of the resolution and accuracy of the input data (mainly the emission inventory of MEIC). We insist on using these emission inventories because the PDM is largely influenced by them. With the launch of more high-resolution satellites and the improvement of retrieval techniques in the future, these remote sensing data and inventory affecting air pollution will be more refined and reliable. By that time, the method proposed in this work will have greater application.
5 Conclusion
In this study, we proposed a new method to map the electric pollution distribution. On the one hand, we used advanced ML techniques and remote sensing data to train models for predicting the PDM. On the other hand, we proposed to fuse the machine learning–derived PDM and the manually drawn PDM according to different weights. Using this approach, we generated a fused PDM in Yunnan Province, China. Compared with the previous manually drawn PDM, the newly obtained PDM has more places with the highest pollution level (level 1). This means that the input proxy data such as remote sensing data helped us identify more areas with potentially serious pollution, and these locations need to be measured and cleaned in time for electrical equipment.
With the continuous advancement of satellite remote sensing technology, the increase in the types of pollutant gases that can be measured, the increase in detection accuracy, temporal resolution and spatial resolution, and the mapping of pollution areas based on satellite remote sensing will have very great potential and application in the power sector. In addition to the remote sensing data and meteorological data used in this article, if more data are added in the future, such as ground temperature, static wind frequency, and humidity, the PDM obtained using ML is expected to become more convincing.
Data Availability Statement
The original contributions presented in the study are included in the article/Supplementary material, and further inquiries can be directed to the corresponding author.
Author Contributions
Conceptualization, YiM and ZP; methodology, YiM; software, YuM; validation, ZP, BW, and SZ; formal analysis, JL; investigation, PK; resources, ZP; data curation, ZP; writing—original draft preparation, ZP; writing—review and editing, YiM; visualization, YiM; supervision, YiM; project administration, YiM; funding acquisition, YiM. All authors contributed to manuscript revision, read, and approved the submitted version.
Funding
This research was funded by the National Key Research and Development Program (Grant No. 2021YFB3901000), National Natural Science Foundation of China (Grant No. 41801261, No. 41827801, and No.41971283), and the Science and Technology Project of China Southern Power Grid Co., Ltd. (YNKJXM20191246).
Conflict of Interest
YiM, YuM, BW, and SZ were employed by the company Yunnan Power Grid Company Ltd.
The remaining authors declare that the research was conducted in the absence of any commercial or financial relationships that could be construed as a potential conflict of interest.
Publisher’s Note
All claims expressed in this article are solely those of the authors and do not necessarily represent those of their affiliated organizations, or those of the publisher, the editors, and the reviewers. Any product that may be evaluated in this article, or claim that may be made by its manufacturer, is not guaranteed or endorsed by the publisher.
Acknowledgments
We are grateful to ESA and USGS for their provision of the datasets used in this study. We thank the MEIC team for their emission data. Wei et al. are also thanked for the CHAP data. We thank Google Earth Engine for their convenient data acquisition.
References
Administration, N. E. (2010). Drawing Method of Pollution Distribution Map for Electric Power System (China Electricity & Power Standards). Beijing: China Power Press.
An, L., Jiang, X., and Han, Z. (2002). Measurements of Equivalent Salt Deposit Density (Esdd) on a Suspension Insulator. IEEE Trans. Dielect. Electr. Insul. 9, 562–568. doi:10.1109/tdei.2002.1024434
Chen, B., Song, Z., Huang, J., Zhang, P., Hu, X., Zhang, X., et al. (2022a). Estimation of Atmospheric Pm10 Concentration in china Using an Interpretable Deep Learning Model and Top-Of-The-Atmosphere Reflectance Data from china’s New Generation Geostationary Meteorological Satellite, Fy-4a. J. Geophys. Res. Atmos. 127, e2021JD036393. doi:10.1029/2021jd036393
Chen, B., Song, Z., Pan, F., and Huang, Y. (2022b). Obtaining Vertical Distribution of PM2.5 from CALIOP Data and Machine Learning Algorithms. Sci. Total Environ. 805, 150338. doi:10.1016/j.scitotenv.2021.150338
Cheng, K., Li, J.-Y., Wang, Y., Ji, W.-W., and Cao, Y. (2022). Characterization and Risk Assessment of Airborne Polycyclic Aromatic Hydrocarbons from Open Burning of Municipal Solid Waste. Front. Environ. Sci. 10, 382. doi:10.3389/fenvs.2022.861770
Cooper, M. J., Martin, R. V., Hammer, M. S., Levelt, P. F., Veefkind, P., Lamsal, L. N., et al. (2022). Global Fine-Scale Changes in Ambient No2 during Covid-19 Lockdowns. Nature 601, 380–387. doi:10.1038/s41586-021-04229-0
Dietterich, T. G. (2002). Ensemble Learning. Handb. brain theory neural Netw. 2, 110–125. https://courses.cs.washington.edu/courses/cse446/12wi/tgd-ensembles.pdf
D’Odorico, P., Gonsamo, A., Damm, A., and Schaepman, M. E. (2013). Experimental Evaluation of Sentinel-2 Spectral Response Functions for Ndvi Time-Series Continuity. IEEE Trans. Geoscience Remote Sens. 51, 1336–1348. doi:10.1109/TGRS.2012.2235447
Gui, K., Che, H., Zeng, Z., Wang, Y., Zhai, S., Wang, Z., et al. (2020). Construction of a Virtual PM2.5 Observation Network in China Based on High-Density Surface Meteorological Observations Using the Extreme Gradient Boosting Model. Environ. Int. 141, 105801. doi:10.1016/j.envint.2020.105801
Han, G., Cui, X., Liang, A., Ma, X., Zhang, T., and Gong, W. (2017). A CO2Profile Retrieving Method Based on Chebyshev Fitting for Ground-Based DIAL. IEEE Trans. Geosci. Remote Sens. 55, 6099–6110. doi:10.1109/tgrs.2017.2720618
He, K. (2012). Multi-Resolution Emission Inventory for china (Meic): Model Framework and 1990-2010 Anthropogenic Emissions. AGU Fall Meet. Abstr. 2012, A32B–A05. https://ui.adsabs.harvard.edu/abs/2012AGUFM.A32B..05H
Hong, L., Huan, H., Wei, C., He-ming, D., Rui, K., and Gong-da, Z. (2012). “Preliminary Study on the Drawing of the Electronic Polluting Area Map,” in 2012 International Conference on Computer Distributed Control and Intelligent Environmental Monitoring (IEEE), 512–514. doi:10.1109/cdciem.2012.127
Joachims, T. (1998). Making Large-Scale SVM Learning Practical. Tech. Rep. Technical report. http://hdl.handle.net/10419/77178
Jordan, M. I., and Mitchell, T. M. (2015). Machine Learning: Trends, Perspectives, and Prospects. Science 349, 255–260. doi:10.1126/science.aaa8415
Karsoliya, S. (2012). Approximating Number of Hidden Layer Neurons in Multiple Hidden Layer Bpnn Architecture. Int. J. Eng. Trends Technol. 3, 714–717. https://ijettjournal.org/archive/ijett-v3i6p206
Lary, D. J., Alavi, A. H., Gandomi, A. H., and Walker, A. L. (2016). Machine Learning in Geosciences and Remote Sensing. Geosci. Front. 7, 3–10. doi:10.1016/j.gsf.2015.07.003
Lewis, D. D. (1998). “Naive (Bayes) at Forty: The Independence Assumption in Information Retrieval,” in European Conference on Machine Learning (Springer), 4–15. doi:10.1007/bfb0026666
Li, T., Shen, H., Yuan, Q., and Zhang, L. (2020a). Geographically and Temporally Weighted Neural Networks for Satellite-Based Mapping of Ground-Level PM2.5. ISPRS J. Photogrammetry Remote Sens. 167, 178–188. doi:10.1016/j.isprsjprs.2020.06.019
Li, T., Wang, Y., and Yuan, Q. (2020b). Remote Sensing Estimation of Regional No2 via Space-Time Neural Networks. Remote Sens. 12, 2514. doi:10.3390/rs12162514
Li, W., Shi, Y., Huang, F., Hong, H., and Song, G. (2021). Uncertainties of Collapse Susceptibility Prediction Based on Remote Sensing and Gis: Effects of Different Machine Learning Models. Front. Earth Sci. 9, 635. doi:10.3389/feart.2021.731058
Li, X., Li, D., Xu, H., and Wu, C. (2017). Intercalibration Between DMSP/OLS and VIIRS Night-Time Light Images to Evaluate City Light Dynamics of Syria’s Major Human Settlement During Syrian Civil War. Int. J. Remote Sens. 38, 5934–5951.
Li, X., Xu, H., Chen, X., and Li, C. (2013). Potential of Npp-Viirs Nighttime Light Imagery for Modeling the Regional Economy of china. Remote Sens. 5, 3057–3081. doi:10.3390/rs5063057
Liu, B., Ma, X., Ma, Y., Li, H., Jin, S., Fan, R., et al. (2022). The Relationship between Atmospheric Boundary Layer and Temperature Inversion Layer and Their Aerosol Capture Capabilities. Atmos. Res. 271, 106121. doi:10.1016/j.atmosres.2022.106121
Liu, Z., He, C., Zhang, Q., Huang, Q., and Yang, Y. (2012). Extracting the Dynamics of Urban Expansion in china Using Dmsp-Ols Nighttime Light Data from 1992 to 2008. Landsc. Urban Plan. 106, 62–72. doi:10.1016/j.landurbplan.2012.02.013
Luo, B., Yang, J., Song, S., Shi, S., Gong, W., Wang, A., et al. (2022). Target Classification of Similar Spatial Characteristics in Complex Urban Areas by Using Multispectral Lidar. Remote Sens. 14, 238. doi:10.3390/rs14010238
Maxwell, A. E., Warner, T. A., and Fang, F. (2018). Implementation of Machine-Learning Classification in Remote Sensing: An Applied Review. Int. J. Remote Sens. 39, 2784–2817. doi:10.1080/01431161.2018.1433343
Nakata, M., Mukai, S., and Yasumoto, M. (2018). Seasonal and Regional Characteristics of Aerosol Pollution in East and Southeast Asia. Front. Environ. Sci. 6, 29. doi:10.3389/fenvs.2018.00029
Nekahi, A., McMeekin, S., and Farzaneh, M. (2015). “Effect of Pollution Severity on Electric Field Distribution along a Polymeric Insulator,” in 2015 IEEE 11th international conference on the properties and applications of dielectric materials (ICPADM) (IEEE), 612–615.
Ning, G., Wang, S., Yim, S. H. L., Li, J., Hu, Y., Shang, Z., et al. (2018). Impact of Low-Pressure Systems on Winter Heavy Air Pollution in the Northwest Sichuan Basin, china. Atmos. Chem. Phys. 18, 13601–13615. doi:10.5194/acp-18-13601-2018
Oda, T., Maksyutov, S., and Andres, R. J. (2018). The Open-Source Data Inventory For Anthropogenic Co2, Version 2016 (Odiac2016): A Global Monthly Fossil Fuel Co2 Gridded Emissions Data Product For Tracer Transport Simulations And Surface Flux Inversions. Earth Syst. Sci. Data 10, 87–107. doi:10.5194/essd-10-87-2018
Ogen, Y. (2020). Assessing Nitrogen Dioxide (No2) Levels as a Contributing Factor to Coronavirus (Covid-19) Fatality. Sci. Total Environ. 726, 138605. doi:10.1016/j.scitotenv.2020.138605
Pei, Z., Han, G., Ma, X., Shi, T., and Gong, W. (2022). A Method for Estimating the Background Column Concentration of Co2 Using the Lagrangian Approach. IEEE Trans. Geoscience Remote Sens.. doi:10.1109/TGRS.2022.3176134
Pei, Z., Han, G., Ma, X., Su, H., and Gong, W. (2020). Response of Major Air Pollutants to Covid-19 Lockdowns in china. Sci. Total Environ. 743, 140879. doi:10.1016/j.scitotenv.2020.140879
Qiu, R., Li, X., Han, G., Xiao, J., Ma, X., and Gong, W. (2022). Monitoring Drought Impacts on Crop Productivity of the U.S. Midwest with Solar-Induced Fluorescence: GOSIF Outperforms GOME-2 SIF and MODIS NDVI, EVI, and NIRv. Agric. For. Meteorology 323, 109038. doi:10.1016/j.agrformet.2022.109038
Ruan, L., Han, G., Zhu, Z., Zhang, M., and Gong, W. (2015). Spatial and Temporal Characteristics of Insulator Contaminations Revealed by Daily Observations of Equivalent Salt Deposit Density. Sensors 15, 3023–3040. doi:10.3390/s150203023
Shen, H., Tao, S., Chen, Y., Ciais, P., Güneralp, B., Ru, M., et al. (2017). Urbanization-induced Population Migration Has Reduced Ambient PM2.5 Concentrations in China. Sci. Adv. 3, e1700300. doi:10.1126/sciadv.1700300
Shi, T., Han, G., Ma, X., Gong, W., Pei, Z., Xu, H., et al. (2021). Potential of Ground-Based Multiwavelength Differential Absorption Lidar to Measure δ13c in Open Detected Path. IEEE Geoscience Remote Sens. Lett. 19, 1–4. doi:10.1109/LGRS.2021.3130585
Shi, T., Han, G., Ma, X., Zhang, M., Pei, Z., Xu, H., et al. (2020). An Inversion Method for Estimating Strong Point Carbon Dioxide Emissions Using a Differential Absorption Lidar. J. Clean. Prod. 271, 122434. doi:10.1016/j.jclepro.2020.122434
Shi, T., Han, Z., Han, G., Ma, X., Chen, H., Andersen, T., et al. (2022). Retrieving Coal Mine Ch 4 Emissions Using Uav-Based Aircore Observations and the ga-ippf Model. Atmos. Chem. Phys. Discuss., 1–17. doi:10.5194/acp-2022-180
Smith, B., Pahlevan, N., Schalles, J., Ruberg, S., Errera, R., Ma, R., et al. (2021). A Chlorophyll-A Algorithm for Landsat-8 Based on Mixture Density Networks. Front. Remote Sens. 1, 5. doi:10.3389/frsen.2020.623678
Song, Z., Chen, B., Zhang, P., Guan, X., Wang, X., Ge, J., et al. (2022). High Temporal and Spatial Resolution PM2.5 Dataset Acquisition and Pollution Assessment Based on FY-4A TOAR Data and Deep Forest Model in China. Atmos. Res. 274, 106199. doi:10.1016/j.atmosres.2022.106199
Verma, A. R., B., S. R., and Chakraborty, R. (2018). Multistress Aging Studies on Polymeric Insulators. IEEE Trans. Dielect. Electr. Insul. 25, 524–532. doi:10.1109/tdei.2018.006910
Volpov, E., and Kishcha, P. (2017). An Advanced Technique for Outdoor Insulation Pollution Mapping in the israel Electric Company Power Grid. IEEE Trans. Dielect. Electr. Insul. 24, 3539–3548. doi:10.1109/tdei.2017.006917
Wang, Y., Yuan, Q., Li, T., Zhu, L., and Zhang, L. (2021). Estimating Daily Full-Coverage Near Surface O3, Co, and No2 Concentrations at a High Spatial Resolution over china Based on S5p-Tropomi and Geos-Fp. ISPRS J. Photogrammetry Remote Sens. 175, 311–325. doi:10.1016/j.isprsjprs.2021.03.018
Wei, J., Li, Z., Lyapustin, A., Sun, L., Peng, Y., Xue, W., et al. (2021). Reconstructing 1-Km-Resolution High-Quality PM2.5 Data Records from 2000 to 2018 in China: Spatiotemporal Variations and Policy Implications. Remote Sens. Environ. 252, 112136. doi:10.1016/j.rse.2020.112136
Xiang, C., Ma, X., Zhang, X., Han, G., Zhang, W., Chen, B., et al. (2021). Design of Inversion Procedure for the Airborne CO2-IPDA LIDAR: A Preliminary Study. IEEE J. Sel. Top. Appl. Earth Obs. Remote Sens. 14, 11840–11852. doi:10.1109/jstars.2021.3127564
Xu, W., Wang, W., Wang, N., and Chen, B. (2022). A New Algorithm for Himawari-8 Aerosol Optical Depth Retrieval by Integrating Regional PM2.5 Concentrations. IEEE Trans. Geosci. Remote Sens. 60, 1–11. doi:10.1109/tgrs.2022.3155503
Yang, Q., Yuan, Q., Li, T., and Yue, L. (2020). Mapping PM2.5 Concentration at High Resolution Using a Cascade Random Forest Based Downscaling Model: Evaluation and Application. J. Clean. Prod. 277, 123887. doi:10.1016/j.jclepro.2020.123887
Zhang, J., Han, G., Mao, H., Pei, Z., Ma, X., Jia, W., et al. (2022). The Spatial and Temporal Distribution Patterns of Xch4 in china: New Observations from Tropomi. Atmosphere 13, 177. doi:10.3390/atmos13020177
Zhang, M.-L., and Zhou, Z.-H. (2007). Ml-knn: A Lazy Learning Approach to Multi-Label Learning. Pattern Recognit. 40, 2038–2048. doi:10.1016/j.patcog.2006.12.019
Zhang, Z., Huang, H., Jiang, X., Chen, M., and Hu, J. (2011). “Analysis of the Pollution Accumulation and Flashover Characteristics of Field Aged 110kv Composite Insulators,” in 2011 Electrical Insulation Conference (EIC). (IEEE), 120–124. doi:10.1109/eic.2011.5996129
Zhao, S., Jiang, X., Zhang, Z., Hu, J., and Shu, L. (2013). Flashover Voltage Prediction of Composite Insulators Based on the Characteristics of Leakage Current. IEEE Trans. Power Deliv. 28, 1699–1708. doi:10.1109/tpwrd.2013.2257879
Keywords: remote sensing, pollution distribution map, machine learning, environmental pollution, electric power system, fusion
Citation: Ma Y, Pei Z, Ma Y, Wu B, Zhai S, Luo J and Kong P (2022) Mapping of Pollution Distribution for Electric Power System Based on Satellite Remote Sensing. Front. Environ. Sci. 10:938806. doi: 10.3389/fenvs.2022.938806
Received: 08 May 2022; Accepted: 20 June 2022;
Published: 22 July 2022.
Edited by:
Wanyun Xu, Chinese Academy of Meteorological Sciences, ChinaReviewed by:
Bin Chen, Lanzhou University, ChinaYuanjian Yang, Nanjing University of Information Science and Technology, China
Copyright © 2022 Ma, Pei, Ma, Wu, Zhai, Luo and Kong. This is an open-access article distributed under the terms of the Creative Commons Attribution License (CC BY). The use, distribution or reproduction in other forums is permitted, provided the original author(s) and the copyright owner(s) are credited and that the original publication in this journal is cited, in accordance with accepted academic practice. No use, distribution or reproduction is permitted which does not comply with these terms.
*Correspondence: Zhipeng Pei, cGVpc2lwYW5kQHdodS5lZHUuY24=