 Siqi Yang
 Gaoru Zhu
 Lixiao Zhang
 Honglei Xu1
94% of researchers rate our articles as excellent or good
Learn more about the work of our research integrity team to safeguard the quality of each article we publish.
Find out more
ORIGINAL RESEARCH article
Front. Environ. Sci. , 15 July 2022
Sec. Land Use Dynamics
Volume 10 - 2022 | https://doi.org/10.3389/fenvs.2022.935713
This article is part of the Research Topic Solutions to High-Quality Development: Theories and Practices in Ecological Aspects View all 21 articles
In recent decades, the influence of climate change and human activities on the ecosystem services (ES) in the Qinghai–Tibet Plateau (QTP) has been extensively investigated. However, few studies focus on linear traffic corridor area, which is heavily affected by human activities. Taking the Golmud–Lhasa national highway corridor as a case, this study investigated the land-use and land-cover change (LUCC) and spatiotemporal variations of ES indicators using ecosystem indices of fractional vegetation cover (FVC), leaf area index (LAI), evapotranspiration (ET), and net primary productivity (NPP) from 2000 to 2020. The results indicated that LUCC was faster in the last decade, mostly characterized by the conversion from grassland to unused land. In buffer within 3000 m, the proportions of productive areas represented the increased trends with distance. In terms of ES variations, the improved areas outweighed the degraded areas in terms of FVC, LAI, and NPP from 2000 to 2020, mostly positioned in the Qinghai Province. In addition, FVC, LAI, and NPP peaked at approximately 6000 m over time. With regard to influencing factors, precipitation (20.54%) and temperature (14.19%) both positively influenced the spatiotemporal variation of FVC. Nearly 60% of the area exhibited an increased NPP over time, especially in the Qinghai Province, which could be attributed to the temperature increase over the last two decades. In addition, the distance effects of climatic factors on ES indicators exhibited that the coincident effects almost showed an opposite trend, while the reverse effects showed a similar trend. The findings of this study could provide a reference for the ecological recovery of traffic corridors in alpine fragile areas.
Human activities have significantly influenced the ecological environment and undermined the delivery of ecosystem services (ES), which further impacts human well-being and sustainable development (Tilman and Lehman, 2001; Millennium Ecosystem Assessment (MA), 2005; Yang et al., 2020). Traffic transportation is one of the major human activities, which greatly influence the ecosystem integrity, vegetation dynamics, animal activities, biodiversity maintenance, and ES (Forman, 2000; Laurance et al., 2014; Ibisch et al., 2016). Growing evidences showed that the traffic corridors cross various ecosystem types, resulting in land-use and land-cover change (LUCC), habitat degradation, and landscape fragmentation (Freitas et al., 2010; Liu et al., 2016; Fischer et al., 2021). Compared with LUCC and landscape pattern change, ES changes are more important and helpful for ecological management (Liu et al., 2019). Under the influences of climate change and human activities, the vegetation and soil-related ecosystem indices can be the ES indicators as they are connected to energy exchange, hydrological cycle, and biogeochemical cycle (Sitch et al., 2003; Perrings et al., 2011; Sun et al., 2017). In addition, the ecosystem indices could reflect the yearly variation trends, which release the restriction of periodic land-use changes.
Over the last decades, remotely sensed data have become the most important data source for monitoring ecosystem dynamics at large scales and can be used to evaluate multiple ES (Zhang et al., 2011; Ying Liu et al., 2018). Previous studies mainly adopted indicators, such as normalized difference vegetation index (NDVI), fractional vegetation cover (FVC), and leaf area index (LAI), to describe the vegetation characteristics (Wu et al., 2014; Querin et al., 2016). On the contrary, other critical indices of ecosystem function, such as evapotranspiration (ET) and net primary productivity (NPP), are rarely considered in combination. ET is a dominant part of hydrological cycling, which reflects on the status of water use, and is tightly coupled with NPP at multiple scales (Chapin et al., 2002; Waring and Running, 2010). NPP plays an important role in carbon cycling and reflects on the quality of the terrestrial ecosystem (Field et al., 1998; Zhu et al., 2007). In practice, FVC and NPP are regarded as the indicators of carbon sequestration services as they represent the vegetation dynamics and productivity (Sha et al., 2020; Mu et al., 2021); in contrast, LAI and ET can be used as indicators of water provision service as they affect the hydraulic processes of ET, infiltration, aquifer recharge, and streamflow (Taugourdeau et al., 2014; Chang et al., 2017). As aforementioned, FVC, LAI, ET, and NPP are the key indicators in linking ecosystem functioning and climate feedbacks. Therefore, the use of remote sensing data could be an effective method for analyzing ES using multiple ecosystem indices.
The Qinghai–Tibet Plateau (QTP), known as “the Third Pole of the World” and “the Asian Water Tower,” is a global hotspot for biodiversity and alpine ecological fragile area (Favre et al., 2015). The geographical conditions of the QTP are complex, and the ecological environment is extremely fragile (Saito et al., 2009) and thus sparsely populated. The G109, G219, and G318 national highways are the main traffic routes accessing to Lhasa (the capital of Tibet), which has significantly promoted local socioeconomic development. Established studies focused on the effects of traffic activities on the landscape pattern, vegetation cover, and soil heavy metal contents in the QTP (Ding et al., 2006; Hua Zhang et al., 2015; Song et al., 2018); however, less attention has been paid to ES changes. Under the dual impacts of climate change and human activities, the vegetation and ecosystem in linear traffic corridors have significantly changed, which poses great threats to regional ecological security (Zhang et al., 2019). How to evaluate the changes in the ecosystem pattern and ES of traffic corridors and identify the influence mechanisms in the alpine fragile region has become a vital issue to be solved.
At present, the long-term ES variation trends in human-induced linear traffic area are still inadequate. Therefore, the objectives of this study were 1) to describe the land-use dynamic characteristics in corridor areas, 2) to analyze the spatiotemporal trends of ES indicators and distance differences during the 2000–2020 period, and 3) to show the effects of LUCC and the climatic factors on ES indicator variations. This research could provide the theoretical guidance for the coordinated development of transportation and ecological environment in ecologically vulnerable areas.
The Qinghai–Tibet Highway (National Highway 109) opened to traffic in 1954; at that time, it was a gravel road. It was improved into an asphalt road in 1985 and then fully upgraded in 2010. The available traffic volume data started in 2003, with the average daily equivalent of 3904 in 2003, which then increased to 9390 in 2020. The Golmud–Lhasa highway section is the most critical section of National Highway 109. The total length of the Golmud–Lhasa highway corridor (GLHC) is 1131 km, covering 10-km buffer zones on each side of the highway; thus, the total area is 22270 km2 and the elevation range is 2755–6210 m (Figure 1A, 29.55–36.49°N, 90.43–95.03°E). There are various ecosystem types distributed in the GLHC, including shrubland, grassland, steppe, and meadow. The regional climate of QTP is complex, including tropical humid, temperate semi-humid plateau monsoon, and cold temperate semi-arid plateau climates; therefore, the climatic condition of the study area is diverse. The precipitation in QTP is affected by the climate and mountains, with significant spatial differences (Renhe Zhang et al., 2015). Furthermore, the temperature in QTP is negatively correlated with latitude and altitude, the diurnal temperature range is wide, and the interannual variation is narrow (Yang et al., 2021). Based on the traffic volume monitoring and policy intervention of the Grain for Green Project (GGP), there are more human activities after 2000; thus, we selected the time intervals of 2000, 2010, and 2020 to achieve our objectives. According to the data preprocessing results, the annual average precipitation in the 2000–2020 period was 33.6–539.1 mm, decreasing from southwest to northeast. Moreover, in the 2000–2020 period, the annual average temperature was −16.7–8.5°C, decreasing from both ends to the middle. In addition, the precipitation and temperature trends in recent decades showed obvious spatial characteristics (Figure 1B).
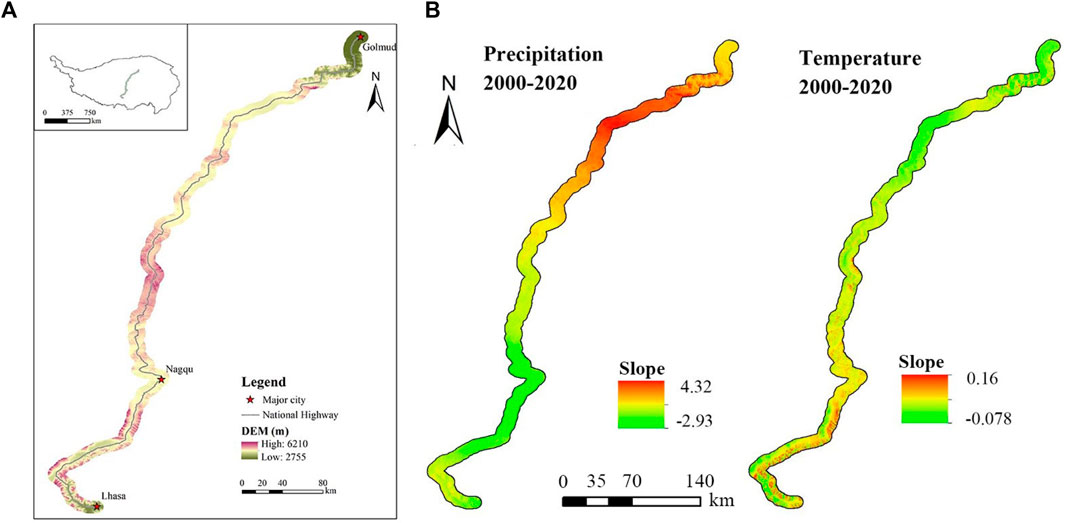
FIGURE 1. Location of the Golmud—Lhasa national highway corridor (A) and climate change from 2000 to 2020 ((B), the slope was calculated using the Theil—Sen estimator).
The prepared dataset in this study included the LUCC map, road map, remote sensing products of vegetation and ecosystem indices, and climate data. We listed the detailed information in Table 1.
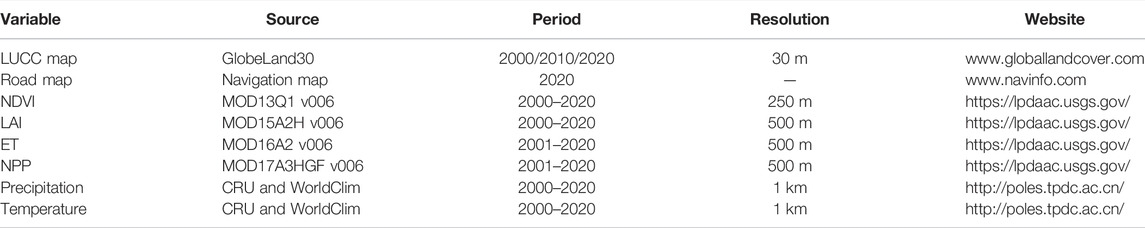
TABLE 1. Data introduction and sources.
GlobeLand30 is a global land-use dataset with medium resolution. In this study, we selected seven land types from Google Earth Engine, which included cropland, forest, shrubland, grassland, water body, construction land, and unused land. The road data only included the national highway, considering the long-term existence and more human activities than in railway and expressway. FVC corresponds to the fraction of ground covered by green vegetation. It describes the vegetation proportion by scaling NDVI according to NDVI maximum and NDVI minimum (Eq. 1).
LAI is an indicator of vegetation greenness, and the satellite-derived value corresponds to the total green LAI of all the canopy layers; thus, it can quantify the thickness of the vegetation cover. ET is a key process indicator of terrestrial ecosystems and also a proxy for vegetation condition monitoring. NPP is an indicator of ecosystem productivity, which is equal to the difference between gross primary productivity and respiration. All the ES indicator data were used on a yearly scale.
In this study, the yearly NDVI and LAI datasets were aggregated by using the maximum-value composite method, which could reduce the effects of atmospheric interference and cloud issues on values (Van Leeuwen et al., 1999), whereas ET and NPP were aggregated by sum calculation. Considering data availability, FVC and LAI were derived from 2000 to 2020, whereas ET and NPP were derived from 2001 to 2020. These datasets were resampled at 500 m × 500 m according to the resolution of most remote sensing indices and the distance intervals.
To describe land-use change, we first compared the areas of each land-use type in 3 years and calculated the change rate over time. Then, we used the land-use transfer matrix method to reflect the main area transitions between land-use types in two periods. To distinctly show the transferred pairs and magnitude, a chord graph was applied. In addition to the whole variation, we employed buffer analysis to calculate the variation trend of the area proportion of each land-use type with the gradient buffer distances of 500–10,000 m in different years.
The interannual trends of FVC, LAI, ET, and NPP from 2000 to 2020 were determined through the nonparametric Mann–Kendall (MK) statistical test. The MK test is a rank-based method that is useful for detecting nonlinear trends (Kendall, 1975), and it has been widely applied to detect the trends of hydrological and meteorological variables in time-series analysis (Hamed, 2008). In this study, we set the significant confidence interval to 95% (p < 0.05).
The MK statistical test for monotone trend is defined in Eqs. 2–4.
where sgn is the sign function, Zi to Zj is the dataset of the time-series data, p is the number of tied groups in the dataset, and tj is the number of data points in the jth tied group. Furthermore, if n is large, T is approximately normal.
The significance of trends can be tested by comparing the standardized variable U in Eq. 5 with the standard normal variate at the significance level α (Kendall, 1975).
where U > 0 indicates an upward trend, whereas U < 0 denotes a downward trend.
The Theil–Sen estimator is a robust model of a fitted line in nonparametric statistics by choosing the median of the slopes of all lines through pairs of points (Akritas et al., 1995). We used the Theil–Sen estimator to quantify the variation trend of ecosystem indices and reflected the change magnitude in specific periods. The positive estimated value indicates an upward trend, whereas the negative value represents a downward trend (Eq. 6).
where 1 < j < i < n; if β > 0, it indicated an upward trend, otherwise, it indicated a downward trend.
The above time-series analysis revealed the spatial pattern of temporal variation in ES indicator dynamics. To describe the distance trend, we calculated the mean values of each ES indicator in 500–10000-m buffers and then used the heatmap graph to distinctly represent the temporal and distance trends.
The variations of the ES indicators were impacted by land use and climate change. Considering land-use type as a categorical variable, overlay analysis is more feasible to detect the qualitative effect on the different levels of ecosystem indices. Corresponding to static LUCC maps, the ES indicators in 2000/2001, 2010, and 2020 were reclassified using the natural breakpoint method in ArcGIS 10.8, and the classified criteria were consistent in different years for each ES indicator. Then, the Tabulate Area tool was used to conduct the mean-value raster overlay analysis to qualitatively reflect the distribution of high–low ES indicator values in each land-use type.
In pixel-level time-series analysis, multivariate regression was used to determine the impact of long-term climate change on the variations of the ES indicator. Using the annual precipitation and average annual temperature as the explanatory variables as well as ES indicators as the dependent variables, multiple linear regression equations were constructed and tested. Statistical significance was calculated using p-values at a 95% (p < 0.05) confidence interval.
where yi is the ES indicator, x1 is the annual precipitation, x2 is the average annual temperature, β1 and β2 are the slope coefficients for each explanatory variable, β0 is the constant term of the y-intercept, and ϵ is the error term. We summarized the positive and negative areas to reflect the influence strengths.
After determining the individual influence roles of precipitation and temperature by partial regression coefficients, we used ordinary least squares regression and quadratic polynomial regression to describe the direction and strength change of climatic controls with the buffer distance increased.
During the study period, the change rates of most land-use types were stronger in 2010–2020 than in 2000–2010 (Figure 2A). According to the different temporal variations of each land-use type, forest, shrubland, and grassland showed relatively slight rate variations over time, although the quantity variation of grassland in 2010–2020 was obvious. In contrast, cropland, construction land, unused land, and water body showed obvious rate and quantity variations, at least in one period. Due to the small total area of cropland, the change proportions were larger than others in the same period. Construction land and unused land significantly increased from 2010 to 2020.
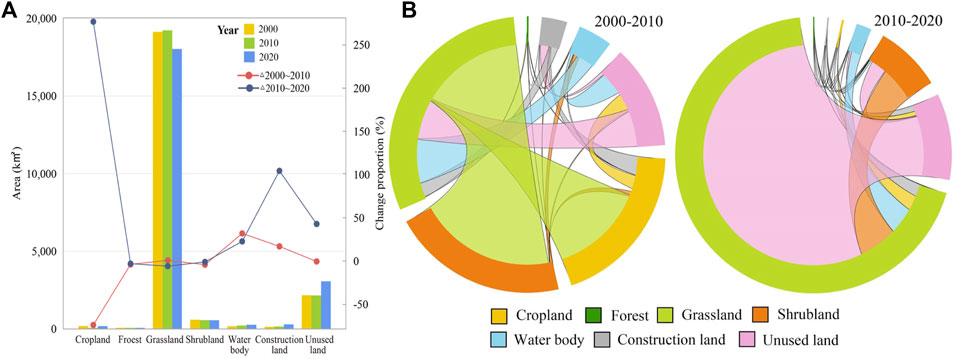
FIGURE 2. Land-use change and land-use transition in the Qinghai–Tibet Highway corridor. The chord graph intuitively represents the transitions between different land-use types, the width of the land-use section represents the area of land use (A,B), and the transparent colors represent the finally gained land use after the mutual transitions between two land-use types.
From the perspective of land-use transition, we used the chord graph to visualize traditional land-use transition matrix (Figure 2B). From 2000 to 2010, the large areas of grassland transformed into unused land, construction land, and water body, whereas more than half of the grassland replenishment were derived from shrubland and cropland. In addition, the construction land replenishment was derived from grassland and unused land. From 2010 to 2020, the large proportion of grassland transformed into the other land-use types, especially for unused land and shrubland.
The proportions of each land-use type varied with the buffer distance in 3 years (Figure 3). There were obvious temporal variations of cropland proportion with the buffer distances, which showed an overall descending trend in 2000 and 2020 and an overall upward trend in 2010 (Figure 3A). Forest, grassland, and shrubland showed an overall upward trend, with the slightest temporal variations (Figures 3C,D), and grassland, shrubland, water body, and unused land attained the maximum value in the 2000–3000-m distance (Figures 3C,E,F). Unused land mainly showed a continuous upward trend, especially in the buffer distance of 1000 to 2000 m. In addition, the increased rate was stronger in 2020 than the other years (Figure 3G). In general, only cropland showed obvious differences each year. Among the land-use types with a declining quantity from 2010 to 2020, the area far from the road has a faster decreasing trend, i.e., grassland and shrubland.
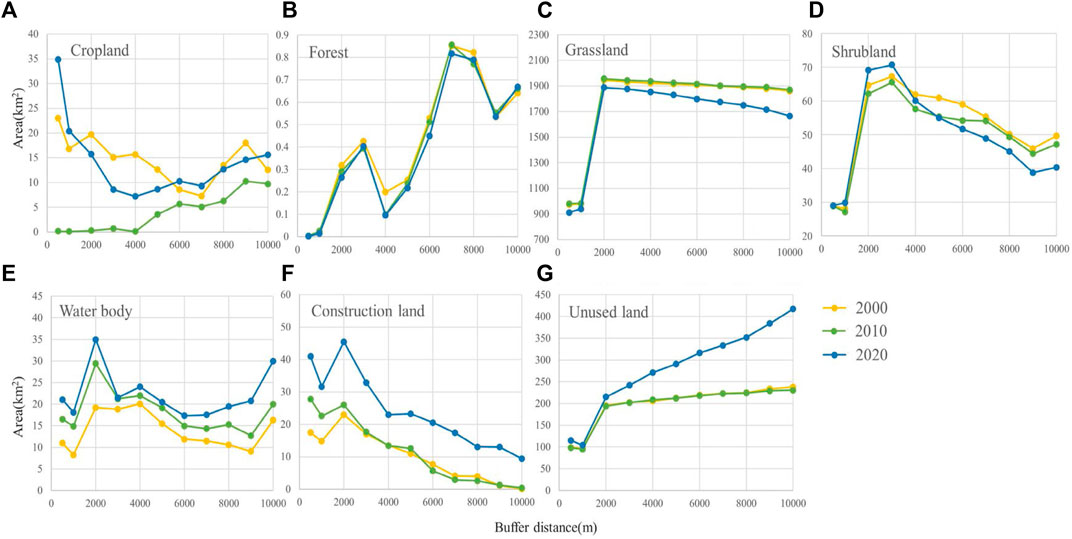
FIGURE 3. (A) Cropland; (B) Forest; (C) Grassland; (D) Shrubland; (E) Water body; (F) Construction land; (G) Unused land.
Using the long-term time-series moderate resolution imaging spectroradiometer remote sensing products, we calculated the pixel-level temporal trend of each ES indicator. Through the analyses of Sen’s slope and MK test, the results showed a distinct spatial differentiation of the FVC trend during 2000–2020, which was represented as the increased area (16.9%) mainly in the northeast and the decreased area (1.3%) mainly in the southwest and other scattered areas (Figure 4A). Compared with FVC, the significantly changed area was reduced in the LAI trend, especially in the northeast, which was represented by the increased area (8.0%) mainly in the central to the northwest and the decreased area (3.5%) mainly in the central to the southwest (Figure 4B). ET showed the least-obvious trend, in which the increased area (5.1%) was mainly in the northeast and southwest and the decreased area (0.5%) mainly in the southwest (Figure 4C). NPP had the most significant spatial differentiation, which was represented as the increased area (59.8%) mainly in the central and northeast and the decreased area (1.0%) mainly in the southwest (Figure 4D).
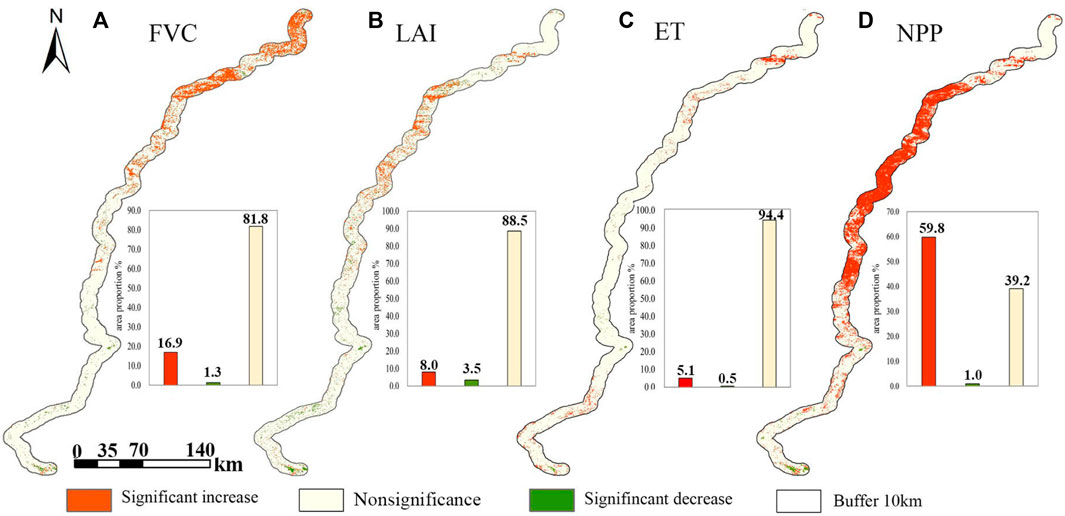
FIGURE 4. Variation trends of ecosystem service indicators and significance tests in the study period. ((A) FVC; (B) LAI; (C) ET; (D) NPP).
Each ES indicator showed obvious temporal and distance variations (Figure 5). From the perspective of temporal variation, FVC showed an overall upward trend; in particular, it attained the maximum value in 2018 and the minimum value in 2015, and there were fluctuations between different periods. The situation of LAI was similar to that of FVC; in particular, it attained the maximum value in 2020 and the minimum value in 2007 and 2015. ET showed no obvious variation trend and attained the maximum value in 2011. NPP showed an upward trend after 2016; in particular, it attained the maximum value in 2020 and the minimum value in 2007 and 2008. From the perspective of distance variation, FVC in different years showed a similar trend, that was the maximum ranged between 3000 and 6000 m with infinitesimal inter-annual differences. LAI also had relatively consistent temporal characteristics, which attained the maximum value in 6000 m, especially in 2015–2020. ET showed a similar trend in different years, contrary to FVC and LAI; the maximum value was attained at approximately 2000 m, which then decreased with the increasing distance. NPP was similar to FVC, and the maximum range occurred in 2000–6000 m with an infinitesimal difference. In summary, ET had the most distinctive trend, and FVC and NPP had the most similar trends of temporal and distance variations.
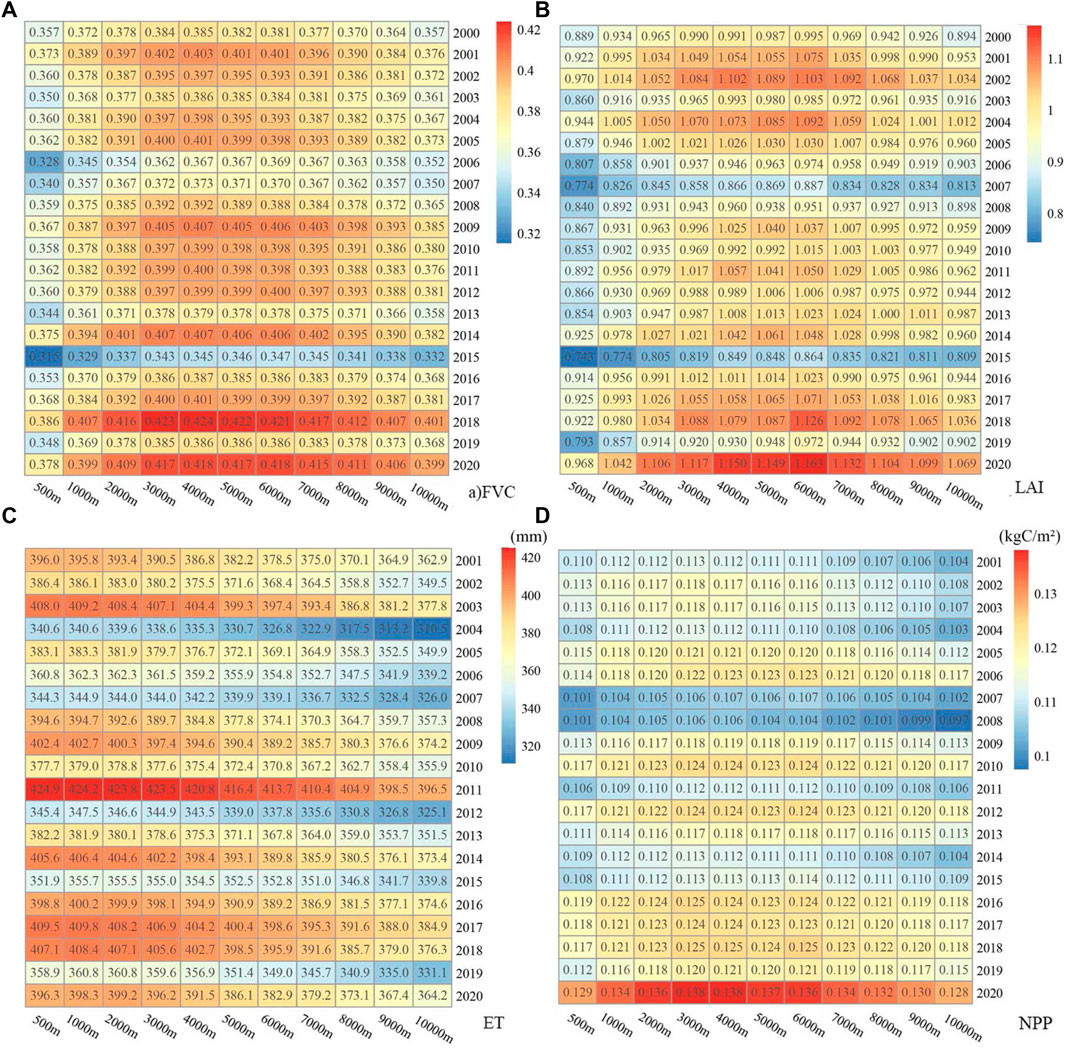
FIGURE 5. Ecosystem service indicator variations across time and distance. ((A) FVC; (B) LAI; (C) ET; (D) NPP).
Figure 6 presents the variations of relative area proportions between the hierarchical levels of indices from 2000 to 2020. In the study area, the area of grassland was dominant, whereas forest was rare. The high-value ES indicators of cropland were mainly decreased over time. For FVC, there were more moderate to high values in grassland and more high values in shrubland with little temporal variation, whereas in unused land, the domination of low value decreased with time; especially in 2020, the high-value area demonstrated an obvious increase (Figure 6A). For LAI, the low- and high-value proportions of grassland was decreased over time, the low- and high-value proportions of unused land was increased over time, whereas other land-use types changed negligibly (Figure 6B). For ET, the high value of grassland was obviously decreased over time, whereas the high values of shrubland and unused land were obviously increased over time (Figure 6C). For NPP, the high value of grassland was increased over time, whereas the high value of shrubland was decreased over time; all levels of unused land were increased over time (Figure 6D).
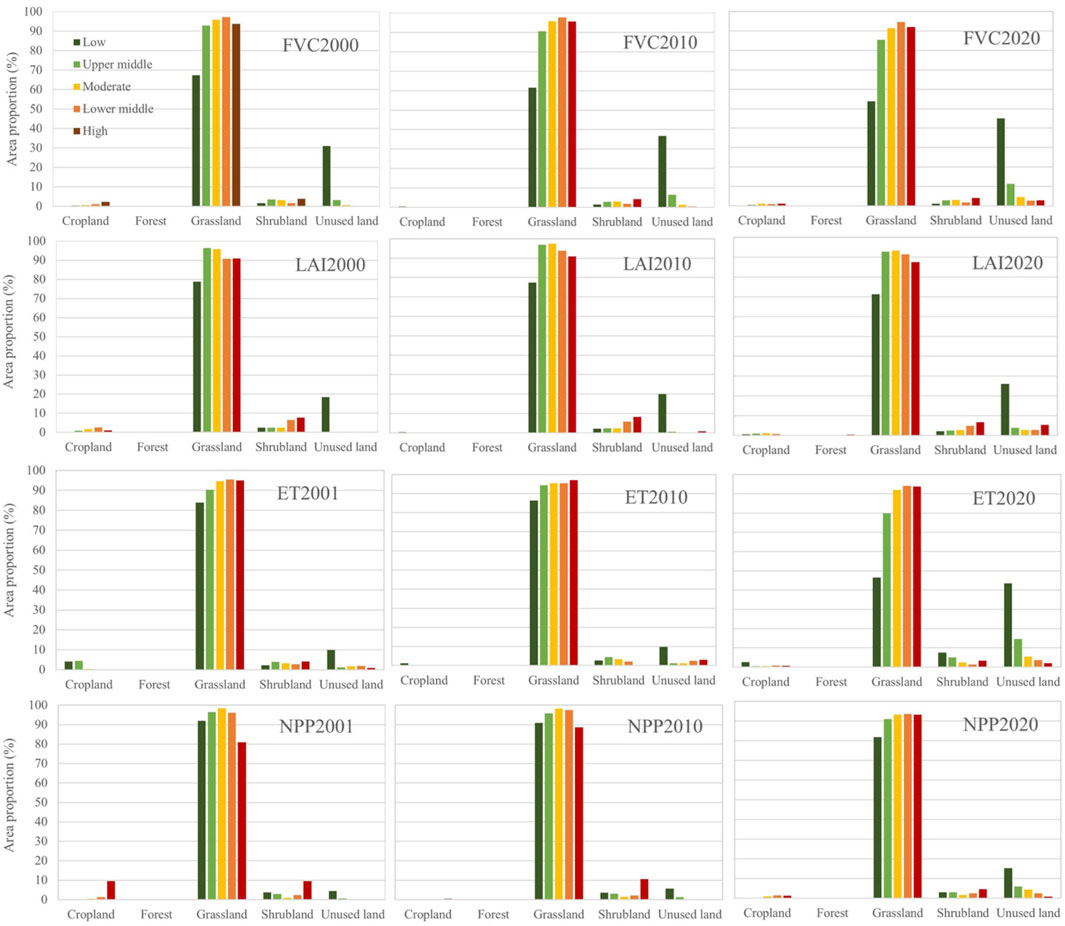
FIGURE 6. Influence of land-use types on multiple ecosystem service indicators during 2000–2020.
Using multiple spatial regression methods, we identified the climatic controls on the temporal–spatial variations of the ES indicators (Figure 7). The results showed that precipitation explained more positive influences in FVC (20.54%) and LAI (3.52%), ET (18.71%) than temperature, while explained more negative influence in NPP (12.03%). With regard to temperature, it explained more negative influences in FVC (7.03%), LAI (2.23%), and ET (4.42%) and a more positive influence in NPP (13.95%). From the spatial perspective, the effects of precipitation and temperature on FVC and LAI were relatively consistent, except for the southwest part, whereas in the middle and southwest parts, ET and NPP showed opposite effects of precipitation and temperature. The results of decision coefficient (R2) showed that the model performances of ET and NPP were better, whereas the performance of LAI was relatively poor.
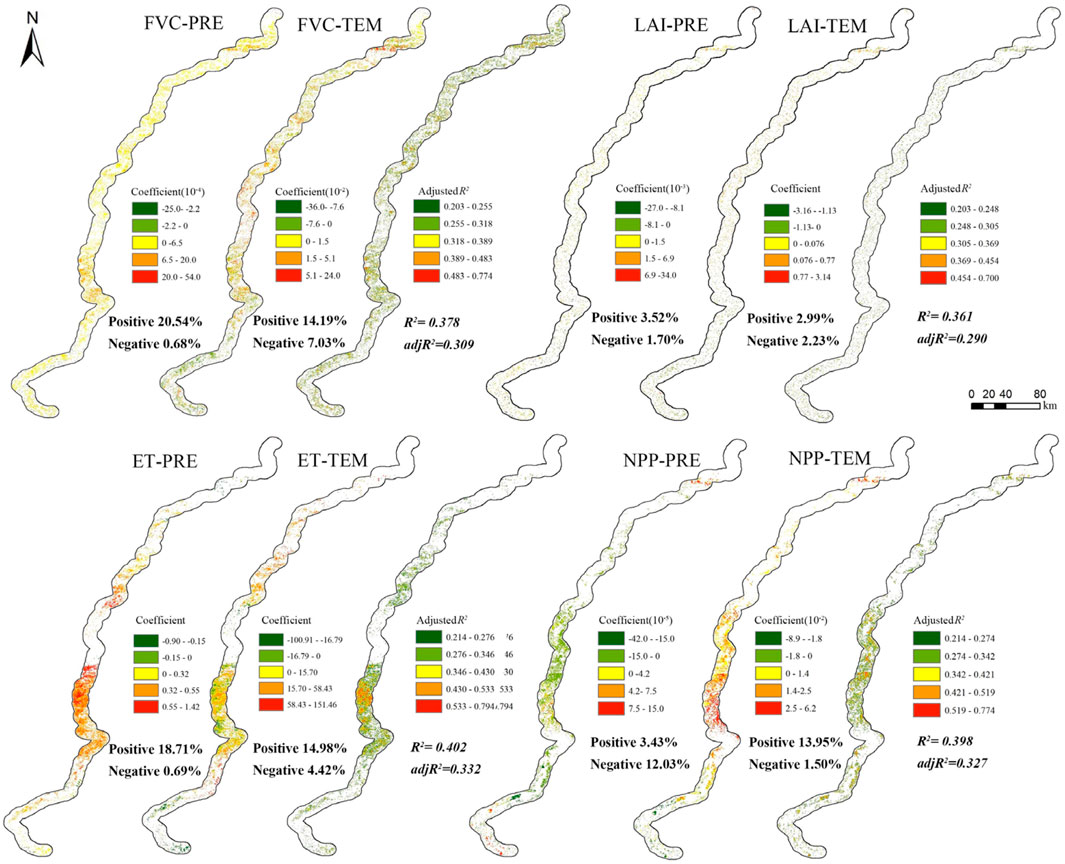
FIGURE 7. Variation trends of ecosystem service indicators against climate change.
We calculated the variation trends of the regression coefficients with the buffer distances. By using linear and polynomial models, eight models were significant to reflect the influencing strengths and directions along with the distance gradient (Figure 8). From the influences of precipitation on the ES indicators, there were overall downward trends on FVC and ET and partial downward trends with the turning point of 7000 m on LAI and NPP. Regarding temperature, the ES indicators increased with the increasing distance, except for ET, and there existed the turning point of 3000 m in ET. In general, the distance trends of precipitation and temperature in FVC and ET showed nearly opposite directions, whereas in LAI and NPP, they showed similar strength change with contrasting influence directions (negative or positive).
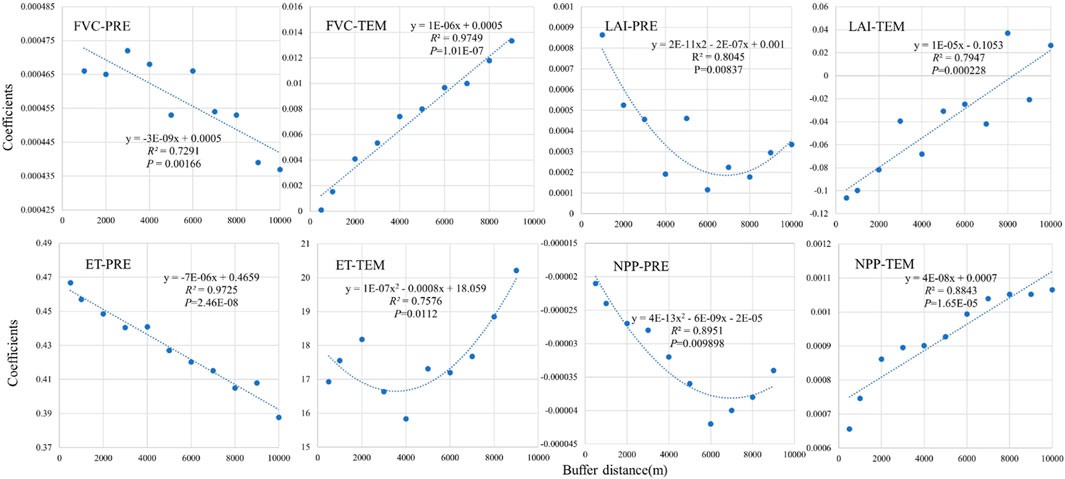
FIGURE 8. Regression coefficients of ecosystem service indicators against climate change in buffer distances. The outliers were removed to derive the better trends.
The land-use change was more obvious in 2010–2020, which reflects the increasing human activities and climate change (Cui and Graf, 2009). As for the relative stability in 2000–2010, this is due to little human interference and mild climate change. The phenomenon that a large proportion of grassland is transformed into unused land may be due to overgrazing, which not only directly eliminates the biomass of grassland but also results in soil compaction and trait deterioration, thus hindering the growth of grass (Niu et al., 2019; Yang and Sun, 2021). As to cropland change, it showed an obvious decrease in 2010 and an obvious increase in 2020; this could be related to the policy of the GFGP since 2002 (Xin, 2008). The reason for the cropland increase may be attributed to the growing orchard plants (which is one of the cropland types in the GlobeLand 30 data) or land reclamation in the high-altitude region (Wu et al., 2021). Among the land-use types, only the cropland proportion showed the significantly inter-decadal distance trends (Figure 3A). After the GFGP implementation, the previous indistinct variation of cropland turned into an upward trend with a distance increase, especially after 4000 m in 2010 and 2020. It has a finding similar to Zheng et al. (2021), who also identified 4000 m as a turning point and found that the increasing rate is slower after 4000 m; however, in this study, only in 2020, the finding exists. The descending turning point of shrubland was 3000 m with a minor inter-decadal difference, which reflected the few human activities on shrubland. For construction land, the downward trend was slower in 2020 than in previous years, which indicated the increasing human activities over time.
Vegetation dynamic analysis revealed that the middle to the northeast part of FVC and the northcentral part of LAI were increased during 2000–2020 (Figures 4A,B). LAI is mainly used to describe vegetation structure characteristics; in general, the LAI of cropland and forest is higher than that of grassland. Thus, the northeast part of LAI not showing a significant increase might be due to the large proportion of grassland and unused land. Many studies found that LAI and NDVI exist in multiple functional relationships for different vegetation types (De Peppo et al., 2019; Rees et al., 2020). However, the LAI decreased area of the southwest part was larger than FVC decreased area (Figures 4A,B), which is partly due to the reduced cropland proportion in 2000–2010. The inconsistent spatial distribution for the FVC and LAI variations is probably because of the grass species difference, land-use transformation of GFGP, and environmental pressure on the carbon sequestration process (Zhang W. et al., 2021).
As for ET, a previous work demonstrated that it was increased overall during 1982–2016 in QTP, with a decreased spatial pattern from southeast to northwest (Ma and Zhang, 2022). In this study, the mainly increasing area was in the northeast and southwest (Figure 4C), which is also the high-temperature area. In the northeast, the significantly increased precipitation and the high solar–thermal status induced the increased ET, whereas in the southwest, precipitation was not increased, but the high solar–thermal status and land use of shrubland resulted in increased ET. NPP is closely linked to ET, in which the carbon cycle through vegetation canopy stomata impacts ecosystem productivity (Kang et al., 2016). Over a half area in this study showed a significantly increasing trend (Figure 4D), which is consistent with the overall increasing trend of NPP in QTP (Han et al., 2018; Yang et al., 2019; Zhang W. et al., 2021). In general, NPP and NDVI have positive correlations (Liu et al., 2021); the inconsistency between NPP and FVC indicates that the climate and vegetation species significantly differed in the long-distance linear region, therefore the relationship between NPP and FVC was not obvious. The consistent areas among the significantly increased area of ET and NPP indicated the positive relationships between the actual ET and terrestrial productivity (Ma and Zhang, 2022).
By comprehensively analyzing each ES indicator variation with the increasing time and buffer distance, several similar findings were obtained, such as the distance turning points of FVC, LAI, and NPP (Figure 5). Overall, the maximum value of these ES indicators was approximately 6000 m, whereas the maximum value of ET was within 2000 m. The downward shift of the ET maximum could be explained by the distribution of the water body, which is mainly positioned near the highway; in general, the ET of water body is large (Liu et al., 2020). The lower values of each index in 2015 are partly due to the reduced precipitation and temperature in this year. Comparing the ES indicators in 500 m and in 500–1000 m, the former was significantly inferior to the latter in terms of FVC, LAI, and NPP, which indicates that the intense impact on the ecosystem is within 500 m in QTP, and the ecosystem status gradually recovered as the distance increased. In addition, the 500-m distance is constrained by the data resolution; thus, it may be less by using finer data. In areas near the highway, lots of abandoned waste, materials, and gases are generated by asphalt mixture during road paving. This increases traffic volume and causes soil contamination and compaction, thus inhibiting the growth of vegetation (Jaworska and Lemanowicz, 2019; Gao et al., 2020). After 500 m, the disturbance was decreased, and vegetation gradually recovered under climate change. In addition, wind transportation may contribute to Nitrogen added topsoil and plant seed dispersal (Cheng and Chen, 2002); thus, areas located within 6000 m showed upward trends.
LUCC is one of the dominant factors that influence vegetation and ecosystem function (Mu et al., 2013). Through the overlay analysis of LUCC and ES indicators, the qualitative relationships between them were derived (Figure 6). The distinct time variations of FVC and LAI in grassland and unused land reflect the enhanced canopy cover of grass and desert plants and the increased growth rate of cropland, which is primarily due to the increasing role of the increased temperature and anthropogenic cultivation. In ET and NPP, except for forest, the other land-use types showed obvious differences. The increased area of unused land was mainly distributed in the low-value ET area, which indicates that the position of the gained unused land is relatively far from the national highway according to the previous results. For NPP, the high-value area of cropland and shrubland was decreased, whereas that of grassland and unused land was increased, indicating the larger contributions of grassland and unused land to increasing NPP over time. Previous works confirmed the dual effects of human activities and climate change on increasing NPP, especially after 2000; however, it is still necessary to pay more attention to the ecological balance between species (Wang et al., 2013; Chen et al., 2014).
Precipitation and temperature are fundamental driving forces for ecosystem process change and vegetation distribution as well as productivity in QTP (Huang et al., 2016; Liu et al., 2021; yin Zhang et al., 2021). To analyze the climatic controls on each ES indicator, spatial multiple regression analysis is a better choice than spatial correlation analysis owing to the former’s causal explanatory power. The less climatic influences on the ES indicators in the northeast part are partly due to the offset effects by human activities. This area belongs to Golmud, which is the largest logistics distribution center, where the different types of human activities could generate. In the middle part, FVC and ET were positively influenced by meteorological factors, and the positive influence of precipitation was higher than that of temperature. The FVC result is consistent with that obtained by Mu et al. (2021), because precipitation is the main constraining factor of vegetation distribution in the semi-arid region of QTP. In the NPP significantly changed area, temperature was the dominant factor, which showed a more positive influence in the middle part. The NPP result is consistent with that obtained by Gao et al. (2013), who demonstrated that temperature temporal change accounts for 80% of the interannual change in vegetation NPP during 2001–2008 in QTP. It could also be explained by the changed ecosystem structure. Huiying Liu et al. (2018) found the long-term climate warming from 1983 to 2014 in QTP, which resulted in high grass abundance. In the southwest part, precipitation was explained by more NPP change, with an almost contrasting trend to temperature due to the relative water shortage (Yang et al., 2019).
According to the distance trends of climatic influences, it is noted that the increased control of temperature with distances occurred in FVC, LAI, and NPP (Figure 8). This phenomenon conformed well to the distance trends of temperature, which indicated that temperature plays an important role in different zones of the buffer. Regarding precipitation, the U-type trend occurred in LAI and NPP with a 7000-m threshold, which showed the increased negative effects of precipitation on NPP within 7000 m. This is probably because the higher soil water content in the freezing-thawing area near traffic infrastructure (Wu et al., 2003); therefore, when the precipitation increased with the road distance (calculated by data), the soil water content decreased more than the precipitation increased, resulting in the decrease of NPP. This study speculates that with the increasing distance far from the road, NPP and precipitation will gradually show a positive correlation (Xu et al., 2006; Yang et al., 2019).
In GLHC, the natural environment in the middle part is relatively harsh, and the socioeconomic level is relatively low (Danggula Mountains Town and Amdo County). In the two end parts of the GLHC (Golmud City and Lhasa City), human activities increased, and few areas showed improved ES indicators. Overall, except for Golmud City, the section of the Qinghai Province showed better vegetation restoration dynamics and productivity-improved status, which can increase regional carbon sequestration service. There were few areas of increased ET and LAI; thus, the change in water provision service is dominated by precipitation. In Tibet Autonomous Region, the increasing human activities and the construction of the Nagqu–Lhasa expressway section (since 2017) might become the key factors restricting vegetation restoration. Regarding this, evidence showed the negative effect of standoff distance between roads and railways on animal activities in QTP (Wang et al., 2021). The impact of landscape fragments on vegetation dynamics has a time lag effect. It can be speculated that three parallel linear traffic infrastructures (national highway, railway, and expressway) might form a local microclimate, which will cause the cumulative weakening effects.
From the buffer analysis, the vegetation recovered well at approximately 3000–6000 m from the national highway, which can provide more carbon storage in this region. There are typical desert and grassland ecosystems along the highway. According to the established vegetation restoration on both sides of the highway, the natural restoration method is more feasible and effective than the artificial method. To achieve the multiple ES, such as water conservation, carbon sequestration, and soil retention, in this case, human intervention is needed to eliminate invasive sedge species or reseed superior local grass species to balance natural ecosystems (Chen et al., 2014). Moreover, the recovery of roadside vegetation is partly due to the water collection and ventilative soil conditions on the sides of the road. Because the survival rate of artificial grass is lower in roadside areas, adopting stripped turf is prioritized to restore the bare land surface. For the bare surface with better hydrothermal conditions, artificial seeding of grass seeds can be appropriately adopted to increase the soil retention ability.
In previous decades, to ensure that the QTP national highway is operating well, the Chinese government spent huge investments to renovate the highway four times. However, due to the negative influences of the abandoned soil mound and types of wastes on both sides of the highway, the soil is contaminated by heavy metals, vegetation undergoes degradation, and landscape aesthetics is lost. Therefore, government monitoring and recovery efforts should be duly strengthened.
This study analyzed the influences of buffer distance on land-use change, ES indicator variations, and their climatic influences, which provide the scientific support for vegetation recovery and ecological management along with the traffic infrastructures. However, there are several limitations as follows. First, the spatial resolutions of data are different, which may mask the fine changes by coarse data, and the distance variations of climatic influences may be weakened within 1 km due to the resampling process. Second, the impact of sensors should be considered. A previous study has identified the issue of sensor degradation and overcorrection of the algorithm, which interfered with the accuracy of vegetation indices inversion, further resulting in the possible spatial errors (Tian et al., 2015). It can be more accurate by using multiple data resources and conducting the consistency analysis. Third, some environmental factors, such as radiation, elevation, and landscape pattern, are not taken into consideration. Further studies are encouraged to detect the interaction effects between various types of impact factors. Fourth, this study focused on the differences in first-level LUCC classification, which are not consider the differentiation characteristics of vegetation types, further studies could pay attention to discriminating the contributions. Last but not least, other ES, such as soil conservation, biodiversity maintenance, and aesthetic value, should be further determined (Jin et al., 2021) to fully understand the change in comprehensive ES.
This study aimed to investigate the ES indicator variations and the driving factors in the alpine linear traffic corridor area. On one hand, it fills the gap of ES topic in the linear area dominated by traffic activities; on the other hand, it discriminates the driving mechanism by climatic factors and distance effect in such a long-span linear region with different natural and socioeconomic conditions. It was found that LUCC was faster in the last decade, most likely due to the conversion from grassland to unused land. In buffer within 3000 m, the productive areas represented increasing trends with distance. Among the ES indicators, the increased FVC area was positively influenced by the enhanced precipitation and temperature in the Qinghai Province. NPP significantly increased, especially in the Qinghai Province, which could be attributed to the temperature increase over the last two decades. Nearly 60% of the area exhibited an increase in NPP over time, whereas a degraded status was observed in Lhasa and Nagqu, which is partly due to the expressway construction (Nagqu–Lhasa Expressway). Temperature was the main driving factor of NPP in the middle part, and the impact degree tended to increase with increasing distance. The control of precipitation on NPP exhibited a U-type negative trend with increasing distance. This is probably due to larger soil water content near the highway caused by the freezing–thawing process, which offsets the effect of increased precipitation with increasing distance. Further studies should be directed to the relevant topics to instruct the ecological recovery in linear traffic corridor areas of QTP. Overall, this study could provide practical information to guide various preservation efforts for the linear traffic construction in alpine fragile areas.
The raw data supporting the conclusion of this article will be made available by the authors, without undue reservation.
SY: Data curation, Methodology, Visualization, Writing—original draft. GZ: Supervision, Writing—review and editing. LZ: Writing—review and editing. HX: Writing—review and editing. JC: Writing—review and editing.
This research is financially supported by the Natural Science Foundation of China (Nos. 41601105 and 42071288); Key Science and Technology Project of Transportation Industry (Nos. 2018-MS5-127 and 2020-MS4-113).
The authors declare that the research was conducted in the absence of any commercial or financial relationships that could be construed as a potential conflict of interest.
All claims expressed in this article are solely those of the authors and do not necessarily represent those of their affiliated organizations or those of the publisher, the editors, and the reviewers. Any product that may be evaluated in this article or claim that may be made by its manufacturer is not guaranteed or endorsed by the publisher.
Akritas, M. G., Murphy, S. A., and Lavalley, M. P. (1995). The Theil-Sen Estimator with Doubly Censored Data and Applications to Astronomy. J. Am. Stat. Assoc. 90, 170–177. doi:10.1080/01621459.1995.10476499
Chang, X., Zhao, W., Liu, B., Liu, H., He, Z., and Du, J. (2017). Can Forest Water Yields Be Increased with Increased Precipitation in a Qinghai Spruce Forest in Arid Northwestern China? Agric. For. Meteorol. 247, 139–150. doi:10.1016/j.agrformet.2017.07.019
Chapin, F. S., Matson, P. A., Mooney, H. A., and Vitousek, P. M. (2002). Principles of Terrestrial Ecosystem Ecology.
Chen, B., Zhang, X., Tao, J., Wu, J., Wang, J., Shi, P., et al. (2014). The Impact of Climate Change and Anthropogenic Activities on Alpine Grassland over the Qinghai-Tibet Plateau. Agric. For. Meteorol. 189-190, 11–18. doi:10.1016/j.agrformet.2014.01.002
Cheng, H., and Chen, Z. (2002). The Feasibility of Natural Vegetation Restoration along Qinghai-Tibet Railway Desert Area. China Railw. (11), 52–54. (in Chinese). doi:10.19549/j.issn.1001-683x.2002.11.016
Cui, X., and Graf, H. F. (2009). Recent Land Cover Changes on the Tibetan Plateau: a Review. Clim. Change 94, 47–61. doi:10.1007/s10584-009-9556-8
De Peppo, M., Dragoni, F., Volpi, I., Mantino, A., Giannini, V., Filipponi, F., et al. (2019). “Modelling the Ground-LAI to Satellite-NDVI (Sentinel-2) Relationship Considering Variability Sources Due to Crop Type (Triticum Durum L., Zea mays L., and Medicago Sativa L.) and Farm Management,” in Proceeding of the Remote Sensing for Agriculture, Ecosystems, and Hydrology XXI, October 2019 (SPIE-SOC Photo-Optical Instrumentation Engineers), 111490I.
Ding, M., Zhang, Y., Shen, Z., Liu, L., Zhang, W., Wang, Z., et al. (2006). Land Cover Change along the Qinghai-Tibet Highway and Railway from 1981 to 2001. J. Geogr. Sci. 16, 387–395. doi:10.1007/s11442-006-0401-y
Favre, A., Päckert, M., Pauls, S. U., Jähnig, S. C., Uhl, D., Michalak, I., et al. (2015). The Role of the Uplift of the Qinghai‐Tibetan Plateau for the Evolution of Tibetan Biotas. Biol. Rev. 90, 236–253. doi:10.1111/brv.12107
Field, C. B., Behrenfeld, M. J., Randerson, J. T., and Falkowski, P. (1998). Primary Production of the Biosphere: Integrating Terrestrial and Oceanic Components. science 281, 237–240. doi:10.1126/science.281.5374.237
Fischer, R., Taubert, F., Müller, M. S., Groeneveld, J., Lehmann, S., Wiegand, T., et al. (2021). Accelerated Forest Fragmentation Leads to Critical Increase in Tropical Forest Edge Area. Sci. Adv. 7, eabg7012. doi:10.1126/sciadv.abg7012
Forman, R. T. T. (2000). Estimate of the Area Affected Ecologically by the Road System in the United States. Conserv. Biol. 14, 31–35. doi:10.1046/j.1523-1739.2000.99299.x
Freitas, S. R., Hawbaker, T. J., and Metzger, J. P. (2010). Effects of Roads, Topography, and Land Use on Forest Cover Dynamics in the Brazilian Atlantic Forest. For. Ecol. Manag. 259, 410–417. doi:10.1016/j.foreco.2009.10.036
Gao, Y., Zhou, X., Wang, Q., Wang, C., Zhan, Z., Chen, L., et al. (2013). Vegetation Net Primary Productivity and its Response to Climate Change during 2001-2008 in the Tibetan Plateau. Sci. Total Environ. 444, 356–362. doi:10.1016/j.scitotenv.2012.12.014
Gao, J., Zhang, M., Hu, Z., and Shan, W. (2020). Influence of Expressway Construction on the Ecological Environment and the Corresponding Treatment Measures: a Case Study of Changyu (Changchun-Fuyu Lalin River) Expressway, China. Nat. Environ. Pollut. Technol. 19, 1195–1201. doi:10.46488/nept.2020.v19i03.033
Hamed, K. H. (2008). Trend Detection in Hydrologic Data: The Mann-Kendall Trend Test under the Scaling Hypothesis. J. Hydrology 349, 350–363. doi:10.1016/j.jhydrol.2007.11.009
Han, Z., Song, W., Deng, X., and Xu, X. (2018). Grassland Ecosystem Responses to Climate Change and Human Activities Within the Three-River Headwaters Region of China. Sci. Rep. 8 (1), 1–13. doi:10.1038/s41598-018-27150-5
Hua Zhang, H., Wang, Z., Zhang, Y., Ding, M., and Li, L. (2015). Identification of Traffic-Related Metals and the Effects of Different Environments on Their Enrichment in Roadside Soils along the Qinghai-Tibet Highway. Sci. Total Environ. 521-522, 160–172. doi:10.1016/j.scitotenv.2015.03.054
Huang, K., Zhang, Y., Zhu, J., Liu, Y., Zu, J., and Zhang, J. (2016). The Influences of Climate Change and Human Activities on Vegetation Dynamics in the Qinghai-Tibet Plateau. Remote Sens. 8, 876. doi:10.3390/rs8100876
Huiying Liu, H., Mi, Z., Lin, L., Wang, Y., Zhang, Z., Zhang, F., et al. (2018). Shifting Plant Species Composition in Response to Climate Change Stabilizes Grassland Primary Production. Proc. Natl. Acad. Sci. U.S.A. 115, 4051–4056. doi:10.1073/pnas.1700299114
Ibisch, P. L., Hoffmann, M. T., Kreft, S., Pe’er, G., Kati, V., Biber-Freudenberger, L., et al. (2016). A Global Map of Roadless Areas and Their Conservation Status. Science 354, 1423–1427. doi:10.1126/science.aaf7166
Jaworska, H., and Lemanowicz, J. (2019). Heavy Metal Contents and Enzymatic Activity in Soils Exposed to the Impact of Road Traffic. Sci. Rep. 9, 19981. doi:10.1038/s41598-019-56418-7
Jin, G., Chen, K., Liao, T., Zhang, L., and Najmuddin, O. (2021). Measuring Ecosystem Services Based on Government Intentions for Future Land Use in Hubei Province: Implications for Sustainable Landscape Management. Landsc. Ecol. 36, 2025–2042. doi:10.1007/s10980-020-01116-3
Kang, X., Hao, Y., Cui, X., Chen, H., Huang, S., Du, Y., et al. (2016). Variability and Changes in Climate, Phenology, and Gross Primary Production of an Alpine Wetland Ecosystem. Remote Sens. 8, 391. doi:10.3390/rs8050391
Laurance, W. F., Clements, G. R., Sloan, S., O’Connell, C. S., Mueller, N. D., Goosem, M., et al. (2014). A Global Strategy for Road Building. Nature 513, 229–232. doi:10.1038/nature13717
Liu, X., Li, T., Zhang, S., Jia, Y., Li, Y., and Xu, X. (2016). The Role of Land Use, Construction and Road on Terrestrial Carbon Stocks in a Newly Urbanized Area of Western Chengdu, China. Landsc. Urban Plan. 147, 88–95. doi:10.1016/j.landurbplan.2015.12.001
Liu, W., Zhan, J., Zhao, F., Yan, H., Zhang, F., and Wei, X. (2019). Impacts of Urbanization-Induced Land-Use Changes on Ecosystem Services: A Case Study of the Pearl River Delta Metropolitan Region, China. Ecol. Indic. 98, 228–238. doi:10.1016/j.ecolind.2018.10.054
Liu, M., Hu, D., Yu, C., and Wang, S. (2020). Temporal and Spatial Change Characteristics of Growing Season Evapotranspiration and its Cause Analysis in Liaohe River Delta Wetland. Acta Ecol. Sin. 40, 701–710. (in Chinese). doi:10.5846/stxb201901180149
Liu, Y., Liu, S., Sun, Y., Li, M., An, Y., and Shi, F. (2021). Spatial Differentiation of the NPP and NDVI and its Influencing Factors Vary with Grassland Type on the Qinghai-Tibet Plateau. Environ. Monit. Assess. 193, 1–21. doi:10.1007/s10661-020-08824-y
Millennium Ecosystem Assessment (MA) (2005). Ecosystems and Human Wellbeing. Washington, DC: Island Press
Ma, N., and Zhang, Y. (2022). Increasing Tibetan Plateau Terrestrial Evapotranspiration Primarily Driven by Precipitation. Agric. For. Meteorol. 317, 108887. doi:10.1016/j.agrformet.2022.108887
Mu, S., Zhou, S., Chen, Y., Li, J., Ju, W., and Odeh, I. O. A. (2013). Assessing the Impact of Restoration-Induced Land Conversion and Management Alternatives on Net Primary Productivity in Inner Mongolian Grassland, China. Glob. Planet. Change 108, 29–41. doi:10.1016/j.gloplacha.2013.06.007
Mu, B., Zhao, X., Wu, D., Wang, X., Zhao, J., Wang, H., et al. (2021). Vegetation Cover Change and its Attribution in China from 2001 to 2018. Remote Sens. 13, 496. doi:10.3390/rs13030496
Niu, Y., Zhu, H., Yang, S., Ma, S., Zhou, J., Chu, B., et al. (2019). Overgrazing Leads to Soil Cracking that Later Triggers the Severe Degradation of Alpine Meadows on the Tibetan Plateau. Land Degrad. Dev. 30, 1243–1257. doi:10.1002/ldr.3312
Perrings, C., Duraiappah, A., Larigauderie, A., and Mooney, H. (2011). The Biodiversity and Ecosystem Services Science-Policy Interface. Science 331, 1139–1140. doi:10.1126/science.1202400
Querino, C. A. S., Beneditti, C. A., Machado, N. G., da Silva, M. J. G., da Silva Querino, J. K. A., dos Santos Neto, L. A., et al. (2016). Spatiotemporal NDVI, LAI, Albedo, and Surface Temperature Dynamics in the Southwest of the Brazilian Amazon Forest. J. Appl. Remote Sens. 10, 026007. doi:10.1117/1.jrs.10.026007
Rees, W. G., Golubeva, E. I., Tutubalina, O. V., Zimin, M. V., and Derkacheva, A. A. (2020). Relation between Leaf Area Index and NDVI for Subarctic Deciduous Vegetation. Int. J. Remote Sens. 41, 8573–8589. doi:10.1080/01431161.2020.1782505
Renhe Zhang, R., Su, F., Jiang, Z., and Gao, X. (2015). An Overview of Projected Climate and Environmental Changes across the Tibetan Plateau in the 21st Century. Chin. Sci. Bull. 60, 3036–3047. (in Chinese). doi:10.1360/N972014-01296
Saito, M., Kato, T., and Tang, Y. (2009). Temperature Controls Ecosystem CO2exchange of an Alpine Meadow on the Northeastern Tibetan Plateau. Glob. Change Biol. 15, 221–228. doi:10.1111/j.1365-2486.2008.01713.x
Sha, Z., Bai, Y., Lan, H., Liu, X., Li, R., and Xie, Y. (2020). Can More Carbon Be Captured by Grasslands? A Case Study of Inner Mongolia, China. Sci. Total Environ. 723, 138085. doi:10.1016/j.scitotenv.2020.138085
Sitch, S., Smith, B., Prentice, I. C., Arneth, A., Bondeau, A., Cramer, W., et al. (2003). Evaluation of Ecosystem Dynamics, Plant Geography and Terrestrial Carbon Cycling in the LPJ Dynamic Global Vegetation Model. Glob. Change Biol. 9, 161–185. doi:10.1046/j.1365-2486.2003.00569.x
Song, Y., Jin, L., and Wang, H. (2018). Vegetation Changes along the Qinghai-Tibet Plateau Engineering Corridor since 2000 Induced by Climate Change and Human Activities. Remote Sens. 10, 95. doi:10.3390/rs10010095
Sun, G., Hallema, D., and Asbjornsen, H. (2017). Ecohydrological Processes and Ecosystem Services in the Anthropocene: a Review. Ecol. Process. 6, 1–9. doi:10.1186/s13717-017-0104-6
Taugourdeau, S., Le Maire, G., Avelino, J., Jones, J. R., Ramirez, L. G., Jara Quesada, M., et al. (2014). Leaf Area Index as an Indicator of Ecosystem Services and Management Practices: An Application for Coffee Agroforestry. Agric. Ecosyst. Environ. 192, 19–37. doi:10.1016/j.agee.2014.03.042
Tian, F., Fensholt, R., Verbesselt, J., Grogan, K., Horion, S., and Wang, Y. (2015). Evaluating Temporal Consistency of Long-Term Global NDVI Datasets for Trend Analysis. Remote Sens. Environ. 163, 326–340. doi:10.1016/j.rse.2015.03.031
Tilman, D., and Lehman, C. (2001). Human-caused Environmental Change: Impacts on Plant Diversity and Evolution. Proc. Natl. Acad. Sci. U.S.A. 98, 5433–5440. doi:10.1073/pnas.091093198
Van Leeuwen, W. J. D., Huete, A. R., and Laing, T. W. (1999). MODIS Vegetation Index Compositing Approach. Remote Sens. Environ. 69, 264–280. doi:10.1016/s0034-4257(99)00022-x
Wang, J., Zhang, X., Chen, B., Shi, P., Shen, Z., Tao, J., et al. (2013). Causes and Restoration of Degraded Alpine Grassland in Northern Tibet. J. Resour. Ecol. 4, 43–49. doi:10.5814/j.issn.1674-764x.2013.01.006
Wang, Y., Guan, L., Du, L., and Qu, J. (2021). Overlapping Barrier and Avoidance Effects of the Qinghai-Tibet Highway and Railway on Four Typical Ungulates on the Tibetan Plateau. Chin. J. Ecol. 40, 1091–1097. (in Chinese). doi:10.13292/j.1000-4890.202104.015
Wu, Q., Shen, Y., and Shi, B. (2003). Relationship between Frozen Soil Together with its Water-Heat Process and Ecological Environment in the Tibetan Plateau. J. Glaciol. Geocryol. 25, 250–255. (in Chinese).
Wu, D., Wu, H., Zhao, X., Zhou, T., Tang, B., Zhao, W., et al. (2014). Evaluation of Spatiotemporal Variations of Global Fractional Vegetation Cover Based on GIMMS NDVI Data from 1982 to 2011. Remote Sens. 6, 4217–4239. doi:10.3390/rs6054217
Wu, S., Yan, J., Yang, L., Cheng, X., and Wu, Y. (2021). Farmers and Herders Reclaim Cropland to Adapt to Climate Change in the Eastern Tibetan Plateau: a Case Study in Zamtang County, China. Clim. Change 165, 1–23. doi:10.1007/s10584-021-03098-w
Xin, H. (2008). A Green Fervor Sweeps the Qinghai-Tibetan Plateau. Science 321, 633–635. doi:10.1126/science.321.5889.633
Xu, X., Zhang, K., Kong, Y., Chen, J., and Yu, B. (2006). Effectiveness of Erosion Control Measures along the Qinghai-Tibet Highway, Tibetan Plateau, China. Transp. Res. Part D Transp. Environ. 11, 302–309. doi:10.1016/j.trd.2006.06.001
Yang, C., and Sun, J. (2021). Impact of Soil Degradation on Plant Communities in an Overgrazed Tibetan Alpine Meadow. J. Arid Environ. 193, 104586. doi:10.1016/j.jaridenv.2021.104586
Yang, X., Guo, B., and Han, B. (2019). Analysis of the Spatial-Temporal Evolution Patterns of NPP and its Driving Mechanisms in the Qinghai-Tibet Plateau. Resour. Environ. Yangtze Basin 28, 3038–3050. (in Chinese).
Yang, S., Zhao, W., Liu, Y., Cherubini, F., Fu, B., and Pereira, P. (2020). Prioritizing Sustainable Development Goals and Linking Them to Ecosystem Services: A Global Expert's Knowledge Evaluation. Geogr. Sustain. 1, 321–330. doi:10.1016/j.geosus.2020.09.004
Yang, D., Yi, G., Zhang, Y., and Li, J. (2021). Spatiotemporal Variation and Driving Factors of Growing Season NDVI in the Tibetan Plateau, China. Chin. J. Appl. Ecol. 32, 1361–1372. (in Chinese). doi:10.13287/j.1001-9332.202104.014
Yin Zhang, Y., Hu, Q., and Zou, F. (2021). Spatio-temporal Changes of Vegetation Net Primary Productivity and its Driving Factors on the Qinghai-Tibetan Plateau from 2001 to 2017. Remote Sens. 13, 1566. doi:10.3390/rs13081566
Ying Liu, Y., Feng, Q., Wang, C., and Tang, Z. (2018). A Risk-Based Model for Grassland Management Using MODIS Data: The Case of Gannan Region, China. Land Use Policy 72, 461–469. doi:10.1016/j.landusepol.2018.01.015
Zhang, T., Zeng, S., Gao, Y., Ouyang, Z., Li, B., Fang, C., et al. (2011). Using Hyperspectral Vegetation Indices as a Proxy to Monitor Soil Salinity. Ecol. Indic. 11, 1552–1562. doi:10.1016/j.ecolind.2011.03.025
Zhang, W., Jin, H., Li, A., Shao, H., Xie, X., Lei, G., et al. (2021). Comprehensive Assessment of Performances of Long Time-Series LAI, FVC and GPP Products over Mountainous Areas: A Case Study in the Three-River Source Region, China. Remote Sens. 14, 61. doi:10.3390/rs14010061
Zhang, Y., Liu, L., Wang, Z., and Bai, W. (2019). Spatial and Temporal Characteristics of Land Use and Cover Changes in the Tibetan Plateau. Chin. Sci. Bull. 64, 2865–2875. (in Chinese). doi:10.1360/tb-2019-0267
Zheng, F., Huang, J., Feng, Z., and Xiao, C. (2021). Impact of the Kunming-Bangkok Highway on Land Use Changes along the Route between Laos and Thailand. Land 10, 991. doi:10.3390/land10090991
Keywords: ecosystem service indicators, buffer distance, climate change, traffic corridor, Qinghai-Tibet Plateau
Citation: Yang S, Zhu G, Zhang L, Xu H and Cheng J (2022) Spatiotemporal Variations of Ecosystem Service Indicators and the Driving Factors Under Climate Change in the Qinghai–Tibet Highway Corridor. Front. Environ. Sci. 10:935713. doi: 10.3389/fenvs.2022.935713
Received: 04 May 2022; Accepted: 01 June 2022;
Published: 15 July 2022.
Edited by:
Fan Zhang, Institute of Geographic Sciences and Natural Resources Research (CAS), ChinaReviewed by:
Wei Liu, Shandong Normal University, ChinaCopyright © 2022 Yang, Zhu, Zhang, Xu and Cheng. This is an open-access article distributed under the terms of the Creative Commons Attribution License (CC BY). The use, distribution or reproduction in other forums is permitted, provided the original author(s) and the copyright owner(s) are credited and that the original publication in this journal is cited, in accordance with accepted academic practice. No use, distribution or reproduction is permitted which does not comply with these terms.
*Correspondence: Gaoru Zhu, emh1Z3JAdHByaS5vcmcuY24=
Disclaimer: All claims expressed in this article are solely those of the authors and do not necessarily represent those of their affiliated organizations, or those of the publisher, the editors and the reviewers. Any product that may be evaluated in this article or claim that may be made by its manufacturer is not guaranteed or endorsed by the publisher.
Research integrity at Frontiers
Learn more about the work of our research integrity team to safeguard the quality of each article we publish.