
94% of researchers rate our articles as excellent or good
Learn more about the work of our research integrity team to safeguard the quality of each article we publish.
Find out more
ORIGINAL RESEARCH article
Front. Environ. Sci., 07 July 2022
Sec. Land Use Dynamics
Volume 10 - 2022 | https://doi.org/10.3389/fenvs.2022.935498
This article is part of the Research TopicTowards Greener Urbanization: Resource Environmental Effects and Sustainable Land UseView all 16 articles
 Bingqian Li1
 Mei Guan2
 Lingyun Zhan3*Chunqiang Liu4*Zhipeng Zhang4
 Huailong Jiang2Yong Zhang2
 Guanglong Dong5
Urban comprehensive carrying capacity determines the scale and development direction of a city and is an important factor in the optimization of main function areas, the arrangement of urban development order, and the demarcation of urban development boundaries in China’s new national spatial planning system. Using the constructed “pressure-capacity-potential” model as a theoretical basis, this study combines human factors and natural factors and calculates the urban carrying capacity index by means of multi-factor weighted summation, graded assignment, stepwise correction, and subsection variable weight. From the perspective of the integration and coordination of “three forces,” urban development rules are established, and an urban development order based on the framework of “three districts and six types” is put forward. The results reveal four key findings. First, the “pressure-capability-potential” conceptual model analyzes the urban carrying capacity from the perspective of the integration of externality and internality, which can effectively support the orderly arrangement and rational layout of urban development. Second, the urban carrying pressure of Shandong province is general, and the urban carrying capacity is high. The results also showed that the urban carrying potential is low and the urban comprehensive carrying capacity is high. Third, in the “3+6” urban development pattern of Shandong province, priority development and key development zones are the main areas. For the most part, these zones are distributed in the Jiaodong Peninsula, the Jinan–Tai’an–Jining development zone, and the surrounding areas of Weifang, Linyi, Liaocheng, and Heze. Moderate development zones are concentrated in Nansi Lake and the Yellow River Delta. Fourth, the urban development in Shandong province is mainly restricted by landform, water resources, environmental capacity, and geological disasters. Under the premise of ensuring resource conservation and environmental friendliness, using policies and engineering measures to revitalize stock space is an effective way to foster urban development in the 14th Five-Year Plan period. This study can provide reference for the evaluation of urban comprehensive carrying capacity and the establishment of development order in Shandong province and other similar areas.
With the rapid advancement of industrialization and urbanization, problems such as resource shortages, environmental pollution, and strained relationships between humans and the land have emerged in various regions (Bai et al., 2014; Long and Liu, 2016; Qu et al., 2021a). Especially in urban areas, the tension between limited resources and unlimited development demand is becoming increasingly prominent (Chen et al., 2016; Dong et al., 2021; Jiang et al., 2021). To solve this problem, it is necessary to evaluate urban carrying capacity, which is also an important basis for reasonably delimiting the city grade, development order, and expansion boundary (Liu et al., 2018; Li and Li, 2019; Wang W et al., 2020). In recent years, with the continuous renewal and development of theories related to urban development and construction, the concept of urban carrying capacity has attracted a great deal of attention (Shen et al., 2020; Weng et al., 2020; Ren et al., 2021) and become an important representation of the relationship between man and nature. It has also emerged as a basis for measuring the coordination between urban development and construction and environmental contexts (Shen et al., 2020; Qu et al., 2021a; Qu et al., 2021b). Therefore, the scientific evaluation of urban comprehensive carrying capacity and the construction of effective urban development and construction orders are of great theoretical and practical significance for effective resource allocation and territorial space planning.
Comprehensive carrying capacity is an important concept that originated from ecology. It refers to the maximum limit of the number of individuals under specific environmental conditions (Meng et al., 2020; Shen et al., 2020). Subsequently, the concept of carrying capacity has been expanded and extended in various fields of environmental science, economics, geography, and sociology (Sun et al., 2018; Wang et al., 2019; Peng and Deng, 2020) and is often used to study the extent to which the development of something in a region is limited. At present, research on urban carrying capacity tends to be diversified (Liu et al., 2020; Wang et al., 2020a; Zhao et al., 2021). In terms of research objects, most of the current research involves resources and environment carrying capacity (Wu H et al., 2021; Zhou et al., 2021; Zhang et al., 2022), water and land resources carrying capacity (Zhang and Zhu, 2022), land resources carrying capacity (Sun et al., 2020), infrastructure carrying capacity (Wang et al., 2020b), ecological carrying capacity (Wu M et al., 2021), atmospheric carrying capacity (Shen et al., 2022a), and traffic capacity (Gao et al., 2022). With respect to the research area, scholars have mainly focused on single cities or urban agglomerations (Wang W et al., 2020; Gao et al., 2021; Shen et al., 2022a; Zhang and Zhu, 2022). From the perspective of research, the analysis of carrying capacity of land resources and water resources has developed into a comprehensive evaluation of the carrying capacity of human factors, such as population, environment, and transportation (Tian and Sun, 2018; Wang et al., 2020b; Sun et al., 2020; Zhou, 2021; Shen et al., 2022a; Shen et al., 2022b; Gao et al., 2022). The DPESBR model (Peng and Deng, 2020) and three-dimensional balance model (Zhang et al., 2022) have been introduced to urban carrying capacity evaluation, resulting in richer research methods and more novel research ideas and perspectives (Shen et al., 2020; Wang et al., 2020a; Shen et al., 2022b; Zhang and Zhu, 2022). In terms of regulation mechanism, conversations around the relationships between urbanization and carrying capacity (Tian and Sun, 2018; Shen et al., 2022b), coordinated development of economic development and environmental protection (Wu H et al., 2021), and urban resilience to emergencies (Shao et al., 2020) have outlined measures and countermeasures that can be adopted to improve or enhance urban comprehensive carrying capacity.
These achievements enrich the theory and method system of urban carrying capacity research and serve as useful references for this study. However, existing studies on urban comprehensive carrying capacity tend to focus on carrying capacity evaluation, and the research results mostly reflect the carrying state with the maximum carrying capacity of the region (Liu et al., 2021), for example, whether the city is overloaded, but ignore the comprehensive carrying pressure and potential of the city, which reduces the practical guiding significance of the research results.
The comprehensive evaluation of the urban comprehensive carrying capacity, pressure, and potential is the key to optimizing the spatial pattern of land and formulating the development order reasonably. Building from existing research that focuses on the measurement of urban carrying capacity, this study introduces the two variables of carrying pressure and carrying potential and constructs a comprehensive urban carrying capacity model based on “pressure-capacity-potential.” The evaluation system of urban comprehensive carrying capacity is constructed from a perspective that combines human and natural factors. This study analyzes the urban carrying capacity of 137 administrative units in Shandong province by means of multi-factor synthesis, step-by-step correction, and comparative evaluation. From the perspective of the size and coordination of the “three forces,” order rules of urban development are constructed, the restrictive factors of urban carrying capacity are identified, and the regulation and control strategies of urban development and construction oriented to “three districts and six categories” are put forward, providing effective support for the new round of main function zone construction and territorial space planning.
In this study, urban comprehensive carrying capacity is defined as the maximum amount of human social and economic activities that can be carried by urban construction space under the premise of ensuring ecosystem security and stability within a certain regional scope in the face of the pressure that human activities and social and economic development exert on the demand for urban construction space, make full use of existing resources, and explore the bearing potential through policy or engineering technology adjustment. Therefore, the comprehensive carrying capacity is decomposed into carrying pressure, carrying capacity, and carrying potential. From the perspective of “three forces” coupling and coordination, this study analyzes the carrying level of urban space and systematically answers questions linked to the pressure state faced by urban construction space in a certain period, how much carrying capacity it has, and the extent to which it can carry intense human activities. The conceptual model is shown in Figure 1.
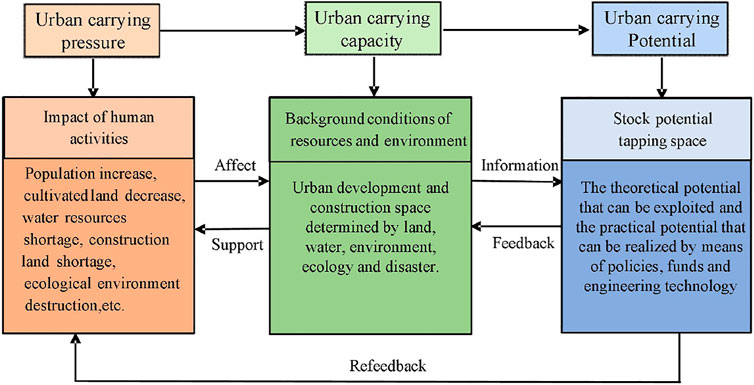
FIGURE 1. Conceptual model of urban comprehensive carrying capacity.
First of all, the demand for urban construction land increases with population growth and accelerated urbanization. In order to meet construction needs, urban land presents a “spread out” type of expansion. In addition, pollution caused by industrialization damages the ecological environment and strains the supply of water and land resources. This is the root of “stress.” Before the emergence of pressure, various elements of regional resource and environment background together constitute the carrying capacity due to the heterogeneity of the resource environment. The gap between carrying capacity and pressure reflects the state of supply and demand of urban carrying capacity. If the capacity is greater than the pressure, it means that the planned area for urban construction can meet the needs of human production and persist at the present stage. If the capacity is less than the pressure, it means that human demand for construction land cannot be effectively met, which requires the development of new land to fill. In this process, people will employ engineering measures or policies, such as land remediation projects. These measures act on the leading factors of regional development and improve the relationship between the supply and demand of regional land resources or water resources. “Potential” refers to newly added land that is suitable for development as construction land and does not need to occupy ecological land and permanent basic farmland (Liu et al., 2021).
Pressure represents human activities that consume resources and destroy the ecological environment and is the reason for the decline in carrying capacity. Carrying capacity is the comprehensive performance of various environmental elements, and its change provides support for carrying potential. When the carrying capacity decreases, it stimulates the implementation of relevant policies and technology applications and then taps into the potential of stock land to release the potential, which is also the reason for the increase in carrying potential. There are two sources of feedback for carrying potential. One is feedback on resource and environment systems. For example, engineering measures improve the background conditions of regional resources and environments and promote the carrying capacity so that the resource and environment system can better support the pressure brought on by human activities. The other is direct feedback to stress. The increase in carrying potential makes cities and towns more resilient to pressure, and an increase in potentially developable land area can directly meet the needs of human economic activities for construction land. With the continuous advancement of urbanization, in order to meet the needs of social and economic development, the demand for urban construction space and the consumption of resources will increase day by day, bringing new pressure that will be conveyed to the carrying capacity through the feedback process and guide the tapping and release of carrying potential. This kind of “three forces” circulatory feedback action constitutes the urban construction space carrying capacity model. The comprehensive carrying capacity of urban construction is a system composed of pressure, capacity, and potential, which is interrelated and cyclically feedback.
Urban carrying pressure refers to the intensity of human activities carried by the city. The greater the intensity of human activities, the greater the pressure carried by the city. Human activities are usually closely related to land, water resources, and environment, and population is a direct reflection of the intensity of human activities. Therefore, this study comprehensively evaluates the urban carrying pressure from four aspects: population pressure, land pressure, water resource pressure, and environmental pressure (Table 1). Population pressure is represented by urban population density. The greater the population density and the greater the construction space required by urban residents for production and living, the greater the pressure. Land pressure is represented by urban development intensity. The larger the construction land area, the greater the land pressure. Water resource pressure is characterized by per capita water consumption. The greater the per capita water consumption, the greater the water resource pressure. The environmental pressure is reflected through the relationship between GDP and waste discharge. The greater the waste discharge per unit of economic output, the greater the environmental pressure.
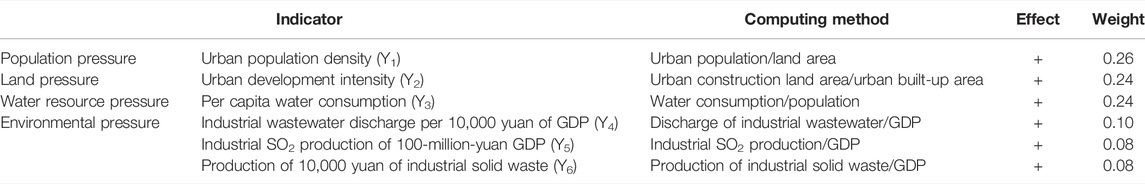
TABLE 1. Evaluation index of urban carrying pressure.
The urban carrying pressure index is calculated using the multi-factor comprehensive weighting method. Since all the indicators have positive effects on the carrying pressure, the positive range standardization method (Liu et al., 2021) is adopted to normalize the indicators. Then, the entropy weight method is used to calculate the weight of each indicator, and the weighted summation model (Formula 1) is used to calculate the pressure index:
where Yi is the urban carrying pressure index, wyi is the weight value of each pressure indicator, and yi is the normalized standard value of each pressure indicator.
Urban carrying capacity refers to the maximum carrying capacity that a city can produce by making full and reasonable use of its resources and environment endowment. Urban resources and environment endowment mainly include water resources, land resources, climate, and environment, and geological disasters will have a great impact on urban resources and environment endowment. Therefore, this study selects indicators from land, water, climate, environment, and disaster factors to comprehensively evaluate urban carrying capacity (Table 2). The height and slope of land factors are selected to reflect the impact of topographic conditions on urban carrying capacity. The steeper the terrain, the lower the carrying capacity. Water resource elements are represented by total water resources. As the basis of “city size is determined by water quantity,” the greater the total amount of water resources, the greater the carrying capacity. Climate factors mainly consider the comfort index, which is used to reflect the temperature and humidity of the city. Appropriate climate conditions can enhance the carrying capacity of the city. Disaster factors mainly consider indicators such as earthquakes and geological disasters. An earthquake is reflected by active fault distance and peak acceleration of ground motion, and geological disaster is reflected by landslide flow, ground subsidence, and ground collapse degree. The greater the degree of disaster, the lower the carrying capacity of the city.

TABLE 2. Evaluation index of urban carrying capacity.
The urban carrying capacity index is calculated using single-factor graded assignment and the integrated correction method (Formula 2). First of all, the carrying capacity indicators were divided into five grades and assigned values (5, 4, 3, 2, and 1) (Table 1) in descending order based on the methods outlined in “the Guidelines for Evaluating the Carrying Capacity of Resources and Environment and suitability of Territorial Space Development (Trial).” Then, using the principle of short board, based on the grade of land resource elements, the evaluation results of water resources, climate conditions, environmental capacity, and disaster are used to revise them successively. For the lowest value of each individual evaluation, the base grade result is reduced by one level. The carrying capacity of high grade and relative high grade is regarded as high carrying capacity. Those rated as medium and relatively low are classified as medium carrying capacity, and those rated as low are classified as low carrying capacity. Finally, high, medium, and low carrying capacity are assigned the values 3, 2, and 1. The weighted average is carried out according to the proportion of grade area to obtain the urban carrying capacity index of each evaluation unit (Formula 3).
where
Urban carrying potential refers to the difference between urban carrying capacity under current utilization state and optimal combined utilization state, including theoretical potential and practical potential. The urban carrying potential index is selected according to the theoretical potential and the influencing factors of its release (Table 3). Among them, theoretical potential includes urban idle land revitalization potential, rural residential land remediation potential, and industrial and mining abandoned land reclamation potential. The correction factors include per capita GDP, local fiscal revenue, and urban land price level, which, respectively, represent the investment capacity and output benefit of national and local governments. The greater the investment capacity, the higher the output and efficiency, and the greater the possibility and enthusiasm for the utilization of urban stock land.
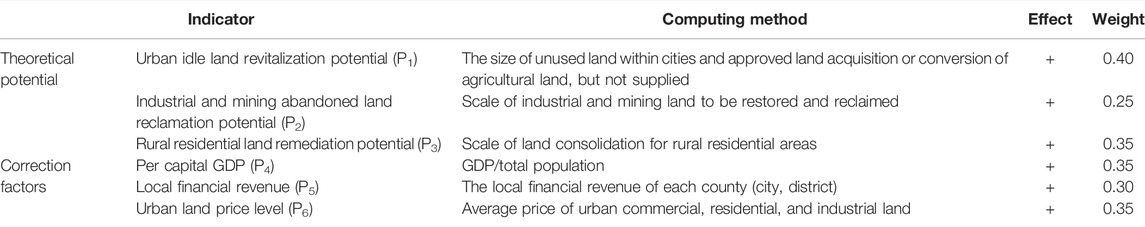
TABLE 3. Evaluation Index of urban carrying potential.
The urban carrying potential index is calculated using the factor correction method (Qu et al., 2012). First, the theoretical potential and socio-economic correction coefficient of urban carrying capacity are calculated using a multi-factor weighted model. Then, the potential index of different administrative units is calculated using the potential correction model (Formula 4).
where
For urban comprehensive carrying capacity, the greater the pressure, the more the demand for urban construction space. As a result, the city will continue to expand outward, and the supply capacity of resources and the environment will decrease accordingly. The government will take policy and engineering measures to tap into the supply potential of urban construction land and improve the carrying capacity so as to better meet the development needs for construction space. Urban comprehensive carrying capacity is a complex system based on the relationship between development pressure and supply capacity and supplemented by potential exploitation. When the supply capacity is higher than the development pressure, the role of potential exploitation is weak, the cost of urban development is low, and the urban comprehensive carrying capacity mainly depends on the carrying capacity. When the supply capacity is lower than the development pressure, the role of potential exploitation is enhanced. The development cost driven by the revitalization of urban stock land is high, and urban comprehensive carrying capacity depends on the comprehensive effect of carrying capacity and carrying potential. Therefore, the method of subsection and differential weight (Formula 5) is adopted to calculate the urban comprehensive carrying capacity index:
where
It is necessary to comprehensively consider the grade and coordination degree of the city carrying pressure, capacity, and potential and construct the urban development order pattern according to the priority relationship (Table 4) (Gao et al., 2022). Firstly, the “three forces (Y, N, Q)” index score is divided into three grades from small to large using natural breakpoint method and is represented by 1, 2, and 3, forming the relationship combination of pressure, ability, and potential expressed by 3-bit coding. The first digit indicates the pressure level, the second digit indicates the ability level, and the third digit indicates the potential level. Then, the comprehensive goal of urban development is to alleviate carrying pressure, ensure carrying capacity, and enhance carrying potential. Taking Y value as a reference, the size differences of Y, Q, and N are compared, respectively. According to the grade intensity relationship of “three forces,” the basic evaluation unit is merged, and the urban priority development zone is divided. Furthermore, considering the coordination among different grade combinations of the “three forces” and the principle of “high-level coordination first, middle-level coordination second, and low-level coordination last,” the development types of each evaluation unit are identified in turn to form the urban development and construction system of “three districts and six types.”
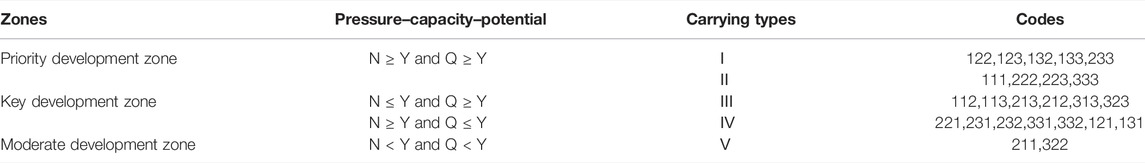
TABLE 4. Urban development order rules based on pressure–capacity–potential model.
Shandong province is located on the east coast of China in the lower reaches of the Yellow River and has the longitude and latitude range 114°20′ E–122°43′ E (Figure 2). It is mountainous at its center with low-lying flat and gentle hills to the east. The provenance also has a warm temperate monsoon climate. With 16 prefecture-level cities and 137 county-level administrative regions under its jurisdiction, the province is the third most populous province in China and one of the country’s most developed and rapidly developing provinces. In 2020, the urbanization rate of Shandong province was 62%, and the gross regional product was 7312.9 billion yuan. The tertiary industrial structure was 7.3:39.1:53.6, and the commercial service industry with the city as the carrier was absolutely dominant. According to the main data bulletin of the third land survey in Shandong province, the area of construction land in Shandong province in 2019 was 4,588,239.02 ha. Among them, the land area of towns, villages, industry, and mining is 2,806,478.74 ha, the land area of transportation is 446,405.05 ha, and the land area of water and water conservancy facilities is 1,325,355.23 ha. In 2019, China put forward a strategy for ecological conservation and high-quality development of the Yellow River Basin. Shandong province, as an important urban agglomeration in the Yellow River Basin, plays an important role in the high-quality development of the Yellow River Basin. In addition, Shandong province is also a national comprehensive pilot zone for the transformation of old and new driving forces. In recent years, with the increasing intensity of urban development in the province, the problems of fragile ecological environment, resource background degradation, and insufficient leading role of central cities are prominent. Given this context, it is crucial to comprehensively consider natural and socio-economic factors while evaluating urban comprehensive carrying capacity and exploring reasonable development plans.
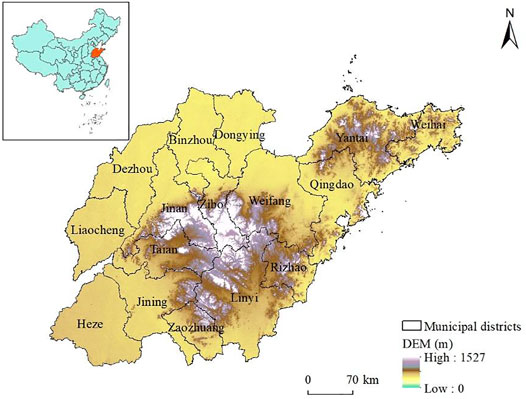
FIGURE 2. Study area.
The data used in this study consist of social and economic data and resource and environment data. The social and economic data include population and economic development data that were mainly pulled from the 2020 statistical yearbook of Shandong province and prefectural cities. The resource and environment data include information about land resources, water resources, environment, meteorology, disasters, and the ecological environment. The land-use status data were collected from the third Land Resources Survey database of Shandong province (2019). The land-use planning data come from the general land-use plan of Shandong province (2006–2020). The administrative division data are from the National Basic Geographic Information Center (http://www.ngcc.cn/). The digital elevation and MODISNDVI data come from the geospatial data cloud (http://gscloud.cn/) with a resolution of 30 m. The water resources data were obtained from long-term precipitation observation data that were gathered by meteorological stations in the study area and adjacent areas in 2019. The soil data were obtained from a detailed investigation of soil pollution status that was conducted in the study area and surrounding areas in 2019, and the soil pollutant content distribution layer was obtained by analyzing the main pollutant content at each point and spatial interpolation. Based on the multi-year average daily temperature and active accumulated temperature ≥ 0°C of meteorological stations in 2019, the Kriging spatial interpolation method was used to obtain active accumulated temperature layers. Geological disaster data, such as active fault and land subsidence, were obtained from the 2019 geographical National Conditions survey data of Shandong province. On this basis, all kinds of maps are transformed into a unified coordinate system to form the basic database of urban comprehensive carrying capacity evaluation.
The urban carrying pressure index of cities in Shandong province ranges from 0.23 to 0.92, with an average value of 0.45. The carrying pressure is general, and there are obvious differences among counties. The carrying pressure is divided into three grades using the natural breakpoint method (Figure 3A). The carrying pressure of Shandong province is mainly at the first level, which includes 61 counties that account for 44.53% of the area and are concentrated in the east, central, and southwest of Shandong province. The secondary region includes 54 counties that account for 39.42% of the area and are concentrated in the northwest, southwest, and southeast coastal areas of Shandong province. The tertiary region includes 22 counties that account for 16.06% of the area and are mainly distributed in the municipal districts of Dongying, Zibo, Yantai, Linyi, and Dezhou. The differential distribution of pressure index in Shandong province is closely related to population and the endowment conditions of water and soil resources. Among them, the first-level regions are rich in land resources, especially in the south of Shandong province, which is abundant in water resources and can meet the needs of an increasing urban population with little pressure. The secondary regions are mainly distributed in densely populated areas, and the population increase intensifies the supply pressure of urban land resources and water resources, especially in the case of the serious water resource shortages in southeast Shandong. Water resource shortages are the main source of pressure in the third-level regions, especially in the northern Shandong province, where the demand for water resources for urban industrial and living development is not fully met, which increases the pressure on urban development and construction.
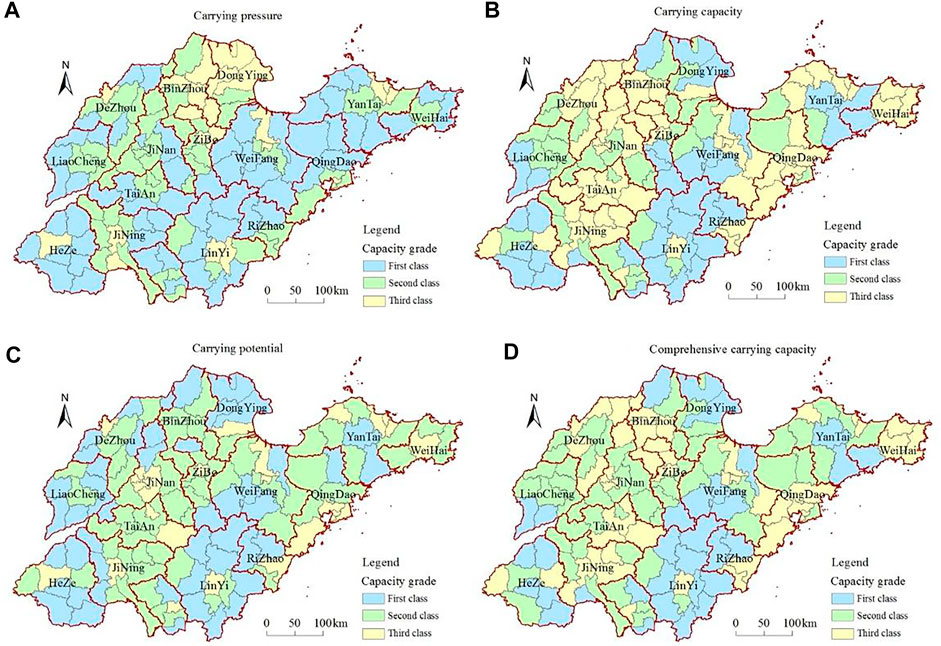
FIGURE 3. Grades of urban comprehensive carrying capacity in Shandong province. (A) Carrying pressure, (B) carrying capacity, (C) carrying potential, and (D) comprehensive carrying capacity.
The urban carrying capacity index of Shandong province is between 0 and 1 with an average value of 0.63, indicating that the overall carrying capacity is high and the spatial agglomeration characteristics are significant. The urban carrying capacity is divided into three grades using natural breakpoint method (Figure 3B). The first-level region consists of 38 counties that account for 27.74% of the area and are mainly distributed in southwest Shandong, southeast Shandong, east Shandong, and north Shandong. This region is mainly affected by mountain and hill landforms and geological disasters, and its urban carrying capacity is low. The second grade includes 34 counties that account for 24.82% of the area and are relatively concentrated in the coastal areas of western Shandong and northern Shandong. The main restricting factors are the low environmental volume in western Shandong and the relative shortage of water resources in the northern Shandong coastal area. The third level consists of 65 counties that account for 47.45% of the area and are mainly distributed in the central and northwestern and eastern coastal areas of Shandong province. These counties have developed river systems, flat terrain, no obvious geological disasters, and good resources and environment, which are factors suitable for urban development and construction.
Shandong province’s urban carrying potential index is between 0.08 and 0.78 with an average of 0.28. The overall potential level is low, and the spatial distribution is relatively scattered. The urban carrying potential index is divided into three grades using the natural breakpoint method (Figure 3C). The first-level region includes 49 counties, accounting for 35.77% of the area. It is slightly similar to the first-grade bearing capacity region and has relatively high theoretical potential. At the same time, the low level of social and economic development affects the release of theoretical potential to a certain extent. The second-level region is the largest, covering 60 counties that account for 43.80% of the area and are mainly distributed in central Shandong, western Shandong, and part of the Peninsula. These regions have average theoretical potential, relatively high levels of social and economic development, and medium levels of comprehensive potential. The third level includes 28 counties that account for 20.44% of the area and are mainly distributed in the vicinity of municipal districts. The potential of existing cities and industrial and mining land is large, and the social and economic development level is relatively high, which is conducive to the release of potential.
The index of comprehensive urban carrying capacity in Shandong province is between 0.04 and 0.93 with an average of 0.54, indicating a high level of comprehensive carrying capacity on the whole (Figure 3D). There are 41 counties whose urban carrying capacity index is lower than the urban carrying pressure index, accounting for 29.93% of the area. The comprehensive carrying capacity index is low, ranging from 0.04 to 0.7 with an average of 0.21, which is also the main area of first-level carrying capacity. Among these counties, the urban carrying pressure of northern Shandong is large, and the urban carrying capacity and potential are low. Other regions are relatively low in urban carrying pressure, capacity, and potential.
There were 96 counties whose urban carrying capacity index was higher than the stress index, accounting for 70.07% of the total. The comprehensive carrying capacity index was relatively large, ranging from 0.28 to 0.93 with an average of 0.69, and the spatial distribution was relatively balanced. Among these counties, the secondary carrying capacity region includes 46 counties that are mainly distributed to the west of central Shandong province. The urban carrying capacity is mainly middle–low level, and the urban carrying capacity and potential are mainly middle–high level. The region with the largest comprehensive carrying capacity includes 50 counties, mainly cities, counties, and the surrounding areas of each city. The urban carrying capacity is mainly medium–low level, while the carrying capacity and potential are high.
The spatial agglomeration characteristics of the six types of urban development and construction and the three regions constituted by them are obvious in Shandong province (Figure 4A). In terms of the priority of development order, the number of counties from class I to class VI was normally distributed, and there were slightly more counties in class III and only two in class VI. The corresponding development areas are mainly key development zones, including 62 counties. The number of priority development zones and moderate development zones is 56 and 19, respectively. The details are shown in Figure 4B.
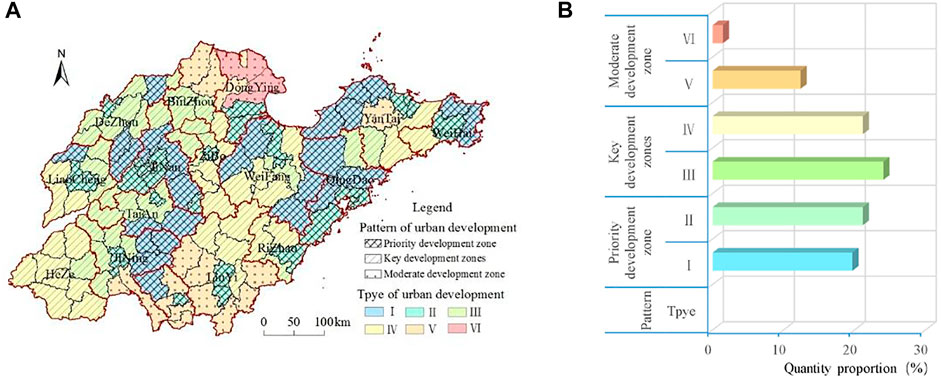
FIGURE 4. (A) Pattern of urban development order and (B) quantity proportion in Shandong province.
Under the conditions of the potential released by the existing resources and environment, funds, engineering measures, and policies, the urban carrying capacity and potential can cope with the pressure of urban development and construction brought on by social and economic development. These areas can give priority to urban construction and development at the beginning of the 14th Five-Year Plan. There are 27 counties in the category I region, accounting for 19.71% of the total, and mainly distributed in the belt area of Jiaodong Peninsula and Jinan, Tai’an, and Jining. This type of region has low urban bearing pressure, high capacity and potential, strong comprehensive urban carrying capacity, and few restricted factors and is the core of the three development areas of Shandong province (the Jiaodong City cluster, the provincial capital city cluster, and the southern Shandong City cluster). During planning, the construction land index should be given priority over urban development and construction in this region. Class II includes 29 counties, accounting for 21.17% of the total, mainly distributed in the periphery of class I and the municipal districts of Linyi, Jining, Liaocheng, and Dezhou. The urban carrying pressure, capacity, and potential of this type are relatively coordinated and all at a high level. Favorable social and economic conditions provide an important guarantee for unleashing potential, while abundant potential provides sustained support for social and economic development.
Only one aspect of the existing resources and environment and stock space potential can cope with the pressure of urban development. Among them, class Ⅲ includes 33 counties, accounting for 24.09% of the total and are concentrated in Dezhou, Liaocheng, Jining, and Binzhou and scattered in Weifang and Yantai. The relationship between the urban carrying capacity of this type is relatively moderate, and the background condition of resources and environment is relatively superior, but it can release less potential. With the increasing pressure of economic development on urban development and construction, it is difficult to continuously meet the demand for construction land. In the future, intensive utilization of land supply should be strictly implemented, and the potential of stock space should be fully explored at the same time. Category IV includes 29 counties that account for 21.17% of the total and are mainly located in Heze, Linyi, Weifang, and Rizhao. The coordination of urban comprehensive carrying capacity of this type is also at a medium level. The existing resources and environment cannot cope with the demand pressure of urban development and construction. However, the potential scale is relatively large, and the potential should be fully released in the future to eliminate the potential risk of increased pressure.
The carrying system of urban construction is in an unbalanced state, and the long-term carrying pressure destroys the resources and environment. Even though increasing support for engineering measures and policies can help, it is difficult to effectively alleviate the pressure of urban development and construction. Category V includes 17 counties, accounting for 12.41% of the total and are mainly distributed in the vicinity of Nansihu Lake in southern Shandong and the Yellow River Delta in northern Shandong. The urban carrying capacity and potential of this type are less than the pressure, and the combined force of the two can basically support the needs of urban development. In the future, we should control the scale of urban development and construction, pay attention to the full combination of the utilization of current resources and the utilization of stock space, and take measures to ensure urban development. Category VI includes two counties, which are distributed in the estuary of the Yellow River in Dongying. The urban carrying capacity and potential of this type are far less than the pressure, and the coordination is seriously unbalanced. Although it is located in a plain area, this region’s resources and environment are obviously limited, and the ecological importance is more prominent. Large-scale urban development and construction activities should be banned in the future, and human activities can be carried out appropriately on the premise of ensuring the stability of the ecosystem.
The diagnostic model of obstacle factor was used for reference, and the evaluation value and optimal value of each index of carrying pressure, capacity, and potential were compared. The weight of each indicator was taken as the contribution degree. The equivalence of “three forces” was taken as the basis for distinguishing significant obstacle factors. The restrictive factors of urban development and construction in different types of regions are obtained (Figure 5), and differentiated control strategies are put forward.
(1) The obstacle factors of urban comprehensive carrying capacity in development zones are less and include Y3, N1, N2, N3, and P3. These zones are mainly limited by water resource shortages, terrain conditions, and low potential for urban industrial and mining utilization. Therefore, this region should improve quality and efficiency, give full play to its own economic advantages, increase the construction of water resource guarantee projects, and guarantee the water resource supply for urban development through water diversion, storage, and water-saving measures. In addition, with the formulation of a new round of territorial space planning comes reasonable demarcation of urban development boundaries. Ecological protection should be strengthened in mountainous and hilly areas located outside of the city. Low hills within the city should be laid out as urban parks. The coordination between urban construction and ecological protection according to local conditions should also be promoted. At the same time, on the premise of ensuring the intensive use of urban land resources, we should implement certain policies, such as comprehensive land improvement, across the whole region and link the increase and decrease in urban and rural construction land. By tapping into the potential of rural construction land and replacing urban and rural land, we will solve the problem of insufficient land supply in order to pave the way for future urban development and constantly improve the competitiveness of cities.
(2) There are many limiting factors of urban comprehensive bearing capacity in key development zones, including nine factors: Y1, Y2, N1, N2, N5, N8, N9, P2, and P6. The main problem lies in the large pressure of population and land and factors such as topographic conditions, environmental capacity, geological disaster sensitivity, urban and rural construction land potential, and urban land price restrict urban development. Therefore, the region should stick to the path of new-type urbanization and green development. We should give priority to the control of urban water and air environment and the reduction and prevention of disasters, strengthen the construction of pollution reduction and disaster-fighting infrastructure, encourage enterprises to develop energy conservation and emission reduction technologies, reduce the discharge of pollutants, and gradually change the urban living environment. At the same time, we should intensify the improvement of existing construction land, focusing on the reconstruction of villages in cities, and the improvement of abandoned industrial and mining land. We should also promote the renewal of old urban areas, increase space for flexible urban development, guide the directional expansion of cities, promote the stability and improvement of urban land prices by improving the quality of cities, and promote the high-quality development of the regional economy.
(3) The moderate development zone has the most limiting factors, including Y1, Y2, Y4, Y5, Y6, N3, N5, N6, P1, P2, P4, P5, and P6. The main problem is that the development and construction of cities are restricted by factors such as poor terrain conditions, insufficient water resources, low environmental capacity, low stock potential, and weak economic capacity under the conditions of large pressure on population, land, and environment. Therefore, the region should fully implement the strategy of ecological protection and high-quality development. First of all, the system of carrying capacity control, regional access, and permission for conversion of ecological space should be implemented to ensure that the area of ecological space is not reduced, the ecological function is not reduced, and the ability to guarantee ecological services is gradually improved. At the same time, we should implement water-saving and emission reduction policies, strengthen the production technology improvement of enterprises that use large amounts of water resources and discharge serious pollution, gradually improve the quality of regional air and water environment, and improve the purification effect of the environment. Secondly, scientific planning of urban development space, rational optimization of industrial structure, strict control of urban development scale, increase per unit of land input, and improve the efficiency of urban land use. Moreover, we should properly tap into the potential of construction land in urban and rural areas in the region. On the premise of giving priority to rural development, surplus targets should be used to supplement the needs of urban development and promote integrated urban–rural development in the region.
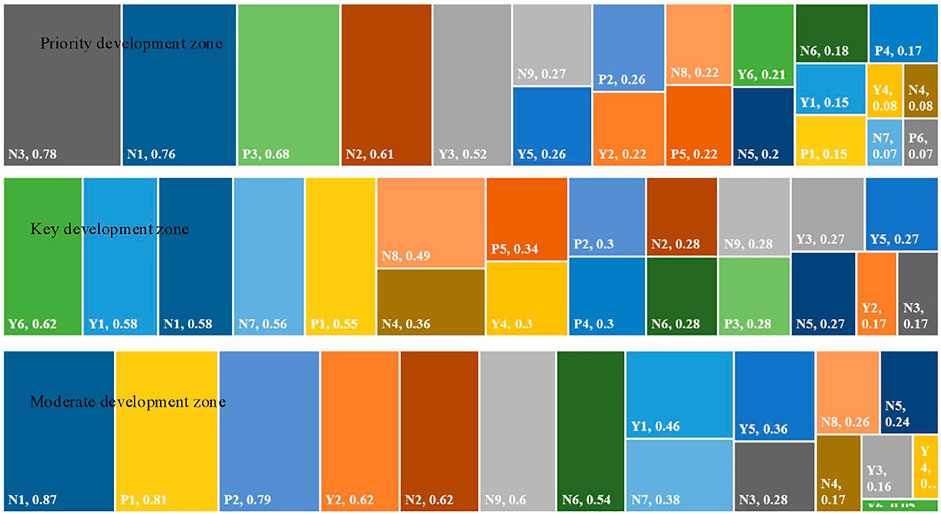
FIGURE 5. Obstacle factors of urban comprehensive carrying capacity in Shandong province.
Based on the concept of urban carrying capacity, this study synthesizes external and internal urban factors and constructs the concept model of “pressure-capacity-potential” urban comprehensive carrying capacity and the corresponding evaluation index system.
By using the methods of multi-factor weighed summation, graded assignment, and graded modification, we were able to calculate subsection variable weight, the carrying pressure index, the capacity index, the potential index, and the comprehensive carrying capacity index. We then set urban development order rules using the two aspects of comprehensives and coordination and formed the urban development pattern of “three districts and six types.” Finally, the study puts forward differential suggestions for the restrictive factors of urban development of different carrying types. The research results of this study have strong practicability and can provide guidance for the optimization of regional main function areas and the orderly arrangement of urban development. The main conclusions of this study are as follows:
Firstly, comprehensive evaluation of urban comprehensive carrying capacity from three aspects of urban carrying capacity, carrying pressure, and carrying potential is helpful for decision-makers to accurately and comprehensively understand the characteristics of urban carrying capacity, and then formulate development strategies in line with reality.
Second, the urban carrying pressure in Shandong province is closely related to population and water and soil resource endowment conditions. The carrying pressure in Shandong is mainly medium and low, but there are a few areas with high pressure. These areas account for 16.06% of the province and are mainly distributed in the municipal districts of Dongying, Zibo, Yantai, Linyi, and Dezhou. The overall urban carrying capacity of Shandong province is high, and the high- and middle-grade capacity areas account for 72.26% of the total and are mainly distributed in the central, western, and northeastern coastal areas of Shandong. The low-grade capacity areas are mainly affected by mountain and hill landforms and geological disasters. The overall urban carrying potential of Shandong province is low, and the potential areas of middle and low grades account for 79.56% of the total, which is mainly restricted by low theoretical potential and unbalanced social and economic development. The overall level of urban comprehensive carrying capacity in Shandong province is high, and regions where the urban carrying capacity is higher than the carrying pressure are dominant. The unbalanced and low level of “three forces” in some regions restricts its comprehensive carrying capacity.
Third, the urban development pattern of “three districts and six categories” proposed by the study has obvious spatial agglomeration characteristics. The number of counties (cities and districts) in the three main areas of priority development, key development, and moderate development decreased successively, accounting for 45.26, 40.88, and 13.87% of the total, respectively. On the whole, it is suitable for urban development and construction. The number of counties (cities, districts) of urban development types from class I to class VI was normally distributed. The high-grade types are mainly distributed in Jiaodong Peninsula, the Jinan–Tai’an–Jining development belt, and the municipal districts of Weifang, Linyi, Liaocheng, and Heze. Moderate development zones are concentrated in Nansihu Lake and the Yellow River Delta.
Four, the urban development of Shandong province is mainly restricted by landform, water resources, environmental capacity, and geological disasters. The degree of constraint varies in different development areas and types. Priority development zones should focus on improving quality and efficiency and give full play to their economic advantages to solve the problem of insufficient water and land resources. Key development zones should follow the path of new-type urbanization and green development and address problems such as low urban quality and inadequate supporting facilities. Moderate development zones should fully implement the strategy of ecological protection and high-quality development and coordinate ecological protection and restoration with urban and rural integrated development.
It should be noted that due to the limitation of difficult data acquisition, this study only analyzed the urban comprehensive carrying capacity in Shandong province in 2019. It will provide more effective information to analyze the spatio-temporal variation characteristics of urban comprehensive carrying capacity based on big data.
The raw data supporting the conclusions of this article will be made available by the authors, without undue reservation.
Conceptualization, BL; methodology, BL and MG; formal analysis, BL and MG; data curation, BL; writing—original draft preparation, LZ and CQ; writing—review and editing, LZ and CQ; visualization, BL and HJ; supervision, ZZ and GD. All authors have read and agreed to the published version of the manuscript.
This work was supported by the funding of the National Natural Science Foundation of China (Grant No. 42077434, 41771560) and the Youth Innovation Technology Project of Higher School in Shandong Province (Grant No. 2019RWG016).
The authors declare that the research was conducted in the absence of any commercial or financial relationships that could be construed as a potential conflict of interest.
The reviewer (ZY) declared a shared affiliation with the author LZ to the handling editor at the time of review.
All claims expressed in this article are solely those of the authors and do not necessarily represent those of their affiliated organizations, or those of the publisher, the editors, and the reviewers. Any product that may be evaluated in this article, or claim that may be made by its manufacturer, is not guaranteed or endorsed by the publisher.
Bai, X., Shi, P., and Liu, Y. (2014). Society: Realizing China's Urban Dream. Nature 509 (7499), 158–160. doi:10.1038/509158a
Chen, M., Liu, W., and Lu, D. (2016). Challenges and the Way Forward in China's New-type Urbanization. Land Use Policy 55, 334–339. doi:10.1016/j.landusepol.2015.07.025
Dong, G., Ge, Y., Jia, H., Sun, C., and Pan, S. (2021). Land Use Multi-Suitability, Land Resource Scarcity and Diversity of Human Needs: A New Framework for Land Use Conflict Identification. Land 10, 1003). doi:10.3390/land10101003
Gao, Q., Fang, C., Liu, H., and Zhang, L. (2021). Conjugate Evaluation of Sustainable Carrying Capacity of Urban Agglomeration and Multi-Scenario Policy Regulation. Sci. Total Environ. 785, 147373. doi:10.1016/j.scitotenv.2021.147373
Gao, Y., Qu, Z., Song, X., and Yun, Z. (2022). Modeling of Urban Road Network Traffic Carrying Capacity Based on Equivalent Traffic Flow. Simul. Model. Pract. Theory 115, 102462. doi:10.1016/j.simpat.2021.102462
Jiang, S., Meng, J., Zhu, L., and Cheng, H. (2021). Spatial-temporal Pattern of Land Use Conflict in China and its Multilevel Driving Mechanisms. Sci. Total Environ. 801, 149697. doi:10.1016/j.scitotenv.2021.149697
Li, G., and Li, F. (2019). Urban Sprawl in China: Differences and Socioeconomic Drivers. Sci. Total Environ. 673, 367–377. doi:10.1016/j.scitotenv.2019.04.080
Liu, Z., Liu, S., Qi, W., and Jin, H. (2018). Urban Sprawl Among Chinese Cities of Different Population Sizes. Habitat Int. 79, 89–98. doi:10.1016/j.habitatint.2018.08.001
Liu, Z., Ren, Y., Shen, L., Liao, X., Wei, X., and Wang, J. (2020). Analysis on the Effectiveness of Indicators for Evaluating Urban Carrying Capacity: A Popularity-Suitability Perspective. J. Clean. Prod. 246, 119019. doi:10.1016/j.jclepro.2019.119019
Liu, B., Deng, M., Yang, J., Shi, Y., Huang, J., Li, C., et al. (2021). Detecting Anomalous Spatial Interaction Patterns by Maximizing Urban Population Carrying Capacity. Comput. Environ. Urban Syst. 87, 101616. doi:10.1016/j.compenvurbsys.2021.101616
Long, H., and Liu, Y. (2016). Rural Restructuring in China. J. Rural Stud. 47, 387–391. doi:10.1016/j.jrurstud.2016.07.028
Meng, C., Du, X., Ren, Y., Shen, L., Cheng, G., and Wang, J. (2020). Sustainable Urban Development: An Examination of Literature Evolution on Urban Carrying Capacity in the Chinese Context. J. Clean. Prod. 277, 122802. doi:10.1016/j.jclepro.2020.122802
Peng, T., and Deng, H. (2020). Comprehensive Evaluation on Water Resource Carrying Capacity Based on DPESBR Framework: A Case Study in Guiyang, Southwest China. J. Clean. Prod. 268, 122235. doi:10.1016/j.jclepro.2020.122235
Qu, Y., Zhan, L., Jiang, G., Ma, W., and Dong, X. (2021). How to Address "Population Decline and Land Expansion (PDLE)" of Rural Residential Areas in the Process of Urbanization:A Comparative Regional Analysis of Human-Land Interaction in Shandong Province. Habitat Int. 117, 102441. doi:10.1016/j.habitatint.2021.102441
Qu, Y., Jiang, G. H., Ma, W. Q., and Li, Z. T. (2021). How Does the Rural Settlement Transition Contribute to Shaping Sustainable Rural Development? Evidence from Shandong, China. J. Rural Stud. 82, 279–293. doi:10.1016/j.jrurstud.2021.01.027
Ren, Y., Shen, L., Wei, X., Wang, J., and Cheng, G. (2021). A Guiding Index Framework for Examining Urban Carrying Capacity. Ecol. Indic. 133, 108347. doi:10.1016/j.ecolind.2021.108347
Shao, Q., Liu, X., and Zhao, W. (2020). An Alternative Method for Analyzing Dimensional Interactions of Urban Carrying Capacity: Case Study of Guangdong-Hong Kong-Macao Greater Bay Area. J. Environ. Manag. 273, 111064. doi:10.1016/j.jenvman.2020.111064
Shen, L., Shu, T., Liao, X., Yang, N., Ren, Y., Zhu, M., et al. (2020). A New Method to Evaluate Urban Resources Environment Carrying Capacity from the Load-And-Carrier Perspective. Resour. Conserv. Recycl. 154, 104616. doi:10.1016/j.resconrec.2019.104616
Shen, L., Yang, Z., Du, X., Wei, X., and Chen, X. (2022). A Health Risk-Based Threshold Method to Evaluate Urban Atmospheric Environment Carrying Capacity in Beijing-Tianjin-Hebei (BTH) Region. Environ. Impact Assess. Rev. 92, 106692. doi:10.1016/j.eiar.2021.106692
Shen, L., Cheng, G., Du, X., Meng, C., Ren, Y., and Wang, J. (2022). Can Urban Agglomeration Bring "1 + 1 > 2 Effect"? A Perspective of Land Resource Carrying Capacity. Land Use Policy 117, 106094. doi:10.1016/j.landusepol.2022.106094
Sun, C., Chen, L., and Tian, Y. (2018). Study on the Urban State Carrying Capacity for Unbalanced Sustainable Development Regions: Evidence from the Yangtze River Economic Belt. Ecol. Indic. 89, 150–158. doi:10.1016/j.ecolind.2018.02.011
Sun, M., Wang, J., and He, K. (2020). Analysis on the Urban Land Resources Carrying Capacity during Urbanization--A Case Study of Chinese YRD. Appl. Geogr. 116, 102170. doi:10.1016/j.apgeog.2020.102170
Tian, Y., and Sun, C. (2018). Comprehensive Carrying Capacity, Economic Growth and the Sustainable Development of Urban Areas: A Case Study of the Yangtze River Economic Belt. J. Clean. Prod. 195, 486–496. doi:10.1016/j.jclepro.2018.05.262
Wang, Y., Wang, Y., Su, X., Qi, L., and Liu, M. (2019). Evaluation of the Comprehensive Carrying Capacity of Interprovincial Water Resources in China and the Spatial Effect. J. Hydrol. 575, 794–809. doi:10.1016/j.jhydrol.2019.05.076
Wang, J., Huang, X., Gong, Z., and Cao, K. (2020). Dynamic Assessment of Tourism Carrying Capacity and its Impacts on Tourism Economic Growth in Urban Tourism Destinations in China. J. Destination Mark. Manag. 15, 100383. doi:10.1016/j.jdmm.2019.100383
Wang, J., Ren, Y., Shen, L., Liu, Z., Wu, Y., and Shi, F. (2020). A Novel Evaluation Method for Urban Infrastructures Carrying Capacity. Cities 105, 102846. doi:10.1016/j.cities.2020.102846
Wang W, W., Jiao, L., Zhang, W., Jia, Q., Su, F., Xu, G., et al. (2020). Delineating Urban Growth Boundaries under Multi-Objective and Constraints. Sustain. Cities Soc. 61, 102279. doi:10.1016/j.scs.2020.102279
Weng, H., Kou, J., and Shao, Q. (2020). Evaluation of Urban Comprehensive Carrying Capacity in the Guangdong-Hong Kong-Macao Greater Bay Area Based on Regional Collaboration. Environ. Sci. Pollut. Res. 27 (16), 20025–20036. doi:10.1007/s11356-020-08517-6
Wu H, H., Wang, M. J., Lin, A. Q., Zhu, W. C., and Wang, W. (2021). Analyzing Spatial Characteristics of Urban Resource and Environment Carrying Capacity Based on Covert-Resilient-Overt: A Case Study of Wuhan City. Acta Geogr. Sin. 76 (10), 2439–2457.
Wu M, M., Wu, J., and Zang, C. (2021). A Comprehensive Evaluation of the Eco-Carrying Capacity and Green Economy in the Guangdong-Hong Kong-Macao Greater Bay Area, China. J. Clean. Prod. 281, 124945. doi:10.1016/j.jclepro.2020.124945
Zhang, F., and Zhu, F. (2022). Exploring the Temporal and Spatial Variability of Water and Land Resources Carrying Capacity Based on Ecological Footprint: A Case Study of the Beijing-Tianjin-Hebei Urban Agglomeration, China. Curr. Res. Environ. Sustain. 4, 100135. doi:10.1016/j.crsust.2022.100135
Zhang, Z., Hu, B., and Qiu, H. (2022). Comprehensive Evaluation of Resource and Environmental Carrying Capacity Based on SDGs Perspective and Three-Dimensional Balance Model. Ecol. Indic. 138, 108788. doi:10.1016/j.ecolind.2022.108788
Zhao, Y., Xue, X., Huang, Y., and Kong, H. (2021). Evaluating Comprehensive Carrying Capacity of Coastal Area Using the Matter-Element Extension Method: A Case Study in Fujian Province of China. Ocean Coast. Manag. 214, 105902. doi:10.1016/j.ocecoaman.2021.105902
Zhou, J., Chang, S., Ma, W., and Wang, D. (2021). An Unbalance-Based Evaluation Framework on Urban Resources and Environment Carrying Capacity. Sustain. Cities Soc. 72, 103019. doi:10.1016/j.scs.2021.103019
Keywords: urban comprehensive carrying capacity, development order, pressure–capacity–potential model, urban development pattern, Shandong province
Citation: Li B, Guan M, Zhan L, Liu C, Zhang Z, Jiang H, Zhang Y and Dong G (2022) Urban Comprehensive Carrying Capacity and Development Order: A “Pressure-Capacity-Potential” Logical Framework. Front. Environ. Sci. 10:935498. doi: 10.3389/fenvs.2022.935498
Received: 04 May 2022; Accepted: 25 May 2022;
Published: 07 July 2022.
Edited by:
Wenqiu Ma, China Agricultural University, ChinaReviewed by:
Zhiheng Yang, Shandong University of Finance and Economics, ChinaCopyright © 2022 Li, Guan, Zhan, Liu, Zhang, Jiang, Zhang and Dong. This is an open-access article distributed under the terms of the Creative Commons Attribution License (CC BY). The use, distribution or reproduction in other forums is permitted, provided the original author(s) and the copyright owner(s) are credited and that the original publication in this journal is cited, in accordance with accepted academic practice. No use, distribution or reproduction is permitted which does not comply with these terms.
*Correspondence: Lingyun Zhan, Wmx5dGR6eWdsQDE2My5jb20=; Chunqiang Liu, MTMxNzI5NDg0NDJxcS5jb20=
Disclaimer: All claims expressed in this article are solely those of the authors and do not necessarily represent those of their affiliated organizations, or those of the publisher, the editors and the reviewers. Any product that may be evaluated in this article or claim that may be made by its manufacturer is not guaranteed or endorsed by the publisher.
Research integrity at Frontiers
Learn more about the work of our research integrity team to safeguard the quality of each article we publish.