 Tongtong Zhao*
 Fangyi Jiao
- School of Economics and Business Administration, Heilongjiang University, Harbin, Heilongjiang, China
With economic development, the global ranking of China’s business environment has been greatly improved; however, the cost of rapid economic development is a growing disparity in income among urban–rural areas. As a result, investigating the impact of the business environment on the urban–rural income gap is critical to determining how to narrow the urban–rural income gap and achieve common prosperity. This study collects and organizes data from 31 provinces in China from 2011–2019 and provides an analysis of optimizing the business environment on the urban–rural wealth divide using the Durbin spatial model and adjacent spatial weight matrix. The accompanying three results are presented from this survey: 1) the outcomes of the spatial Durbin model discovered that there is a spatial spillover effect on the business environment, and optimizing the business environment not only reduces the regional urban–rural income gap but also has an impact on the regional urban–rural wage crevice in neighboring regions; 2) through the use of empirical analysis methods to test the different dimensions of the business environment, it is found that the overall impact of the product market development, non-state economy development, market intermediary development, and legal system has a significant spatial spillover effect on reducing urban and rural income inequality; 3) deeper research finds that there is regional heterogeneity in the effect of improving the business environment on the urban–rural wage hole. Only the central provinces have a significant spatial business environment spillover effect, while there is no significant business environment spillover effect in the eastern and western provinces. China should further accelerate the construction of the business environment, which is of great importance to lessen the disparity in wealth between urban–rural areas.
1 Introduction
China has one of the world’s broadest income disparities among both urban and rural areas (UNDP, 2005). Since 1978, when China opened its doors to the outside world, the level of economic development has risen as never before. But behind China’s rapid economic growth has also come a great price, such as impeded mobility between classes, wide disparities in the wealth owned by individuals in groups or societies, and the problem of inequality remains prominent. With economic growth, China’s income disparity has rapidly widened and the Gini coefficient has been chronically high (UNDP, 2016), from 0.317 in 1978 to 0.4 in 1994 when it first exceeded the international alert line, reaching a peak in 1996. From 2002–2021, China’s Gini coefficient increased and then decreased, reaching a high in 2008. Although there has been a decreasing trend in the last decade (see Figure 1), it is still above the international alert line, demonstrating that the current circumstance of the urban–rural salary hole in China is still not optimistic (NBSC, 1991a). It is difficult to find another economy in the world where the distribution of income has changed as much and as quickly as in China (Naughton, 2007).
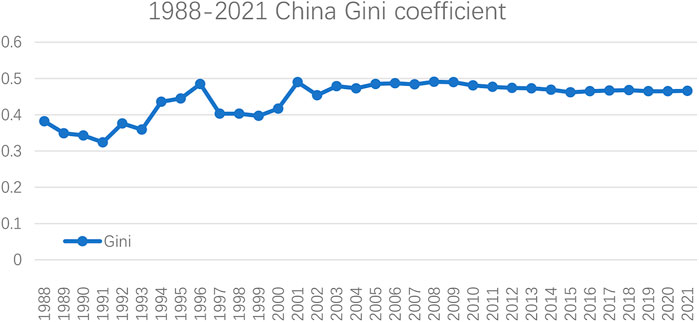
FIGURE 1. 1988–2021 China Gini coefficient.
In 2021, the per capita expendable income of urban residents in China reached 47,412 yuan while that of rural residents reached 18,931 yuan, culminating in an urban–rural income gap ratio of about 2.5:1. Although it has decreased compared with previous years, the general urban–rural wage crevice is still too large, which denies rural residents the benefits of rapid economic development and has a negative impact on social stability and fair governance (NBSC, 1991b; Yu and Wang, 2021). After China has fully achieved a moderately prosperous society, at the Fifth Plenary Session of the 19th Central Committee in 2020, the visionary objective of essentially achieving socialist modernization by 2035 was first put forth, with more visible and substantial progress toward common prosperity for all people. However, achieving common prosperity still faces many problems; regional disparities, urban–rural disparities, and income disparities are difficult points in the strategic path toward common prosperity (Hu and Zhou, 2022), and keeping the income gap within a reasonable range is an inevitable requirement for achieving common prosperity in China (Li and Shen, 2022). As a result, China’s challenge is how to contract the income hole between the city and rustic areas.
In recent years, governments at all levels in China have been reforming “streamline governance and delegation, combine decentralization and regulation, and optimize services,” optimizing the business environment, stimulating market vitality, and strengthening the endogenous driving force for development. It is to be noted that China’s business environment has entered the top 40 of the world for the first time and ranked 31 of the world, an increase of 15 places compared to 2019, and 2 years in a row, China was selected as one of the 10 largest economies with the greatest improvement in the global business environment. China is constantly strengthening construction related to the business environment, and its constant efforts are achieving remarkable results. To some extent, the business environment encompasses a critical effect on local economic advancement. The substance of improving the business environment is to optimize institutional mechanisms and promote market activities (Lai, 2020). Theoretically, rural areas with a well-developed business environment are more conducive to promoting entrepreneurship and employment and attracting investment, which in turn can keep more labor in rural areas, raise rural residents’ incomes, and narrow the income gap with urban residents. Therefore, how will the salary hole between urban–rural dwellers change as the business environment improves? What implication does space have on the wealth disparity between the city and country? This question needs to be further studied and proven.
This article’s research innovation can be described in four aspects: first and foremost, our contribution adds to the existing literature on the drivers of the urban–rural wage disparity from the spatial perspective of the new driver of the business environment. Second, the income gap and business environment are placed under the same spatial economic analysis framework, focusing on the total effect, direct effect, and indirect effect, which can entice relevant researchers to focus on the spatial influence of the business environment. Third, this article analyzes the business environment according to five dimensions and analyzes the influence of different sub-dimensions on the disparity between urban and rural incomes, making this article’s study findings more trustworthy; finally, the analysis in this study shows that economic development is a double-edged sword, and neither China nor other countries can ignore the negative effects brought by it just for the sake of economic development.
The following is the research arrangement for the study: Section 2 is literature review. Section 3 outlines the research hypothesis for the study. Section 4 sets up the research model for this study, choosing relevant variables, and conducting descriptive statistics; Section 5 exemplifies a detailed empirical evidence process and analyzes the results, and Section 6 draws research findings and provides valuable proposals depending on the aforementioned outline and analysis.
2 Literature review
2.1 Business environment
The three primary areas of the study of the business environment (doing business) are as follows: the definition of the concept of the doing environment, how to develop construction of the business environment metrics, and the significance of having an excellent business environment.
First, according to the World Bank, doing business is categorized as the external environmental conditions faced by businesses in all aspects of their activities from start to finish in 2019. As economies vary greatly in terms of systems, cultures, and levels of development, countries can adjust accordingly to their realities. In China’s Regulation on Optimizing the Business Environment, published in 2019, the business environment has been defined as the institutional factors and conditions that affect the market economic behavior of firms and other market participants. According to Chinese scholars Song and He (2018), the business environment is a natural complex of the political, economic, lawful, international, and other environments created by an economy’s government over a specific time duration to boost the local market and activate foreign trade through systematic reforms in political economy, the rule of law, and opening to the outside world.
Second, the Regulations on Optimizing the Business Environment propose to build China’s business environment evaluation system according to three principles: “international comparability, benchmarking with the World Bank, and Chinese characteristics.” According to the definition of a business environment and choosing different focuses, different scholars have constructed quantitative indicators from two aspects: macro and a direct reflection of business operations. The macro level mainly focus on political–military (Yang et al., 2020), economic and financial (Dong et al., 2012), cultural innovation, natural ecology (Li, 2021), market environment (Zhang et al., 2020), legal policies (Feng and Zhang, 2020), infrastructure (Zhao et al., 2021), innovation level, open level, and public services (Tu et al., 2022). To build a comprehensive measure of a business environment relevant to China’s national contexts, drawing on domestic and international evaluation systems for the business environment. One of the more representative ones, Wang et al. (2018) adopted the China Marketization Index as the evaluation index of China’s business environment, which mainly includes five aspects that will be dealt with later research in this article. In terms of operational indicators that directly reflect the business, these include 11 tier-1 indicators such as launching an enterprise, getting a construction permit, registering property, acquiring credit, acquiring electricity, safeguarding minority investors, submitting tax returns, trading across borders, enforcing activities, handling bankruptcy, and employing staff (World Bank, 2020).
Third, there are two distinct ways to the significance of the business environment: promoting enterprise development and enhancing the status of global value chains. Nguyen and Wong (2021) used an extended model based on data from Vietnamese listed firms; according to the findings of the study, improvements in the business environment reduce firms’ cash holdings and vice versa. Vu et al. (2021) used a 10-year longitudinal dataset of Vietnamese SMES and found that improvements in the quality of the business environment contribute to less tax corruption in transition economies. Cui et al. (2022) concluded that improving the business environment promotes the economic growth of trading partners.
2.2 Factors influencing the urban–rural income gap
Scholars have deployed extensive research on income disparity, and based on the available literature, it does seem that the factor of a dualistic economic system is strong (Research Group of the General Agricultural Survey Team of the National Bureau of Statistics, 1994). Further inquiry into the factors which influence the urban–rural wealth disparity revealed that economic policies with an urbanization bias can greatly decrease the urban–rural income division; however, with the conversion of population household registration between towns and cities (Wan and Li, 2013), economic openness, denationalization, and government involvement in economic activities (Lu and Chen, 2004), the increased role of the non-state sector in employment and income generation can significantly narrow the urban–rural income hole (Lin et al., 1998).
With the continuous innovation of science and the rapid growth of internet economy and technology, some researchers have discovered a reverse U-shaped relationship between the internet and wage disparities between cities and countries (Cheng and Zhang, 2019; Luo et al., 2021); the widespread use of information technologies, network technologies, and smart technologies in the industrial sector does not contribute to blocking the income hole between city and rustic zones (Liu, 2020). Financial inclusion (Xiao et al., 2020; Zhou et al., 2020), urbanization level (Zhao et al., 2018), etc. are also detrimental to the disparity in income between urban and rural communities.
2.3 Relationship between the business environment and urban–rural income gap
There are fewer studies on the correlation between the business environment and urban–rural income hole at home and abroad, mainly in terms of direct and indirect relationships.
In terms of direct relationships, Lai (2021) selected cross-country panel data as the research sample and conducted an empirical study, measuring the earning discrepancy in both urban and rural locations using the Gini coefficient, and according to the report, enhancing the business climate will contribute to closing the salary disparity between urban and rural communities. Kolko et al. (2013) divided the doing business index into two dimensions, the productivity index and the tax cost index, using 10 doing business indices over the period 1992–2008, and found that regions ranked high in tax costs increased inequality and vice versa; the productivity index was not related to inequality.
In terms of indirect relationships, Ncube et al. (2021), through a study of African countries, concluded that stronger economic growth is associated with an improved entrepreneurial environment and that entrepreneurial activity can reduce income inequality and narrow income gaps (Georgiou, 2009; Zou, 2018). Nam and Bao Tram (2021) used a random probability estimation method with 10 randomly selected SMEs in Vietnam and found that an improved business environment is conducive to strengthening innovation policies for SMEs.
Although the research literature has shown that improvements in the business environment would inhibit further urban–rural salary hole growth but ignore the spatial effect of the business environment, there is very little research on this aspect so far. As a result, using data from 31 Chinese provinces as a sample, this study investigates whether there is a spillover effect in the space of business environment improvement on the urban–rural wage hole to provide new ideas for the study of the business environment and the urban–rural wage hole.
3 Theoretical analysis and research hypothesis
The World Bank launched the Doing Business Index in 2002 to measure the reforms being deployed in underdeveloped countries to boost the economy. Rogerson and Rogerson (2010) concluded from interviews with 100 foreign investors and 10 chambers of commerce that the local business environment must be improved. A good business environment can lead to job opportunities and improved livelihoods (Malik, 2018) and can contribute to economic development through two channels: promoting productive private investment and increasing entrepreneurial activity (Dong et al., 2012); it can also promote equitable access to production factors for different market players and achieve a market-based allocation of production factors (Li et al., 2021). Central and Eastern Europe and the Baltic States have rapidly closed the productivity gap with developed economies by improving the business environment (Brixiova and Egert, 2012). Lai (2020) used the fixed-effect model and concludes that there can be a solid positive connection between the business environment and economic growth. The enhancement of the business environment can provide a better environment for entrepreneurship and investment. With a relatively low population density and abundant land and human resources in rural areas, the improvement of the business environment will attract more enterprises and capital, increasing the rural employment rate and the income of residents working in rural areas.
Spatial spillover is one of the causes of spatial effects (Anselin and Bera, 1998). The spatial spillover effect would be the space-time impact caused by fluctuations in a single spatial unit’s variable and it is used to assess the impact of the change in this zone on variations in other regions (Lesage and Pace, 2009). The first law of spatial geography tells us that the correlation between features is proportional to distance; the closer the distance, the greater will be the correlation between features, and vice versa. So, neighboring provinces should have a close regional correlation. In other words, the positive effect of an optimized business environment in a certain region on the local area may, because of its geographical correlation, promote the optimization and development of the business environment in neighboring areas as well, which in turn affects the income of the residents. Therefore, according to the aforementioned examination of the business environment and urban–rural earning hole, research hypothesis 1 of this work is proposed as follows:
H1: The optimization of the business environment aids in lessening the wealth inequality between city and country; furthermore, there is a substantial spatial spillover effect.
Based on the previous definition of the business environment and the construction of comprehensive measurement indicators, it is obvious that the business environment covers a wide range of areas, including politics, finance, innovation, and ecology, and therefore, studies related to it have been conducted from different perspectives. For example, financial innovation in agricultural land can decrease the urban–rural income hole by inspiring permanent labor migration and industrial upgrading (Li and Li, 2022) and there is a virtuous circle between technological innovation and the urban–rural income disparity (Antonelli and Gehringer, 2017). Li and Li (2021) used the mediation effect model and discovered that the new round of financial measures gives local governments more autonomy and the increasing level of fiscal policy is amenable to shuttering the urban–rural income disparity, with the effect being much more pronounced in eastern and southern coastal regions. Business environment optimization can boost trust and encourage high-quality development (Chen et al., 2020). Deng (2017), by constructing a social welfare function that includes urban and rural economic output, found that government-led population mobility increases the urban–rural income disparity, while the interaction term narrows it. Sun and Zhao (2019) used a spatial lag model and a spatial error model and found that technological progress significantly suppresses the urban–rural income gap. Gong et al. (2019) used Chinese household income survey data and found that the higher the efficiency of land allocation and human capital structure, the more it will help to keep the urban–rural income disparity from widening further. Through the aforementioned theoretical analysis, research hypothesis 2 is put forward.
H2: Examining different perspectives of the business environment, it can be found that changes in different perspectives of the business environment have made a difference to control further broadening of the urban–rural salary hole.
Areas with a good business environment can better develop their economy because the construction of a better business environment has a greater attraction for enterprises. Enterprises are the main body of the market economy and the important foundation of economic development. Moreover, there is an agglomeration effect in the business environment. A good business environment can attract more enterprises to develop locally. At the same time, it can also attract other companies in the same industry to develop in these regions, and then attract the upstream and downstream industries of the industry to invest, which is conducive to promoting the establishment of a complete industrial chain. Enterprises will attract more human capital, and the government will also consider taking better measures to promote the development of enterprises, such as improving transportation, providing social welfare, and reducing taxes and fees. China’s rural areas are rich in land resources and have the advantage of low cost. Compared with cities, the initial investment is less. On the one hand, it can help businesses save money; on the other hand, it can promote work opportunities, boost the income of rural residents, and narrow the income gap between urban and rural areas.
In addition, China has always had the problem of uneven development between regions. In general terms, the business environment in the eastern region is the best, while the central and western regions have made great progress compared to the past, but there is still a big gap between them. On the one hand, the good or bad business environment is related to the basic conditions of each region, like some economically developed regions in the east, and the government’s service consciousness and law enforcement ability are better, and enterprises will find such a business environment more conducive to their survival and development; on the other hand, regions with a good business environment have a better understanding of the content of the business environment optimization work and stronger execution, thus, forming a virtuous circle. Through the aforementioned theoretical analysis, research hypothesis 3 is proposed.
H3: The improvement of the different perspectives of the business environment shows different effects due to the presence of geographical differences.
4 Variable selection and model design
4.1 Variable selection and data sources
4.1.1 The dependent variable
The urban-rural income gap (Theil). Currently, there are four main methods for calculating the income disparity between cities and rural areas: the first method compares urban residents’ disposable income to rural residents’ net income. The second is the ratio of per capita consumption expenditures of urban dwellers and rural dwellers. The third opts for the Gini coefficient, and the fourth chooses the Theil index. According to Wang and Ouyang (2020), the first approach cannot reflect the proportion of the urban and rural population, the second solution has similar drawbacks, and the third approach relies on demonstrating that the total income disparity is not the urban–rural wealth inequality, and the Gini coefficient is so much more sensitive to changes in middle-class income, whereas the urban–rural growing inequality primarily reflects changes at the upper and lower economic levels, and the Theil index can backslide the urban–rural wealth gap. The specific method of calculating the Theil index is as follows:
where theili,t implies the urban–rural income gap in province i in period t, j = 1, 2 components represent both urban and rural areas, Pij symbolizes the size of the population in the province’s urban or rural areas i, Pi designates residents’ area in province i; Iij indicates the total urban or rural earning in area j of province i, and Ii symbolizes total earnings in province i.
4.1.2 The core independent variables
Business environment (mar). A business environment is described by the World Bank as the external conditions faced by companies face from start-up to completion (World Bank, 2020). According to the principle of “international comparability, comparison with the World Bank, and Chinese characteristics,” China defines a business environment as the institutional factors and conditions that influence the activities of market entities such as enterprises in market economic activities. At present, there is no unified system for assessing the business environment, and this study chooses the marketability index compiled by Wang et al. (2018) as a proxy variable for the business environment, which is divided into five dimensions and 14 first-level indicators, with the content contained in each indicator as shown in Table 1.
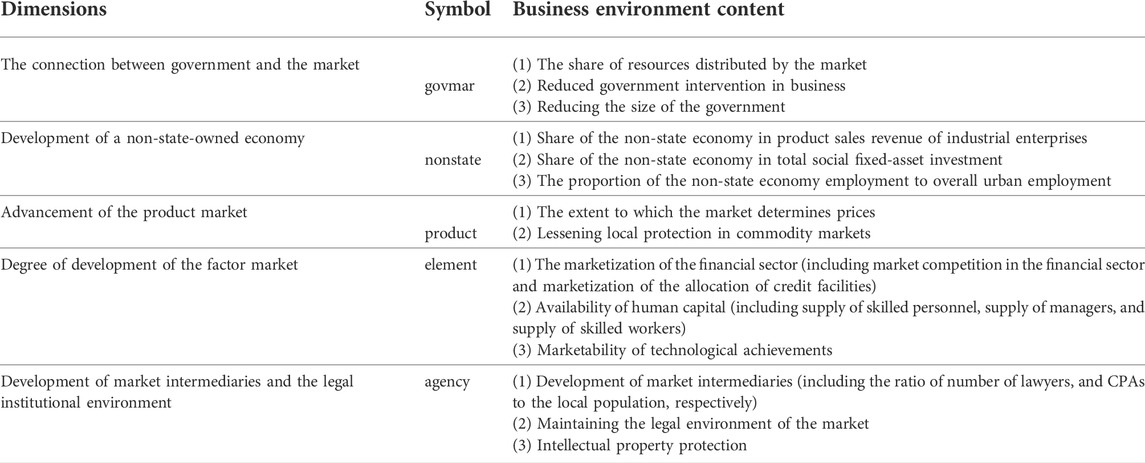
TABLE 1. Business environment indicator evaluation system.
4.1.3 Control variables
To prevent the possible effect of the existence of neglected variables on the empirical evidence, this study refers to Deng and He (2018), Cheng and Zhang (2019), Luo et al. (2021), and other studies, and incorporates control variables in the specific context of this study. The human capital level (edu) is used as a proxy variable for the average years of education in each province each year; the population density (pop) is directly selected from the China Population and Employment Yearbook; and the Industrial Structure Rationalization Index (Ind) aims to verify whether the development of the industrial structure in each region is reasonable. This study follows the calculation method suggested by Gan et al. (2011), in which the more the index converges to 1, the more plausible the industrial structure is; the degree of fiscal revenue and expenditure (fin), which is expressed as the ratio of general public budget revenue to budget expenditure, and the average yearly import and export volume to local GDP ratio of each province explain the degree of openness to the outside world (open). Table 2 shows the calculation formulas for each control variable.
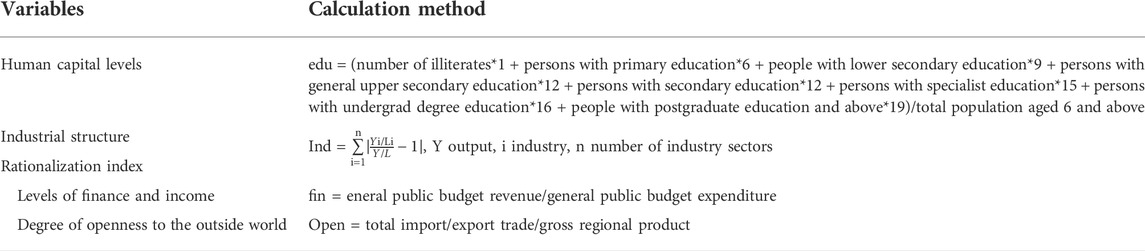
TABLE 2. Calculation of control variables.
4.2 Data sources and descriptive statistics
This study selects the panel data from 31 Chinese provinces (excluding Hong Kong, Macau, and Taiwan) for a total of 9 years from 2011 to 2019. Among them, the indicators of the business environment and the urban–rural earning hole are drawn from the China Statistical Yearbook, China Urban Statistical Yearbook, and China Population and Employment Statistical Yearbook from 2012 to 2020. Each variable’s statistical description is shown in Table 3. Among them “observation,” “mean,” “sd,” “min,” and “max” represent the total research sample, the sample mean, sample standard deviation, research sample minimum value, and research sample maximum value, respectively, in this work.
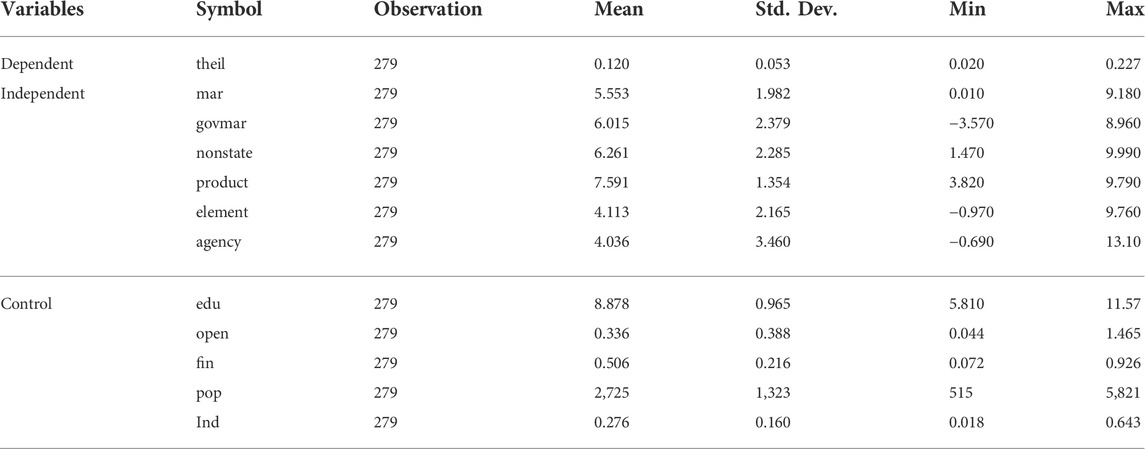
TABLE 3. Descriptive statistics of variables.
4.3 Econometric model construction
4.3.1 Spatial econometric model selection and construction
The first law of spatial geography tells us that the correlation between features is related to distance. By and large, the correlation between the elements increases with the proximity of geographical distance. The improvement and development of the business environment in one province can be influenced by the improvement in the business environment in other surrounding provinces, and the neighboring provinces should have a close regional correlation. Based on this, this study chooses a spatial econometric analysis method that takes the spatial correlation into account of economic activities, detects the effects of the business environment on the urban–rural income disparity, and measures the urban–rural income hole. In combination with the research content of this work, the adjacency weight matrix is constructed.
The adjacency weight matrix W01 assumes that spatial interactions occur when spatial units share common geographic boundaries. The element Wij in W01 takes the value 1 when province i is adjacent to province j and 0 otherwise. The specific grouping of the W01 matrix is defined as follows.
Spatial econometric models include three main types: the spatial lagged model (SLM), the spatial error model (SEM), and the spatial Durbin model (SDM), where the SLM only includes the spatial spillover effects generated by the core independent variables between regions, the SEM mainly examines the effects generated by omitted variables or random disturbance terms that are not in the explanatory variables, and the SDM combines the characteristics of the aforementioned two models.
If the urban–rural income disparity in the province depends to some extent on the impact of spillovers from the income disparity between urban and rural areas in neighboring provinces, the SLM needs to be used.
where i denotes the various provinces of the panel data (i = 1,2,3,…, 31), t represents this study’s time series (t = 1,2,3,…, 9), and Wi,j represents a spatial weight matrix element. In this study, we have also normalized using the adjacency matrix to construct the spatial weight matrix.
The dependent variable theili,t denotes the urban–rural income hole in province i in year t. The core independent variable busi,t denotes the business environment in province i in year t.
If the provincial urban–rural earning gap is influenced to some extent by urban–rural income gap errors in neighboring provinces, the SEM needs to be used.
where
If the spatial spillover effect and the spatial error term of the urban–rural in nearby areas influence the urban–rural wealth divide in the province, there are indeed outside effects. This tends to mean that the core independent variable of the business environment could also affect the wealth inequality between urban and rural areas and the SDM must be used.
where
To select a spatial econometric model suitable for this study, this study draws on Elhorst’s (2014) study. First, in this study, it is critical to assess whether a spatial trend occurs; second, the most appropriate model for this study should be chosen among the three spatial econometric models mentioned previously; and finally, individual or periodic effects (fixed, random, or double effects) should be determined. Specifically, we used Morans’ I test to perform a spatial correlation test. In addition, we used to perform the Lagrange multiplier test (LM-spatial error), LM-spatial lag, Robust Lagrange multiplier test (Robust LM-spatial error), and Robust LM-spatial lag test to determine which model to use. When only one of the LM-lag and LM-error processes pass the significance test, it indicates that the non-spatial traditional panel model is no longer applicable and that a preference between the spatial models is required; if both pass this same validity test, the implications of the Robust LM-spatial error and Robust LM-spatial is observed; if all four among those methods pass the significance test, it indicates that both SLM and SEM are likely to apply, at which moment in time the suitability of Finally, the Hausman test is used to identify whether the fixed effects and random effect models are appropriate.
4.3.2 Spatial autocorrelation test
Before using the spatial econometric model to estimate the impact of the spatial spillover effect of the business environment on the urban–rural income gap, a spatial autocorrelation test needs to be conducted on the business environment indicators and the urban–rural income gap indicators for all provinces to verify whether they are auto-correlated in space. Moran’s I takes a value between -1 and 1, and the formula is as follows.
Yi denotes the indicators of the business environment and urban–rural income gap, Wi,j denotes the spatial weighting factor, N denotes the total number of provinces, and S2 represents the sample variance.
Moran’s I values for each province from 2011–019 and the p-values are shown in Table 4; it is clear that the indicators of the urban–rural earning disparity, the overall indicator of the business environment and its sub-dimensions and Moran’s I values are all positive, with the majority passing the significance test, inferring a solid spatial correlation between the business environment and the wealth disparity between urban and rural areas among nearby areas.
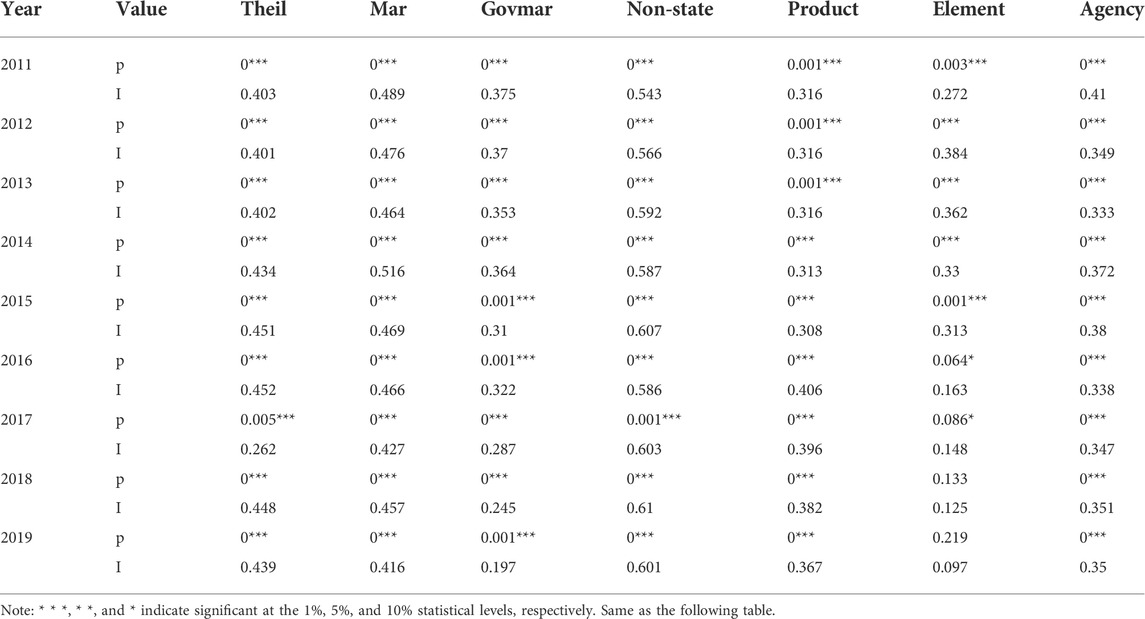
TABLE 4. Business environment and the urban–rural income gap Moran’s I value.
4.3.3 Model-identification and testing
Spatial auto-correlation tests indicate that the business environment and the earning disparity in both urban and rural areas are both strongly spatially correlated, and therefore, the spatial factor cannot be ignored in studying the role of the business environment on the earning disparity in both urban and rural zones. The estimation results of the spatial econometric model are shown in Table 5. First, to test the applicability of the mixed OLS regression model, an LM test was conducted, and the test results revealed that the p-values of both the spatial error model (LM-spatial error) and the spatial lag model (LM-spatial lag) were significant, indicating both spatial error and spatial lag effects. In line with the aforementioned test procedure, it was shown that the non-spatial traditional panel OLS model is no longer applicable. Second, Robust LM-spatial error and Robust LM-spatial both pass the significance test, which suggests that both the SLM and SEM are applicable. Again, LR and Wald tests were conducted to test the applicability of the SDM and all results passed the significance test, demonstrating that the SDM does not degenerate into an SLM or SEM, suggesting that the spatial Durbin model is most applicable to this study. Ultimately, the Hausman correlation test was conducted to assess whether random or fixed effects were chosen. The Hausman test statistic was 6.57 with a significant p-value of 0, so the fixed effects model was chosen for the regression.
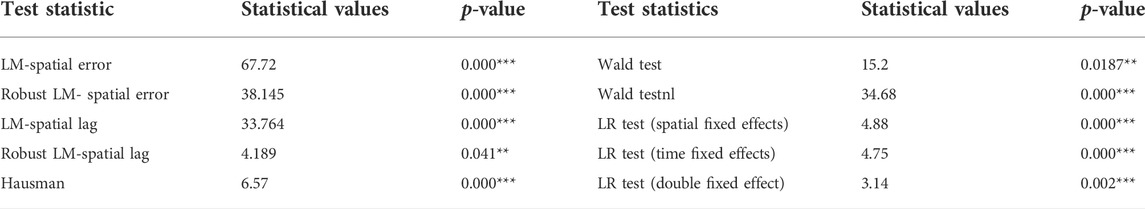
TABLE 5. Estimation results of the spatial econometric model of the business environment and urban–rural income gap.
5 Spatial econometric tests and analysis of empirical results
5.1 Spatial Durbin model regression results
The regression results of the SDM model with spatial fixed effects are shown in Table 6. Column (1) is the spatial measure of the province’s business environment optimization, which shows that the coefficient is hugely negative and runs the 10% test statistic, revealing that the business environment advance can increase urban–rural income equality in the province. Column (2) indicates that perhaps the business environment enhancement has a space-time spillover effect on nearby areas, with the regression coefficient being significantly negative and passing the 1% hypothesis testing, clearly showing that such business environment optimization does indeed have a spatial spillover effect on neighboring provinces. Column (3) demonstrates that the spatial regression coefficient is 0.352, passing the 1% practical assessment, implying the existence of the spatial impact. In summary, the improvement of the business environment greatly influences the urban–rural wage gap and has a spatial spillover effect, asserting the research hypothesis H1.
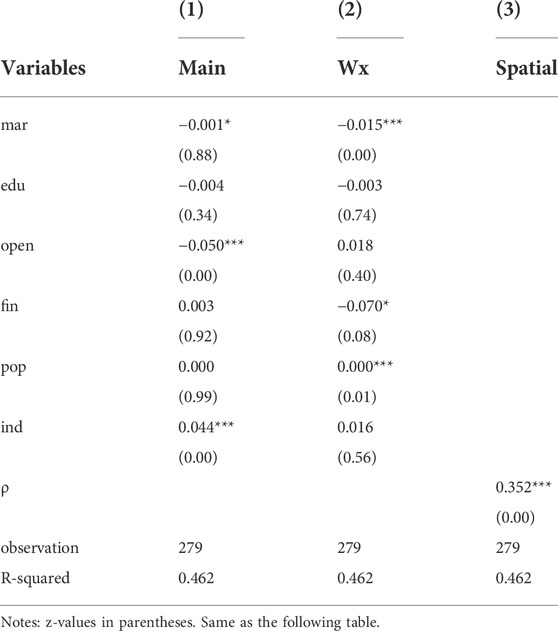
TABLE 6. Baseline regression results.
5.2 Decomposition of spatial effects
Table 7 shows the total utility, direct effect, and indirect effect of the spatially lagged business environment and its sub-dimensions on the urban–rural salary hole. The direct effect represents the influence of business environment optimization on the urban–rural salary hole within the province; the indirect effect (spillover effect) represents the impact of business environment optimization on the urban–rural income gap in neighboring provinces. Without considering the effects of other factors, the total effect of business environment optimization on the urban–rural pay hole should be equal to the sum of the direct and indirect effects. It can be found that the total and indirect effects of the spatial spillover effect of the total indicators of the business environment on the urban–rural income disparity are significantly negative, and the direct effect is also negative, but not significant.
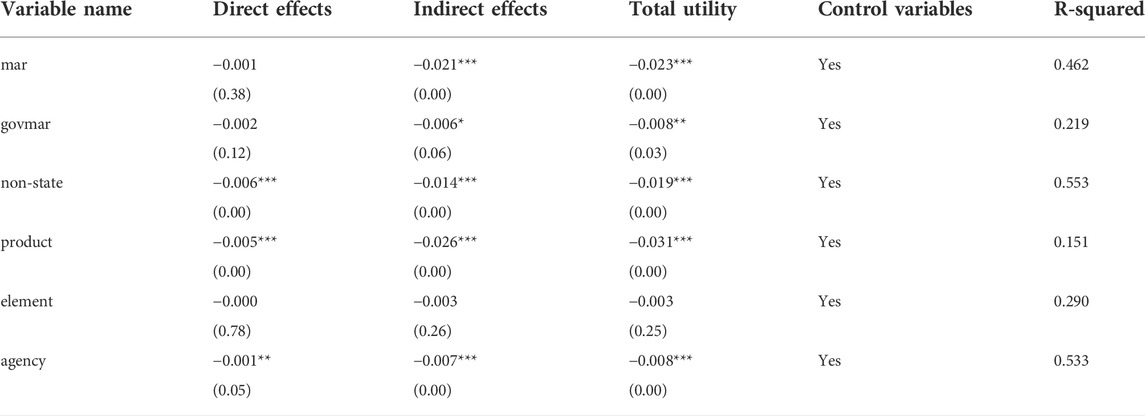
TABLE 7. Decomposition of the spillover effect on the business environment on the urban–rural income disparity.
As shown in the results of the direct effect sub-dimensional regressions, the regression coefficients of “nonstate,” “product,” and “agency” are −0.006, −0.005, and −0.001, respectively, and have all passed the % significance test, revealing that these three dimensions contribute to the shortening of the urban–rural wealth divide. “govmar” and “element” coefficients are both negative, but not significant. From this standpoint, only “nonstate,” “product,” and “agency” can close the urban–rural wealth divide. The development of the non-state economy helps to increase the industry allocation rate (Pu and Cheng, 2015). The increasing degree of product market development is conducive to solving the problem of residents’ demand, promoting consumption, and boosting the economy. The improvement of intermediary organizations and the legal environment, on the one hand, speed up information matching; on the other hand, the improvement of laws can help residents to produce, live, and protect their legal rights and interests.
From the results of the sub-dimensional regression of indirect effects, in addition to “element,” the four dimensions “govmar,” “nonstate,” “product,” and “agency” all pass the noteworthiness level test of at least 1%, showing that the business environment influences the lessening of the urban–rural wage hole. The spatial spillover value of the “govmar” on the urban–rural income gap is −0.006, indicating that every 1% increase in government-market relations will contribute to a 0.6% reduction in the urban–rural income gap in neighboring areas. The fewer government control rules, the greater will be the market activity, which is conducive to advancing the improvement of the private economy, and in this way, improving the level of financial advancement and rising earnings. The spatial spillover effect of the “nonstate” is −0.014, demonstrating that for each 1% expansion in the non-state economy in neighboring regions, the urban–rural income gap will be reduced by 1.4%. The faster the non-state economy develops, the more it is conducive to flexible employment, thus attracting the movement of people from the province or neighboring provinces, thus invigorating the economy and promoting development. The spatial spillover effect of the “product” is −0.026, indicating that every 1% increase in product market development will decrease the urban–rural wage crevice in neighboring regions by 2.6%; the spatial spillover effect of the “agency” is −0.007, indicating that every 1% optimization of intermediary organization development and legal environment will decrease the urban–rural pay hole in neighboring regions by 0.7%.
Based on the total effect by dimension regression results, “govmar,” “nonstate,” “product,” and “agency” are the same as the indirect corresponding results, and the regression coefficients are all essentially negative, demonstrating that the optimization of these four dimensions is not only conducive to lessening the region’s urban–rural wealth inequality but also contains a spatial spillover impact on the reduction of the urban–rural pay hole in neighboring regions. The regression coefficients of the “element” are still not significant; a possible reason is that there are still numerous issues within the advancement of the factor market in China. The lag of the factor market restricts the growth of farmers’ income (Xu, 2008), and an effective way to resolve the issue of increasing farmer salaries is to promote the overall development of the factor market (Yang, 2012). Based on the preceding examination, research hypothesis H2 of this study is proved.
5.3 Robustness tests
5.3.1 Changing dependent variables
In the preceding study, the dependent variables are selected to calculate the urban–rural income gap using the Theil index. This section uses the first method of calculating the wage hole between cities and rustic zones as the independent variable to make the final empirical results more convincing, and the SDM test outcomes are listed in column (1) of Table 8. It has been discovered that the business environment includes noteworthy spatial spillover repercussions on the urban–rural salary hole, which corresponds to the symbol of the business environment in Table 6, demonstrating that the previous article’s regression result is robust.
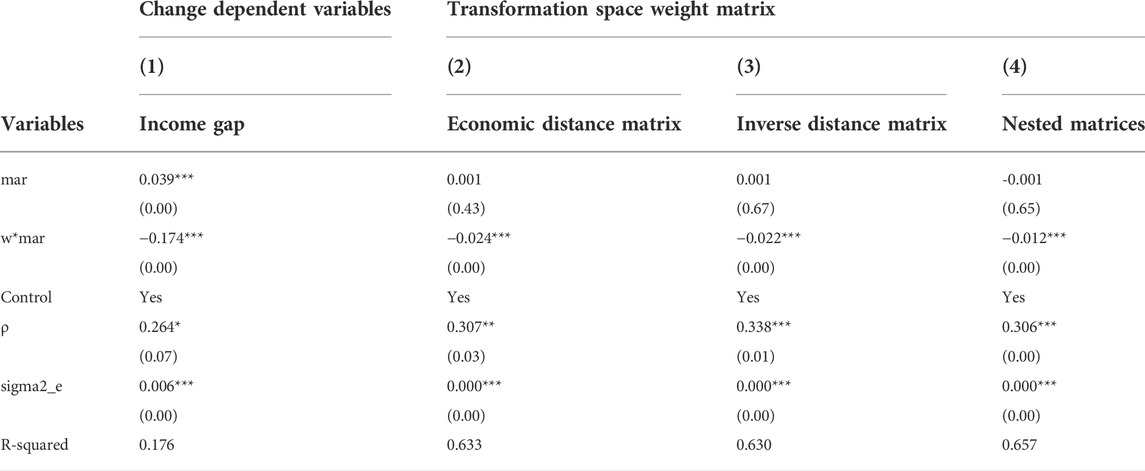
TABLE 8. Robustness tests.
5.3.2 Transformation space weight matrix
The aforementioned empirical findings are based on a geographic matrix based on neighborhood distances. To ensure the precision of the observational results, this study employs the economic distance matrix, the inverse separate matrix, and the nested matrix of economic-cum-geographic spatial separate s for robustness testing. The results of the SDM testing are shown in columns (2)–(4) in Table 8. It can be found that the total effect and indirect effect of the business environment’s total dimension are significant, and the symbols of the sub-dimension variables are uniform with the benchmark regression results as shown in Table 6, implying that the impact of the business environment on the urban–rural salary hole is robust.
5.3.3 Addition of control variables
Considering the relatively large differences in economic development around China’s provinces, some cities have a relatively high level of development, which can provide more employment opportunities and better income levels and even better infrastructure. By comparison, these regions have a better attraction, leading to more population inflows. Therefore, considering this reason, to mitigate the effect of population mobility on the accuracy of the outcome, this research incorporates the control variable of population mobility into the regression model for the robustness test. In this study, the population inflow rate is selected as the proxy variable of population flow, and the calculation formula is as follows: population influx rate = (population at the conclusion of the year—population at the conclusion of the past year—population at the conclusion of the past year * natural population growth rate)/population at the conclusion of the year.
The benchmark regression results after adding control variables are shown in Table 9. It is found that the regression results are comparable to Table 6. Even after controlling the important factor of population mobility, the spatial spillover effect of the digital economy on the business environment still exists, and the regression coefficient is 0.351, which is essentially consistent with the earlier findings, demonstrating the credibility of this study’s research conclusion.
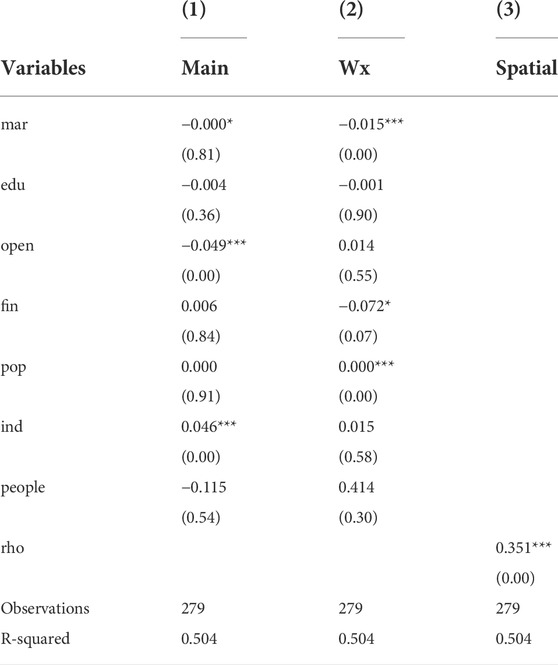
TABLE 9. Robustness tests.
5.4 Further to be discussed
The effect of the business environment on the urban–rural earning disparity has been studied and robustness tests have been conducted. The level of economic development, geographical location, and other factors lead to substantial disparities in the construction of such business environments across regions. Therefore, when analyzing whether there is a spatial spillover effect or the degree of the spillover effect in the business environment, it is necessary to investigate the magnitude of the impact of business environment optimization on the urban–rural wealth divide from the perspective of geographical area differences. This work is divided into three zones (excluding Hong Kong, Taiwan, and Macao) depending on the geographical location of each province in China: eastern, central, and western. Table 10 shows the provinces in each region.
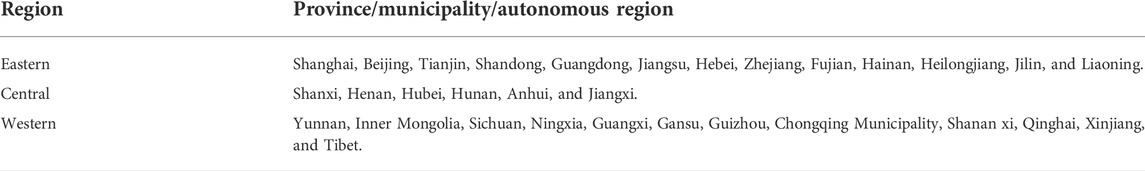
TABLE 10. Regional distribution in China.
Table 11 depicts the impact of the business environment in various regions on the urban–rural income hole. It has already been noticed that the spatial spillover effects of the business environment in column (1) the eastern region and column (2) the western region are not significant. The eastern part of China is a relatively developed region, and each zone will formulate its business environment policies that focus on its development level, which is far less affected by other provinces; most western provinces are located in remote parts of China, and province distribution is comparatively scattered, so a province is quite directly impacted by neighboring areas. Column (3) shows the spatial spillovers of the central region’s business environment on the urban–rural wealth inequality, which has passed the 1% significance level test. On the one hand, there are few central provinces and the distribution is relatively concentrated; on the other hand, because the central provinces are all located in the Central Plains, the geographical location is better, and the formulation of policies related to the business environment can be better applied and developed. Therefore, hypothesis H3 of this study has been verified.
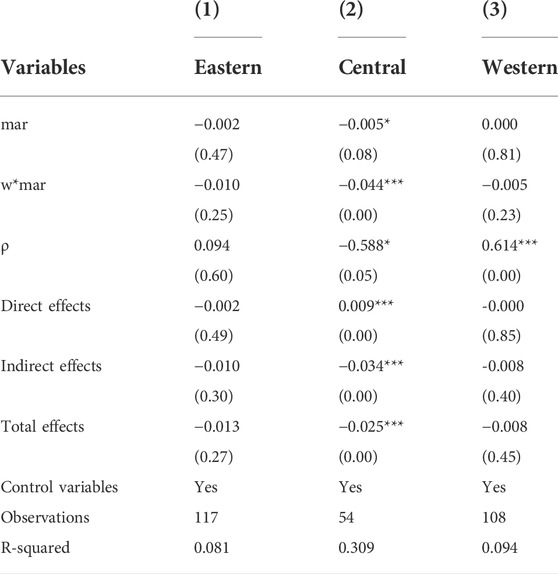
TABLE 11. Heterogeneity in the impact of the business environment on the urban–rural income gap.
6 Research conclusion and recommendations
6.1 Conclusion
This research explores the effect of business environment optimization on urban–rural wealth inequality. We begin by analyzing the previous research literature to formulate the hypothesis of this study: there is a negative relationship between optimization of the business environment and the income disparity between the city and the rural regions. To establish a connection between the business environment and the wealth disparity between urban and rural areas, this study investigates the impact of the business environment on the urban–rural wage hole by constructing a spatial Durbin model and employing a neighborhood spatial matrix depending on provincial-level panel data from 31 Chinese provinces from 2011–2019 and draws the following conclusions.
First, the spatial Durbin model demonstrates that optimizing the business environment not only reduces the urban–rural pay gap within the region but also decreases the urban–rural wealth gap in neighboring areas, showing that the spatial spillover effect of optimizing the business environment is apparent; second, by analyzing different dimensions of the business environment, the research revealed that in addition to the “govmar” and the “element,” there are three other dimensions: “nonstate,” “product,” and “agency” spatial spillover effects of the business environment on the urban-rural salary hole which are noteworthy. Third, the direct, indirect, and total effects of different dimensional indicators on the urban–rural income gap vary depending on the spatially lagged overall indicators of the business environment and its sub-dimensional indicators, but the majority of the dimensions have significant negative effects on the urban–rural salary disparity. Fourth, further research finds that the spatial spillover effect of business environment optimization on the urban–rural salary disparity is regionally heterogeneous, with business environment optimization in the central region helping to narrow the urban–rural salary disparity, while business environment optimization in the eastern and western regions does not affect the urban–rural salary disparity.
We can see from summarizing the research conclusions of this study that the research results are similar to those of Lai (2020) and Ncube et al. (2021), proving the reliability of previous studies once more. Furthermore, this study begins creatively from the standpoint of space, laying the groundwork for future research.
6.2 Policy or recommendations
Based on the aforementioned research findings, we offer some relevant policies or recommendations:
First, in the face of the huge challenge of widening urban–rural salary disparity, the Chinese government ought to formulate appropriate policies according to the income gap situation in different regions and play the role of primary distribution, secondary distribution, and third distribution. More tax incentives should be given to regions with large income disparities and low levels of economic development, and local business environment policies should be combined to increase the income of rural residents.
Second, the construction of an inclusive business environment should be promoted. The connotation of a business environment covers a wide range, including government, market, non-state-owned economy, products, factors, legal environment, and intermediary organizations. Because rural regions have even more small and medium enterprises, the Chinese government ought to strengthen the business environment needs for small and medium-sized market players, rather than focusing on serving large enterprises and large main markets, and promote the construction of the business environment and streamlining administration and delegation of powers, combining decentralization and service management and optimization.
Third, the coordinated economic development of the different regions should be strengthened. Although China’s economy has undergone earthquake changes compared to the time before reform and opening, there are still significant differences in the building projects of the business environment among regions. According to the findings of this research, the spatial spillovers of the business environment can result in the maximization of the business environment in more regions. Some policy guidelines have been introduced for inter-regional cooperation, such as cross-provincial support so that regions with good economic development can help regions with poorer economic development and achieve common development.
Finally, China has entered a critical period of building socialist modernization, and optimizing the business environment is also a major focus of China’s development. The dilemma of urban–rural income disparity has existed for some time in China, and narrowing the urban–rural wealth disparity whereas developing economic growth in the new phase has emerged as an essential concern for China. It has now become extremely crucial to deeply take cognizance of the business environment to develop a business environment index system appropriate for regional development depending on specific conditions.
6.3 Research limitations and prospects
Although the World Bank’s Doing Business rankings are highly professional and authoritative, there are limitations to the system. The research in this study selects macroscopic data as the research sample. In the future, for further detailed analysis, microscopic data can be selected for discussion. Even though this study concludes that business environment optimization can reduce the income disparity among urban and rural areas, there is also a spatial spillover effect of the business environment for economies at different levels of development that needs further study.
Data availability statement
The original contributions presented in the study are included in the article/Supplementary Material; further inquiries can be directed to the corresponding author.
Author contributions
TZ: Data curation, Investigation, Software, Visualization, Writing—original draft, Writing—review & editing, Formal analysis. FJ: Conceptualization, Funding acquisition, Supervision, Resources.
Funding
This study was funded by Heilongjiang University Graduate Innovation and scientific research project funding “Research on the path to achieve the goal of common prosperity in China under the background of digital economy” (No: YJSCX 2022-005HLJU).
Conflict of interest
The authors declare that the research was conducted in the absence of any commercial or financial relationships that could be construed as a potential conflict of interest.
Publisher’s note
All claims expressed in this article are solely those of the authors and do not necessarily represent those of their affiliated organizations, or those of the publisher, the editors, and the reviewers. Any product that may be evaluated in this article, or claim that may be made by its manufacturer, is not guaranteed or endorsed by the publisher.
References
Anselin, L., and Bera, A. K. (1998). Spatial dependence in linear regression models with an introduction to spatial econometrics [J]. Champaign: University of Illinois at Urbana-Champaign, Vol. 155, 237–290.
Antonelli, C., and Gehringer, A. (2017). Technological change, rent and income inequalities: A schumpeterian approach [J]. Technol. Forecast. Soc. Change 115, 85–98. doi:10.1016/j.techfore.2016.09.023
Brixiova, Z., and Egert, B. (2012). Business environment, start-ups, and productivity during transition [J]. Macroecon. Dyn. 16, 213–231. doi:10.1017/S1365100511000344
Chen, T., Wang, Y., and Zhao, X. (2020). Business environment, business confidence, and high-quality development of enterprises - empirical evidence from the 2018 China Enterprise General Survey (CEGS) [J]. Macro Qual. Res. 8 (02), 110–128. doi:10.13948/j.cnki.hgzlyj.2020.02.009
Cheng, M. W., and Zhang, J. P. (2019). Internet penetration and the urban-rural income gap: Theory and empirical evidence [J]. China Rural. Econ. 35 (02), 19–41.
Cui, X., Yao, Y., Bian, Y., and Cui, L. (2022). Can better business environments promote trade partners' economic growth? Appl. Econ. Lett. 29 (6), 540–544. doi:10.1080/13504851.2021.1875115
Deng, J. (2017). Government-led, population mobility and the urban-rural income gap [J]. China Popul. Resour. Environ. 27 (02), 143–150.
Deng, J. Q., and He, A. P. (2018). Government dominance, marketization and urban—rural income gap[J]. Agric. Technol. Econ. 37 (06), 44–56. doi:10.13246/j.cnki.jae.2018.06.004
Dong, Z. Q., Wei, X. H., and Tang, C. Q. (2012). Institutional soft environment and economic development: An empirical study of the business environment in 30 major cities [J]. Manag. World 28 (04), 9–20. doi:10.19744/j.cnki.11-1235/f.2012.04.002
Elhorst, J. P. (2014). Matlab software for spatial panels. Int. Regional Sci. Rev. 37 (3), 389–405. doi:10.1177/0160017612452429
Feng, T., and Zhang, M. S. (2020). Business environment, financial development and technology innovation of enterprises [J]. Sci. Technol. Prog. Countermeas. 37 (06), 147–153.
Gan, C. H., Yu, G. G., and Yu, D. F. (2011). An empirical study on the effects of industrial structure on economic growth and fluctuations in China [J]. Econ. Res. 46 (05), 4–16+31.
Gong, M. Y., Zhou, J. K., and Zhang, Z. (2019). Factor endowment, allocation structure and urban-rural income gap [J]. Agric. Technol. Econ. 38 (06), 57–69. doi:10.13246/j.cnki.jae.2019.06.004
Hu, A., and Zhou, S. (2022). China 2035: Towards common prosperity [J]. J. Beijing Univ. Technol. Soc. Sci. Ed. 22 (01), 1–22.
Kolko, J., Neumark, D., and Mejia, M. C. (2013). What do business climate indexes teach us about state policy and economic growth? [j]. J. Regional Sci. 53 (2), 220–255. doi:10.1111/j.1467-9787.2012.00782.x
Lai, X. J. (2020). Initiatives, effectiveness, and prospects for improving and optimizing the business environment: An analysis based on the World Bank's doing business 2020 report [J]. Macroecon. Manag. 36 (04), 20–26+30. doi:10.19709/j.cnki.11-3199/f.2020.04.004
Lai, X. J. (2021). Does the improvement of business environment widen the income gap? an empirical analysis based on multinational panel data [J]. Yunnan Univ. Finance Econ. 37 (01), 38–50. doi:10.16537/j.cnki.jynufe.000661
Lesage, J., and Pace, R. K. (2009). Introduction to spatial econometrics [M]. New York: Chapman and Hall/CRC.
Li, C., and Li, X. (2021). An empirical test of the impact of fiscal decentralization on the urban-rural income gap [J]. Statistics Decis. Mak. 37 (09), 160–163. doi:10.13546/j.cnki.tjyjc.2021.09.038
Li, S., and Shen, Y. Y. (2022). Inequality of Opportunity in Rural China: 2013–2018 [J]. Agric. Econ. Issues 42 (01), 4–14. doi:10.13246/j.cnki.iae.2022.01.008
Li, T., and Li, J. Y. (2022). Is farmland financial innovation narrowing the urban-rural income gap? A cross-regional study of China [J]. PloS One 17 (6), e0269503. doi:10.1371/journal.pone.0269503
Li, Z. (2021). Evaluation and comparative study on business environment of key city clusters in China [J]. J. Beijing Univ. Commer. Industry Soc. Sci. Ed. 36 (06), 17–28.
Li, Z. J., Zhang, S. G., Niu, Z. W., Yuan, W. R., and Liu, Q. Research group of “China urban business environment evaluation” (2021). Theoretical logic, comparative analysis, and suggestions for countermeasures in evaluating the business environment of Chinese cities [J]. Manag. World 37 (05), 98–112+8. doi:10.19744/j.cnki.11-1235/f.2021.0067
Lin, Y. F., Cai, F., and Li, Z. (1998). Analysis of regional disparities in China's economic transition [J]. Econ. Res. 44 (06), 5–12.
Liu, H. (2020). How does industrial intelligence affect rural-urban income disparity? an interpretation from the perspective of employment of migrant population[J]. China Rural. Econ. 36 (05), 55–75.
Lu, M., and Chen, Z. (2004). Urbanization, urban-biased economic policies and urban-rural inequality[J]. Econ. Res. 50 (06), 50–58.
Luo, C. P., Zhu, P. W., Zhang, C. C., and H, M. (2021). Internet, urbanization and the urban-rural income gap: Theoretical mechanism and empirical test [J]. West. Forum 31 (03), 28–43.
Malik, S. J. (2018). Ease of doing business and foreign direct investment: A review paper [J]. Pac. Bus. Rev. Int. 10 (12), 76–84. NAUG.
Nam, V. H., and Bao Tram, H. (2021). Business environment and innovation persistence: The case of small-and medium-sized enterprises in Vietnam. Econ. Innovation New Technol. 30 (3), 239–261. doi:10.1080/10438599.2019.1689597
Ncube, M., Soonawalla, K., and Hausken, K. (2021). The links between business environment, economic growth and social equity: A study of african countries. J. Afr. Bus. 22 (1), 61–84. doi:10.1080/15228916.2019.1695184
Nguyen, T. T. N., and Wong, W. K. (2021). Do state ownership and business environment explain corporate cash holdings? Empirical evidence from an emerging country [J]. Asian Acad. Manag. J. Account. Finance 17 (1), 1–33. doi:10.21315/aamjaf2021.17.1.1
Pu, Y. P., and Cheng, X. (2015). Development of non-state economy and capital allocation efficiency[J]. Shanghai Econ. Res. 34 (11), 28–36.
Research Group of the General Agricultural Survey Team of the National Bureau of Statistics (1994). Study on the income gap between urban and rural residents [J]. Econ. Res. 40 (12), 34–45.
Rogerson, C. M., and Rogerson, J. M. (2010). Improving the local business environment of Johannesburg. Dev. South. Afr. 27 (4), 577–593. doi:10.1080/0376835X.2010.508591
Song, L. L., and He, C. (2018). The logic and path of China’s administrative reform from the perspective of optimizing business environment: based on the analysis of the world bank business environment indicator system [J]. China Adm. 34 (04), 67–72.
Sun, Y., and Zhao, Q. (2019). Can technological progress suppress the urban-rural income gap:A test based on the perspective of spatial spillover effects [J]. Shenzhen Univ. Humanit. Soc. Sci. Ed. 36 (02), 65–73.
Tu, Z. G., Cheng, L., and Zhang, M. (2022). Study on the regional difference and characteristic of temporal-spatial evolution of Chinese business environment [J]. Res. Quant. Econ. Technol. Econ. 39 (07), 3–25. doi:10.13653/j.cnki.jqte.2022.07.003
UNDP (2005). China Human Development Report 2005 [M]. Beijing, China: China foreign translation Press.
UNDP (2016). Human Development Report. Human development for everyone. Stockholm, Sweden: United Nations development Programme.
Vu, N. H., Bui, T. A., Nguyen, N. M., and Luu, N. H. (2021). Local business environment, managerial expertise and tax corruption of small- and medium-sized enterprises [J]. Baltic J. Econ. 21 (2), 134–157. doi:10.1080/1406099X.2021.1990473
Wan, H., and Li, S. (2013). The impact of household registration discrimination on the urban-rural income gap [J]. Econ. Res. 48 (09), 43–55.
Wang, S. P., and Ouyang, Z. G. (2020). The rural-urban income disparity and its effects to economic growth in the case of China [J]. Econ. Res. 42 (10), 44–55.
Wang, X. L., Fan, G., and Hu, L. P. (2018). China marketization index report by Province [M]. Beijing, China: Social Science Literature Press.
World Bank (2020). Doing business 2020: Comparing business regulation in 190 economies. Washington: World Bank.
Xiao, D., Yang, Y. J., and Gu, J. J. (2020). Can rural inclusive finance narrow the urban-rural income gap in counties [J]. Macroecon. Res. 42 (01), 20–33. doi:10.16304/j.cnki.11-3952/f.2020.01.004
Xu, J. Y. (2008). A research on the problems of farmers’ slow income increase and sluggish development of essential factor market[J]. Econ. Econ. 25 (01), 105–108. doi:10.15931/j.cnki.1006-1096.2008.01.041
Yang, L. (2012). A study on elementary markets and farmers' income [J]. J. Shanxi Univ. Finance Econ. 34 (3), 4–5. doi:10.13781/j.cnki.1007-9556.2012.s3.159
Yang, Z. H., Liu, Z. L., and Li, F. (2020). Building a business environment evaluation system with Chinese characteristics [J]. Int. Econ. Coop. 36 (05), 96–107.
Yu, N., and Wang, Y. (2021). Can digital inclusive finance narrow the Chinese urban-rural income gap? The perspective of the regional urban-rural income structure [J]. Sustainability 13 (11), 6427. doi:10.3390/su13116427
Zhang, S., Kang, B., and Zhang, Z. (2020). Evaluation of business environment in Chinese provinces: Indicator system and quantitative analysis [J]. Econ. Manag. 42 (04), 5–19. doi:10.19616/j.cnki.bmj.2020.04.001
Zhao, D. S., Dou, Y., and Zhang, J. M. (2021). Business environment and green economic growth—based on the mediating effect and suppressing effect of entrepreneurship [J]. Explor. Econ. Issues 42 (02), 66–77.
Zhao, S., Zhang, D., and Si, C. (2018). Urbanization level, total factor productivity, and urban-rural income gap: An empirical analysis based on regional heterogeneity and interaction effects [J]. Mod. Econ. Inq. (11), 93–100. doi:10.13891/j.cnki.mer.2018.11.015
Zhou, L., Feng, D. W., and Yi, X. J. (2020). Digital inclusive finance and the urban-rural income gap: "digital dividend" or "digital divide. Econ. 32 (05), 99–108. doi:10.16158/j.cnki.51-1312/f.2020.05.011
Keywords: business environment, spatial Durbin model, regional heterogeneity, spatial spillover effects, urban–rural income gap
Citation: Zhao T and Jiao F (2022) Business environment, spatial spillover, and urban–rural income gap——an empirical test based on provincial panel data in China. Front. Environ. Sci. 10:933609. doi: 10.3389/fenvs.2022.933609
Received: 01 May 2022; Accepted: 08 August 2022;
Published: 06 September 2022.
Edited by:
Faik Bilgili, Erciyes University, TurkeyReviewed by:
Seyi Saint Akadiri, Central Bank of Nigeria, NigeriaYacouba Kassouri, Leipzig University, Germany
Elchin Suleymanov, Baku Enginering University, Azerbaijan
Copyright © 2022 Zhao and Jiao. This is an open-access article distributed under the terms of the Creative Commons Attribution License (CC BY). The use, distribution or reproduction in other forums is permitted, provided the original author(s) and the copyright owner(s) are credited and that the original publication in this journal is cited, in accordance with accepted academic practice. No use, distribution or reproduction is permitted which does not comply with these terms.
*Correspondence: Tongtong Zhao, emhhb3Rvbmd0b25nMDIxOUBnbWFpbC5jb20=