 Tzu-Yi Yang1
 Ssu-Han Chen
- 1Department of Foreign Languages and Literature, National Ilan University, Yilan, Taiwan
- 2Department of Industrial Engineering and Management, Ming Chi University of Technology, Taipei, Taishan, Taiwan
- 3Department of Aeronautical and Opto-Mechatronic Engineering, Vanung University, Taoyuan, Taiwan
- 4Formosa Plastic Group, Kaohsiung, Taiwan
This work explores the relationship between the price of crude oil and its production through an empirical study on the regions of the Organization of the Petroleum Exporting Countries (OPEC) and non-Organization of the Petroleum Exporting Countries (non-OPEC). The crude oil price has recently been fluctuating greatly that it cannot be predicted; this fluctuation causes changes in the prices of raw materials for everyday life, thus affecting the economy worldwide. To better understand the factors that affect the crude oil price, this study gathered monthly oil production by OPEC and non-OPEC members, which are divided into the regions of Europe, America, and Asia according to the U.S. Energy Information Administration (2015). Data on the West Texas Intermediate (WTI), Brent, and Dubai oil prices in the period from January 1995 to November 2015 were also gathered and subjected to unbalanced panel random effect regression to investigate the relationship between crude oil price and oil production and to determine whether the oil production by these countries have a significant effect on the fluctuation of crude oil price. This study explored the relationship between production and price, specifically that of crude oil. Hence, it investigated whether and how the changes in monthly crude oil production by OPEC and non-OPEC members in Europe, America, and Asia have affected the changes in three major crude oil prices, namely, WTI, Brent, and Dubai, in the following terms.
1 Introduction
Eva (2007) mentioned that crude oil is closely associated with everyday life, where crude oil price changes affect the economy, stock price, and development worldwide. In the first half of 2008, when crude oil prices continued rocketing to US $147 per barrel, the prices of household staples rose with it, which indirectly demonstrated that crude oil is one of the raw materials that is indispensable to life. However, fluctuating crude oil price is considered by many analysts as the most difficult-to-predict future. There are no limits to the increase or decrease in oil price as illustrated by its plunge from US $147 per barrel to US $39 per barrel at the end of 2008. Because oil price fluctuates in a range much larger than other raw materials and futures, more care and caution should be taken in dealing with the crude oil price issue. Similar to items that are staples to life, the price of crude oil changes in such a way as to affect the total economy of a nation, particularly a developing industrial one, because any such nation has a huge demand for crude oil. Oil is referred to as the blood of industries and is viewed as the power for the economy and living. That statement delineates the importance of oil to society. With such significance being a staple, the oil price is particularly important.
A review of history can easily reveal various oil crises. Fabian (2010) mentioned the first oil crisis, which happened on 17 October 1973. It was a battle referred to as the “Yom Kippur War” in which the then OPEC members announced that they would decrease monthly oil production by 5% to set back Israel and the nations that supported it. The oil embargo and production cut affected the United States, Japan, and many European countries. The embargo lasted five months, and due to a production cut, the oil price increased from US $2.59 per barrel in September 1973 to US $13.43 in January 1974, representing a 418.533% increase. James (2011) reported the first crude oil price effect that occurred in 1862–1864, during the American Civil War, which disrupted the supply of crude oil from South America to the oil market in the United States, causing crude oil prices to rise. Later in 1890, crude oil production reported in Pennsylvania and New York was five times as much as that in 1870, and as such, the crude oil price dropped to US $0.56 per barrel in 1892. The author also mentioned the war that Syria and Egypt raised against Israel in 1973 resulted in the Arabic members of OPEC deciding on an oil embargo policy to impede Israel and its supporters by reducing crude oil production by about 4.4 million barrels daily. These events demonstrate how important production is to price and the relationship between the two.
Horn (2004) reported that from January 199 to January 2000, when OPEC members decreased crude oil production, the increase of the same by non-OPEC nations was still not enough to satisfy the demand for world consumption, and as a result, oil price went up from US $10 to US $30 per barrel. Their high status in the market for crude oil and production accounting for 28% of the world’s production, the OPEC is powerful enough to monopolize the market and control the oil price within a predefined range. OPEC decided at the Vienna meeting on 27 November 2014 not to cut back production but to maintain the limit to daily production at 30 million barrels. That decision triggered an oil price collapse in the crude oil market in favor of buyers. Brent, for example, plunged by 6% to a record low over the last four years. These events revealed a close relation between crude oil production and its price.
According to Energy Information Administration (2016), OPEC believed that crude oil production was an important factor affecting oil prices, and thus it controlled its member states’ production under a predefined production target. In fact, in the historic view, oil prices increased when oil-exporting countries had a lower oil production goal, which implies an interaction between crude oil production and oil price. Furthermore, Gui-Feng (2016) stated that oil price is particularly important to Taiwan, an exporter of petrochemical industries. If the oil price drops by US $1 during the transportation of crude oil, it means a US $1 loss to Taiwan. As such, the issue and information on oil price are crucial to Taiwan. Therefore, this study explores the relationship between crude oil production and the major crude oil prices, specifically in three directions for research as follows:
1. To explore the relationship between crude oil production by OPEC and non-OPEC nations and the major crude oil prices and determine from the empirical results whether OPEC or non-OPEC that affected the major crude oil prices, namely, WTI, Dubai, and Brent.
2. To further probe the empirical results of objective 1 and determine how the crude oil production by European, American, and Asian countries who are either OPEC or non-OPEC members affected the major crude oil prices.
3. Following the empirical results of objective 2, to further investigate how the crude oil production by each OPEC or non-OPEC member in Europe, America, and Asia affected the major crude oil prices.
If the investigation of the effect of OPEC or non-OPEC oil production on WTI, Brent, and Dubai oil prices, and the further analysis of whether the crude oil production by each organization in each continent had a significant effect on the major crude oil prices and that by each organization member in each continent on the major crude oil prices, are successful, the empirical results can serve as an important reference information in the future trends and changes of the major crude oil prices for relevant parties.
2 Relationship between production and oil price
Ronald and Joaquin (2015) explored the effect of crude oil production by OPEC and non-OPEC countries on global oil prices and economies by employing the SVAR model and gathering data on the crude oil production by OPEC and non-OPEC countries from 1974 Q1 to 2012 Q4 and the corresponding oil prices from 1974 Q1 to 2014 Q4 to investigate whether OPEC countries’ crude oil production had a material effect on crude oil price. They also investigated whether the oil production of non-OPEC countries would have changed the OPEC’s oil production and in turn affected crude oil price. The results of their study showed that from 1974 Q1 to 1996 Q4, the growth of OPEC production of crude oil was proportional to the behavior of crude oil price. Therefore, they reasoned that crude oil prices rose from US $14 in 1978 to US $35 in 1981 as Iran, an OPEC member, decreased oil production each day by 2–2.5 million barrels because of a coup d’état from 1978 to 1979 and the war erupted between Iran and Iraq in 1980 which cut back production and export of crude oil.
Then, in March 2000, OPEC decided to increase crude oil production to keep oil prices steady between US $22–28 per barrel. As to the details of the increase in production, Ronald and Joaquin (2015) mentioned that OPEC would increase the production of crude oil to double the amount of demand and that with massive resources of crude oil, OPEC might agree for its member nations to double their production, effective until 2020. According to the Energy Information Administration (EIA), from 2000 to 2020, OPEC oil production increased from 31 million barrels to 59 million barrels daily.
Jochen (2014) stated that in 2011, OPEC held 81.0% of the proven oil reserves and 42.8% of the world’s oil reserves. Hence, it was likely that OPEC adopted different policies in response to the increase in oil demand to maintain crude oil prices. Given that floating oil supply and floating oil demand may have different effects on the crude oil market, Gunter used the VAR model to explore how the floating supply and demand for crude oil affected the market in the short term. The empirical results suggested that floating demands could be caused by opportunistic needs, while opportunistic needs and crude oil reserves could change the global market for crude oil. If there were excessive opportunistic needs or reserves, the oil-producing countries would reduce oil production to avoid overproduction, compromising the stability of crude oil prices in the short term.
Production surplus also affects oil price. Michael et al. (2006) studied the short-term relationship between crude oil price and production surplus using a relative stock model. They used data from IEA for a period from 1988 to 2006. With the relative stock model, they incorporated the variable of crude oil production surplus in the existing model of monthly oil price. In addition, they strengthened the credibility and accuracy of the short-term oil price model by using OPEC’s production surplus. The results showed that the variable of production surplus had significant and negative effects on WTI price and that the effects of the variable of production were significant to the crude oil price. Furthermore, they believed that if future production could be predicted, it could affect the current oil price.
Michael et al. (2009) used 3D images to investigate the effects of OPEC overproduction and its oil reserves on the market for crude oil and oil prices. They used short-term models to predict crude oil prices and increase the monthly average oil price accuracy. According to the literature, OPEC’s behavior and decisions have profoundly affected how the entire crude oil market changed and its price for the past three decades. For example, when OPEC changed crude oil prices, it had a severe effect on the global market for crude oil. Ye et al. used three research variables, namely, stock, production surplus, and accumulated overproduction and explored the relationship between crude oil in stock and short-term oil prices because crude oil stock amount could strike a balance between supply and demand, stabilizing oil prices. They also investigated the effect of oil production surplus on the oil market. Many economic studies consider overproduction as having a certain effect on the commodity market, whereby overproduction makes it possible to reallocate crude oil production in the short term. As such, both theories and empirical research demonstrated that overproduction is among the important factors in analyzing or exploring the oil industry. Empirical results also showed that stock amount had a significant negative effect on crude oil prices, and that when the idle stock was lower, the oil price was higher.
Jan (2007) showed that in the relationship between oil price and oil-producing countries, the main oil-producing regions were commonly defined as main markets for crude oil, such as Middle East, South China Sea, and South America, because these areas of production would generally be an important basis for the current crude oil prices in the neighboring countries. Therefore, Bentzen also analyzed OPEC’s oil price, WTI prices and Brent prices using cointegration and the vector error correction model (VECM) to investigate whether OPEC strategies, including crude oil production and oil price, affect the spot price of the other major crude oil prices. The results demonstrated that OPEC’s influence on the world’s spot oil price was beginning to become stronger, so that its spot price would affect the other two major crude oil prices in a way that the standards set by Brent and WTI became lower.
Most prior studies have focused on OPEC’s contribution and influence on the global market for crude oil; nevertheless, non-OPEC members have begun to gain more share in the oil market and have a more significant influence. Harri (2002) alluded that the market share of non-OPEC production of crude oil and OPEC’s influence was significant, showing from data analysis that OPEC has had a 55% share of the overall world’s oil market since 1973. However, its share dropped to 42.7% in 1997, with crude oil export seriously impinging revenue. Harri (2002) mentioned that the amount of crude oil produced was reflected in oil prices. Thus, the economic condition of oil-producing countries significantly affected crude oil prices. Regarding the future market shares of OPEC and non-OPEC members, both consisted of many oil-producing countries for crude oil that played a role in its price stability. The signs could be found from the previously stated significant influences.
The aforementioned literature reveals the importance and influence of crude oil production on oil price. However, the documents were records of research by individuals or cases, lacking holistic and systematic discussions. In contrast, this study will analyze the relationship between all the world’s crude oil production and prices in three strata. We will begin by investigating whether OPEC and non-OPEC members influence Dubai, Brent, and WTI prices. We will then explore the relationship between OPEC and non-OPEC members individually, in Europe, America, and Asia, which have the three major oil prices. Finally, we will probe whether OPEC or non-OPEC members in Europe, America, and Asia influence the major oil prices.
3 Research method
This study has an object of exploration, which is the relationship between OPEC and non-OPEC members’ oil production and the major crude oil prices. First, the empirical results show whether OPEC or non-OPEC members influence the WTI, Brent, and Dubai prices. Then, following the empirical results of the preceding objective, we further explore how OPEC or non-OPEC members in Europe, America, and Asia affect the major oil prices. Finally, following the empirical results of the second objective, we investigate the oil production by individual members of OPEC or non-OPEC members in individual continents (America, Europe, and Asia) on the major oil prices.
Data gathering and sorting are challenging, and identifying the appropriate models for supporting the research objectives in the model design is important. This section first explains the objects and period of research and then delineates the characteristics of the variables and the empirical model by which the investigation is conducted.
3.1 Subjects and period of research
This study explores the relationship between the price of crude oil and its production by conducting an empirical analysis of OPEC and non-OPEC data because groups of crude oil production are presently divided into OPEC and non-OPEC. The objects of this study are 108 crude oil-producing nations that are either OPEC or non-OPEC members, which, with reference made to EIA-published regions (2016) (International Energy Statistics, 2016), are divided into Asia, Europe, and America. In Asia, the six OPEC members are Iran, Iraq, Kuwait, Qatar, Saudi Arabia, and the United Arab Emirates and 25 non-OPEC members are China, Oman, Yemen, Bangladesh, Brunei, Myanmar, Cambodia, Hong Kong, India, Japan, South Korea, Mongolia, New Zealand, Pakistan, Papua New Guinea, the Philippines, Singapore, Taiwan, Thailand, East Timor, Indonesia, Vietnam, Bahrain, Israel, and Syria. In Europe, the four OPEC members are Algeria, Angola, Libya, and Nigeria and 52 non-OPEC members are Egypt, Norway, Russia, the United Kingdom, Australia, Malaysia, Gabon, Albania, Austria, Bulgaria, Croatia, Cyprus, Czech Republic, Denmark, Finland, France, Germany, offshore Germany, Greece, Hungary, Italy, the Netherlands, the Netherlands offshore, Poland, Portugal, Romania, Spain, Turkey, Cameroon, Chad, Congo (Brazzaville), Congo (Kinshasa), Ivory Coast, Guinea, Ghana, Malawi, Morocco, South Africa, Sudan and South Sudan, Tunisia, Zimbabwe, Ukraine, Belarus, Estonia, Georgia, Lithuania, Azerbaijan, Kazakhstan, Tajikistan, Turkmenistan, and Uzbekistan. In the Americas, the two OPEC members are Ecuador and Venezuela, and the 20 non-OPEC members are Canada, Mexico, the United States, Chile, Brazil, Argentina, Colombia, Barbados, Belize, Bolivia, Costa Rica, Cuba, El Salvador, Guatemala, Jamaica, Nicaragua, Paraguay, Peru, Suriname, and Trinidad and Tobago. In addition to the above 108 members, there are also 13 OPEC members in Europe: Ireland, Slovenia, Belgium, Ethiopia, Switzerland, Latvia, Serbia, Former Serbia, Kyrgyzstan, Benin, Sweden, Slovakia, and Mauritania and a non-OPEC member in the Americas, Uruguay. These 13 members are excluded from our empirical analysis because of scarce oil production and collinearity with other members.
Among the total oil production by the previously listed countries, OPEC members account for 41% and the non-OPEC members account for 59%, as shown in Figure 1.
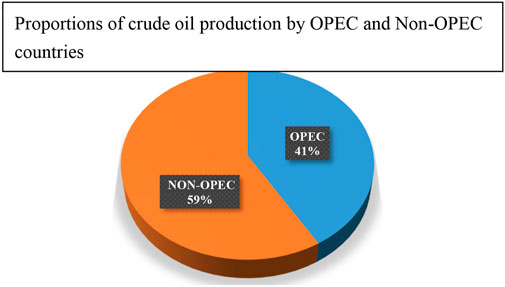
FIGURE 1. 1995–2015 proportions of crude oil production by OPEC and non-OPEC.
Regarding the proportions of OPEC oil production by the continent, Figure 2 shows that OPEC members in Asia produce the most crude oil, accounting for 69% of the organization’s total production, followed by Europe, accounting for 21%, and the Americas, accounting for the remaining 10%. In the comparison in Figure 1, OPEC members in Asia have a proportion of production larger than the other two continents, probably because Asian members are the majority. From an overall perspective, 12 OPEC members account for 41% of the world’s oil production, which might support why most researchers and documents explored OPEC’s influence on world oil prices. Likewise, to systematically understand the distribution of non-OPEC total production, we divide its members into three continents. As shown in Figure 2, Asia accounts for 17% of the total crude oil production, America accounts for 39%, and Europe accounts for 44%. Among non-OPEC members, those in Europe outnumber those in Asia and America, which may be one of the factors contributing to Europe accounting for the greatest portion of crude oil production by non-OPEC.
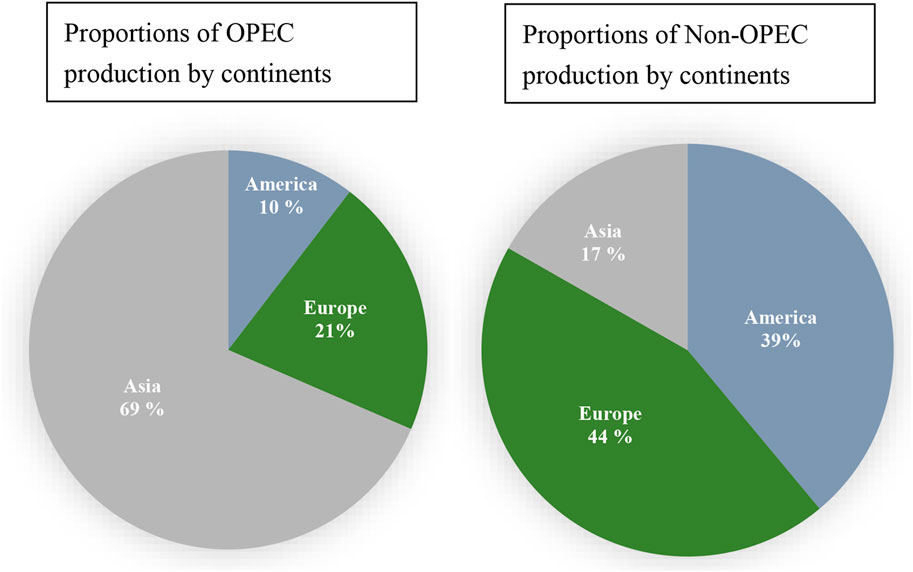
FIGURE 2. 1995–2015 proportions of crude oil production by continents in OPEC and non-OPEC.
This study considers three major crude oil prices, namely, Brent, WTI, and Dubai oil prices, representing Europe, America, and Asia, respectively, and the regions purposely divided. Hence, the findings of this study on the production and price of crude oil are adequately represented in illustrating the relationship between the oil production by OPEC or non-OPEC members in different continents and the major crude oil prices in a holistic and systematic analysis. The research period is from 1994 to 2015, but with the panel data empirical analysis fed with varied data, this study looks at a period from 1995 to 2015, which is 21 years, and every year is a complete year. The period is sufficiently long to observe the relationship between production and the price of crude oil.
3.2 Variables
This research collected the monthly crude oil production data of 108 members of OPEC and non-OPEC crude oil-producing countries from EIA and the monthly crude oil prices of West Texas, Dubai, and Brent crude oil from AREMOS. The research period is from January 1995 to November 2015.
3.2.1 Dependent variables
Dependent variables used were WTI, Brent, and Dubai prices. The variation of these prices by one term is used as expressed in Eq. (3.1).
Eq. 3.1 represents the variation of the major oil prices, where
3.2.2 Independent variables
Independent variables include oil production by the 108 OPEC and non-OPEC members who are crude oil producers in Europe, America, and Asia. They are also in the form of production variation as expressed in Eqs 3.2–3.5.
Eq. 3.2 represents the variation in oil production by OPEC members in Europe, America, and Asia, where
Eq. 3.3 represents the variation in oil production by non-OPEC members in Europe, America, and Asia, where
Eq. 3.4 represents the variation in oil production by OPEC members in Europe, America, and Asia, where
Eq. 3.5 represents the variation in oil production by non-OPEC members in Europe, America, and Asia, where
3.3 Empirical model
Regarding crude oil price, Kaddour (2000) used panel data of ordinary least squares regression (OLS) to investigate OECD states, including Latin America, Central Europe, Eastern Europe, Africa, Middle East, and Asia and the world’s reliance on NGL crude oil production for their demands for oil. In the relationship between crude oil production and price, the current oil production does not necessarily instantly affect the same period’s oil price. To embody how oil production affects oil price more accurately, this study uses the variations of oil production of current periods corresponding to oil price variations of the periods that immediately follow to indicate the relationship between oil production and oil price. We follow the past research trend and employ Eq. 3.6 to explore the relationship between the variations in OPEC and non-OPEC oil production and the following period in major crude oil prices. Our empirical findings indicate how OPEC or non-OPEC affects the WTI, Brent, and Dubai prices. Following the empirical results with Eq. 3.6, we design Eqs 3.7, 3.8 specifically for the significance of the influence of the variation in the oil production by OPEC or non-OPEC members in different continents on the variations in major oil prices of the following period. With the results achieved with empirical Eqs 3.7, 3.8, we further explore how the variation in oil production by the member nations in different continents affects the variation in major oil prices of the following period and thus design Eqs 3.9, 3.10. In this study, the variations in WTI, Brent, and Dubai prices in the following period are used as dependent variables, and the variation in OPEC and non-OPEC countries total oil production and the variation in oil production by OPEC and non-OPEC members in different continents as independent variables.
Model (3.6) shows whether OPEC or non-OPEC has a significant influence on the variation in major oil prices of the following period, where
With the results of empirical model Eq. 3.6 in place, if the variation in OPEC oil production has a significant influence on the variation in major oil prices of the following period,Eq. 3.7 will be used to investigate how the variations in oil production by OPEC members in Europe, America, and Asia affect the variation in major oil prices of the following period. In the model,
Following the results of empirical model Eq. 3.6, if the variation in non-OPEC oil production has a significant influence on the variation in major oil prices of the following period, we will use Eq. 3.8 to investigate how the variation in oil production by non-OPEC countries in Europe, America, and Asia affects the variation in major oil prices of the following period. In the model,
Following the results of empirical model Eq. 3.7, if the variation in oil production by OPEC in Europe, America, and Asia has a significant influence on the variation in major oil prices of the following period, we use Eq. 3.9 to investigate how the variation in oil production by member states in each continent affects the variation in major oil prices of the following period. In the model,
Following the results of empirical model Eq. 3.8, if the variation in oil production by non-OPEC members in Europe, America, or Asia has a significant influence on the variation in major oil prices of the following period, then we apply Eq. 3.10 to investigate how the variation in oil production by the member states in each continent affects the variation in major oil prices of the following period. In the model,
4 Empirical analysis
The research period is from January 1995 to November 2015, which spans 21 years, long enough to observe the relationship between crude oil price and oil production. Subjects of the research include multiple OPEC members, six in Asia, four in Europe, and two in America, and many non-OPEC members, 23 in Asia, 53 in Europe, and 20 in America. The data are of a certain scale longitudinally and otherwise. They are put to stepwise regression on Stata11 as follows: 1) test with Eq. 3.6 as to assess which of OPEC and non-OPEC had variations in oil production that affected the WTI, Brent, and Dubai prices of the following period significantly; 2) based on the empirical result of (1), investigate, with Eqs 3.7, 3.8, if the variation in oil production by OPEC or non-OPEC members in America, Europe, or Asia had a significant effect on the WTI, Brent, and Dubai prices of the following period; 3) based on the empirical result of (2), further investigate with Eqs. 3.9, 3.10, whether any members of OPEC or non-OPEC in any continent had a significant influence on the variation in the WTI, Brent, and Dubai prices of the following period.
4.1 Collinearity of data
This section addresses the issue of collinearity of data. According to Donald and Pamela (2003), the critical value for collinearity of independent variables is 0.8. Rajdeep et al. (2004) believed that the maximum value for collinearity is 0.95. In this study, a more rigorous standard, 0.8, is used to determine the collinearity of independent variables.
In this study, collinearity was measured using Stata11 on the independent variables of the overall data, which were the variations in oil production by OPEC and non-OPEC members in Europe, America, and Asia. The results of the measurement show that the issue of collinearity between the independent variables of the OPEC and non-OPEC in different continents (Europe, America, or Asia) does not exist because the collinearity was found to be 0.0749 at its maximum, which was less than the standard of 0.8; hence, there was no issue of collinearity between independent variables as shown in Table 1. Furthermore, in exploring whether there was any collinearity between independent variables of OPEC and non-OPEC members in different continents, we conducted a collinearity test on all 108 member states. The test results indicated that none exceeded the 108 independent variables; therefore, collinearity did not exist between oil productions by the members.
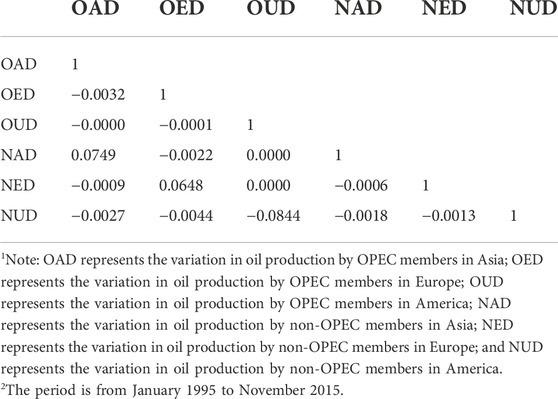
TABLE 1. Collinearity of data.
4.2 Empirical results
One of the objectives of this study is to explore the relationship between the variations in oil production by OPEC and non-OPEC countries and the variations in major oil prices of the following period. Suppose the empirical results demonstrated that OPEC or non-OPEC affected the variations in WTI, Brent, or Dubai prices of the following period, in that case, this study will further investigate how OPEC or non-OPEC members in Europe, America, or Asia significantly affected the variations in major oil prices of the following period. Suppose that the results revealed any significant influence of OPEC or non-OPEC members in Asia, Europe, or America on the variations in WTI, Brent, and Dubai prices, in that case, this study will substitute the members in the empirical test into stepwise regression, which were 12 OPEC members, four in Europe, two in America, and six in Asia, and 96 non-OPEC members, 53 in Europe, 20 in America, and 23 in Asia. The objective is to observe what members significantly influenced the variation of any of the WTI, Brent, and Dubai prices of the following period.
In this study, Stata11 was used to test all the data, including the variation in OPEC and non-OPEC oil production corresponding to the variation in WTI, Brent, and Dubai prices of the following period, which equals P, to determine a fixed effect or a random effect to be adopted. The results showed that P for the variation in WTI price of the following period was 0.9557, that for variation in Brent price was 0.9878, and that for variation in Dubai price was 0.9882. Since none of those Ps was obvious, we turn to random effect by empirical rules to test the objectives of this study.
4.2.1 Objective 1
For objective (1), empirical model Eq. 3.6 was used to investigate how the variation in OPEC or non-OPEC oil production affected the major oil prices of the following period. The empirical result is shown in Table 2. The table reveals that OPEC affected more significantly the variation in Dubai price in the following period. Meanwhile, neither the variation in OPEC oil production nor that in non-OPEC had a significant effect on the variation in WTI or Brent prices of the following period.
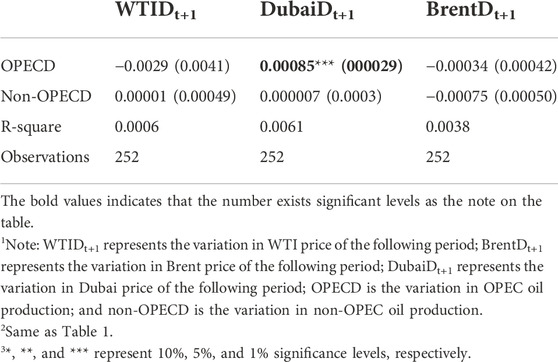
TABLE 2. Relationship between OPEC and non-OPEC countries and variations in major oil prices of the following period.
Figure 1 shows that the OPEC oil production from Asia is larger than non-OPEC oil production from Asia, and thus, it has a more significant influence on Dubai price, a reference standard for the crude oil price in Asia. Moreover, OPEC has positive and significant influence on the variation in Dubai price of the following period, that is, when OPEC oil production varies in an increasing trend, the Dubai price of the following period also increases.
4.2.2 Objective 2
For objective (2), the empirical models Eqs 3.7, 3.8 were used to investigate how the variations in OPEC and non-OPEC oil production from Europe, America, and Asia affected the variations in WTI, Brent, and Dubai prices of the following period. Table 3 shows that the variation in OPEC oil production in America affects WTI price in the following period, as well as the variation in OPEC oil production in Asia and the variation in Dubai price in the following period. The variation in non-OPEC oil production in Europe affects the variation in Brent price of the following period.
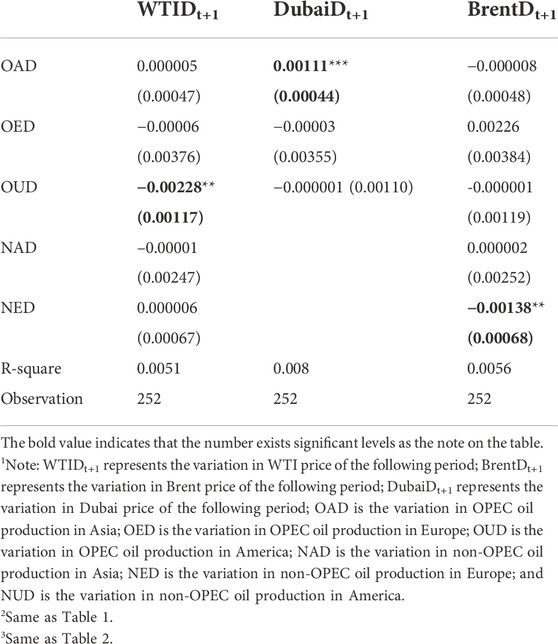
TABLE 3. Relationship between the variations in OPEC and non-OPEC oil productions in different continents and the variations in major oil prices of the following period.
The empirical result in Table 3 reveals that the variation in OPEC oil production in America OPEC has a negative and significant influence on the variation in WTI price of the following period, indicating that the variation in crude oil production affects that oil price lagged by one period, that is, when crude oil production changes upward, the oil price of the immediately following period decreases.
The Dubai price is a reference indicator of Asian oil prices. On the part of Asia, the oil production by OPEC members in Asia from 1995 to 2015 had a far greater share than that by non-OPEC members, as shown in Figure 2. As such, the empirical result showed that the variation in oil production by OPEC from Asia had a significant influence on Dubai price of the following period. The variation in oil production by Asian OPEC members has a positive and significant effect on Dubai price of the following period, which means when the oil production by OPEC from Asia increases, the changes in Dubai price in the following period is also greater.
The variation in oil production by non-OPEC members in Europe had a negative and significant effect on the Brent price of the following period, which was another empirical result indicating the influence of variation in oil production on that in the oil price of the following period. The findings mean that when the variation in oil production by non-OPEC states in Europe increases, the variation in Brent price for a following period decreases. Figure 2 shows that on average, from 1995 to 2015, non-OPEC production contributed more than OPEC to European crude oil production. Brent price is also a trade index in the European crude oil market and is traded in the London International Financial Futures and Options Exchange. Empirically, the variation in crude oil production by non-OPEC in Europe has significance on variation in Brent price of the following period.
4.2.3 Objective 3
Table 3 shows that the variation in oil production by OPEC in America had a significant influence on the variation in WTI price of the following period. Thus, for objective 3, we employed model (3.9) along with stepwise regression to investigate the correspondence of the variation in oil production by two American OPEC members to the variation in WTI price of the following period.
According to the empirical results shown in Table 4 of OPEC members in America, Venezuela has a significant influence on the variation in WTI price of the following period, indicating a negative relationship. The finding revealed that the variation in oil production by Venezuela affects the variation in WTI price of the following period. When Venezuela’s crude oil production decreases, the WTI price for the following period will increase. de Sena et al. (2013) stated that Venezuela possesses resources for crude oil that ranks second in the world and were of very heavy crude oil property; they also verified in their empirical analysis that WTI price was closely associated with the crude oil production by Venezuela and estimated that since 2010, the Venezuela’s oil price index had exhibited a tendency opposite to WTI price, as shown in Figure 3.
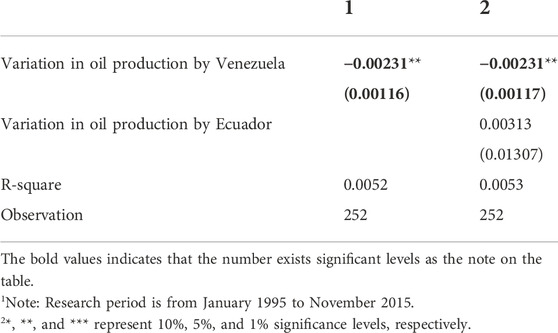
TABLE 4. Relationship between variation in oil production by American OPEC members and variation in WTI price of the following period.
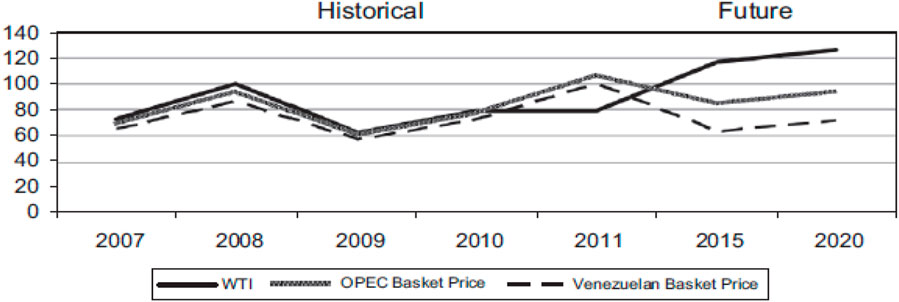
FIGURE 3. Tendency of WTI, OPEC, and Venezuelan prices.
Table 3 indicates that the variations in oil production by OPEC members in Asia significantly influence the Dubai price variation for the following period. Hence, for objective (3) with model (3.9), we used stepwise regression to explore how the variations in oil production by OPEC members in Asia affect the variations in Dubai prices of the following period.
The empirical result in Table 5 reveals that the variation in oil production by an Asian OPEC member, Qatar, has positive and significant effect on the variation in Dubai price of the following period, that is, when the variation in oil production by an Asian OPEC member, Qatar, increases, the variation in Dubai price of a following period will also increase.
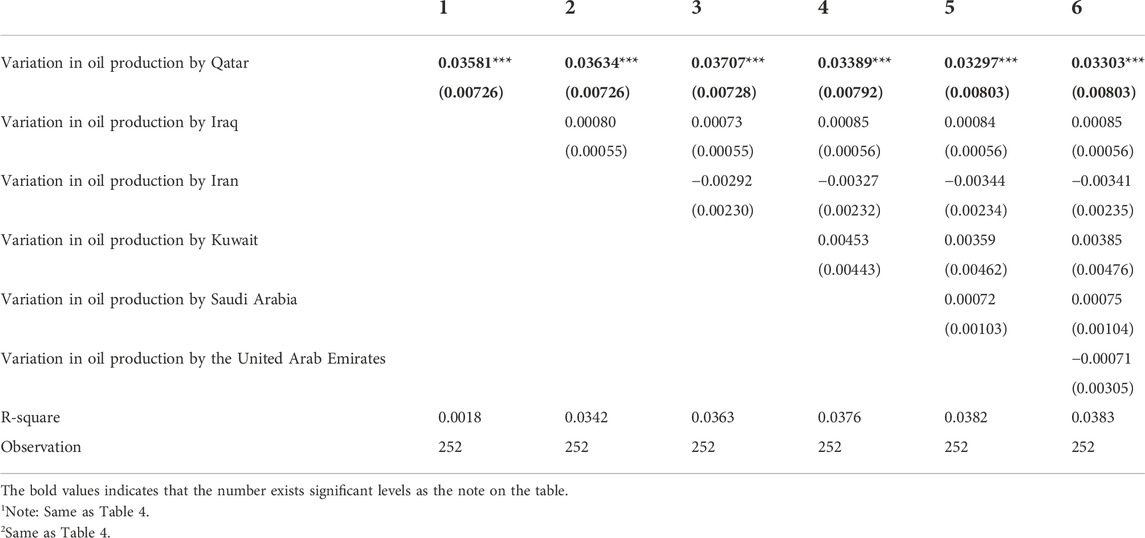
TABLE 5. Relationship between the variations in OPEC oil productions from Asia and the variations in Dubai price of the following period.
Table 5 indicates that the variation in oil production by non-OPEC members in Europe has significant effect on the variation in Brent price of a following period; hence, with model (3.9) of objective (3.10), we further used stepwise regression to investigate how the variations in oil production by 53 non-OPEC members in Europe affected the variation in Brent price of a following period.
The empirical result in Supplementary Appendix Table SA1 reveals that the variation in Brent price of the following period is affected in two ways. The variations in oil production by Sudan and South Sudan, Vietnam, Ivory Coast, Egypt, the Netherlands (offshore), Romania, Albania, and Greece had negative and significant effect on the variation in Brent price of the following period; however, the variations in oil production by some states such as Estonia, Azerbaijan, Austria, Spain, Ukraine, Gabon, Malawi, Portugal, and Georgia had positive and significant effect on the variation in Brent price of the following period.
4.3 Empirical analysis
Our empirical analysis will now combine objectives 1–3 to look into the details of the influences of the organizations and their members in different continents on the major oil prices.
The OPEC member in America whose oil production variation affects the variation in WTI price of the following period is Venezuela. The empirical results showed that both the continent and the member states exhibited negative and significant influence, meaning when the oil production by American OPEC members and, among them, Venezuela, increased, the WTI price of the following period decreased. Hence, the variation in total OPEC production from this area and the production by Venezuela would affect the WTI price.
The reasons that affected the variation in Dubai price in the following period were the variations in oil production by OPEC, Asian OPEC members, and Qatar. Such empirical results were all positive and significant, which means that the change in the output of Qatar crude oil and deferred one period of Dubai crude oil price change have a sticky behavior for the production and price behavior. In terms of production and price of crude oil, when its price goes up, the oil-producing countries would also increase their production, to make more profit, after it was increased by the time delay effect (oil price delayed one month), which led to an increase of crude oil price. The European Commission (2018) mentioned that the market integrates the decisions of producers and other factors to form prices and then transmits this comprehensive information to various decision-makers. This function of price is called the price function or market function. This effect conformed to the research result. When it was increased by time or when the delay effect was enhanced, a change of the same direction can be seen between the output of Qatar crude oil and deferred one period of Dubai crude oil price change.
The reasons that affect the variation in Brent price of the following period are non-OPEC in Europe and its members, who are Estonia, Azerbaijan, Austria, Spain, Ukraine, Gabon, Malawi, Portugal, Georgia, Sudan and South Sudan, Vietnam, Ivory Coast, Egypt, the Netherlands (offshore), Romania, Albania, and Greece; of these states, the variations in oil production by Sudan and South Sudan, Vietnam, Ivory Coast, Egypt, the Netherlands (offshore), Romania, Albania, and Greece significantly negatively affect the variation in Brent price of the following period, that is, when their oil production increases, Brent price changes in an opposite way. As such, the variations of oil production by these states are consistent with the supply–demand mechanism of the market, whereby the variation in Brent price of the following period is enabled to reflect the variations in oil production by these states fully. Meanwhile, the variations in oil production by Estonia, Azerbaijan, Austria, Spain, Ukraine, Gabon, Malawi, Portugal, and Georgia have a positive and significant effect on the variation in Brent price in the following period, that is, when their oil production changes in an increasing manner, Brent price changes in the same way, meaning the magnitude of variation in production by these states is not enough to fully reflect the changes in oil price in the supply–demand mechanism. Xiang-Hen (2017) stated that crude oil price may be affected by stock position, hedge funds, and demand position because of other interfering factors, the positive and significant influence of the variations in the oil production by these member states on the variation in Brent price of the following period may be unable to reflect the supply–demand mechanism of the market exactly.
5 Conclusion
5.1 Discussion about this research
Empirical results reveal that the variation in WTI price of the following period represent the variations in oil production by American OPEC members, especially Venezuela. The reasons that affect the variation in Dubai price of the following period are the variations in oil production by OPEC, its Asian area and its member, Qatar. The reasons that affect the variation in Brent price of the following period are the variations in oil production by European non-OPEC and its members, which are Estonia, Azerbaijan, Austria, Spain, Ukraine, Gabon, Malawi, Portugal, Georgia, Sudan and South Sudan, Vietnam, Ivory Coast, Egypt, the Netherlands (offshore), Romania, Albania, and Greece.
Numerous researchers have analyzed crude oil prices in recent years, using many empirical methods, such as the SVAR model, error correction model, and econometrics, aiming to more accurately predict the future tendency of oil price. This study focused on the world’s crude oil productions to explore their relationship to oil prices. Members were divided into organizations, continents, and members of each organization and were placed in an unbalanced random effect regression model, to investigate, empirically and cross-section-wise, how the production of crude oil affects its price. With the empirical results of this study, managers can anticipate the tendency of oil price of a following period based on current oil production, which would facilitate them to make better decisions. The empirical results here are trusted to make certain contributions and create value for many crude oil-related businesses like finance, petroleum, aviation, tourism, transportation, plastics, developing countries, and the military. For subsequent research, incorporating other variables like crude oil cost, demand by oil-needing countries, general economic indicators, and alternative energy, such as shale oil, is required to explore the tendency of crude oil price.
5.2 Concluding remarks
Various studies have confirmed the importance of crude oil prices to the global economy. This study focuses on the relationship between crude oil prices and production levels. However, the relationship between physical products and financial variables, such as exchange rates, gold, stock prices, futures, rig counts, and interest rates, all affect oil prices. Therefore, in addition to the in-depth understanding of the relationship between oil prices and production, the relationship between other variables and oil prices is a valuable and worthwhile topic to explore.
Crude oil is a necessary product for industrial production, and it is also an important raw material for gasoline, diesel oil, and lubricating oil that people use daily. Therefore, immediate fluctuations in crude oil prices are related closely to economic development. The monthly data of the research period of this study are from January 1995 to November 2015. If future scholars are interested in this topic, they can update the data and add other research variables to continue exploring it.
Data availability statement
The original contributions presented in the study are included in the article/Supplementary Material; further inquiries can be directed to the corresponding author.
Author contributions
All authors listed have made a substantial, direct, and intellectual contribution to the work and approved it for publication.
Conflict of interest
Author H-HC was employed by the company Formosa Plastics Group.
The remaining authors declare that the research was conducted in the absence of any commercial or financial relationships that could be construed as a potential conflict of interest.
Publisher’s note
All claims expressed in this article are solely those of the authors and do not necessarily represent those of their affiliated organizations, or those of the publisher, the editors, and the reviewers. Any product that may be evaluated in this article, or claim that may be made by its manufacturer, is not guaranteed or endorsed by the publisher.
Supplementary material
The Supplementary Material for this article can be found online at: https://www.frontiersin.org/articles/10.3389/fenvs.2022.933431/full#supplementary-material
References
de Sena, M. F. M., Luiz, P. R., and Alexandre, S. (2013). Will Venezuelan extra-heavy oil be a significant source of petroleum in the next decades? Energy policy 61, 51–59. doi:10.1016/j.enpol.2013.05.101
Donald, R. C., and Pamela, S. S. (2003). Business research methods. 8th ed. New York: McGraw-Hill Higher Education.
Energy Information Administration (2016). EIA - independent Statistics and analysis. Available at: http://www.eia.gov/finance/markets/supply-opec.cfm.
European Commission (2018). European commission. Available at: https://ec.europa.eu/info/sites/default/files/aid_development_cooperation_fundamental_rights/annual_report_ge_2021_printable_en_0.pdf.
Eva, R. (2007). Oil and energy price Volatility. Energy Econ. 29 (3), 405–427. doi:10.1016/j.eneco.2005.11.003
Fabian, K. (2010). The third oil price surge–What’s different this time? Energy Policy 38 (3), 1596–1606. doi:10.1016/j.enpol.2009.11.044
Gui-Feng, H. (2016). Why did the price of oil hurt the tide of Taiwan? COMMONWEALTH. Available at: http://www.cw.com.tw/article/article.action?id=5074252.
Harri, R. (2002). Oil production responses to price changes: An empirical Application of the competitive model to OPEC and Non-OPEC countries. Energy Econ. 24 (2), 97–106. doi:10.1016/s0140-9883(01)00091-3
Horn, M. (2004). OPEC’s optimal crude oil price. Energy Policy 32 (2), 269–280. doi:10.1016/S0301-4215(02)00289-6
International Energy Statistics (2016). International energy Statistics - EIA. Available at: http://www.eia.gov/cfapps/ipdbproject/IEDIndex3.cfm?tid=50.
James, D. H. (2011). Historical oil shocks (No. w16790). New York, NY: National Bureau of Economic Research.
Jan, B. (2007). Does OPEC influence crude oil prices? Testing for co-movements and causality between regional crude oil prices. Appl. Econ. 39 (11), 1375–1385. doi:10.1080/00036840600606344
Jin-Ring, T. (2016). Master the Key Elements of oil price fluctuations. Taipei: Ministry of Economic Affairs. Available at: http://energymonthly.tier.org.tw/outdatecontent.asp?ReportIssue=201601&Page=9.
Jochen, H. F. G. (2014). How do oil producers Respond to oil demand Shock-s? Energy Econ. 44, 1–13. doi:10.1016/j.eneco.2014.03.012
Kaddour, H. (2000). Testing for Stationarity in Heterogeneous panel data. Econ. J. 3 (2), 148–161. doi:10.1111/1368-423x.00043
Marius, L. M., and Decean, L. D. (2012). First oil Shock Impact on the Japanese economy. Procedia Econ. Finance 3, 1042–1048. doi:10.1016/s2212-5671(12)00271-7
Michael, Y., John, Z., Carol, J. B., and Joanne, S. (2009). A short-Run crude oil price Forecast model with Ratchet effect. Atl. Econ. J. 37 (1), 37–50. doi:10.1007/s11293-008-9158-2
Michael, Y., John, Z., and Joanne, S. (2006). Short-run crude oil price and surplus production capacity. Int. Adv. Econ. Res. 12 (3), 390–394. doi:10.1007/s11294-006-9026-2
Qi-yuan, L., Qian-hui, T., and Wen-ting, C. (2015). International crude oil price Volatility and its Impact on China’s economy. Taipei: Ministry of Economic Affairs. 37. 2nd-grade.pdf.
Rajdeep, G., Joseph, A. C., and Hans, B. (2004). Multicollinearity and measurement error in Structural Equation models: Implications for theory testing. Mark. Sci. 23 (4), 519–529. doi:10.1287/mksc.1040.0070
Ronald, A. R., and Joaquin, L. V. (2015). OPEC and Non-OPEC oil production and the global economy. Energy Econ. 50, 364–378. doi:10.1016/j.eneco.2014.12.001
Summer, S. (2016). IEA: Crude production to Fall behind demand. Available at: http://www.wsj.com/articles/iea-sees-oil-demand-easing-as-economic-outlook-dims-1470902402.
U.S Energy Information Administration (2015). EIA-independent Statistics and analysis. Available at: https://www.eia.gov/todayinenergy/detail.php?id=18571.
Wilfrid, L. K. (2002). OPEC behavior, 1998–2001. Q. Rev. Econ. Finance 42 (2), 209–233. doi:10.1016/s1062-9769(02)00132-1
Xiang-Hen, L. (2017). Oil prices look at these five factors. Financial Times. Available at: http://news.cnyes.com/news/id/3748385.
Keywords: unbalanced panel random effect regression, OPEC, non-OPEC, crude oil price, oil production
Citation: Yang T-Y, Chen S-H, Yang Y-T and Chang H-H (2022) Relationship between crude oil price and production levels—An empirical study of OPEC and non-OPEC states. Front. Environ. Sci. 10:933431. doi: 10.3389/fenvs.2022.933431
Received: 09 May 2022; Accepted: 03 October 2022;
Published: 18 November 2022.
Edited by:
Mobeen Ur Rehman, Shaheed Zulfikar Ali Bhutto Institute of Science and Technology (SZABIST), United Arab EmiratesReviewed by:
Ahmad Raza Bilal, Superior College Lahore, PakistanElchin Suleymanov, Baku Engineering University, Azerbaijan
Copyright © 2022 Yang, Chen, Yang and Chang. This is an open-access article distributed under the terms of the Creative Commons Attribution License (CC BY). The use, distribution or reproduction in other forums is permitted, provided the original author(s) and the copyright owner(s) are credited and that the original publication in this journal is cited, in accordance with accepted academic practice. No use, distribution or reproduction is permitted which does not comply with these terms.
*Correspondence: Ssu-Han Chen, c3N1aGFuY2hlbkBtYWlsLm1jdXQuZWR1LnR3