 Guangtao Guo
 Dingping Xu
 Guangliang Feng
 Xiaogang Wu1
95% of researchers rate our articles as excellent or good
Learn more about the work of our research integrity team to safeguard the quality of each article we publish.
Find out more
ORIGINAL RESEARCH article
Front. Environ. Sci. , 13 July 2022
Sec. Environmental Informatics and Remote Sensing
Volume 10 - 2022 | https://doi.org/10.3389/fenvs.2022.931757
This article is part of the Research Topic Advances in Modeling, Assessment, and Prevention of Geotechnical and Geological Disasters View all 44 articles
With the increasing global demand for clean and renewable energy sources, many underground hydropower caverns are built in deep mountain valleys in high-stress regions. The evolution of the mechanical properties of the surrounding rock of underground caverns under high-stress excavation requires urgent investigation. According to the deep-buried granite in the underground caverns of the Shuangjiangkou hydropower station, triaxial tests under confining pressures of 10, 30, 40, and 50 MPa were conducted by the MTS815 rock mechanics test system. Based on the stress–strain curve, the evolution law of the strength parameters of rock samples with the crack volume strain and energy with the energy consumption ratio under different confining pressures was analyzed. Our results showed that the stress–strain curve of the sample is divided into five stages with four characteristic points: the closed point, initiation point, volume expansion point, and peak point. The strength of each stage increases with an increase in the confining pressure. In addition, the failure of this granite is characterized by apparent shear failure. The internal friction angle and the cohesion increase rapidly with the increase in the crack volume strain, and they gradually tend to be constant. Furthermore, the confining pressure profoundly influences energy evolution during the loading in the stable and unstable crack growth stages. In these stages, total energy, dissipated energy, and elastic strain energy increase with an increase in the confining pressure. Finally, the energy consumption ratio can represent the preliminary criterion of rock failure in terms of energy. With the increase in the confining pressure, the energy consumption ratio of rock samples gradually increases to approximately 1.0 at the peak stress point. The research results can provide a reference for the instability prediction of surrounding rock masses of high-stress underground caverns.
With the development of the world economy and the population increase, traditional nonrenewable energy sources can no longer meet the energy demand. Hydropower has become an essential part of economic activities in various countries as renewable and clean energy. Many underground power stations are built in mountain valleys in deep high-stress areas, limited by specific topographical and geological conditions (He et al., 2005; Wang et al., 2006; Xie et al., 2015; Wang et al., 2016; Xu D. et al., 2022). Most of the diversion tunnels of Jinping II Hydropower Station have a buried depth of 1,500 m with a maximum buried depth reaching 2,525 m. Therefore, these deep underground hydropower facilities are unavoidably confronted with a similar issue: the stability of the underlying rock mass in a deep-buried or high-stress environment. Owing to the location of the facility in a high-stress region, high-stress-induced failures such as spalling, slab cracking, and rockburst may occur in the surrounding rock during excavation, seriously threatening the safety of personnel, failure of the surrounding rock support system, and increasing engineering costs (Feng et al., 2015; Feng et al., 2018; Zhang et al., 2020; Xu et al., 2021; Feng et al., 2022; Xu D.-P. et al., 2022; Zhang et al., 2022). Thus, it is critical to investigate the development of the surrounding rock failure process in a high-stress underground cavern and to provide an experimental basis for developing a durable surrounding rock excavation and support scheme.
Pioneers have conducted extensive research on rock failure during loading. Martin et al. (Martin 1993; Martin and Chandler 1994; Martin 1997) presented a method for calculating the characteristic stress based on the crack volume strain based on the extensive laboratory tests on Lac du Bonnet granite. Hajiabdolmajid et al. (2000) proposed a cohesion weakening and frictional strengthening model to capture an essential component of brittle rock mass failure. Eberhardt et al. (1999) performed an extensive laboratory investigation into the identification and quantification of stress-induced brittle fracture damage in rock. Pourhosseini and Shabanimashcool, 2014 developed an elasto-plastic constitutive model to describe the pre-peak elastic and the post-peak strain-softening behavior and the dilation of intact rocks under static loading. Zhu et al. (2007) studied the relationship between the crack initiation stress, crack initiation angle, and confining pressure based on the uniaxial and triaxial test results of Three Gorges granite. Yang et al. (2005) explored the strength and deformation characteristics of medium- and coarse-grained marbles via triaxial tests under a confining pressure of 5–40 MPa. Pu et al. (2017) quantitatively analyzed the influence of the confining pressure on the strength and deformation characteristics of phyllite based on triaxial compression tests under a confining pressure of 5–30 MPa. Zhao et al. (2014) conducted uniaxial and triaxial compression tests on Beishan granite under a confining pressure of 5–40 MPa, analyzed the stress–strain curve and its spatiotemporal distribution relationship with acoustic emission (AE) events, and revealed the rock fracture evolution mechanism in different stages of compression deformation.
The essence of rock fracture involves the flow and transformation of energy inside the rock. The storage, dissipation, and release of energy are closely related to the fracture damage state of the rock. Thus, in-depth and systematic research has been conducted on the energy evolution mechanism of hard rock failure under different mechanical environments. Xie et al. (2005) preliminarily explored the energy change process during rock failure through uniaxial tests on granite, limestone, and sandstone. Yu et al. (2022) investigated the energy evolution and the spatial fractal characteristics of acoustic emission events in the process of sandstone failure through uniaxial tests. You and Hua, 2002 investigated the energy change characteristics of siltstone samples during triaxial compression and unloading. Su and Zhang, 2008 studied the variations in strength, average modulus, and energy dissipation characteristics of damaged marble samples. Liu et al. (2013) studied the relations between energy change and the confining pressure, stress, and strain at different stages based on the triaxial compression test results of marble samples. Liu et al. (2021) investigated the mechanical properties and energy evolution of granite rocks through a triaxial compression test under different confining pressures and suggested a model for describing rock damage evolution. Wang et al. (2021) examined the confining pressure effect of energy dissipation during hard rock fracture based on the stress–strain curves and AE characteristics of Beishan granite samples under different confining pressures.
In summary, it can be found that the pioneer’s research rarely dealt with the evolution law of strength parameters with damage variables before the failure of high-stress hard rock. Second, the research on the energy evolution of the high-stress hard rock failure process mainly focused on the energy change during loading, and there were few research results that combine the energy evolution law with the macroscopic failure of the rock. In this study, the MTS815 electro-hydraulic servo mechanics test system was used to carry out triaxial compression tests on deep-buried fine-medium-grained granite from the Shuangjiangkou underground powerhouse to investigate the rock strength parameters and energy evolution law under different confining pressures (0–50 MPa). The research results are expected to provide a laboratory test basis for the selection of rock mass mechanical parameters, engineering numerical computation, excavation plan development, and surrounding rock mass support design of underground caverns under high-stress conditions.
The studied granite was taken from a pilot tunnel of the under-construction underground caverns at the Shuangjiangkou hydropower station, which is situated roughly 2–6 km below the Zumuzu–Chuosijia river confluence in the upper sections of the Dadu River in Maerkang and Jinchuan counties, Aba Prefecture, Sichuan Province, China. The measured magnitudes of three in situ principal stresses (σ1, σ2, and σ3) in the underground caverns areas were 16–38, 9–20, and 3–10 MPa, respectively. The rock mass surrounding the underground caverns was composed of Yanshanian porphyritic biotite-K-feldspar granite. Pegmatite veins with a thickness of less than 1 m and length of 3–10 m were randomly mixed into the granite in the form of veins, bands, and block shapes.
The drilled granite core (70–72 mm in diameter) (Figure 1A) was further processed and polished into a cylindrical sample with a diameter of 50 mm and a height of 100 mm (Figure 1B) according to the suggested methods of the International Society of Rock Mechanics (Bieniawski and Bernede, 1979). The P-wave velocity of the rock sample measured using an acoustic velocimeter was 3,750–3,850 m/s. Furthermore, the rock piece from the pilot tunnel was polished and processed on the spot into mineral slices, which were identified using polarized light microscopy (Figure 2). The granite was characterized as fine–medium-grained granite with grain sizes ranging from 0.20 to 4.75 mm. The granite has a mineral composition of 35% quartz, 50% feldspar, 10% mica, and a small amount of zircon and iron (Table 1). The granite displays material features of brittle failure owing to the high amount of quartz in the mineral composition.
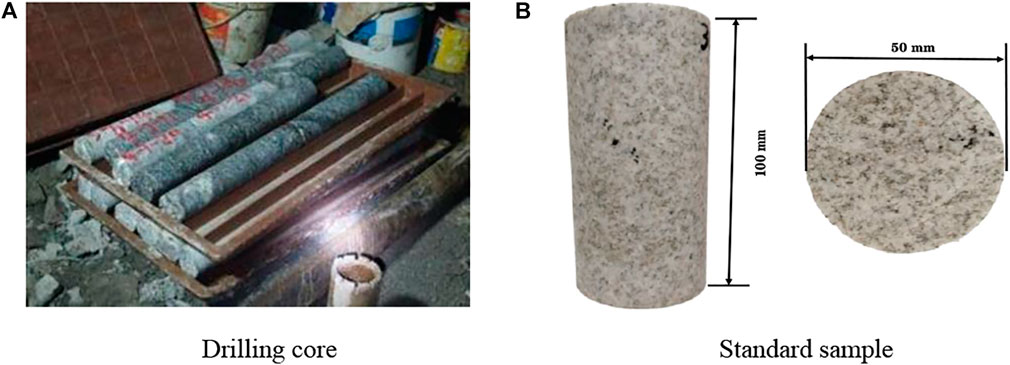
FIGURE 1. Test sample source and shape: (A) Drilling core; (B) Standard sample.
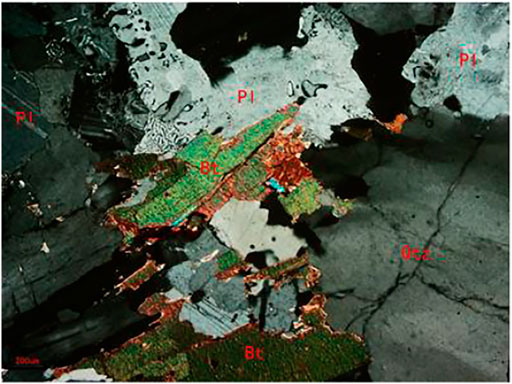
FIGURE 2. Mineral composition of the granite sample under a polarized light microscope.

TABLE 1. Mineral content and the grain size of the Shuangjiangkou granite.
Uniaxial and triaxial tests were performed using the MTS815 rock mechanics test system. This test equipment can be used to accurately and consistently determine the mechanical properties and seepage characteristics of rock masses, concretes, and coals under complex stress conditions. The system can also collect data at high and low speeds for various loading modes, including force, displacement, axial strain, and circumferential strain. The axial ultimate loading capacity of the test system is 4,600 kN, and the maximum confining pressure that can be applied is 140 MPa.
The test scheme is shown in Table 2. The confining pressures of triaxial tests were 10, 30, 40, and 50 MPa. There were three specimens for the triaxial tests corresponding to each confining pressure. Testing was performed according to the following steps: 1) a load of 0.5 kN was applied in advance to ensure contact between the indenter and the sample. 2) The axial load and confining pressure were applied simultaneously at a predetermined value at a loading rate of 0.5 MPa/s 3) The confining pressure was kept constant, and the axial load was continuously increased until the sample failed.
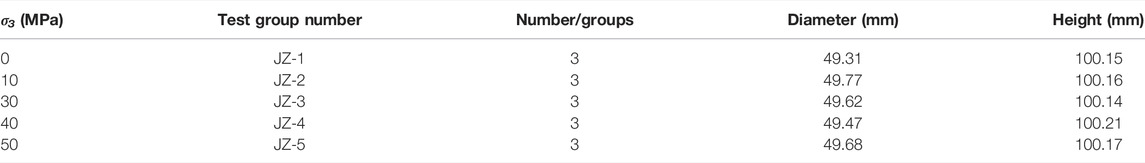
TABLE 2. Test scheme and parameters.
Rock failure is closely related to the stress path under excavation. The rock failure process under different stress paths can be reflected by the changing trend of connection points in each stage of the stress–strain curve. Therefore, accurately determining the characteristic points of each stage of rock failure is helpful in predicting and preventing rock engineering disasters. The characteristic points at the stress–strain curve of rock samples are the closed, initiation, volume expansion, and peak points. Consequently, the stress–strain curve can be divided into five stages: compaction, linear elastic, stable crack growth, unstable crack growth, and post-peak stages. The stress values corresponding to these four points are the closing stress σcc, the crack initiation stress σci, the damage stress σcd, and the peak stress σf. σf can be directly obtained because it is equal to the maximum stress at the stress–strain curve. σcc, σci, and σcd are primarily determined through the AE test method, the lateral strain difference method, and the crack volume strain method (Martin, C.D. et al., 1994). In this study, σcc, σci, and σcd were determined based on the crack volume strain method because this method has a clear idea and easy operation. According to the crack volume strain method, the volume strain εν is the sum of the elastic volume strain
where
According to the generalized Hooke’s law, the elastic volume strain εeν can be obtained as follows:
where
In the compaction and linear elastic stage stages, the reduction of
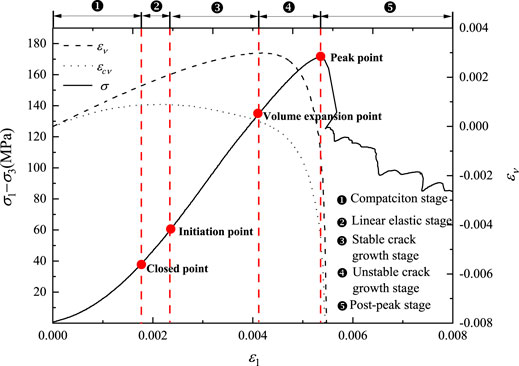
FIGURE 3. Schematic diagram of the determination of each stage and characteristic stress of the stress–strain curve under σ3 = 0 MPa.
According to Eqs 1 and 2, εcν under the confining pressure of 0–50 MPa was obtained. According to the crack volume strain method, the
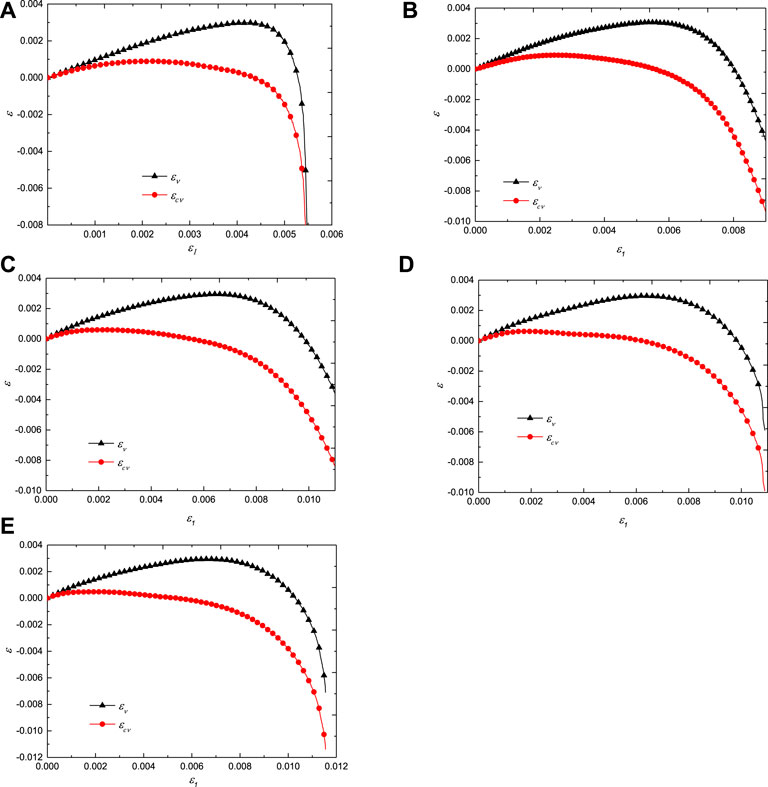
FIGURE 4. εcν–ε1 and εν–ε1 curves under different confining pressures: (A) σ3 = 0 MPa; (B) σ3 = 10 MPa; (C) σ3 = 30 MPa; (D) σ3 = 40 MPa; (E) σ3 = 50 MPa.
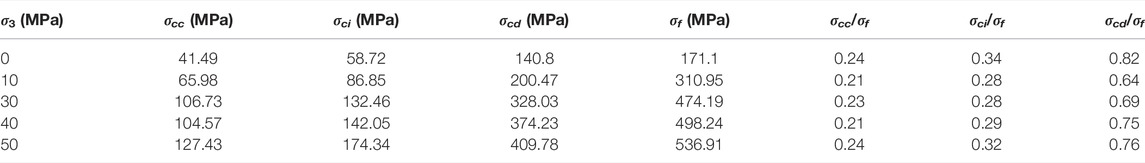
TABLE 3. Characteristic stress value and its ratio to peak stress under different confining pressures.
Since the failure of rock samples in this study was characterized by shear failure (Figure 5), the internal friction angle φ and cohesion c corresponding to each characteristic stress point were calculated using the Mohr–Coulomb criterion (Eq. 3).
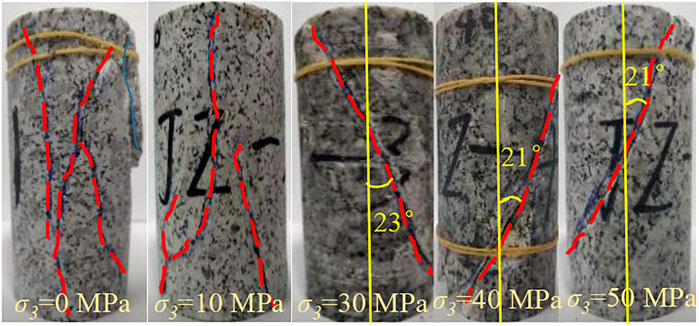
FIGURE 5. Failed rock samples in compression tests.
Generally, when the loading stress exceeds σci, the rock begins to be damaged. Cracks inside the rock grow differently in response to various types of forces. In the stable crack growth stage, internal cracks mainly develop in the direction parallel to σ1, and the damage gradually increases. In the unstable crack growth stage, internal cracks are mainly characterized by penetration and slip. The damage gradually increases and accumulates until the rock fails. Therefore, the zeroed crack volume strain
(1) Deviatoric stress
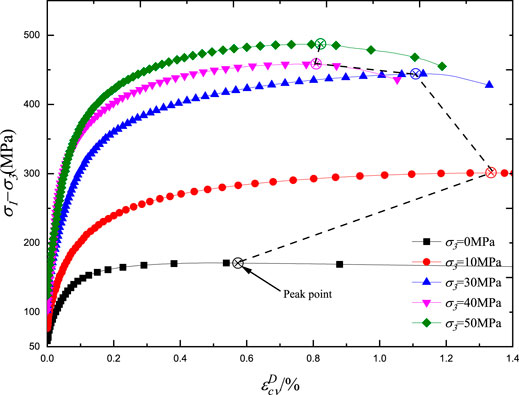
FIGURE 6. Relationship between deviator stress and
(2) φ and c values were obtained at different
(3) The relationship curve between φ, c, and
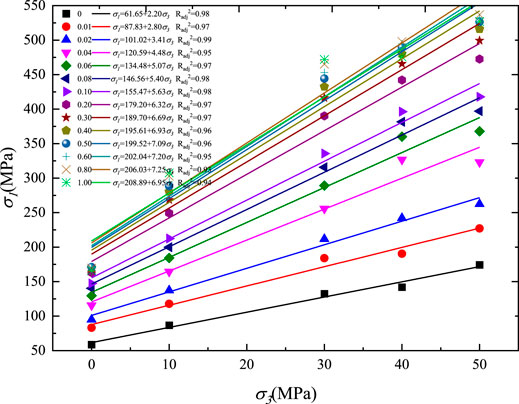
FIGURE 7. Relationship between σ1 and σ3 under different
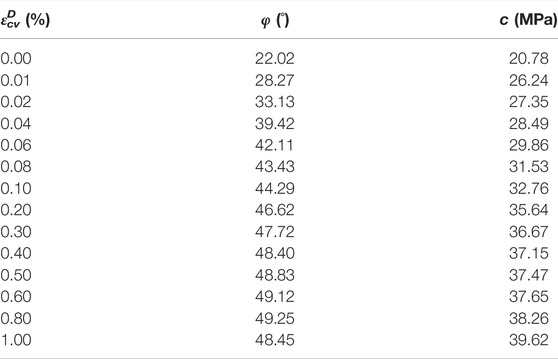
TABLE 4. φ and c values at various
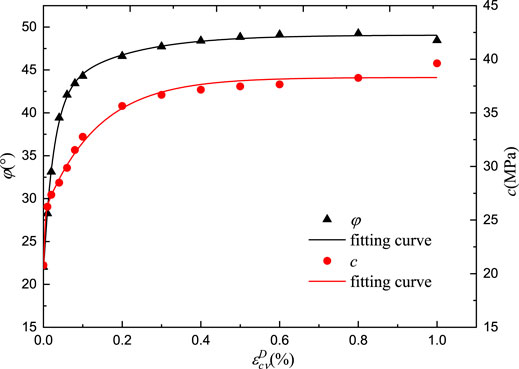
FIGURE 8. Evolution law of strength parameters φ, c with
From Figure 8, it can be seen that for Shuangjiangkou granite, φ and c first increased rapidly with the increase in
The failure process of rock samples is a process of energy absorption, storage, dissipation, and release. The work done by external force on the rock includes elastic strain energy, plastic deformation energy, damage energy, and other dissipated energy. When the elastic strain energy of the rock absorbed and stored from the external system reaches its energy storage limit, the rock fails, and the stored energy is converted into surface energy, kinetic energy, heat energy, and other radiant energy. Based on this understanding, the energy analysis of the rock failure process can be conducted.
Assuming that the rock system is a closed system which does not exchange heat with the outside, the total work of the test equipment on the rock sample U can be converted into elastic strain energy Ue and dissipated energy Ud according to the first law of thermodynamics:
Assuming that the rock is homogeneous and isotropic, the energy during loading can be known from the elastic theory:
Under the conventional triaxial condition (σ2 = σ3), Eqs 5 and 6 can be simplified as
U, Ue, and Ud of the triaxial samples were determined using Eqs 4 and 8 based on the stress–strain curves subjected to different confining pressures (Figure 9). By analyzing the energy changes in the five stages (compaction, linear elastic, stable crack growth, unstable crack growth, and post-peak stages) and four characteristic points (closed, initiation, volume expansion, and peak points), we obtained the energy evolution law of the samples during the whole loading–failure process:
1) In the compaction stage, the closure and slip of micro-cracks consume most of U (presented as Ud), resulting in less increase in Ue with the increase in the axial strain.
2) In the linear elastic stage, the compaction of micro-cracks consumes most of U (presented as Ue), leading to a small Ue. Ue increases linearly with the increase in the axial strain.
3) In the stable crack growth stage, many micro-cracks initiate with the increase in the axial load. As the number of micro-cracks continues to increase, Ue increases in a decreasing growth rate, and Ud increases with the increase in the axial strain.
4) In the unstable crack growth stage, the micro-cracks propagate with the increase in the axial load. As the propagation of micro-cracks continues, Ud and Ue rise in increasing and decreasing growth rates, respectively, indicating that the rock’s internal structure changes dramatically. Moreover, the greater the confining pressure is, the more pronounced the gap between Ue– and U–ε1 curves.
5) In the post-peak stage, the micro-cracks penetrate to form macroscopic fractures. Ue is converted into Ud, which is presented as surface energy and kinetic energy. Ue decreases and Ud increases significantly with the increase in the axial strain until the rock fails.
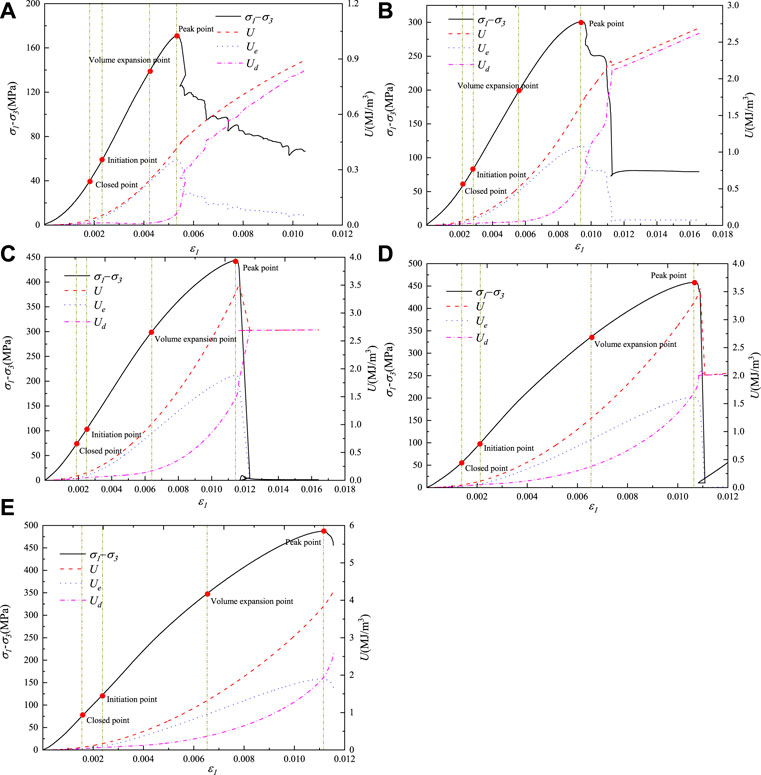
FIGURE 9. Energy– and stress–strain curves of triaxial samples subjected to different confining pressures (A) σ3 = 0 MPa; (B) σ3 = 10 MPa; (C) σ3 = 30 MPa; (D) σ3 = 40 MPa; (E) σ3 = 50 MPa.
By comparing the energy evolution of each stage under different confining pressures, we found that the energy release is concentrated in the post-peak stage, and the energy dissipation is primarily concentrated in the stable and unstable crack growth stages. To explore the influence of the confining pressure on the energy evolution, the U, Ue, and Ud values at the initiation, volume expansion, and peak stress points (Table 5) were calculated, and the corresponding U–, Ue–, and Ud–σ3 curves were plotted as shown in Figure 10. From the figure, it can be observed that the confining pressure significantly influences the energy evolution during rock failure: 1) the higher the confining pressure, the larger the difference between the U– and Ue–σ3 curves. 2) U at each stage linearly increases with the increase in confining pressure. 3) Ud and Ue at each stage nonlinearly increase with the increase in confining pressure.
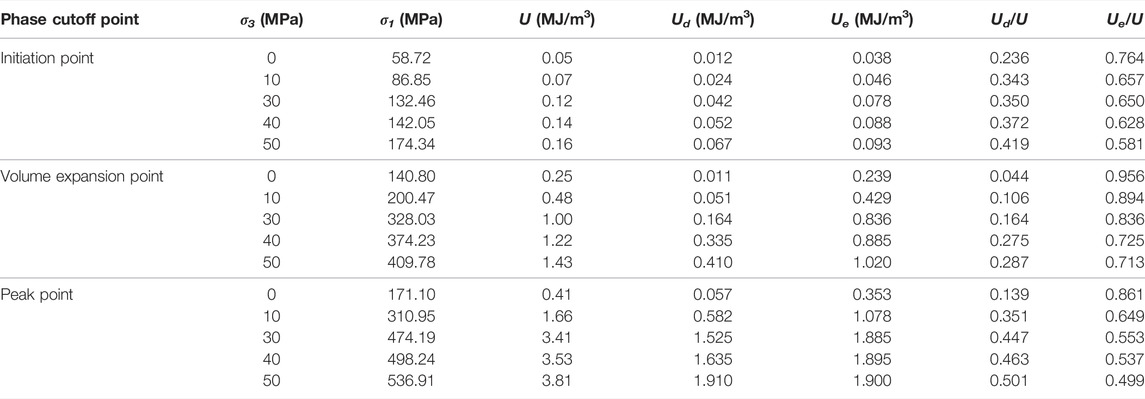
TABLE 5. Dissipated energy, elastic strain energy, and their ratio to total energy of each characteristic stress point in the crack growth stage.
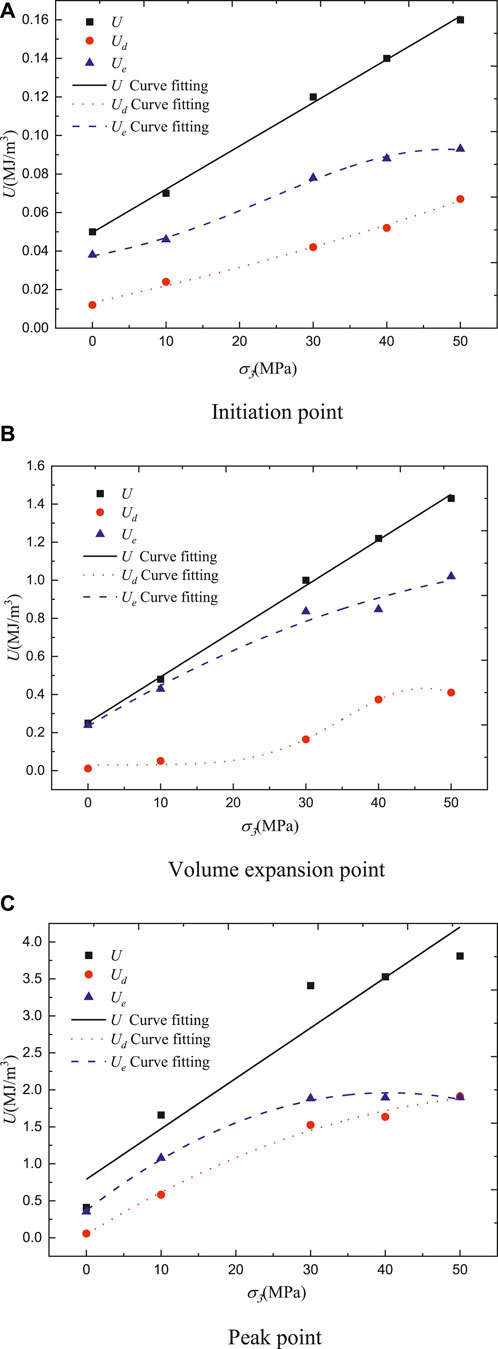
FIGURE 10. U, Ud, and Ue at the (A) initiation point, (B) volume expansion point, and (C) peak point.
From the energy perspective, rock failure is caused by the quick release of accumulated Ue inside the rock. The accumulation of Ue is mainly concentrated in the stable crack growth and unstable crack growth stage. In these stages, part of Ue is converted into Ud, which leads to a sharp increase in Ud and the gradual accumulation of internal damage. Therefore, the transition from the stable state to the unstable state is a process of energy transformation and mutation. Therefore, the energy consumption ratio ku was defined to characterize the energy change and the stable state of the rock during loading (Jin et al., 2004; Li et al., 2018; Meng et al., 2020).
Here, when ku < 1, the rock is in a relatively stable state; when ku = 1, the rock is in a critical stable state; and when ku > 1, the rock is in an unstable state.
The ku–ε1 curves of Shuangjiangkou granite under different confining pressures show that 1) the ku–ε1 curve is spoon-shaped (Figure 11), indicating that with the increase in ε1, ku first decreases and then increases after an inflection point (minimum ku-value); 2) ku at the inflection point increases with the increase in the confining pressure (Figure 11F); 3) before the peak point, ku increases with the increase in the confining pressure, and ku under each confining pressure is less than 1.0; and 4) ku at the peak point approaches 1.0 (Figures 11A–F). At this point, the rock samples under low confining pressures are in a stable state, whereas those under high confining pressure are in a critical state. The presence of multiple sets of tensile-shear cracks inside the failed rock samples under low confining pressures (σ3 = 0, 10 MPa, see Figure 5) indicates that Ud at the pre-peak stages is relatively large, and the Ue is relatively small, thereby reducing the rate of energy dissipation and release during specimen damage. In contrast, the presence of one set of shear fractures inside the failed rock samples under high confining pressure (σ3 = 20, 30, and 50 MPa, see Figure 5) indicates that most of U is transferred to Ue at pre-peak stages, resulting in a sudden release of Ue when the rock sample fails. Therefore, ku can describe the stable state of the rock and provide new ways for predicting rock failure in terms of energy.
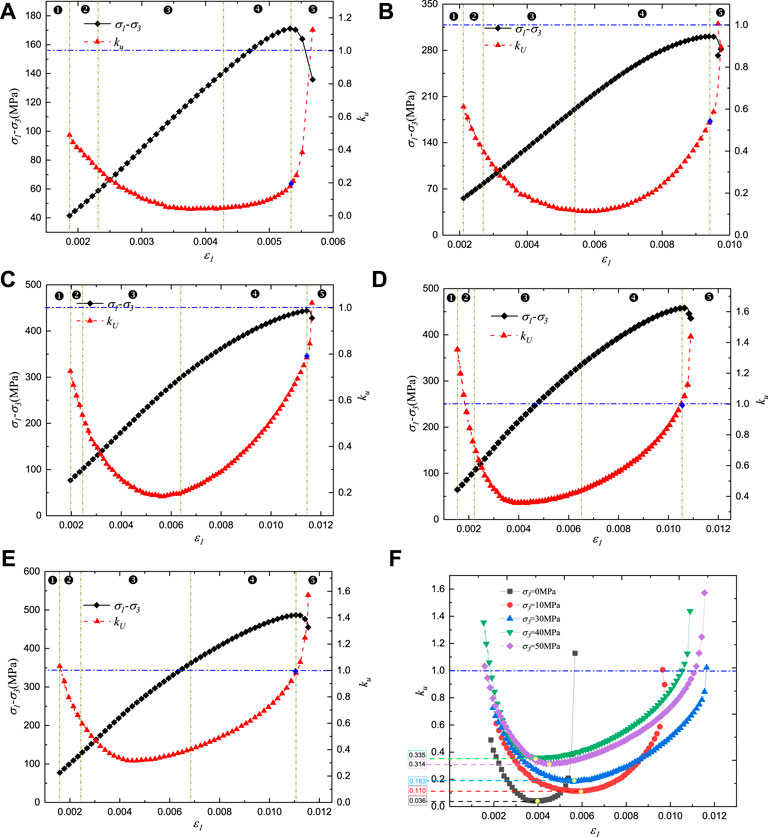
FIGURE 11. Stress–strain and ku–ε1 curves under different confining pressures. (A) σ3 = 0 MPa; (B) σ3 = 10 MPa; (C) σ3 = 30 MPa; (D) σ3 = 40 MPa; (E) σ3 = 50 MPa; (F) ku–ε1 curves.
The influences of confining pressure on the strength, deformation, failure characteristics, and energy development of deep-buried Shuangjiangkou granite were explored using triaxial tests. The following conclusions were drawn:
(1) The stress–strain curve of deep-buried Shuangjiangkou granite can be divided into five stages: the compaction stage, linear elastic stage, stable crack growth, unstable crack growth, and post-peak stages, with four critical points: closed point, initiation point, volume expansion point, and peak point. The corresponding strength parameters of each point increase with the increase in the confining pressure.
(2) The failure of deep-buried Shuangjiangkou granite samples in the triaxial tests under different confining pressures is primarily characterized by shear failure. φ and c tend to be stable after increasing rapidly with the increase in
(3) The confining pressure significantly influences the energy evolution in the stable and unstable crack growth stages. The total energy, elastic strain energy, and dissipated energy at each stage increase with the increase in the confining pressure, and the total energy has a linear relationship with the confining pressure. The elastic strain energy and dissipated energy increase slowly under a high confining pressure.
(4) The energy consumption ratio can be used as a preliminary criterion of rock failure in terms of energy. Compared with that under low confining pressures, the energy consumption ratio under a high confining pressure is relatively more prominent, and with the increase in the confining pressure, the value of the energy consumption ratio at the peak point gradually approaches 1.0, and the rock failure point reaches the peak value.
(5) The underground powerhouse of the Shuangjiangkou hydropower station belongs to an extremely high-stress area. During the excavation process, many branch tunnels have rockburst. The essence of rockburst is the instantaneous expression of energy storage, dissipation, and release inside the rock. Because this granite exhibits rockburst, it is impossible to conduct post-peak reinforcement to prevent or delay the further deterioration of the surrounding rock’s mechanical properties. Therefore, this study can help establish the rock mechanics model for underground caverns. Furthermore, it provides a new perspective for rockburst prediction in advance. It analyzes the stability of engineering rock mass based on the criterion of rock failure energy, which can guide the formulation of the excavation scheme and surrounding rock support countermeasures.
The original contributions presented in the study are included in the article/supplementary material; further inquiries can be directed to the corresponding author.
GTG: methodology and writing—original draft preparation. DPX: conceptualization, methodology, and writing—reviewing and editing. GLF: supervision and writing—reviewing and editing. XGW: investigation. YXZ: data curation. All authors have read and agreed to the published version of the manuscript.
The authors gratefully acknowledge financial support from the National Natural Science Foundation of China (Nos. 51979268 & 42177168) and the Project of Youth Innovation Promotion Association of Chinese Academy of Sciences (No. 2021326).
Authors GG, XW and YZ were employed by Sinosteel Ma’anshan Institute of Mining Research Co, Ltd.
The remaining authors declare that the research was conducted in the absence of any commercial or financial relationships that could be construed as a potential conflict of interest.
All claims expressed in this article are solely those of the authors and do not necessarily represent those of their affiliated organizations, or those of the publisher, the editors, and the reviewers. Any product that may be evaluated in this article, or claim that may be made by its manufacturer, is not guaranteed or endorsed by the publisher.
Bieniawski, Z. T., and Bernede, M. J. (1979). Suggested Methods for Determining the Uniaxial Compressive Strength and Deformability of Rock Materials. Int. J. Rock Mech. Min. Sci. 16, 135–140. doi:10.1016/0148-9062(79)91451-7
Eberhardt, E., Stead, D., and Stimpson, B. (1999). Quantifying Progressive Pre-peak Brittle Fracture Damage in Rock during Uniaxial Compression. Int. J. Rock Mech. Min. Sci. 36, 361–380. doi:10.1016/s0148-9062(99)00019-4
Feng, G.-L., Chen, B.-R., Xiao, Y.-X., Jiang, Q., Li, P.-X., Zheng, H., et al. (2022). Microseismic Characteristics of Rockburst Development in Deep TBM Tunnels with Alternating Soft-Hard Strata and Application to Rockburst Warning: A Case Study of the Neelum-Jhelum Hydropower Project. Tunn. Undergr. Space Technol. 122, 104398. doi:10.1016/j.tust.2022.104398
Feng, G.-L., Feng, X.-T., Chen, B.-r., Xiao, Y.-X., and Yu, Y. (2015). A Microseismic Method for Dynamic Warning of Rockburst Development Processes in Tunnels. Rock Mech. Rock Eng. 48 (5), 2061–2076. doi:10.1007/s00603-014-0689-3
Feng, X.-T., Xu, H., Qiu, S.-L., Li, S.-J., Yang, C.-X., Guo, H.-S., et al. (2018). In Situ observation of Rock Spalling in the Deep Tunnels of the China Jinping Underground Laboratory (2400 M Depth). Rock Mech. Rock Eng. 51, 1193–1213. doi:10.1007/s00603-017-1387-8
Hajiabdolmajid, V., Kaiser, P. K., and Martin, C. D. (2000). Modelling Brittle Failure of Rock. Int. J. Rock Mech. Min. Sci. 39, 731–741.
He, M.-C., Xie, H.-P., Peng, S.-P., and Jiang, Y.-D. (2005). Study on Rock Mechanics of Deep Mining Engineering. Chin. J. Rock Mech. Eng. 24, 2803–2813. doi:10.3321/j.issn:1000-6915.2005.16.001
Jin, F.-N., Jiang, M.-R., and Gao, X.-L. (2004). Defining Damage Variable Based on Energy Dissipation. Chin. J. Rock Mech. Eng. 23, 1976–1980. doi:10.3321/j.issn:1000-6915.2004.12.004
Li, Z.-Y., Wu, G., Huang, T.-Z., and Liu, Y. (2018). Variation of Energy and Criteria for Strength Failure of Shale under Traixial Cyclic Loading. Chin. J. Rock Mech. Eng. 37, 662–670. doi:10.13722/j.cnki.jrme.2017.0927
Liu, P.-F., Fan, J.-Q., and Guo, J.-Q. (2021). Damage and Energy Evolution Characteristics of Granite under Triaxial Stress. Chin. J. High. Press. Phys. 35, 42–51. doi:10.11858/gywlxb.20200622
Liu, T.-W., He, J.-D., and Xu, W.-J. (2013). Analysis of Energy Characteristics of Marble under Triaxial Compression. J. Geotech. Eng. 35, 395–400.
Martin, C. D., and Chandler, N. A. (1994). The progressive fracture of Lac du Bonnet granite. Int. J. Rock Mech. Min. Sci. Geomechanics Abstr. 31, 643–659. doi:10.1016/0148-9062(94)90005-1
Martin, C. D. (1997). Seventeenth Canadian Geotechnical Colloquium: The Effect of Cohesion Loss and Stress Path on Brittle Rock Strength. Can. Geotech. J. 34, 698–725. doi:10.1139/t97-030
Martin, C. D. (1993). The Strength of Massive Lac du Bonnet Granite Around Underground Openings. Winnipeg city: University of Manitoba.
Meng, Q.-B., Liu, J.-F., Ren, L., Pu, H., and Chen, Y.-L. (2020). Rock Energy Evolution and Distribution Law under Triaxial Cyclic Loading and Unloading Conditions. Chin. J. Rock Mech. Eng. 39, 2047–2059. doi:10.13722/j.cnki.jrme.2020.0208
Pourhosseini, O., and Shabanimashcool, M. (2014). Development of an Elasto-Plastic Constitutive Model for Intact Rocks. Int. J. Rock Mech. Min. Sci. 66, 1–12. doi:10.1016/j.ijrmms.2013.11.010
Pu, C., Meng, L. -B., and Li, T. -B. (2017). Rupture and Energy Properties of Phyllite under Triaxial Compression Condition. J. Eng. Geol. 25, 359–366. doi:10.13544/j.cnki.jeg.2017.02.013
Su, C.-D., and Zhang, Z.-H. (2008). Analysis of Plastic Deformation and Energy Property of Marble under Pseudo-triaxial Compression. Chin. J. Rock Mech. Eng. 27, 273–280. doi:10.3321/j.issn:1000-6915.2008.02.007
Wang, C.-L., Du, G.-Y., Li, E.-B., Sun, X., and Pan, Y. (2021). Evolution of Strength Parameters and Energy Dissipation of Deep Granite in Beishan under Conventional Triaxial Compression. J. Rock Mech. Eng. 40, 2238–2248. doi:10.13722/j.cnki.jrme.2021.0071
Wang, M.-Y., Zhou, Z.-P., and Qian, Q.-H. (2006). Tectonic Deformation and Failure Problems of Deep Rock Mass. Chin. J. Rock Mech. Eng. 25, 448–455. doi:10.3321/j.issn:1000-6915.2006.03.002
Wang, R.-K., Xing, W.-B., and Yang, Y.-H. (2016). Review on Construction Technologies of Large-Scale Underground Caverns in Hydropower Stations in China. J. Hydroelectr. Eng. 35, 1–11. doi:10.11660/slfdxb.20160801
Xie, H.-P., Gao, F., and Ju, Y. (2015). Research and Development of Rock Mechanics in Deep Ground Engineering. Chin. J. Rock Mech. Eng. 34, 2161–2178. doi:10.13722/j.cnki.jrme.2015.1369
Xie, H.-P., Peng, R.-D., Ju, Y., and Zhou, H.-W. (2005). On Energy Analysis of Rock Failure. Chin. J. Rock Mech. Eng. 24, 2604–2608. doi:10.3321/j.issn:1000-6915.2005.15.001
Xu, D.-P., Huang, X., Li, S.-J., Xu, H.-S., Qiu, S.-L., Zheng, H., et al. (2022). Predicting the Excavation Damaged Zone within Brittle Surrounding Rock Masses of Deep Underground Caverns Using a Comprehensive Approach Integrating In Situ Measurements and Numerical Analysis. Geosci. Front. 13, 101273. doi:10.1016/j.gsf.2021.101273
Xu, D.-P., Huang, X., Jiang, Q., Li, S.-J., Zheng, H., Qiu, S.-L., et al. (2021). Estimation of the Three-Dimensional In Situ Stress Field Around a Large Deep Underground Cavern Group Near a Valley. J. Rock Mech. Geotech. Eng. 13, 529–544. doi:10.1016/j.jrmge.2020.11.007
Xu, D.-P., Liu, X.-Y., Jiang, Q., Li, S.-J., Zhou, Y.-Y., Qiu, S.-L., et al. (2022). A Local Homogenization Approach for Simulating the Reinforcement Effect of the Fully Grouted Bolt in Deep Underground Openings. Int. J. Min. Sci. Technol. 32, 247–259. doi:10.1016/j.ijmst.2022.01.003
Yang, S.-Q., Su, C.-D., and Xu, W.-Y. (2005). Experimental Investigation on Strength and Deformation Properties of Marble under Conventional Triaxial Compression. Rock Soil Mech. 26, 475–478. doi:10.3969/j.issn.1000-7598.2005.03.028
You, M.-Q., and Hua, A.-Z. (2002). Energy Analysis of Failure Process of Rock Specimens. Chin. J. Rock Mech. Eng. 21, 778–781. doi:10.3321/j.issn:1000-6915.2002.06.004
Yu, Y., Zhao, D.-C., Feng, G.-L., Geng, D.-X., and Guo, H.-S. (2022). Energy Evolution and Acoustic Emission Characteristics of Uniaxial Compression Failure of Anchored Layered Sandstone. Front. Earth Sci. 10, 841598. doi:10.3389/feart.2022.841598
Zhang, J.-c., Jiang, Q., Feng, G.-l., Li, S.-j., Pei, S.-f., and He, B.-g. (2022). Geometrical Characteristic Investigation of the Baihetan Irregular Columnar Jointed Basalt and Corresponding Numerical Reconstruction Method. J. Cent. South Univ. 29 (2), 455–469. doi:10.1007/s11771-022-4940-x
Zhang, W., Feng, X.-T., Xiao, Y.-X., Feng, G.-L., Yao, Z.-B., Hu, L., et al. (2020). A Rockburst Intensity Criterion Based on the Geological Strength Index, Experiences Learned from a Deep Tunnel. Bull. Eng. Geol. Environ. 79, 3585–3603. doi:10.1007/s10064-020-01774-2
Zhao, X.-G., Ma, L.-K., Su, R., and Wang, J. (2014). Fracture Evolution and Strength Characteristics of Beishan Deep Granite under Compression Conditions. Chin. J. Rock Mech. Eng. 33 (11), 3665–3675. doi:10.13722/j.cnki.jrme.2014.s2.034
Keywords: deep-buried granite, deformation and failure characteristics, strength parameters, energy evolution, energy consumption ratio
Citation: Guo G, Xu D, Feng G, Wu X and Zhou Y (2022) Strength and Energy Evolution Law of Deep-Buried Granite Under Triaxial Conditions. Front. Environ. Sci. 10:931757. doi: 10.3389/fenvs.2022.931757
Received: 29 April 2022; Accepted: 07 June 2022;
Published: 13 July 2022.
Edited by:
Zetian Zhang, Sichuan University, ChinaReviewed by:
Fei Tan, China University of Geosciences Wuhan, ChinaCopyright © 2022 Guo, Xu, Feng, Wu and Zhou. This is an open-access article distributed under the terms of the Creative Commons Attribution License (CC BY). The use, distribution or reproduction in other forums is permitted, provided the original author(s) and the copyright owner(s) are credited and that the original publication in this journal is cited, in accordance with accepted academic practice. No use, distribution or reproduction is permitted which does not comply with these terms.
*Correspondence: Dingping Xu, ZHB4dUB3aHJzbS5hYy5jbg==; Guangliang Feng, Z2xmZW5nQHdocnNtLmFjLmNu
Disclaimer: All claims expressed in this article are solely those of the authors and do not necessarily represent those of their affiliated organizations, or those of the publisher, the editors and the reviewers. Any product that may be evaluated in this article or claim that may be made by its manufacturer is not guaranteed or endorsed by the publisher.
Research integrity at Frontiers
Learn more about the work of our research integrity team to safeguard the quality of each article we publish.