 Yuling Wen
 Hongbo Li1,2*
- 1School of Geography, Nanjing Normal University, Nanjing, China
- 2Jiangsu Center for Collaborative Innovation in Geographical Information Resource Development and Application, Nanjing, China
Revealing the spatial and temporal changing characteristics and key factors driving the relationship between the supply of and demand for ecosystem services (SDES) is paramount for the effective management of regional ecosystems and the rational allocation of natural resources. This study calculated the supply of ecosystem services (ESS) in Jiangsu Province, China, in 2000, 2010, and 2020, and quantitatively evaluated the ecosystem service demand (ESD) in those years by considering land development intensity, population density, and economic conditions. The ‘coupling coordination degree and relative development degree’ (CDRD) model is introduced to explore the degree of coordination and change in the relationship of supply versus demand of ecosystem services, and then to reveal the impact of various factors on the spatial differentiation characteristics of the SDES. The results show that: 1) the ESS is high in the Taihu Lake Plain, the southwest of Huaihai area and the eastern coastal zone of Jiangsu Province, yet low in the northwest and middle of Huaihai area, and along the Yangtze River Plain. The overall distribution pattern of ESD and the coordinating degree of the SDES is high in the south and north of Jiangsu Province but low in the province’s middle. 2) The degree of coordination for the SDES increased from 0.371 to 0.415, and the relationship between supply and demand changed from one of moderate imbalance to one of basic coordination. The imbalance of supply and demand is mainly concentrated in the Lixiahe area, coastal plain area, and middle of the Huaihe River Basin, for which the predominant type is a moderate imbalance–demand lag. Meanwhile, the analysis of influencing factors shows that there is an obvious synergistic effect between different factors. The results of this research could contribute to sustainable ecosystem management and decision-making for the construction of ecological civilization in Jiangsu Province.
1 Introduction
Ecosystem services (ES) refer to the environmental conditions and utility for human survival and development as formed and maintained by ecosystems (Daily, 1997). They constitute all the benefits obtained by human beings, directly or indirectly, from an ecosystem (Costanza et al., 1997). Ecosystem service supply (ESS) refers to the ability of an ecosystem to provide specific ecological products and services in a specific time and space (Li et al., 2013). Conversely, ecosystem service demand (ESD) represents the quantity and quality of services required by human society; that is, the quantity and quality of ES consumed or wanted by humans (Wang and Zhou, 2019). The 2005 United Nations Millennium Ecosystem Assessment Report clearly pointed out that human well-being is closely related to changes in natural ES. Therefore, when researching ES, scholars should consider the benefits of “people” from the perspective of human demand while considering its supply capacity (Xie et al., 2008; Ecosystem Assessment, 2005). The research shows that, to a certain extent, the supply–demand relationship of ES can reflect the sustainability of regional social and economic development. The decline in the supply of ecosystem services and the rise in demand in a given region brought about by economic development and urban expansion will exacerbate the conflict between humanity and land in that region (Simonit and Perrings, 2011; Wei et al., 2017). Therefore, using actual human demand and quantitative evaluations of supply capacity and degree of demand for ES, research on the spatio-temporal variability characteristics and driving factors of the supply and demand patterning of ES should be the foundation for formulating a regional sustainable development strategy, which has important academic value and practical significance (Li et al., 2014; Ma et al., 2017; Zhao et al., 2021).
Many scholars have conducted much research investigating the supply and demand of ecosystem services (SDES), involving a variety of ecosystem service types, research perspectives, and scientific methodologies (Burkhard et al., 2012; Geijzendorffer et al., 2015). In the early stage, some studies mostly focused on calculating the quantitative relationship of and differences in temporal and spatial patterns of a single functional demand placed upon the ecosystem; hence, there was little in-depth research on the spatiotemporal distribution of the supply–demand relationship of the overall ES and modeling of that relationship. In recent years, there has been an increasing trend in the literature of paying more attention to the SDES, in which the research content has expanded tremendously and diversified research perspectives and methods are employed (Kroll et al., 2012; Serna-Chavez et al., 2014; Bukvareva et al., 2017; Kramer et al., 2022). When they study the SDES, some scholars usually select one or more ecosystem services to explore the coupling relationship between their supply and demand characteristics. The research methods used for this mainly include index construction and evaluation, index statistics and analysis, scenario formulation and simulation, and spatial mapping and analysis, among others (Shen et al., 2021; Liu et al., 2019; Zhai et al., 2019; Wu et al., 2020). However, now facing the actual needs of economic and social transformation and eco-environmental protection, scholars in China have begun to shift their attention to the geographical research of ecosystem services and their supply and demand dynamics, which entails the spatial mapping of ESS and ESD and the hot-spot analysis of supply and demand patterns based on GIS data (Li, 2014; Zhang and Fu, 2014; Ou et al., 2018; Li and Zhao, 2022; Liu et al., 2022). In summary, scholars have carried out multi-faceted and multi-scale studies of ecosystem services and their supply–demand relationship. Yet, although research on the SDES has made some progress, some limitations persist in the selection of robust indicators and data acquisition, and the quantitative methodology applies to the SDES needs to be optimized further (Wang et al., 2021).
As one of the most economically developed provinces in China, Jiangsu occupies an important national and international strategic position. With the firm promotion of new urbanization and construction and strengthening of its urban–rural integration and development, Jiangsu Province is now facing mounting pressure on its ecological environment. A series of ecological and environmental problems caused by rapid urbanization, such as the overexploitation of land resources, reduction in area of natural and semi-natural ecological land, and declines in ecosystem service capacity, have become serious obstacles to realizing a new era, one that achieves ecological civilization and sustainable development in Jiangsu Province. In this context, and taking the SDES perspective, the current study analyzes the spatial patterns and changing characteristics of ecosystem service supply, demand, and supply–demand coordination in Jiangsu Province since 2000. Going further, it clarifies the differences in ES supply–demand balances in different research units, and reveals the chief factors influencing spatial heterogeneity in ES. The primary objectives of our study were threefold: 1) to distinguish the changing characteristics of the temporal and spatial pattern of the SDES; 2) to reveal the degree of coupling and coordination of the SDES; and 3) to assess the influencing factors most relevant to the spatial differentiation of the SDES. Our research provides a timely reference for promoting effective ecosystem management and the rational allocation of natural resources, as well as crucial support for policy development related to ecosystem services.
2 Materials and methods
2.1 Study area
Jiangsu Province is located in the eastern coastal zone of China (30° 45′N ∼ 35° 20′N, 116° 18′E ∼ 121° 57′E) and has a total area of 107 200 km2. The administrative scope of Jiangsu Province includes 13 prefecture level cities, including those of Nanjing, Wuxi, Xuzhou, Changzhou, Suzhou, Nantong, and Lianyungang. It lies in the transition zone between a subtropical zone and warm temperate zone, and has four distinct seasons and moderate rainfall, with an average annual precipitation of ca. 1000 mm. Plains are the predominant terrain in the study area, but low-elevation mountains and hills are found in the southwest and north of Jiangsu Province. The river water system in the territory is well developed, featuring a dense network of rivers and lakes. Further, the Yangtze River crosses the southern part of the study area, and the Beijing-Hangzhou Grand Canal runs through the south and north of Jiangsu Province, whose entire coastline spans is 954 km. By the end of 2020, the resident population of Jiangsu Province stood at 84.7726 million, and its regional gross domestic product (GDP) was 10271.9 billion yuan. Its per capita regional GDP is above the national level, and Jiangsu’s comprehensive economic competitiveness puts it ahead of other provinces in China. Based on the administrative divisions published in the 2020 Jiangsu Statistical Yearbook, we used county-level administrative regions of Jiangsu Province as the basic research unit. Jiangsu Province has 95 county-level administrative units, consisting of 21 county-level cities, 19 counties, and 55 municipal districts. Because the socio-economic data of some municipal districts could not be obtained, some district level administrative units under the jurisdiction of local cities were merged and integrated, reducing the number of basic research units to 68 (Figure 1).
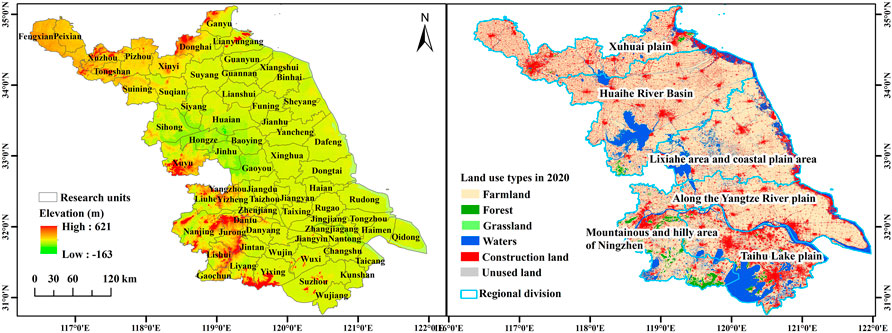
FIGURE 1. Geographical location and land use/land cover map of Jiangsu Province, China.
In the face of rapid socio-economic development and an increasing intensity of territorial space development, the ecological background of Jiangsu Province has been continuously damaged, resulting in the reduction of its ESS. Meanwhile, given the concentration of its population in urban areas, the demand for a good-quality living environment by its residents is increasing daily. Consequently, the supply–demand relationship has become tenser, leading to a series of problems such as supply–demand imbalances in different regions of Jiangsu Province, which seriously affects regional sustainable development and human well-being.
2.2 Data sources and preprocessing
Table 1 shows the sources and descriptions of the land use data as well as the pertinent natural and socioeconomic data. Further, by referring to the land use/land cover classification system of the Chinese Academy of Sciences, we divide land use types into six categories: farmland, forest land, grassland, water area, construction land, and unused land (Xiao et al., 2003; Yang and Huang, 2021).
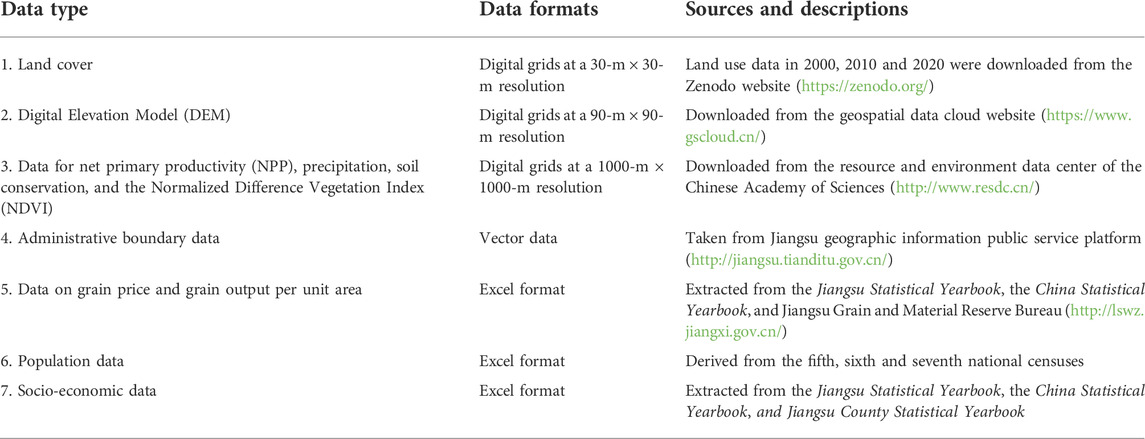
TABLE 1. The data requirements, sources, and descriptions.
2.3 Research methodology
To reveal the spatial and temporal changing characteristics and key factors driving the relationship between the SDES, we performed the following data analysis, for which the main research contents and framework were illustrated in Figure 2.
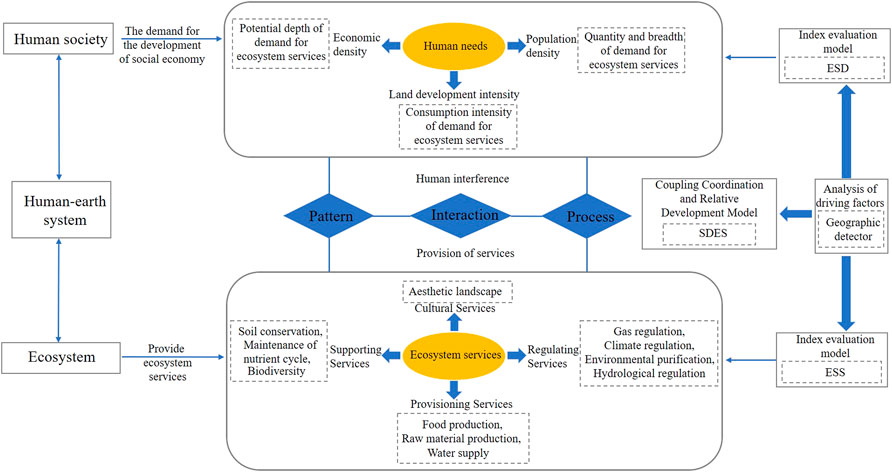
FIGURE 2. The analytical framework of this study.
2.3.1 Calculation of ecosystem service supply
Following the work of Costanza et al. (1997) and Xie et al. (2015), this study divided the supply of ecosystem services into four types: supply services, regulation services, support services, and cultural services. The supply services include food production, raw material production, and water resources supply; regulation services include gas regulation, climate regulation, environmental purification, and hydrological regulation; support services include soil conservation, nutrient cycling, and biodiversity; cultural services refer to the provision of aesthetic landscape services. Ecosystem service value (ESV) conveys the supply capacity of ecosystem services (Xiao et al., 2016). Based on the revised ESV equivalence factor table of Jiangsu Province, this paper calculated the ESV per unit area of each research unit to express its ecosystem service supply capacity (Peng et al., 2017; Wang et al., 2019).
Regarding the calculation process for the equivalent factor table of ESV in Jiangsu Province, it went as follows: the equivalent coefficient in the equivalent table of ESV per unit area in China was corrected by applying the grain yield correction method (Xu et al., 2012). Firstly, according to the data, the average grain output per unit area of Jiangsu Province and the whole country from 2000 to 2020 were 6219.10 kg/hm2 and 5721.88 kg/hm2 respectively; hence, the revised coefficient of equivalence factor for Jiangsu Province is 1.09. Secondly, without human input, the economic value provided by natural ecosystems is one-seventh the economic value of food production services provided by the existing farmland per unit area. Thirdly, given the output and sown area of principal grain crops cultivated in Jiangsu Province from 2000 to 2020, and their purchase price in 2020, the economic value of one equivalent factor is 2238.87 yuan/hm2. Then total ESV and single ecosystem service value (ESVf) were calculated this way:
where ESV is the ecosystem service value (yuan); i is the land use type (i = 1,2,3,..., n), Ai is the area of land type i (hm2); VCi is the value coefficient of an ecosystem service function of land type i (yuan/hm2); ESVf is the value of an ecosystem service function f (yuan); VCfi is the value coefficient of ecosystem service function f of land class i (yuan/hm2).
In addition, we selected NPP data, precipitation data, and soil conservation data to further revise the value equivalence factors of ecosystem services (Liu et al., 2020). The calculation formula inorporating NPP, precipitation and soil conservation regulation factors was as follows:
where Bij denotes the average annual NPP, average annual precipitation, or average annual soil per unit area of an ecosystem in Jiangsu Province, and
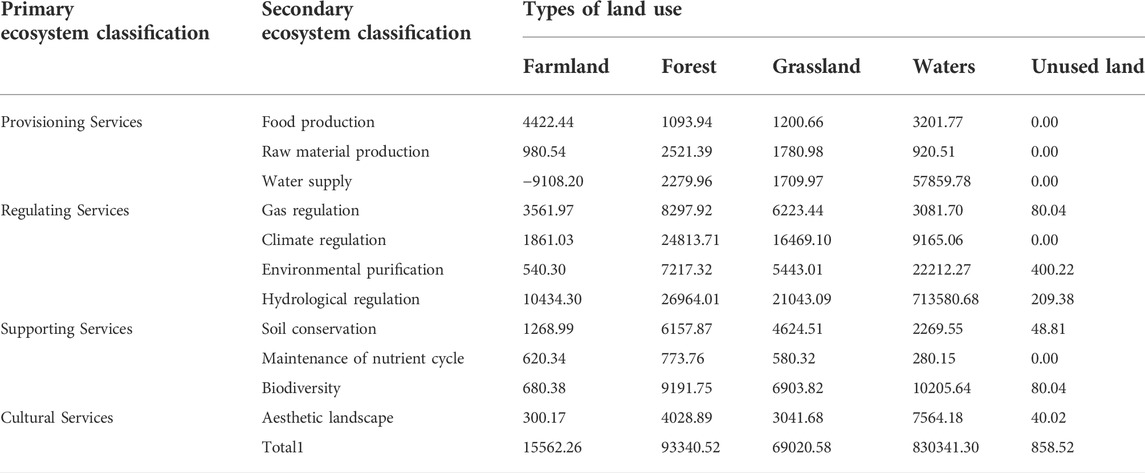
TABLE 2. Values for coefficients of various land ecosystem services in Jiangsu Province, China (yuan/hm2).
2.3.2 Calculation of ecosystem service demand
In this study, ecosystem services demand (ESD) is defined as the human consumption of and preference demand for ecosystem services, that is, the number of ecosystem services consumed or wanted by human society (Villamagna et al., 2013). Therefore, to build the ESD model, we selected three indicators: land development intensity, population density, and economic density. Land development intensity represents the percentage of total area of regional land covered with construction, which directly reflects the degree of human activity and interference; the higher its value, the higher the inferred ESD. Population density can directly reflect the ESD. The greater the population density, the greater is the total ESD. Economic density conveys the degree of development of the region and it can indirectly express the level of human preference for enjoying ecosystem services. The stronger the regional economic strength, the higher are the expected ecosystem services. The indicators of population density and economic density vary greatly among some regions. Therefore, here we used the natural logarithm approach in statistics to mitigate the impact of severe fluctuations for the analysis (Han et al., 2021). The calculation formula was as follows:
where X is the ESD, Qi is land development intensity, and Pi and Ei respectively denote population density (person/km2) and economic density (10,000 yuan/km2).
2.3.3 Coupling coordination and relative development model
The ‘coupling coordination degree’ model can characterize the degree of coordinated development between the actual supply of ecosystem services and human demand, and help to gauge whether that relationship is harmonious and consistent (Wang and Tang, 2018). In order to eliminate the dimensional impact of supply and demand, a range standardization was first applied to the original supply and demand data, after which we analyze the coupling and coordination of the SDES. The calculations went as follows:
where X is the supply of or demand for ecosystem services after the range standardization; xi is the supply or demand of the ith research unit; xmax is the maximum value of the whole province and xmin is the minimum value of the whole province; C is the coupling degree; XS denotes the supply; XD denotes the demand; T is the comprehensive coordination index of supply and demand; α and β are undetermined coefficients. Because the supply and demand of ecosystem services are equally important, we set α = β = 0.5. The D indicates the degree of supply–demand coupling coordination; where D

TABLE 3. Types and division criteria of coordinated development of supply and demand coupling of ecosystem services.
Although the coupling coordination model can reliably capture the internal relationship of the SDES, it cannot reflect the actual gap between supply and demand for a given ES. Therefore, according to Han et al. (2020), this paper introduces the relative development model to measure whether the supply level of ecosystem services is ahead or behind their demand level (Eq. (9)).
where M is the relative development degree; S1 and S2 are respectively the supply and demand of ecosystem services after their range standardization. In the case of M < 0.5, the supply–demand relationship is of the supply lag type; when 0.5 ≤ M ≤ 1.5, this indicates a net balance in supply and demand; when M > 1.5, the supply–demand relationship is of the demand lag type.
2.3.4 Geodetector analysis
Geodetector is a statistical analytical method to diagnose the spatial heterogeneity of geographic elements and reveal the driving forces behind it. It can effectively and independently detect the spatial distribution consistency and causality of two variables, and it includes four components: risk detection, factor detection, ecology detection, and interactive detection (Wang et al., 2010; Wang and Xu, 2017). Its core idea is this: the relevant characteristic factors affecting the supply and demand pattern of ecosystem services are heterogeneous in their spatial distribution. If the intensity of a factor is significantly consistent or similar with the spatial distribution of a particular supply and demand pattern, it may be inferred this characteristic factor plays a certain impact on it. The detailed formula is as follows (Eq. (10)):
where n is the number of geographical units in the study area;
2.3.5 Selection of driving factors
Ecosystem services are under the comprehensive influence of internal and external conditions, including the effects of other ecosystem changes (Fang et al., 2021). According to the relevant literature and actual social-ecological environment background of the study area, we found that the ESS and SDES in Jiangsu Province are primarily affected by natural environment and socio-economic factors, while ESD was mainly impacted by socio-economic factors (Li and Zhang, 2017; Geng et al., 2020; Jing et al., 2022; Zhang et al., 2022). Accordingly, six natural environmental factors—average annual temperature, annual rainfall, elevation, slope, NDVI, and water network density—as well as seven socio-economic factors—economic strength, industrial structure, openness to the outside world, population attractiveness, facility supply, consumption level, and road density—were selected in this paper to simultaneously detect their effects on the spatial differentiation of the ESS and SDES (Dai et al., 2020; Dai et al., 2021). In terms of natural environmental factors, they are related to climate, topography, vegetation and water systems, which directly determine the ESS and indirectly determine the SDES. From the perspective of socio-economic factors, economic strength, industrial structure and openness to the outside world may be used to assess regional economic development. Population attractiveness, facility supply and consumption level can convey the status of human demand for ES. Road density can reliably characterize the intensity of human exploitation of land: the higher the road density, the greater the demand by people for ecosystem services in the surrounding environment (Dai et al., 2022). Further details can be found in Table 4.
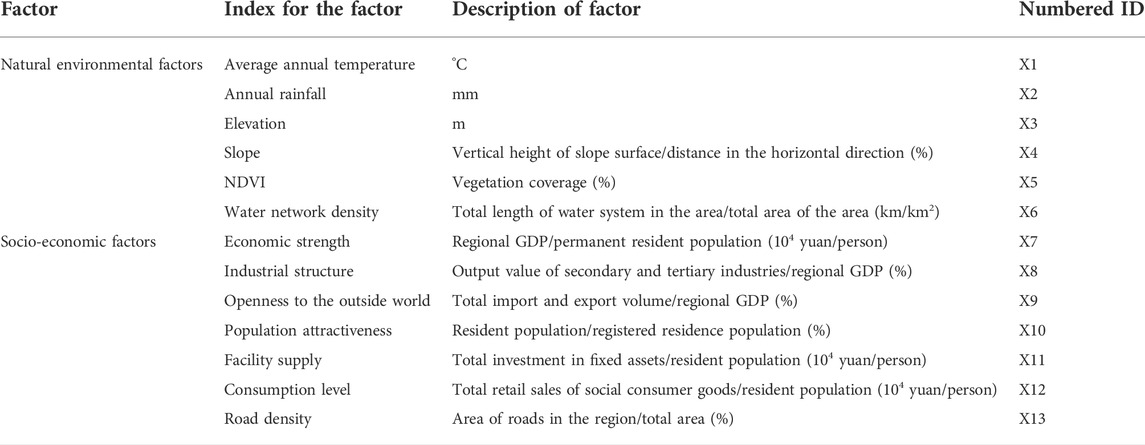
TABLE 4. Evaluation index of influencing factors and their definitions.
3 Results and analysis
3.1 Ecosystem service supply: Pattern and change
From the provincial level (Table 5), the ESV of Jiangsu Province in 2000, 2010, and 2020 was respectively 1213.008 billion yuan, 1270.742 billion yuan, and 1150.365 billion yuan, showing a trend of first rising and then falling, with a net negative change of 5.16% from 2000 to 2020. The change of ESV per unit area is consistent with the total ESV, suggesting that among the 3 years, the supply capacity of ecosystem services was strongest in 2010 and weakest in 2020.
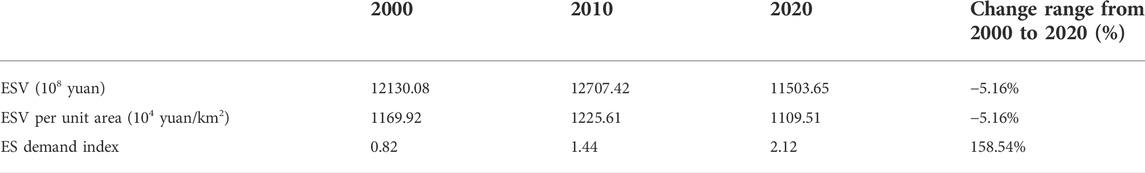
TABLE 5. Changes to the ecosystem service value and demand index in Jiangsu Province, from 2000 to 2020.
According to the natural breakpoint method (Wang et al., 2021; Huang et al., 2018), we divided the ESV per unit area into five levels (Figure 3). Evidently, the high value of ESS over the years is mainly concentrated in the Taihu Plain, in the southwestern of the Huaihai area, and in the eastern coastal zone. Among them, the ESS in Suzhou is the highest, exceeding 46.27 million yuan/km2 over the years; this was followed by Hongze District, where the ESS has reached more than 38.02 million yuan/km2 over the years. The low value of ESS is mainly distributed in the northwest and middle of Huaihai area and the plain area along the Yangtze River. Among these, the ESS of Fengxian County is the lowest, not exceeding 1.93 million yuan/km2 over the years; likewise, the ESS is also low in Peixian County, Lianshui County, and Hai’an City, at less than 2.24 million yuan/km2.
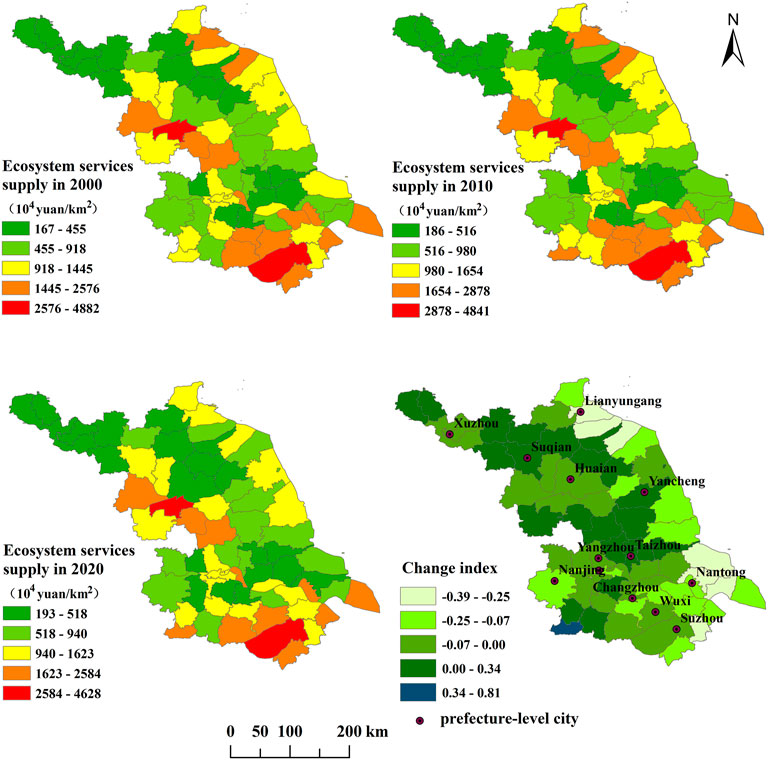
FIGURE 3. Distribution pattern of and changes to the ecosystem service supply in Jiangsu Province from 2000 to 2020.
By calculating the change index of ESS in Jiangsu Province from 2000 to 2020, we could analyze the spatial distribution characteristics of their increases and decreases in ESS. The results show that the ESS in most areas is weakening, and the proportion of research units with reduced supply is 66.18%, these being mainly located in the eastern coastal zone of Jiangsu Province, Southern Jiangsu, and the surrounding areas of Hongze Lake as well as the urban area of Xuzhou. At the same time, there are 23 research units in which the ESS has increased over time, and these are mainly concentrated in the Xuhuai Plain in the north of Jiangsu Province, Lixiahe Plain in the province’s middle, and in the southern part of the Ningzhen mountainous and hilly area.
3.2 Ecosystem service demand: Pattern and change
The demand indexes of ecosystem services in Jiangsu Province in 2000, 2010, and 2020 were 0.82, 1.44, and 2.12, respectively, indicating that the ESD in Jiangsu Province rose from 2000 to 2020 (Table 5). Spatially, the overall ESD over time shows a distribution pattern of being high in the north and south whereas it was low in the middle of the province, with obvious signs of clustering (Figure 4). That is, high-value areas for the ESD index are mainly distributed in southern Jiangsu, along the Yangtze River and Xuhuai Plain in Northern Jiangsu. Over time, Xuzhou had the highest level of ESD, followed by Changzhou, Nantong, Jiangyin, Kunshan, Wuxi, Zhenjiang, Taizhou, Zhangjiagang, and Nanjing. The low-value areas for the ESD index in Jiangsu Province are mainly concentrated in the Huaihe River Basin area, the Lixiahe Plain and coastal plain area, southern part of the Ningzhen mountainous and hilly area, and the eastern part of the Yangtze River Plain. Of them, Hongze District and Jinhu County are distinguished as having the lowest levels of ESD.
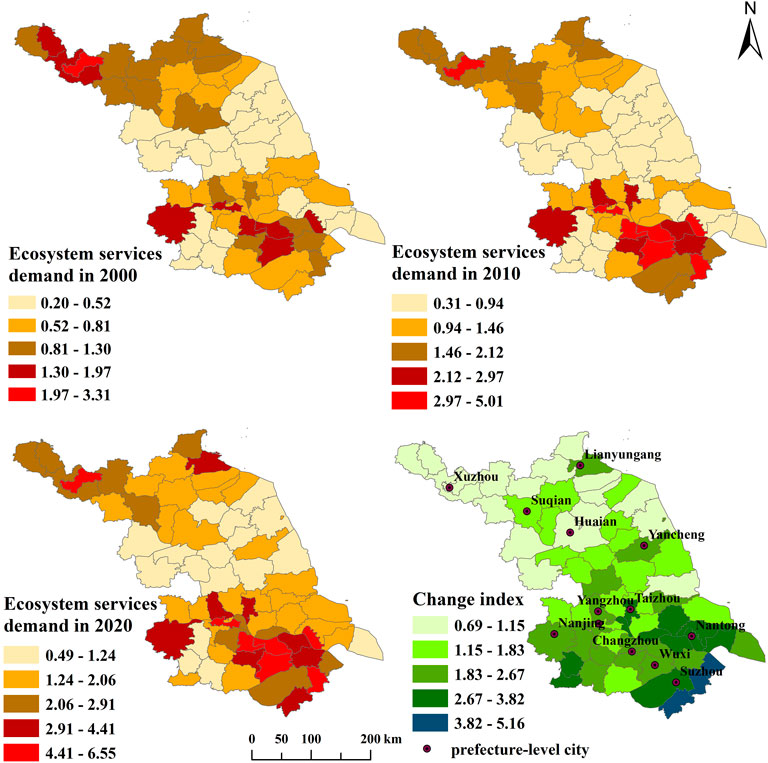
FIGURE 4. Distribution pattern and changes in ecosystem service demand in Jiangsu Province from 2000 to 2020.
According to the change index of ESD, the ESD in different regions has increased by differing magnitudes in the recent 20 years, and the overall growth pattern is best described as a gradient weakening from south to north. Those areas with the most pronounced increase in ESD are Kunshan City, Wujiang District, and Taicang City in southern Jiangsu, where the corresponding change indexes are 5.16, 4.63 and 4.29 respectively. The areas with small increases in ESD are mainly distributed in Northern Jiangsu, among which Guanyun County, Donghai County, and Sihong County have the lowest value for the demand change index, implying that the ESD in these areas has been relatively stable over the recent 20 years with a slight growth trend discernible.
3.3 Analysis of the coupling and coordination between the supply and demand of ecosystem services
From 2000 to 2020, the degree of coupling and coordination of the SDES in Jiangsu Province increased from 0.371 to 0.415, and the overall relationship of the SDES changed from one of moderate imbalance to one of basic coordination. Among the 68 research units (Figure 5), the regions with moderate imbalance and/or basic coordination in the coupling and coordination relationship between supply and demand accounted for the majority. Of these, in 2000, five research units had a serious imbalance between supply and demand, 35 units had a moderate imbalance, 24 units had a basic coordination, and another four had a moderate coordination. By 2020, the number of research units with a severe imbalance decreased to 4, the number having a moderate imbalance decreased to 33, the number featuring a basic coordination decreased to 19, the number distinguished by a moderate coordination increased to 11, and 1 research unit showed high coordination. Considered spatially, the degree of coupling and coordination of the SDES over time is generally high in the north and south of Jiangsu Province and low in its middle. The areas with an imbalance between supply and demand are mainly concentrated and distributed in Lixiahe and the coastal plain area, the middle of Huaihe River Basin area, in the west of the Xuhuai Plain area, and scattered along the borders of the Yangtze River, Taihu Plain area, and Ningzhen hilly area. The areas of supply–demand coordination is interspersed in the north of Jiangsu Province but concentrated in the plain area of Taihu Lake. The degree of supply–demand coordination in the surrounding areas of Taihu Lake and some areas along the Yangtze River is high, best characterized by moderate coordination.
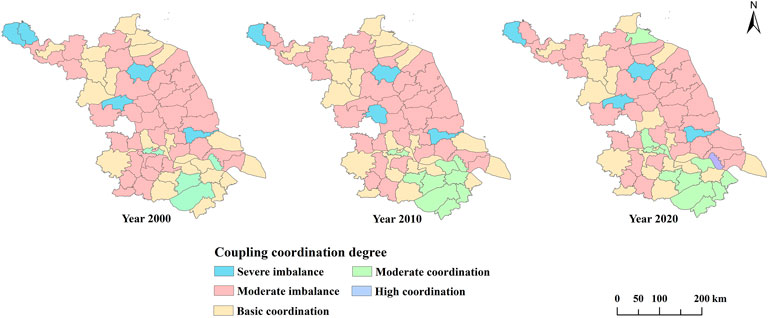
FIGURE 5. Distribution patterns in the degree of supply–demand coupling coordination of ecosystem services in Jiangsu Province from 2000 to 2020.
Based on the above analysis of coupling coordination degree, we then conducted an analysis that also considered the relative development degree (Figure 6). These results uncovered those areas with a serious imbalance of the SDES over the years being mainly located in Feng County, Lianshui County, Hongze District, and Hai’an City. Among them, serious imbalance–supply lag characterized Feng County, Lianshui County, and Hai’an city. Their terrain is flat, the land use type is mainly cultivated land, and certain land use types are lacking, such as water area and forest land that have a high ecosystem service capacity, which renders the supply of ecosystem services far lower than their demand. In contrast, Hongze District is of a different type, the serious imbalance–demand lag. Situated adjacent to Hongze Lake in the West and Baima Lake in the province’s east, its ecological base is quite good, the level of economic development is low, and there is little interference from human activities; hence, the demand for ecosystem services is far lower than their supply. In the moderate imbalance category, over the years, the moderate imbalance–supply lag area is found mainly distributed in the middle of the Huaihe River Basin, the west of Xuhuai Plain and in areas along the river. The level of ecological resources in such places is at a disadvantage vis-à-vis the interference level from human activities, so the supply of ecosystem services lags behind their demand. Meanwhile, having a moderate imbalance–demand lag areas are chiefly concentrated in Lixiahe and coastal plain areas, where one finds a dense river network, many lakes, and an excellent ecological background, in addition to prominent ecological functions and a national ecological reserve. Therefore, the value of ecosystem services provided by Xuyi County, Jinhu County, Gaoyou City, Sheyang County, and Dafeng District is high, and the supply level of their ecosystem services surpasses their level of demand. In the basic coordination category, those belonging to the basic coordination–supply lag type are mainly the municipal districts of various prefecture level cities. The supply and demand levels of ecosystem services in such areas are high, but supply lags behind demand due to the influence of regional economic development and urban expansion. The supply–demand relationship of ecosystem services in Suzhou-Wuxi-Changzhou area has changed from one of basic coordination in 2000 to one of moderate coordination in 2020, and the coordination relationship is gradually improving. This harbors many rivers and lakes, good hydrothermal conditions and is rich in ecological resources, and therefore the supply of ecosystem services is sufficient. In parallel, the rapid economic development and high population density in this area has led to a very high demand for ecosystem services under the strong interference of human activities. But because of the strong carrying capacity of resources and environment there, a good coordinated relationship between supply and demand still prevails. The supply–demand relationship of ES in the Nantong urban area has changed from medium coordination to high coordination. Over time, the supply and demand levels of ES there have ranked first in the province, though the supply capacity and demand intensity are both increasing, and their degree of coordination is continually improving.
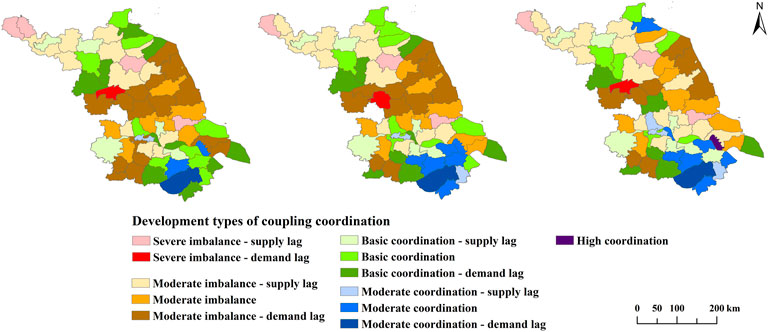
FIGURE 6. Types of coordinated development in the supply and demand coupling of ecosystem services in Jiangsu Province.
3.4 Analysis of factors driving the supply and demand pattern of ecosystem services
To the 68 research units, we applied the ‘factor detector’ and ‘interaction detector’ functions of the geodetector model to quantitatively analyze the contribution of driving factors and their interactions, and thereby explore the factors responsible for the spatial differentiation in ecosystem service supply, demand and supply–demand coordination in Jiangsu Province.
3.4.1 Factor detection analysis
From the perspective of supply capacity (Table 6), the factors can be sorted according to their q statistic as follows: X5 (NDVI) > X6 (water network density) > X1 (average annual temperature) > X13 (road density) > X9 (openness to the outside world) > X2 (annual rainfall) > X3 (elevation) > X12 (consumption level) > X7 (economic strength) > X8 (industrial structure) > X10 (population attractiveness) > X11 (facility supply) > X4 (slope). Among them, we find that NDVI, water network density, average annual temperature, and annual rainfall are each significant at the alpha level of 10%, suggesting that these four factors have the highest explanatory contribution. This shows that the driving effect of natural environmental factors upon the supply capacity of ecosystem services is significantly greater than that of socio-economic factors. Therefore, in terms of future ecosystem service management aims and practices, we should strengthen both ecosystem protection and restoration, and implement projects such as forest quality improvement and watershed water ecological health protection, to ensure that ecosystems retain their ability to provide long-term sustainable services.
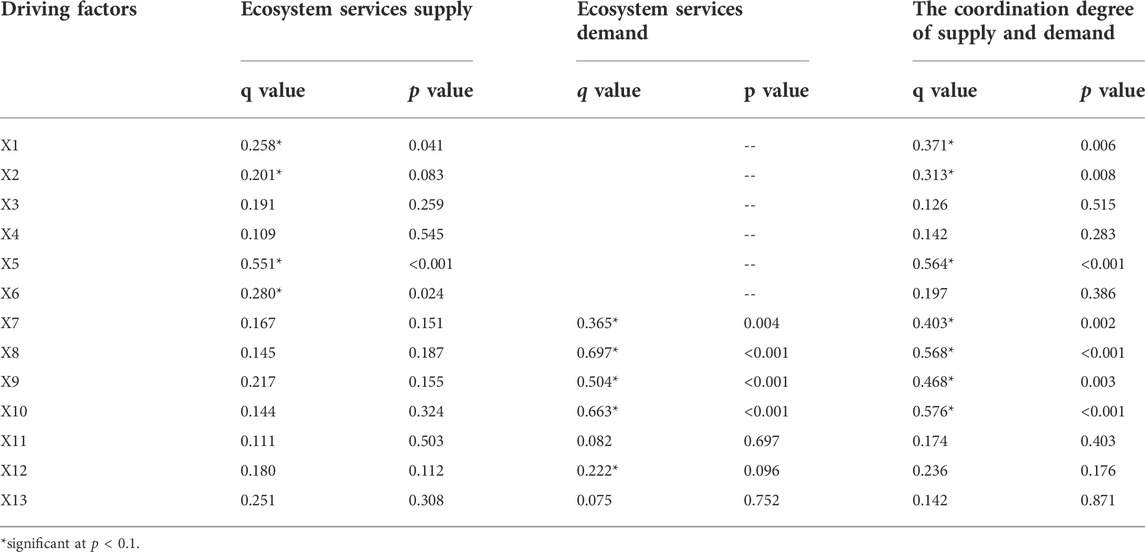
TABLE 6. Detection results of driving factors of ecosystem service supply and demand in Jiangsu Province.
Regarding the demand intensity, the factors ranked by their q statistic are as follows: X8 (industrial structure) > X10 (population attractiveness) > X9 (openness to the outside world) > X7 (economic strength) > X12 (consumption level) > X11 (facility supply) > X13 (road density). Of these, the explanatory power of industrial structure, population attractiveness, and openness to the outside world for the demand intensity of ES are each more 50%, with all passing the significance test at p < 0.001. Therefore, to avoid the excessive consumption of ecosystem services, it is necessary to properly adjust the economic and industrial structure of some regions and guide the rational distribution and flows of their populations, so as to achieve a balance between the supply and demand of ecosystem services.
For the coordination degree of the SDES, evidently it was most impacted by X10 (population attractiveness), with a q value of 0.576. It was followed by X8 (industrial structure) > X5 (NDVI) > X9 (openness to the outside world) > X7 (economic strength) > X1 (annual average temperature) > X2 (annual rainfall). These indicators all passed the significance test at p < 0.01, which further shows that the spatial differentiation of the coordination degree of the SDES is affected by both natural and socio-economic factors; in general, the latter’s explanatory power is greater than the former’s. Looking ahead, we should strengthen ecosystem management and the optimal allocation of resources, and strive to alleviate the imbalance between the supply and demand of ecosystem services, to ensure both regional ecological security and sustainable socio-economic development.
3.4.2 Interactive detection analysis
The results of interaction detection analysis (Figure 7) revealed that the explanatory power of the interaction between the drivers of the spatial differentiation in the supply, demand, and supply–demand coordination of ES exceeds that of any single factor. Hence, the interaction between any two driving factors will always increase the explanatory power of the spatial differentiation in the supply–demand relationship. The interaction types among the driving factors consist of a nonlinear enhancement type and two-factor enhancement type, of which the former predominates in Jiangsu Province.

FIGURE 7. Interactions between the driving factors of the supply–demand relationship of ecosystem services.
Among the interactive detection results for supply capacity, the interactions between NDVI and other factors had the strongest impact on its spatial differentiation. Among them, the explanatory power of NDVI interacting with elevation, slope, annual rainfall, or annual average temperature is highest, whose q values are 0.846, 0.841, 0.827, and 0.811, respectively. Next, we found strong effects of interactions on the spatial differentiation of supply capacity came from annual temperature∩slope (q value = 0.754), annual rainfall∩elevation (q value = 0.773), water network density∩population attractiveness (q value = 0.797), and water network density∩economic strength (q value = 0.794).
From the perspective of demand intensity, the interactions between population attractiveness, industrial structure, openness to the outside world and other factors all strongly impacted the spatial differentiation in demand intensity. Among them, population attractiveness∩facility supply has the greatest impact on the spatial differentiation in demand intensity, given its q value of 0.863. It is followed by industrial structure∩road density (q value = 0.841), industrial structure∩economic strength (q value = 0.810), and industrial structure∩openness to the outside world (q value = 0.791).
For the spatial differentiation in the degree of supply–demand coordination, it was most impact by the interactions between NDVI and other factors. Among these, the explanatory power of NDVI’s interaction with elevation, annual rainfall, and industrial structure are each high, with respective q values = 0.873, 0.861, and 0.830. The interaction values between industrial structure and other factors are also large and noteworthy: the q value of industrial structure∩facility supply is 0.785 while that of industrial structure∩water network density is 0.774. The interaction intensity between openness to the outside world, population attractiveness, and other factors are also considerable, in that their explanatory power reaches more than 60%.
Overall, the NDVI and water network density exert a strong influence on the spatial differentiation in ecosystem service supply capacity. The interaction between population attractiveness and facility supply greatly impacts the spatial differentiation in demand intensity. The degree of supply–demand coordination is most significantly affected by the interaction between NDVI, industrial structure, openness to the outside world, population attractiveness, and other factors. Altogether then, the above results show that regional differences in the intensity of human activities underpin spatial heterogeneity in the relationship between supply and demand of ecosystem services. Population aggregation and the expansion of artificial surfaces not only occupy and destroy ecological land, but also lead to an imbalance between supply and demand, namely in the form of high demand for and low supply of ES. Therefore, in the future, we should consider the action characteristics of different driving factors and their interactive enhancement effects, and find reasonable way to develop and utilize precious water and soil resources. We should avoid undue interference from human activities and the joint adverse action of natural and socio-economic factors, to lessen the pressure on balancing the supply and demand of regional ecosystems.
4 Discussion
4.1 Comparison with other scholarship on supply of and demand for ecosystem services
As both theoretical and methodological research into ESS and ESD continues to expand and deepen, related practical and applied investigations are also being gradually carried out more often. Burkhard et al. (2012) took central Germany as an example, and based on the ecological integrity of biophysical landscape units and the matrix coupling of ecosystem service supply and demand, they used land cover data and socio-economic data assessment and assignment method to unify the ecosystem service supply and demand values into a single unit for quantitative expression. The supply and demand capacities of ecosystem services for different land types were tabulated, and the spatial distribution of the supply and demand balance was also mapped. Kroll et al. (2012) analyzed the supply and demand characteristics of energy supply, food supply, and water supply services and their spatial distribution patterns along an urban-rural gradient in eastern Germany and proposed a quantitative calculation and spatial visualization method, which is of great significance for coordinating a sustainable regional balance. Based on the spatial differences in ESS and ESD and their balance, some scholars have distinguished different types and levels of control areas and proposed differentiated control strategies, in order to provide practical guidance for regional ecosystem management and territorial space optimization (Li et al., 2020; Sun et al., 2022). In addition, other scholars have also applied the relationship between ESS and ESD to identify source sites or corridors for construction for use in an ecological network, so as to achieve the latter’s spatial optimization (Zhang et al., 2019; Rong et al., 2020). Our study assesses the ESS based on the equivalent factor method, measures the ESD using a comprehensive multi-indicator model, reveals the changes in the coordination degree of the SDES, and analyzes the factors influencing their spatial differentiation characteristics. The relationship between supply and demand of ESS in Jiangsu Province is similar to that of the Yangtze River Delta region, Beijing–Tianjin–Hebei region, and Xiamen–Zhangzhou–Quan region (Wu et al., 2018; Li et al., 2020; Hu and Chen, 2021). On the one hand, the ESD is robust in areas with a high level of economic development and high population density; on the other hand, the ESS is weakening in those areas with an increasing intensity of disturbance from human activities. The geodetector-based analysis of drivers showed that natural environmental factors have the greatest influence on ESS, while socio-economic factors most influence ESD and the coordination of SDES, consistent with the findings of Zhao et al. (2021).
4.2 Factors influencing the ecosystem services, ecosystem service demand and coordination of supply of and demand for ecosystem services
As a bridge between natural ecosystems and human society, the SDES reflects the complex dynamic linkages between ecosystems and human society (Sun et al., 2019). Changes in ESS, ESD, and the coordination of SDES are jointly influenced by many factors, such as the natural environment, social economy, and so on (Tang et al., 2020). In this respect, we used the analytical method of geodetector to reveal the reasons behind the spatial variation of ESS, ESD and the coordination of SDES in the study area in 2020. We explored correlations between the three aspects of ESS, ESD and the coordination of SDES as well as their influencing factors, which to some extent reflected the internal mechanisms and driving mechanisms of the supply–demand balance of ecosystem services. For the natural environmental factors, we found that their variability over 20 years was not significant. For example, the variability of factors including average annual temperature, elevation, and water network density is small over time. Therefore, our study did not consider the temporal variability characteristics of the factors influencing ecosystem services, but used the driving factors of 2020 to analyze the spatial variability of ESS, ESD, and the coordination of SDES in 2020 (Zhang et al., 2021). Nor did we consider policy factors due to restrictions in accessing the required data. Further, it is imperative to determine the combined mechanisms of various types of influencing factors in different regions and the levels of differing factors, this represent an important research avenue in the future.
4.3 Limitation and further research
This paper only used three indicators, namely population density, economic density, and land development intensity, to characterize the ESD, which may not be able to comprehensively measure the true demand level. In the next research stage, we will consider using scenario formulation and simulation to build a more comprehensive measurement model of ESD. From the spatial scale of this study, we should strengthen research on the supply–demand relationship of ES assessed at different spatial scales. We need to gradually establish a regional and hierarchical governance mechanism for the SDES, and coordinate the supply and demand relationship at different levels in different regions, so as to alleviate the supply/demand imbalances. In tandem, we should seek to ensure the scientificity, continuity, and consistency of supply and demand governance policies of ES at different levels, to thereby maximize the benefits of ES for human society.
5 Conclusion
Based on the county-level administrative divisions of Jiangsu Province, and taking its 68 geographical units as the study object, this paper used the revised equivalent factor table to calculate the ESS in 2000, 2010, and 2020. In parallel, the ESD was quantitatively evaluated in combination with the intensity of land development, population density, and economic density. Supported by the coupling coordination degree and relative development degree model, we explored the coordination degree of and change in the supply–demand relationship of ecosystem services, and analyzed the driving factors of the spatial differentiation of that relationship by using geodetector. The main conclusions drawn are as follows:
1) Since 2000, the overall ESS in Jiangsu Province has shown a spatial distribution pattern of being high in the Taihu Lake Plain area, the southwest of Huaihai area, and the eastern coastal zone of Jiangsu Province, yet low in the northwest and middle of Huaihai area, and along the Yangtze River Plain. 2) The ESD is generally high in the north and south of Jiangsu Province and low in its middle. Furthermore, The ESD in each research unit is increasing albeit not equally so (differing range of values), and overall, the key feature of this trend is that it gradually weakens going from the south to north of Jiangsu Province. 3) The degree of supply–demand coupling and coordination of ES is generally high in both the north and south, but low in the middle of the province. In the recent 20 years, the relationship between supply and demand has improved, and the type of supply–demand coupling and coordination has changed from one of moderate imbalance to one of basic coordination. 4) Through the factor detection and interactive detection analysis of geodetector, we find that the impact of various factors on the supply, demand and coordination of supply and demand of ES are not independent, but rather arise from the synergy of multiple factors. The main factors influencing the ESS capacity are the NDVI and water network density, while those affecting the ESD are industrial structure, population attractiveness, and openness to the outside world. Meanwhile, the main contributing factors to the coordination of the SDES are population attractiveness, industrial structure, and the NDVI.
Data availability statement
The original contributions presented in the study are included in the article/Supplementary Material, further inquiries can be directed to the corresponding author.
Author contributions
Conceptualization, YW; formal analysis, YW and HL; funding acquisition, XZ; investigation, YW and HL; methodology, YW; software, YW; supervision, HL, XZ and TL; validation, YW and XZ; writing—original draft, YW; writing—review & editing, HL and TL. All authors have read and agreed to the published version of the manuscript.
Funding
This research was funded by the Later Stage of the National Social Science Foundation of China (grant number 21FSHB014); the Foundation of Humanity and Social Sciences of the Ministry of Education of China (grant number 20YJCZH069); the National Natural Science Foundation of China (grant number 42071224); and the Jiangsu Graduate Scientific Research Innovation Program (grant number KYCX22_1506).
Conflict of interest
The authors declare that the research was conducted in the absence of any commercial or financial relationships that could be construed as a potential conflict of interest.
Publisher’s note
All claims expressed in this article are solely those of the authors and do not necessarily represent those of their affiliated organizations, or those of the publisher, the editors and the reviewers. Any product that may be evaluated in this article, or claim that may be made by its manufacturer, is not guaranteed or endorsed by the publisher.
References
Bukvareva, E., Zamolodchikov, D., Kraev, G., Grunewald, K., and Narykov, A. (2017). Supplied, demanded and consumed ecosystem services: prospects for national assessment in Russia. Ecol. Indic. 78, 351–360. doi:10.1016/j.ecolind.2017.03.034
Burkhard, B., Kroll, F., Nedkov, S., and Muller, F. (2012). Mapping ecosystem service supply, demand and budgets. Ecol. Indic. 21, 17–29. doi:10.1016/j.ecolind.2011.06.019
Costanza, R., d’Arge, R., de Groot, R., Farber, S., Grasso, M., Hannon, B., et al. (1997). The value of the world’s ecosystem services and natural capital. Nature 387, 253–260. doi:10.1038/387253a0
Dai, X., Wang, L., Huang, C., Fang, L., and Wang, S. (2020). Spatio-temporal variations of ecosystem services in the urban agglomerations in the middle reaches of the yangtze river, China. Ecol. Indic. 115, 106394. doi:10.1016/j.ecolind.2020.106394
Dai, X., Wang, L., Tao, M., Huang, C., Sun, J., and Wang, S. (2021). Assessing the ecological balance between supply and demand of blue-green infrastructure. J. Environ. Manag. 288, 112454. doi:10.1016/j.jenvman.2021.112454
Dai, X., Wang, L., Yang, L., Wang, S., and Li, Y. (2022). Predicting the supply–demand of ecosystem services in the yangtze river middle reaches urban agglomeration. Prog. Phys. Geogr. Earth Environ. 46, 530–546. doi:10.1177/03091333221074490
Daily, G. C. (1997). Nature’s service: Societal dependence on natural ecosystems. 4th ed. Washington DC: Island Press, 49.
Ecosystem Assessment, M. (2005). Ecosystems and human well-being: Biodiversity synthesis. Washington, D C: Island Press.
Fang, L., Wang, L., Chen, W., Sun, J., Cao, Q., Wang, S., et al. (2021). Identifying the impacts of natural and human factors on ecosystem service in the Yangtze and Yellow River Basins. J. Clean. Prod. 314, 127995. doi:10.1016/j.jclepro.2021.127995
Geijzendorffer, I. R., Martin-Lopez, B., Roche, P. K., et al. (2015). Improving the identification of mismatches in ecosystem services assessments. Ecol. Indic. 52, 320–331. doi:10.1016/j.ecolind.2014.12.016
Geng, T., Chen, H., Zhang, H., Qin-qin, S., and Di, L. (2020). Spatiotemporal evolution of land ecosystem service value and its influencing factors in Shaanxi province based on GWR. J. Nat. Resour. 35, 1714–1727. doi:10.31497/zrzyxb.20200715
Han, Z., Liu, C., Yan, X., et al. (2021). Coupling coordination and matches in ecosystem services supply-demand for ecological zoning management: A case study of dalian. Acta Ecol. Sin. 41, 9064–9075.
Han, Z., Zhao, Y., Yan, X., et al. (2020). Coupling coordination mechanism and spatial-temporal relationship between gross ecosystem product and regional economy: a case study of dalian. Econ. Geogr. 40, 1
Hu, Q., and Chen, S. (2021). Optimizing the ecological networks based on the supply and demand of ecosystem services in xiamen-zhangzhou-quanzhou region. J. Nat. Resour. 36 (2), 342–355. doi:10.31497/zrzyxb.20210206
Jing, H., Liu, Y., He, P., et al. (2022). Spatial heterogeneity of ecosystem services and it’s influencing factors in typical areas of the qinghai-tibet plateau: A case study of nagqu city. Acta Ecol. Sin. 42 (7), 265
Kramer, K., Bouriaud, L., Feindt, P. H., van Wassenaer, L., Glanemann, N., Hanewinkel, M., et al. (2022). Roadmap to develop a stress test for forest ecosystem services supply. One Earth 5, 25–34. doi:10.1016/j.oneear.2021.12.009
Kroll, F., Müller, F., Haase, D., and Fohrer, N. (2012). Rural–urban gradient analysis of ecosystem services supply and demand dynamics. Land Use Policy 29, 521–535. doi:10.1016/j.landusepol.2011.07.008
Li, C., and Zhao, J. (2022). Research on spatiotemporal pattern and influencing factors of supply-demand matching in the Yangtze River Delta urban agglomeration.” in Ecological economy. http://kns.cnki.net/kcms/detail/53.1193.F.20220104.1629.002.html.
Li, R., Li, Y., and Hu, H. (2020). Support of ecosystem services for spatial planning theories and practices. Acta Geogr. Sin. 75 (11), 2417–2430.
Li, S., Wang, Y., Zhu, W., et al. (2014). Research framework of ecosystem services geography from spatial and regional perspectives. Acta Geogr. Sin. 69, 1628.doi:10.11821/dlxb201411004
Li, S., Zhang, C., Liu, J., et al. (2013). The tradeoffs and synergies of ecosystem services: Research progress, development trend, and themes of geography. Geogr. Res. 32, 1379–1390.
Li, Z., and Zhang, X. (2017). Spatial differentiation and influencing factors of eco-economic harmony at county level in Jiangsu province. Res. Soil Water Conservation 24, 209–215.
Liu, H., Gao, J., Liu, X., et al. (2020). Monitoring and assessment of the ecosystem services value in the national key ecological function zones. Acta Ecol. Sin. 40, 1865.doi:10.5846/stxb201903010382
Liu, L., Liu, C., Wang, C., et al. (2019). Supply and demand matching of ecosystem services in loess hilly region: A case study of lanzhou. Acta Geogr. Sin. 74, 1921
Liu, Y., Yang, Z., Xu, G., et al. (2022). Correlation between ecosystem services value and human activity intensity based on the four-quadrant model: a case study in the international tourism and culture demonstration area, the south anhui province. Acta Ecol. Sin. 42, 1.doi:10.5846/stxb202103030579
Lv, C., Lan, X., and Sun, W. (2017). A study on the relationship between natural factors and population distribution in beijing using geographical detector. J. Nat. Resour. 32, 1385. doi:10.11849/zrzyxb.20160707
Ma, L., Liu, H., Peng, J., et al. (2017). A review of ecosystem services supply and demand. Acta Geogr. Sin. 72, 127
Ou, W., Wang, H., and Tao, Y. (2018). A land cover-based assessment of ecosystem services supply and demand dynamics in the Yangtze River Delta region. Acta Ecol. Sin. 38, 6337
Peng, J., Yang, Y., Xie, P., et al. (2017). Zoning for the construction of green space ecological networks in Guangdong Province based on the supply and demand of ecosystem services. Acta Ecol. Sin. 37, 4562. doi:10.5846/stxb201601020007
Rong, Y., Yan, Y., Wang, C., et al. (2020). Construction and optimization of ecological network in Xiong’an New Area based on the supply and demand of ecosystem services. Acta Ecol. Sin. 40 (20), 7197. doi:10.5846/stxb202001020016
Serna-Chavez, H. M., Schulp, C. J. E., Van Bodegom, P. M., Bouten, W., Verburg, P., and Davidson, M. (2014). A quantitative framework for assessing spatial flows of ecosystem services. Ecol. Indic. 39, 24–33. doi:10.1016/j.ecolind.2013.11.024
Shen, J., Li, S., Liang, Z., Wang, Y. y., and Sun, F. y. (2021). Research progress and prospect for the relationships between ecosystem services supplies and demands. J. Nat. Resour. 36, 1909–1922. doi:10.31497/zrzyxb.20210801
Simonit, S., and Perrings, C. (2011). Sustainability and the value of the ‘regulating’ services: Wetlands and water quality in Lake Victoria. Ecol. Econ. 70, 1189–1199. doi:10.1016/j.ecolecon.2011.01.017
Sun, R., Jin, X., Han, B., Liang, X., Zhang, X., and Zhou, Y. (2022). Does scale matter? Analysis and measurement of ecosystem service supply and demand status based on ecological unit. Environ. Impact Assess. Rev. 95, 106785. doi:10.1016/j.eiar.2022.106785
Sun, Y., Liu, S., Dong, Y., An, Y., Shi, F., et al. (2019). Spatio-temporal evolution scenarios and the coupling analysis of ecosystem services with land use change in China. Sci. Total Environ. 681, 211–225. doi:10.1016/j.scitotenv.2019.05.136
Tang, X., Liu, Y., and Pan, Y. (2020). An evaluation and region division method for ecosystem service supply and demand based on land use and POI data. Sustainability 12 (6), 2524. doi:10.3390/su12062524
Villamagna, A. M., Angermeier, P. L., and Bennelt, E. M. (2013). Capacity, pressure, demand, and flow: A conceptual framework for analyzing ecosystem service provision and delivery. Ecol. Complex. 15, 114–121. doi:10.1016/j.ecocom.2013.07.004
Wang, C., and Tang, N. (2018). Spatio-temporal characteristics and evolution of rural production-living-ecological space function coupling coordination in Chongqing Municipality. Geogr. Res. 37, 1100
Wang, J., Li, X., Christakos, G., Liao, Y., Zhang, T., Gu, X., et al. (2010). Geographical detectors-based health risk assessment and its application in the neural tube defects study of the Heshun region, China. Int. J. Geogr. Inf. Sci. 24, 107–127. doi:10.1080/13658810802443457
Wang, J., and Xu, C. Geodetector (2017). Instrumental networking and social network building: How horizontal networking and upward networking create social capital. Acta Psychol. Sin. 72, 116–134. doi:10.3724/sp.j.1041.2017.00116
Wang, J., Zhai, T., Lin, Y., and Kong, X. (2019). Spatial imbalance and changes in supply and demand of ecosystem services in China. Sci. Total Environ. 657, 781–791. doi:10.1016/j.scitotenv.2018.12.080
Wang, J., and Zhou, W. (2019). Ecosystem service flows: Recent progress and future perspectives. Acta Ecol. Sin. 39, 4213–4222.
Wang, Y., Xu, X., Zhuang, D., et al. (2021). Evolution of the supply and demand pattern of ecosystem services in Hunan Province. Chin. J. Ecol. 40, 3268. doi:10.13292/j.1000-4890.202110.029
Wei, H., Fan, W., Wang, X., Lu, N., Dong, X., Zhao, Y., et al. (2017). Integrating supply and social demand in ecosystem services assessment: A review. Ecosyst. Serv. 25, 15–27. doi:10.1016/j.ecoser.2017.03.017
Wu, A., Zhao, Y., shen, H., et al. (2018). Spatio-temporal pattern evolution of ecosystem service supply and demand in beijing-tianjin-hebei region. J. Ecol. rural Environ. 34 (11), 968. doi:10.11934/j.issn.1673-4831.2018.11.002
Wu, J., Men, X., Liang, J., et al. (2020). Research on supply and demand equilibrium of ecosystem services in Guangdong Province based on the gini coefficient. Acta Ecol. Sin. 40, 6812.
Xiao, Y., Xie, G., and An, K. (2003). The function and economic value of soil conservation of ecosystems in Qinghai-Tibet Plateau. Acta Ecol. Sin. 23, 2367–2378.
Xiao, Y., Xie, G., Lu, C., et al. (2016). Involvement of ecosystem service flows in human wellbeing based on the relationship between supply and demand. Acta Ecol. Sin. 36, 3096. doi:10.5846/stxb201411172274
Xie, G., Zhang, C., Zhang, L., et al. (2015). Improvement of the evaluation method for ecosystem service value based on per unit area. J. Nat. Resour. 30, 1243. doi:10.11849/zrzyxb.2015.08.001
Xie, G., Zhen, L., Lu, C., et al. (2008). Expert knowledge based valuation method of ecosystem services in China. J. Nat. Resour. 23, 911.
Xu, L., Xu, X., Luo, T., et al. (2012). Services based on land use: A case study of bohai rim. Geogr. Res. 31, 1775
Yang, J., and Huang, X. (2021). The 30 m annual land cover dataset and its dynamics in China from 1990 to 2019. Earth Syst. Sci. Data 13, 3907–3925. doi:10.5194/essd-13-3907-2021
Zhai, T., Wang, J., Jin, Z., et al. (2019). Change and correlation analysis of the supply-demand pattern of ecosystem services in the Yangtze River Economic Belt. Acta Ecol. Sin. 39, 5414.
Zhang, C., Li, Z., Zeng, H., et al. (2022). Scale effects on ecosystem service trade-off and its influencing factors based on wavelet transform: A case study in the Pearl River Delta, China. Geogr. Res. 41 (5), 1279. doi:10.11821/dlyj020210482
Zhang, D., Qu, L., and Zhang, J. (2019). Ecological security pattern construction method based on the perspective of ecological supply and demand: A case study of Yangtze River Delta. Acta Ecol. Sin. 39 (20), 7525.. doi:10.5846/stxb201808301854
Zhang, K., Liu, T., Feng, R., and Zhang, Z. (2021). Coupling coordination relationship and driving mechanism between urbanization and ecosystem service value in large regions: a case study of urban agglomeration in yellow River Basin, China. Int. J. Environ. Res. Public Health 18 (15), 7836. doi:10.3390/ijerph18157836
Zhang, L., and Fu, B. (2014). The progress in ecosystem services mapping: a review. Acta Ecol. Sin. 34, 316.
Keywords: ecosystem services, relationship between supply and demand, coupling coordination degree, geographic analysis, Jiangsu Province
Citation: Wen Y, Li H, Zhang X and Li T (2022) Ecosystem services in Jiangsu province: Changes in the supply and demand patterns and its influencing factors. Front. Environ. Sci. 10:931735. doi: 10.3389/fenvs.2022.931735
Received: 16 May 2022; Accepted: 18 July 2022;
Published: 19 August 2022.
Edited by:
David Lopez-Carr, University of California, Santa Barbara, United StatesReviewed by:
Lunche Wang, China University of Geosciences, ChinaJames R Pratt, Washington State University Tri-Cities, United States
Copyright © 2022 Wen, Li, Zhang and Li. This is an open-access article distributed under the terms of the Creative Commons Attribution License (CC BY). The use, distribution or reproduction in other forums is permitted, provided the original author(s) and the copyright owner(s) are credited and that the original publication in this journal is cited, in accordance with accepted academic practice. No use, distribution or reproduction is permitted which does not comply with these terms.
*Correspondence: Hongbo Li, bGloYkBuam51LmVkdS5jbg==