 Lili Wang
 Ying Gao
 Xiaoming Cao
 Weiwei Lu
95% of researchers rate our articles as excellent or good
Learn more about the work of our research integrity team to safeguard the quality of each article we publish.
Find out more
ORIGINAL RESEARCH article
Front. Environ. Sci. , 04 October 2022
Sec. Drylands
Volume 10 - 2022 | https://doi.org/10.3389/fenvs.2022.930961
This article is part of the Research Topic Ecological Restoration in Drylands: Towards Land Degradation Neutrality View all 19 articles
Cyanobacterial crusts, sensitive to changes in the moisture content, are widely distributed in the Ulan Buh Desert. Changes in precipitation patterns due to global climate change are expected to influence the carbon emission and photosynthetic carbon fixation of soil in areas covered with cyanobacterial crusts. We assessed how changes in precipitation amount and frequency affect carbon processes of Cyanobacterial Crusts. Taking average precipitation amount and frequency in August during the past 30 years as control, we established nine precipitation patterns (three amounts × three frequencies). The net carbon flux (NCF) and dark respiration rate (DRR) of cyanobacterial crusts and underlying soil were investigated. Precipitation could stimulate NCF and DRR immediately. With increasing water application times, the peak values of NCF, DRR and 12 h cumulative carbon emissions gradually decreased. Both precipitation amount and frequency significantly affected cumulative carbon emissions but without an interactive effect. Under the same frequency, cumulative carbon emissions increased with increasing precipitation amounts. Under the same total precipitation amount, cumulative carbon emissions caused by high-frequency events were the highest, followed by those of low-frequency precipitation and the control. However, such changes, against the background of a changing global climate, will result in increased carbon emissions of cyanobacterial crusts and underlying Soil, suggesting that cyanobacteria should be considered in projections of the future carbon budget.
According to various climate models, global and local precipitation patterns will change in the context of climate change (Feng and Fu, 2013; Stocker et al., 2014). Precipitation will increase in high-latitude areas and the tropical Pacific areas, similar to the average precipitation in many mid-latitude humid areas; in contrast, average precipitation will decrease in mid-latitude and subtropical dry areas (Stocker et al., 2014; Yongping and Guoya, 2013); in many areas, changes in precipitation intensity and time distribution (rainfall frequency and interval time) will further be aggravated, and more extreme precipitation events will occur (Solomon et al., 2007; Stocker et al., 2014). Precipitation determines the soil moisture, thus further regulating carbon cycling in terrestrial ecosystems (Huxman et al., 2004; Reed et al., 2012; Zelikova et al., 2012; Maestre et al., 2013; Peng et al., 2013; De Guevara et al., 2014; Escolar et al., 2015). In turn, such changes may feed back to the climate system, exacerbating or slowing down climate changes.
Precipitation drives resource availability and productivity. In arid and semi-arid regions, which account for 41% of the total land area (Reynolds et al., 2007), the soil carbon reserves account for 27% of the global total reserves (Roy and Saugier, 2001). Though not the highest, the carbon flux rate of arid and semi-arid ecosystems contributes significantly to the global carbon budget (Wohlfahrt et al., 2008; Piao et al., 2009; Xie et al., 2009; Peng et al., 2013). Moisture-limited arid and semi-arid ecosystems are, however, unable to support uniform and continuously distributed vegetation with high coverage, while they show a wide distribution of biological soil crusts (BSCs) (Belnap and Lange, 2003). Such crusts, which are the main components of desert ecosystems, are heterogeneous complexes formed by cryptogams (such as cyanobacteria, desert algae, lichens, and mosses) and soil microorganisms, as well as other related organisms, which are cemented with soil surface particles through mycelium, rhizoid, and secretions (Belnap and Lange, 2003; Xinrong et al., 2009; Yuanming and Xueqin, 2010). On the surface of desert areas, BSCs cover approximately 40% of the total area, reaching 70% or more in some regions. They are sensitive to changes in the external environment, especially moisture levels, and their weak source or sink characteristics are prone to directional reversal under the disturbance of rainfall, resulting in great uncertainty in carbon source and sink functions.
Several studies have focused on the effects of precipitation pattern changes (e.g., amount, intensity) on net primary productivity of BSCs, soil respiration and carbon process in arid and semi-arid regions. However, the impact of precipitation time distribution (rainfall frequency and interval time) on carbon processes was largely neglected, and there is a lack of field observations of fixed stations to support studies about carbon processes of BSCs caused by precipitation pattern changes.
The cyanobacterial crust is the primary development stage of BSCs, which is composed of pioneer species in desert areas. The cyanobacterial crust is characterized by high tolerance to extreme environmental conditions, such as drought, strong radiation and low in nutrients. It is widely distributed in harsh environments in arid regions and is one of the important surface cover landscape features of the Ulan Buh Desert, western Inner Mongolia Plateau. In this study, we used the cyanobacterial crust of the Ulan Buh Desert as the research object to explore the carbon flux process of cyanobacterial crust-covered soil under nine precipitation patterns, involving three frequencies at three amounts, with the aim to provide a scientific basis for the accurate estimation of carbon emission and sequestration by ecosystems in arid regions.
The study site was located in Dengkou County (40°9′N∼40°57′N, 106°9′E∼107°10′E), at the source of the Hetao Plain in western Inner Mongolia, China, and on the eastern edge of the Ulan Buh Desert. The prevailing climate is a temperate continental monsoon climate, with an annual average temperature, precipitation, and evaporation of 7.6°C, 144.5 mm, and 2,397.6 mm, respectively. The soils in the study region are mainly gray-brown desert soil and sandy soil [Cambic Arenosols and Luvic Gypsisols in FAO (Food and Agriculture Organization of the United Nations) taxonomy]. The area is a transitional belt between a desert and steppe, covered with psammophytic vegetation of desert areas.
The BSCs covered above 80% of desert land. The types of BSCs in this region includes cyanobacterial crusts, lichen crusts, and moss crusts. Cyanobacterial crusts account for the largest proportion in the vast majority of sandy land without plant cover. The dominant species in the cyanobacterial crusts are Microcoleus vaginatus.
According to the assessment report (Stocker et al., 2014), it is estimated that by the end of the 21st century, the annual precipitation in Northwest China will increase by 10–60%, and the changes in precipitation intensity and time distribution in many places will be further aggravated. Therefore, three precipitation amounts were tested: an increase by 30% (6.84 mm), an increase by 60% (8.12 mm), and the average precipitation (5.26 mm) in August during the 30 years from 1986 to 2015 (control). For each of the aforementioned three precipitation amounts, three frequencies were established: a frequency increase by 50% (12 times), a frequency reduction by 50% (3 times), and the average frequency (6 times) in August during the 30 years from 1986 to 2015 (control). A total of nine precipitation patterns (three sizes × three frequencies) were studied (Table 1), with three repetitions for each treatment. On an average, a frequency increase by 50% divided a single precipitation into two, while a frequency reduction by 50% superimposed two adjacent precipitations. The total precipitation amount was the same under different frequency treatments at the same amount. To avoid interference of natural precipitation, the samples were covered with transparent plastic cloth.
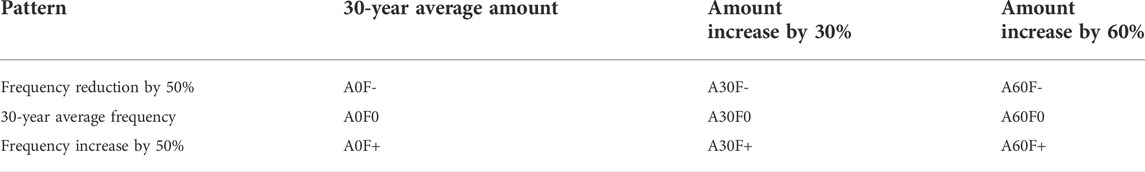
TABLE 1. Factors of the experimental design.
Flat areas, far away from vegetated areas and with well-developed cyanobacterial crusts, were sampled in July 2018. For this, 27 undisturbed soil cores covered with cyanobacterial crusts were collected using a self-made PVC sampler with a diameter of 20.3 cm (area: 0.032 m2) and a height of 20 cm. Prior to sample collection, the crust surface was moistened with distilled water to ensure sample integrity.
From the end of July 2018 to the end of August 2018, simulated precipitation experiments were conducted, and the net carbon flux (NCF) and dark respiration rate (DRR) were determined. Six water application experiments were conducted under patterns A0F0, A30F0, and A60F0, with NCF and DRR being determined for each experiment. Three water application experiments were conducted under patterns A0F-, A30F-, and A60F-, with NCF and DRR being determined for each experiment. Twelve water application experiments were conducted under patterns A0F+, A30F+, and A60F+, with NCF and DRR being determined for nine of them (the other three experiments were conducted with water only, and NCF and DRR were not determined).
At 6:00 a.m. on the day of water application, the soil respiration measurement system LI-8150 (LI-COR) was connected to the transparent air chamber to determine NCF prior to water application, and subsequently, the transparent air chamber was covered with opaque cloth to determine DRR. Starting from 7:00 a.m., the calculated amount of water was sprayed slowly and evenly into the soil cores using a watering can to largely avoid runoff. Immediately after watering and after 0, 1, 2, 4, 8, 12, and 24 h, NCF and DRR were determined. For each sample, light and dark measurements were paired, and the paired measurements were taken as simultaneously as possible to avoid a shift in the environmental conditions.
The time-weighted method was adopted to calculate the 12-h cumulative net carbon flux (12-h NCF) and the total net carbon flux (TNCF), as well as the 12-h cumulative carbon release flux (12-h DRR) and the total carbon release flux (TDRR) under nine precipitation patterns. A one-way ANOVA was adopted for variance analysis of 12-h NCF and 12-h DRR. A two-way ANOVA was adopted for variance analysis of TNCF, TDRR, and total photosynthetic carbon sequestration (TPCS). For statistical analysis and mapping, we used the software packages SPSS 20.0, Excel 2010, and R statistical software.
The photosynthetic rate (PR) is calculated based on NCF and DRR:
where PR is the photosynthetic rate value; the greater the value, the greater the photosynthetic rate and the stronger the carbon sequestration capacity.
After water application, the NCF values of all precipitation patterns increased rapidly and peaked at 1 h, followed by a gradual decrease and a return to background levels after 12 h. Among the NCF values before and 24 h after water application, some values were negative, indicating that the cyanobacterial crust sequestered carbon and functioned as a carbon sink (Figure 1).
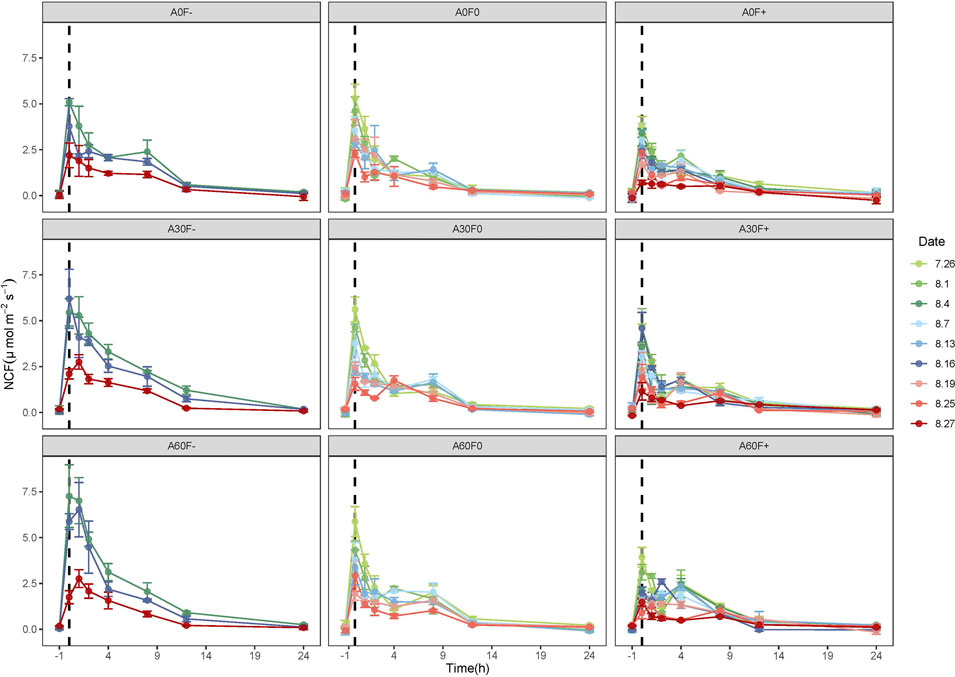
FIGURE 1. Dynamics of NCF in soil covered with cyanobacterial crust. -1 is the value determined before water application, and 7.26, and 8.1, etc., are the experimental dates. NCF: net carbon flux.
After the first time of water application, the peak values of NCF under the nine precipitation patterns were 5.09 (A0F−), 5.46 (A30F−), 7.26 (A60F−), 5.31 (A0F0), 5.61 (A30F0), 5.87 (A60F0), 3.83 (A0F+), 3.62 (A30F+), and 3.93 (A60F+) μmol m−2 s−1, respectively. Nevertheless, after the last time of water application, the peak values were 2.19 (A0F−), 2.1 (A30F−), 1.75 (A60F−), 2.28 (A0F0), 1.75 (A30F0), 2.9 (A60F0), 0.71 (A0F+), 1.15 (A30F+), and 1.48 (A60F+) μmol m−2 s−1, respectively, showing a large reduction (50–80%) compared to the first time.
For clearly comparing the changes of net carbon flux among different precipitation patterns, we calculated the 12-NCF after every water application and took the average. We found the 12-h NCF had a negative relationship with precipitation frequency (−50% > normal > +50%) (Figure 2). Under −50% frequency treatment, the 12-h NCF of +30% and +60% amount were significantly higher than normal (p < 0.05). However, under +50% frequency and normal frequency treatments, the 12-h NCF were not significantly different (p > 0.05). With the increase of water application times, the 12-h NCF showed a decreasing trend under all precipitation patterns. Compared with the first time, the 12-h NCF after the last time water application was decreased by 38–63%.
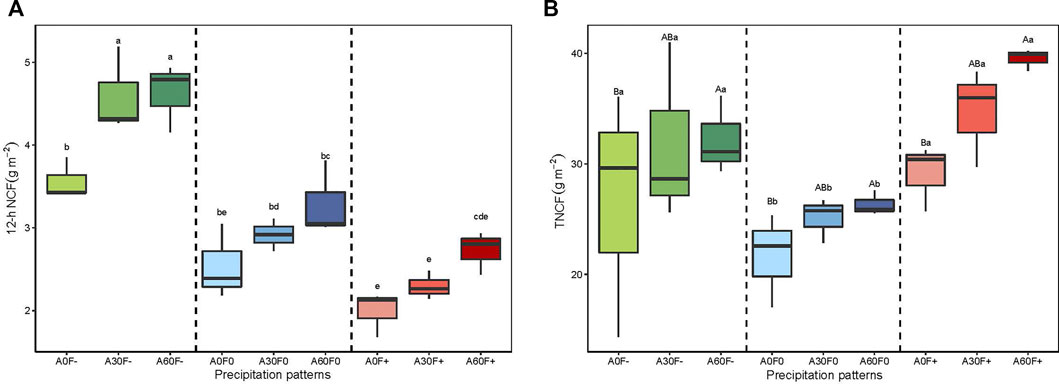
FIGURE 2. (a) 12-h NCF of soil covered with cyanobacterial crust; (b) TNCF of soil covered with cyanobacterial crust; statistically significant differences in precipitation amount are denoted with capital letters whereas statistically significant differences of precipitation frequency are denoted with lowercase letters. 12-h NCF: 12-h cumulative net carbon flux; TNCF: total net carbon flux.
To compare the carbon flux across the whole experiment period, we use the weighted average method to calculate TNCF. We found that the TNCF values of +50% frequency and −50% frequency treatments were significantly higher than that in normal frequency (p < 0.05) whereas there is no significant difference between +50% frequency and −50% frequency (p > 0.05). At the same frequency, the TNCF in treatments of +60% amount was significantly higher than normal amount (p < 0.05) (Figure 2). However, two-way anova analysis showed that individual precipitation amount and frequency has significant effects on TNCF (p < 0.05), but they did not show significant interactive effects (Table 2, p > 0.05).
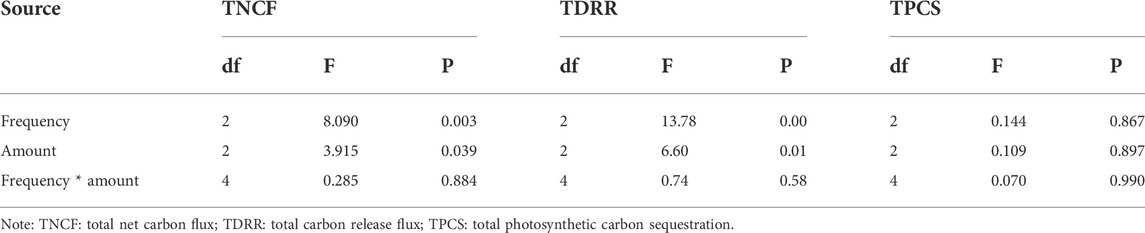
TABLE 2. Variance analysis of effects of precipitation amount and frequency on TNCF, TDRR, and TPCS.
Precipitation can significantly stimulate soil respiration. Under the nine different precipitation patterns, DRR significantly increased after water application, reaching a peak value within 1 h and then gradually decreased, reaching background levels about 12 h after water application (Figure 3).
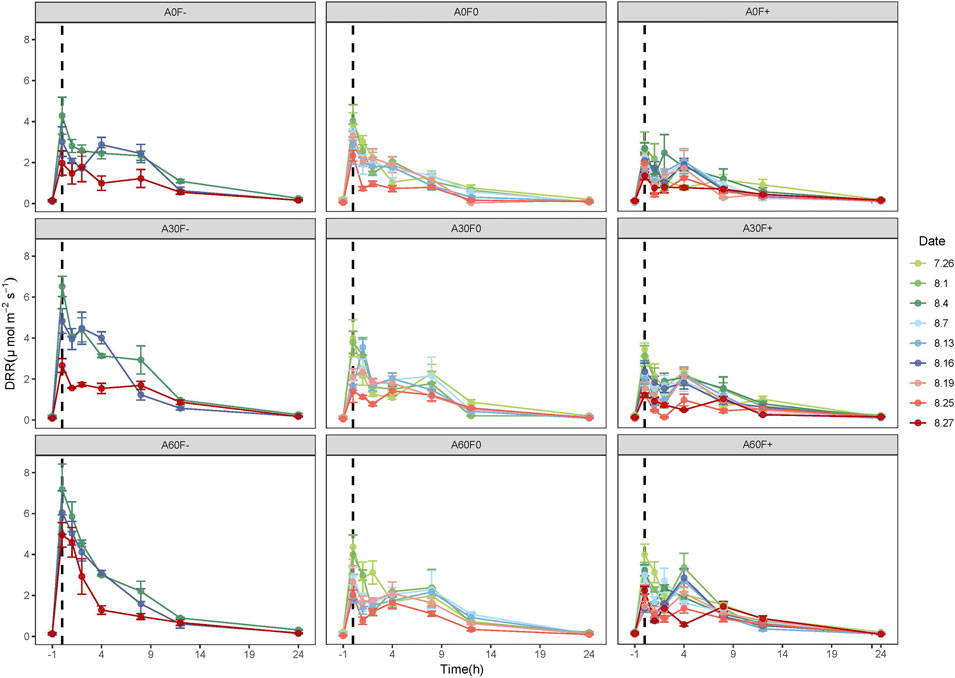
FIGURE 3. Dynamics of DRR in soil covered with cyanobacterial crust. -1 is the value determined before water application; 7.26, and 8.1, etc., are the experimental dates. DRR: dark respiration rate.
With the increase of water application times, peak values of DRR under the nine patterns had a similar decreasing trend to that of NCF. After first time water application, the peak values of DRR were 4.29 (A0F−), 6.52 (A30F−), 7.18 (A60F−), 3.82 (A0F0), 3.98 (A30F0), 4.38 (A60F0), 2.51 (A0F+), 3.42 (A30F+), and 4.20 (A60F+) μmol m−2 s−1, respectively. After last time water application, the peak values of DRR were 2.17 (A0F−), 2.66 (A30F−), 5.66 (A60F−), 2.32 (A0F0), 1.89 (A30F0), 2.08 (A60F0), 1.40 (A0F+), 1.27 (A30F+), and 2.23 (A60F+) μmol m−2 s−1, with a reduction of 40–60% compared to the first time (Figure 3).
Similar to NCF, the 12-h DRR also had a negative relationship with precipitation frequency (−50% > normal > +50%). Under normal and +50% frequency treatment, the 12-h DRR increased along with increasing amount, and the 12-h DRR of amount +60% was significantly greater than that +30% and normal (p < 0.05). Under −50% frequency treatment, the following order was observed: +60% amount > +30% amount > normal amount, and the difference between the amounts was statistically significant (p < 0.05) (Figure 4). With the increase of water application times, the 12-h DRR showed a decreasing trend under all precipitation patterns. Compared with the first time, the 12-h DRR after the last time water application was decreased by 33–52%.
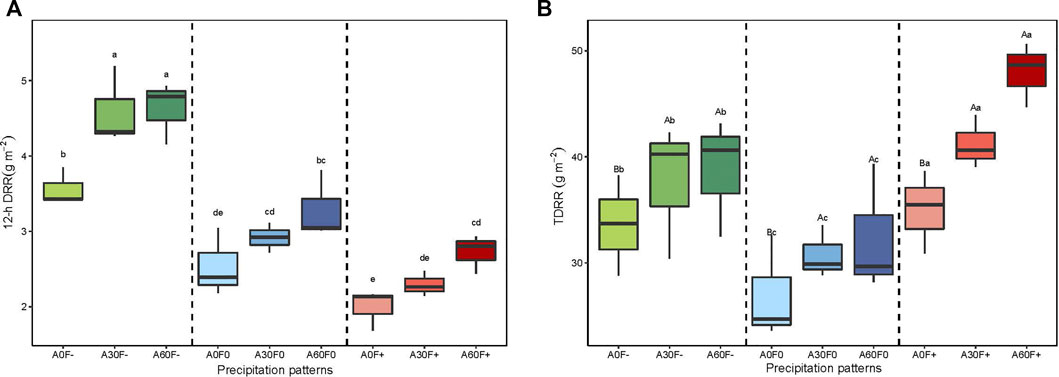
FIGURE 4. (a) 12-h DRR of soil covered with cyanobacterial crusts; (b) TDRR of soil covered with cyanobacterial crust; statistically significant differences in precipitation amount are denoted with capital letters whereas statistically significant differences in precipitation frequency are denoted with lowercase letters. 12-h DRR: 12-h cumulative carbon release flux; TDRR: total carbon release flux.
At the same amount, the TDRR at the three frequencies showed the following order: +50% frequency > −50% frequency > normal frequency; the levels significantly differed among the different frequencies. At the same frequency, The TDRR increased with increasing amount, the TDRR in treatments of +30 and +60% amount were significantly greater than normal amount (p < 0.05) (Figure 4). However, two-way anova analysis showed that individual precipitation amount and frequency significantly affected TDRR (p < 0.05), but without an interactive effect (p > 0.05) (Table 2).
As shown in Figure 5, PR generally showed an upward trend after water application, reaching the maximum value about 4 h after water application and gradually falling to background levels after 12 h. Among them, the values of PR at 0 h after water application were positive under A30F-, A60F-, and A60F+, with the carbon sequestration rate first decreasing and reaching the minimum value at the first hour, followed by a gradual increase. There was no significant difference in the effects of amount, frequency, and their interaction on TPCS (p > 0.05) (Figure 6, Table 2).
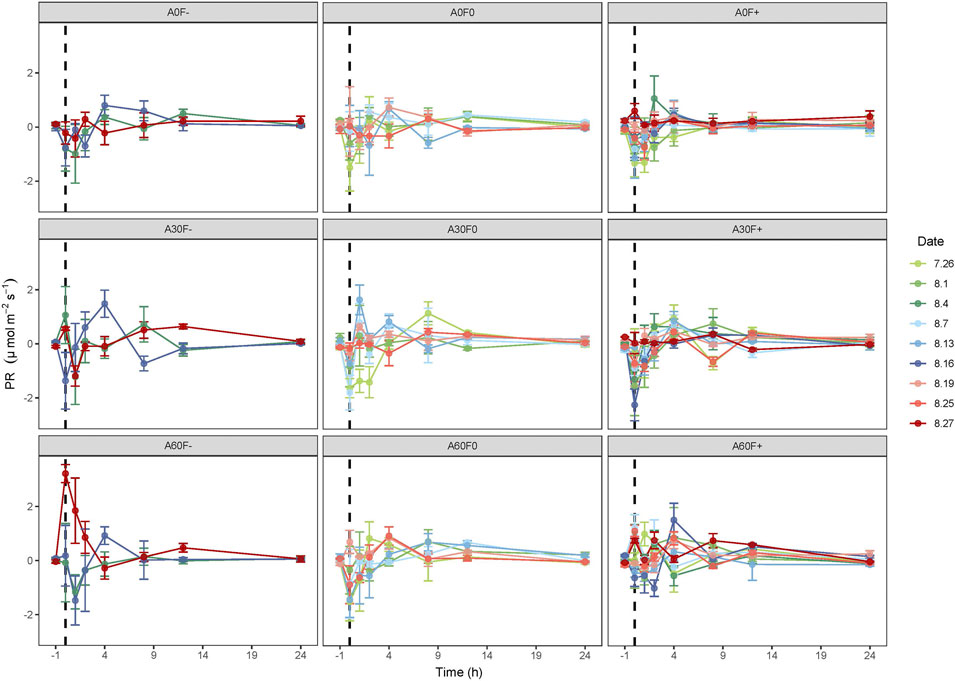
FIGURE 5. Dynamics of PR of the cyanobacterial crust. -1 is the value determined before water application; 7.26, and 8.1, etc., are the experimental dates. PR: photosynthetic rate.
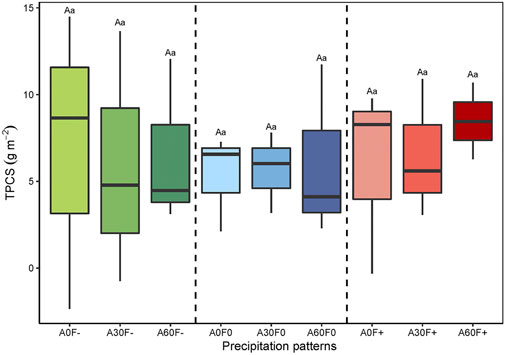
FIGURE 6. TPCS of cyanobacterial crusts. TPCS: total photosynthetic carbon sequestration. Statistically significant differences in precipitation amount are denoted with capital letters whereas statistically significant differences in precipitation frequency are denoted with lowercase letters.
In arid regions, moisture is the main limiting factor for biological activities. Precipitation can directly alternating soil moisture, which will affect the soil carbon cycling and cause the changes of soil carbon stock. In this study, the results showed that precipitation could stimulate NCF and DRR and then they gradually decreased to background level. This finding is consistent with previous observations (Sponseller, 2007; Xiaohong et al., 2016). This could be attributed to two main reasons: first, organisms in cyanobacterial crust were very sensitive to water. Under the dry condition, cyanobacterial crust will enter to a dormant state, but after water application, physiological activities and respirations of it could quickly recover. Secondly, arid region has the loose soil, so amount of CO2 might potentially accumulate in soil gaps, which would be discharged when rainwater infiltrated.
Previous studies have found that the carbon emissions of biological crust areas increased with increasing precipitation amounts (Housman et al., 2007; Thomas et al., 2008; Thomas and Hoon, 2010; Castillo-Monroy et al., 2011; Feng et al., 2013). Consistently, in our study, 12-h NCF and 12-h DRR, TNCF and TDRR of cyanobacterial crust and underlying soil also showed increased with the increase of individual water application amount at the same frequency. However, when the amount increased to a certain extent, it no longer had an obvious acceleration effect on soil carbon emissions. In our experiment, for 12-h NCF and 12-h DRR under −50% frequency treatment and TDRR, +30% (A30F−) and +60% (A60F−) amount were significantly greater than normal amount (A0F−) (p < 0.05), but the difference between A30F− and A60F− was not significant (p > 0.05). There is an optimal level of hydration for biocrust organisms (NASH III, 1996; Lange, 2001), high precipitation amounts increase diffusional resistance and decrease CO2 availability to crust (Grote et al., 2010).
In addition to precipitation amount, precipitation frequency also had significant effects on the carbon processes of BSCs. Precipitation frequency disturbs carbon exchange modes by affecting the dry-wet alternation of the soil (Reed et al., 2012). In this study, we observed that 12-h NCF and 12-h DRR decreased with increased water application frequency, which was mainly due to the large evaporation in arid regions. In this region, lower water application amount in high water application frequency can only moisten the soil surface and the water from water application will be evaporated in a short time, so soil and cyanobacterial crust could not utilize it, causing the decrease of carbon emission. However, for the entire experiment period, under the same precipitation amount, TNCF and TDRR did not showed a decreased trend with increased water application frequency. Specifically, TNCF and TDRR in high-frequency treatments were highest, followed by low-frequency and then normal-frequency treatments. This may be due to a synergetic effect between the individual precipitation amount, the precipitation frequency, and other environmental factors such as antecedent moisture, temperature (Baldauf et al., 2018).
Precipitation significantly promoted the soil carbon emission rate and increased cumulative carbon emissions, but with the increase in precipitation times, that is, with more dry–wet alternations, this effect was gradually weakened. Our results has found that most of the increased water application amount treatments significantly promoted soil carbon emission rate (represented by NCF and DRR), and cumulative carbon emissions (represented by 12-NCF, TNCF, 12-DRR and TDRR). However, with the increase of water application time, the peak values of NCF, DRR, 12-h NCF, and 12-h DRR decreased along with the increase in dry-wet alternation times. This significant increased effect was gradually weakened. This may be due to the changes in available organic matter, microbial biomass, and microbial community structure in the soil through continuous dry–wet alternations. On the one hand, after repeated dry–wet alternations, the stability of soil aggregates was improved, and the amount of organic matter released therefrom was reduced (Denef et al., 2001). On the other hand, with further dry–wet alternations, the composition of the microbial community reestablished in the soil changed as a response to changes in the soil water potential (Mikha et al., 2005), reducing its sensitivity to changes in water potential. As a consequence, the mortality of microorganisms was reduced, thus reducing the active organic matter available to microorganisms.
Previous studies have found that BSCs responded quickly to precipitation. The photosynthetic process of BSCs could start within 10 min even under a small amount of precipitation and could maintain photosynthetic capacity. In addition, the photosynthetic rate is very likely to show an increased trend first and then decrease (Lange et al., 1994; Brostoff et al., 2005; Grote et al., 2010; Feng et al., 2014). Consistently, in our study, the photosynthetic rate of cyanobacterial crusts also peaked about 4 h after water application and then gradually decreased to background levels. This is likely because cyanobacterial crusts are generally in a dormant state under water limitation condition and metabolism of photosynthetic process would start rapidly once the environment becomes wet. However, photosynthetic carbon sequestration capacity is weak and discontinuous. In addition, the crusts also respire while photosynthesizing, and its respiration rate is greater than its photosynthetic rate at the early stage after water application.
With regard to NCF between soil and the atmosphere, our result showed that NCF value was positive, indicating that CO2 which was fixed from atmosphere could not offset its emission. However, we also found NCF values of some crusted areas were negative, indicating that carbon fixation process existed in these areas. In addition, we found this phenomenon always occurred in the morning. Previous research has found that BSCs can rapidly restore their metabolism with 0.1 mm of water (Lange et al., 1994). In dry region, dew, fog, and even greater air humidity could be main water sources for photosynthetic process (Lange et al., 1997). Thus, this is probably due to condensed water and lower temperatures in the morning. Specifically, condensed water facilitated photosynthetic process, while the lower temperatures inhibited soil respiration in the morning. Consequently, carbon could be sequestered in the morning.
Furthermore, with the increase in annual precipitation, the annual carbon sequestration of BSCs showed an increasing trend (Yoshitake et al., 2010; Coe and Sparks, 2014; Feng et al., 2014). Similarly, the TPCS which represented annual carbon sequestrations in our study also increased with increasing precipitation amounts, but the individual effects of precipitation and frequency, and interaction effects of these two factors were all not significant on TPCS. This may be due to the low carbon sequestration capacity of cyanobacterial crusts, as well as the experimental period.
Precipitation had a significant stimulating effect on soil carbon emission. Both precipitation amount and frequency significantly affected cumulative carbon emissions, but without an interactive effect. Under the same precipitation frequency, cumulative carbon emissions increased with increasing precipitation amount. However, when precipitation amount increased to a certain extent, it no longer accelerated soil carbon emission. Under the same precipitation amount, cumulative carbon emissions caused by high-frequency events were highest, followed by those of low-frequency precipitation and the control. For individual water application, the carbon emissions caused by low-frequency heavy events were significantly greater than those caused by high-frequency light events. Another important finding was that the stimulating effect of precipitation to soil carbon emissions decreased with the increase of water application times. Changes in precipitation amount and frequency caused by global climate change will increase carbon emissions of cyanobacterial crusts and underlying Soil, suggesting that cyanobacteria should be considered in projections of the future carbon budget.
The raw data supporting the conclusion of this article will be made available by the authors, without undue reservation.
LW wrote the main manuscript. YG prepared figures, and reviewed the manuscript. XC and WL reviewed the manuscript.
This research was funded by the general fund from the National Natural Science Foundation of China (NO. 41971398), the central public welfare scientific research institutes Special fund for basic scientific research business expenses (No. CAFYBB2020ZB007), the special program for basic resources of the Ministry of science and technology (NO. 2019FY102002), Fundamental Research Funds for the Central Nonprofit Research Institution of Chinese Academy of Forestry (CAFYBB2017QA038).
The authors thank the Experimental Center of Desert Forestry, Chinese Academy of Forestry, for providing the 30-year precipitation and frequency data of the region of interest from 1986 to 2015.
The authors declare that the research was conducted in the absence of any commercial or financial relationships that could be construed as a potential conflict of interest.
All claims expressed in this article are solely those of the authors and do not necessarily represent those of their affiliated organizations, or those of the publisher, the editors, and the reviewers. Any product that may be evaluated in this article, or claim that may be made by its manufacturer, is not guaranteed or endorsed by the publisher.
Baldauf, S., de Guevara, M. L., Maestre, F. T., and Tietjen, B. (2018). Soil moisture dynamics under two rainfall frequency treatments drive early spring CO2 gas exchange of lichen-dominated biocrusts in central Spain. PeerJ 6, e5904. doi:10.7717/peerj.5904
Belnap, J., and Lange, D. H. C. O. L. (2003). Biological soil crusts: Structure, function, and management. Berlin Heidelberg: Springer.
Brostoff, W. N., Sharifi, M. R., and Rundel, P. W. (2005). Photosynthesis of cryptobiotic soil crusts in a seasonally inundated system of pans and dunes in the Western Mojave Desert, CA: Field studies. Flora-Morphology Distribution Funct. Ecol. Plants 200, 592–600. doi:10.1016/j.flora.2005.06.008
Castillo-Monroy, A. P., Maestre, F. T., Rey, A., Soliveres, S., and García-Palacios, P. (2011). Biological soil crust microsites are the main contributor to soil respiration in a semiarid ecosystem. Ecosystems 14, 835–847. doi:10.1007/s10021-011-9449-3
Coe, K. K., and Sparks, J. P. (2014). Physiology-based prognostic modeling of the influence of changes in precipitation on a keystone dryland plant species. Oecologia 176, 933–942. doi:10.1007/s00442-014-3067-7
De Guevara, M. L., Lazaro, R., Quero, J. L., Ochoa, V., Gozalo, B., Berdugo, M., et al. (2014). Simulated climate change reduced the capacity of lichen-dominated biocrusts to act as carbon sinks in two semi-arid Mediterranean ecosystems. Biodivers. Conserv. 23, 1787–1807. doi:10.1007/s10531-014-0681-y
Denef, K., Six, J., Bossuyt, H., Frey, S. D., Elliott, E. T., Merckx, R., et al. (2001). Influence of dry–wet cycles on the interrelationship between aggregate, particulate organic matter, and microbial community dynamics. Soil Biol. Biochem. 33, 1599–1611. doi:10.1016/s0038-0717(01)00076-1
Escolar, C., Maestre, F. T., and Rey, A. (2015). Biocrusts modulate warming and rainfall exclusion effects on soil respiration in a semi-arid grassland. Soil Biol. Biochem. 80, 9–17. doi:10.1016/j.soilbio.2014.09.019
Feng, S., and Fu, Q. (2013). Expansion of global drylands under a warming climate. Atmos. Chem. Phys. 13, 10081–10094. doi:10.5194/acp-13-10081-2013
Feng, W., Zhang, Y. Q., Wu, B., Zha, T. S., Jia, X., Qin, S. G., et al. (2013). Influence of disturbance on soil respiration in biologically crusted soil during the dry season. Sci. World J. 2013, 1–6. doi:10.1155/2013/408560
Feng, W., Zhang, Y., Wu, B., Qin, S., and Lai, Z. (2014). Influence of environmental factors on carbon dioxide exchange in biological soil crusts in desert areas. Arid Land Res. Manag. 28, 186–196. doi:10.1080/15324982.2013.835006
Grote, E. E., Belnap, J., Housman, D. C., and Sparks, J. P. (2010). Carbon exchange in biological soil crust communities under differential temperatures and soil water contents: Implications for global change. Glob. Change Biol. 16, 2763–2774. doi:10.1111/j.1365-2486.2010.02201.x
Housman, D., Grote, E., and Belnap, J. (2007). “Annual CO2 flux from a biological soil crust system on the Colorado Plateau: effects of increased temperature and summer precipitation,” in Ecological society of America annual meeting abstracts (Washington: Ecological Society of America).
Huxman, T. E., Snyder, K. A., Tissue, D., Leffler, A. J., Ogle, K., Pockman, W. T., et al. (2004). Precipitation pulses and carbon fluxes in semiarid and arid ecosystems. Oecologia 141, 254–268. doi:10.1007/s00442-004-1682-4
Lange, O. L. (2001). “Photosynthesis of soil-crust biota as dependent on environmental factors,” in Biological soil crusts: structure, function, and management (Springer), 217–240. doi:10.1007/978-3-642-56475-8_18
Lange, O. L., Belnap, J., Reichenberger, H., and Meyer, A. (1997). Photosynthesis of green algal soil crust lichens from arid lands in southern Utah, USA: Role of water content on light and temperature responses of CO2 exchange. Flora 192, 1–15. doi:10.1016/s0367-2530(17)30749-1
Lange, O., Meyer, A., Zellner, H., and Heber, U. (1994). Photosynthesis and water relations of lichen soil crusts: Field measurements in the coastal fog zone of the namib desert. Funct. Ecol. 8, 253–264. doi:10.2307/2389909
Maestre, F. T., Escolar, C., Guevara, M. L., Quero, J. L., Lazaro, R., Delgado-Baquerizo, M., et al. (2013). Changes in biocrust cover drive carbon cycle responses to climate change in drylands. Glob. Chang. Biol. 19, 2697–2698. doi:10.1111/gcb.12659
Mikha, M. M., Rice, C. W., and Milliken, G. A. (2005). Carbon and nitrogen mineralization as affected by drying and wetting cycles. Soil Biol. Biochem. 37, 339–347. doi:10.1016/j.soilbio.2004.08.003
Peng, S., Piao, S., Shen, Z., Ciais, P., Sun, Z., Chen, S., et al. (2013). Precipitation amount, seasonality and frequency regulate carbon cycling of a semi-arid grassland ecosystem in inner Mongolia, China: A modeling analysis. Agric. For. Meteorology 178–179, 46–55. doi:10.1016/j.agrformet.2013.02.002
Piao, S., Yin, L., Wang, X., Ciais, P., Peng, S., Shen, Z., et al. (2009). Summer soil moisture regulated by precipitation frequency in China. Environ. Res. Lett. 4, 044012. doi:10.1088/1748-9326/4/4/044012
Reed, S. C., Coe, K. K., Sparks, J. P., Housman, D. C., Zelikova, T. J., and Belnap, J. (2012). Changes to dryland rainfall result in rapid moss mortality and altered soil fertility. Nat. Clim. Chang. 2, 752–755. doi:10.1038/nclimate1596
Reynolds, J. F., Smith, D. M. S., Lambin, E. F., Turner, B. L., Mortimore, M., Batterbury, S. P. J., et al. (2007). Global desertification: Building a science for dryland development. Science 316, 847–851. doi:10.1126/science.1131634
Roy, J., and Saugier, B. (2001). Terrestrial global productivity. Amsterdam, Netherlands: Elsevier, 122–598.
Solomon, S., Manning, M., Marquis, M., and Qin, D. (2007). Climate change 2007-the physical science basis: Working group I contribution to the fourth assessment report of the IPCC, 4. Cambridge University Press, Cambridge, United Kingdom.
Sponseller, R. A. (2007). Precipitation pulses and soil CO2 flux in a Sonoran Desert ecosystem. Glob. Chang. Biol. 13, 426–436. doi:10.1111/j.1365-2486.2006.01307.x
Stocker, T. F., Qin, D., Plattner, G. K., Tignor, M. M. B., Allen, S. K., Boschung, J., et al. IPCC (2014). Climate change 2013: the physical science basis. Contribution of working group I to the fifth assessment report of the intergovernmental panel on climate change. Cambridge University Press, Cambridge, United Kingdom. doi:10.1017/CBO9781107415324
Thomas, A. D., and Holon, S. R. (2010). Carbon dioxide fluxes from biologically-crusted Kalahari Sands after simulated wetting. J. arid Environ. 74, 131–139. doi:10.1016/j.jaridenv.2009.07.005
Thomas, A. D., Hoon, S. R., and Linton, P. E. (2008). Carbon dioxide fluxes from cyanobacteria crusted soils in the Kalahari. Appl. Soil Ecol. 39, 254–263. doi:10.1016/j.apsoil.2007.12.015
Wohlfahrt, G., Fenstermaker, L., and Arnone, J. (2008). Large annual net ecosystem CO2 uptake of a Mojave Desert ecosystem. Glob. Change Biol. 14, 1475–1487. doi:10.1111/j.1365-2486.2008.01593.x
Xiaohong, J., Chen, G., Bo, W., Yuanshou, L., Long, C., and Xinrong, L. (2016). Responses of carbon dioxide fluxes from biological soil crusted soils to pulse rain in arid desert ecosystem. J. desert Res. 036, 423–432. doi:10.7522/j.issn.1000-694X.2015.00199
Xie, J., Li, Y., Zhai, C., Li, C., and Lan, Z. (2009). CO 2 absorption by alkaline soils and its implication to the global carbon cycle. Environ. Geol. 56, 953–961. doi:10.1007/s00254-008-1197-0
Xinrong, L., Yuanming, Z., and Yunge, Z. (2009). A study of biological soil crusts: Recent development, trend and prospect. Adv. nearth seience 24, 11–24. 10.11867/j.issn.1001-8166.2009.01.0011.
Yongping, S., and Guoya, W. (2013). Key findings and assessment results of IPCC WGI fifth assessment Report. J. Glaciol. Geocryol. 35, 1068–1076. doi:10.7522/j.issn.1000-0240.2013.0120
Yoshitake, S., Uchida, M., Koizumi, H., Kanda, H., and Nakatsubo, T. (2010). Production of biological soil crusts in the early stage of primary succession on a High Arctic glacier foreland. New Phytol. 186, 451–460. doi:10.1111/j.1469-8137.2010.03180.x
Yuanming, Z., and Xueqin, W. (2010). Summary on formation and developmental characteristics of biological soil crusts in desert areas. Acta Ecol. Sin. 30, 4484–4492. doi:10.1016/S1872-5813(11)60001-7
Keywords: cyanobacterial crusts, carbon dioxide fluxes, precipitation amount, precipitation frequency, biological soil crusts
Citation: Wang L, Gao Y, Cao X and Lu W (2022) Carbon dioxide fluxes of cyanobacterial crusts and underlying soil under different precipitation patterns in the Ulan Buh Desert, China. Front. Environ. Sci. 10:930961. doi: 10.3389/fenvs.2022.930961
Received: 28 April 2022; Accepted: 20 July 2022;
Published: 04 October 2022.
Edited by:
Jifeng Deng, Shenyang Agricultural University, ChinaReviewed by:
Jun Li, Beijing Forestry University, ChinaCopyright © 2022 Wang, Gao, Cao and Lu. This is an open-access article distributed under the terms of the Creative Commons Attribution License (CC BY). The use, distribution or reproduction in other forums is permitted, provided the original author(s) and the copyright owner(s) are credited and that the original publication in this journal is cited, in accordance with accepted academic practice. No use, distribution or reproduction is permitted which does not comply with these terms.
*Correspondence: Xiaoming Cao, Y2FveG1AY2FmLmFjLmNu
Disclaimer: All claims expressed in this article are solely those of the authors and do not necessarily represent those of their affiliated organizations, or those of the publisher, the editors and the reviewers. Any product that may be evaluated in this article or claim that may be made by its manufacturer is not guaranteed or endorsed by the publisher.
Research integrity at Frontiers
Learn more about the work of our research integrity team to safeguard the quality of each article we publish.