 Rinad Hamed
 Shehdeh Jodeh
 Ghadir Hanbali
 Zaki Safi
 Avni Berisha
 Kledi Xhaxhiu5,6
- 1Department of Chemistry, An-Najah National University, Nablus, Palestine
- 2Chemistry Department, Faculty of Science, Al Azhar University-Gaza, Gaza, Palestine
- 3Department of Chemistry, Faculty of Natural and Mathematics Science, University of Prishtina, Prishtina, Kosovo
- 4Materials Science-Nanochemistry Research Group, NanoAlb-Unit of Albanian Nanoscience and Nanotechnology, Tirana, Albania
- 5Department of Chemistry, Faculty of Natural Sciences, University of Tirana, Tirana, Albania
- 6Nano, Micro Materials and Sensors Applications Group, NanoAlb-Unit of Albanian Nanoscience and Nanotechnology, Tirana, Albania
- 7Institute for Nanotechnology and Water Sustainability (iNanoWS), College of Science, Engineering and Technology (CSET), University of South Africa, Johannesburg, South Africa
Graphene oxide–chitosan composites are attracting considerable interest as an eco-friendly adsorbent material for most aquatic environmental pollutants. Today, the focus is on the emerging applications of 2D and 3D graphene functionalized with chitosan to enhance its mechanical properties and adsorption efficiency. Herein, the super adsorbent 3D graphene functionalized with chitosan (3D GF-CS) is synthesized to remove sulfamethazine, (SMZ) as a model aquatic antibiotic pharmaceutical. The synthesized materials were characterized by scanning electron microscopy (SEM), thermogravimetric analysis (TGA), X-ray diffraction (XRD), Fourier transform infrared spectroscopy (FT-IR), X-ray photon spectroscopy (XPS), Brunauer–Emmett–Teller (BET), and Raman spectroscopy. After that, adsorption experiments were conducted for SMZ adsorption to find out the optimized adsorption parameters, such as pH, temperature, contact time, initial antibiotic concentration, and adsorbent dosage. The results show the optimal adsorption parameters were as pH of 7, temperature of 25°C, initial antibiotic concentration Ci of 50 ppm. Also, the kinetics, isotherms models, and thermodynamics parameters of SMZ adsorption were studied. The experimental results revealed to be best suited by both the pseudo-second-order kinetic and the Freundlich isotherm model compared with other isotherm models. The thermodynamics parameters demonstrated that the adsorption is exothermic, exhibiting higher adsorption efficiency at lower temperature. In addition, Gibb’s free energy suggested the adsorption to be spontaneous as well as entropy indication of the loss of disorder. Furthermore, the regeneration of 3D GF-CS was utilized in ten consecutive cycles, and the SMZ adsorption capacity did not decline significantly. Additionally, this research studied the adsorption energies and how sulfamethazine adsorbs onto 3D GF-CS was determined by applying the density-functional–based tight binding (DFTB) and Monte Carlo simulations at different adsorption positions. The chemical reactivity (local and global) of the free drug was investigated using the density functional theory (DFT), namely, the B3LYP and PBEPBE functionals with the 6–31+G (d, p) basis set in the gas phase and aqueous solution.
1 Introduction
Pharmaceuticals and personal care products (PPCPs) are considered to be trace amounts of organic pollutants found in the environment, which have attracted the interest of several research studies (Wang and Wang, 2016; Wang J. et al., 2019). They are not only regarded as having a toxic impact on aquatic microbes but also as possible risks to humans in a variety of ways (Tang and Wang, 2018; Wang and Wang, 2018; Zhuang et al., 2019).
Water treatment plant techniques are not always capable of removing these pollutants (Tang and Wang, 2018; Wang and Zhuang, 2019). As a result, various studies on the removal of pharmaceuticals and PPCPs from aqueous solutions have been conducted (Tang and Wang, 2018). Sulfamethazine (SMZ), one of these PPCPs, has been largely regarded as a typically targeted pollutant (Shen et al., 2015).
Several studies and methodologies have been used to remove PPCPs, including adsorption (Jianlong et al., 2002), ionizing radiation, electroanalytical oxidation, dielectric barrier discharge (Wang and Wang, 2019), Fenton-like oxidation (Danalıoğlu et al., 2017), and biodegradation (Ncibi and Sillanpää, 2017). Because some PPCPs, such as DMP, are endocrine disruptors, using microbes to remove them can result in the creation of endurance strains. Furthermore, modern oxidation methods such as gamma irradiation and the Fenton-like reaction cannot completely remove PPCPs, and numerous intermediates and products may be produced during the termination step, transferring them to more harmful compounds (Westerhoff et al., 2005).
Adsorption is commonly used nowadays to remove pharmaceuticals and certain organic contaminants from water and wastewater because of its simplicity of operation, cheap cost, and high adsorption effectiveness (Li et al., 2019; Chen et al., 2020; Medetalibeyoğlu et al., 2020; Veclani and Melchior, 2020).
Because some PPCPs, such as DMP, are endocrine disruptors, using efficient microorganisms as an environment-friendly method for the bioremediation of soil from the antibiotic pollutant is efficient, but this operation is considered so complex since the behavior of microorganisms is unexpected and it can result in the creation of endurance strains (Mohammadi et al., 2021). Furthermore, modern oxidation methods, such as gamma irradiation and Fenton-like methods, Gamma irradiation and Fenton-like oxidation are effective methods for the degradation of toxic of PPCPs through the generation of oxidizing agents. Even though Fenton-like oxidation has many drawbacks like the acidic condition should be kept to avoid iron precipitation and the need for acidifying and alkalinizing agents before the downstream treatments for preventing forming harmful compounds formulation (Akrami et al., 2019) as well, even the gamma irradiation has excellent penetration to waste water and formation of an oxidized element to break organic and inorganic pollutants, it still has its drawbacks as it cannot completely remove PPCPs, and numerous intermediates and products may be produced during the termination step, transferring it to more harmful compounds (Eftekhari et al., 2020; Eftekhari et al., 2022).
Graphene oxide, reduced graphene oxide, magnetic graphene oxide, and magnetic reduced graphene oxide are different types of composites for removal of organic and inorganic pollutants from aqueous environment such as drugs, antibiotics, heavy metals, and dyes (Ghadirimoghaddam et al., 2021; Eftekhari et al., 2022).
Recently, two and three-dimensional nanostructures have been attracting considerable interest in a variety of applications (Novoselov et al., 2012; Karimi et al., 2022). Since these nanostructures have unique physicochemical features, 2D graphene has shown to be an interesting material capable of enabling the development of new science and technology (Meyer et al., 2007; Bai et al., 2011; Razmjou et al., 2020).
Some of the research studies addressed 2D graphene structures and derivatives for a variety of sectors and applications such as energy storage, sensors, and occasionally in medical and aerospace (Qi et al., 2018; Tajik et al., 2021). One benefit is the presence of negative functional groups that belongs to graphene oxide (GO) surfaces may be employed to remove heavy metals and cationic dyes generated by electrostatic interactions (Johra et al., 2014; Xiong et al., 2020; Jiao et al., 2022). Three-dimensional graphene (3D) is a key subject of study in order to take use of the unique chemical and physical properties of 2D graphene skeleton for a range of applications, including macroscopic applications. Because of its porous structure and the reach of active sites with huge surface area, in addition to its regeneration capabilities, 3D graphene is one of the most efficient adsorbents (Xu et al., 2020; Eftekhari et al., 2022). Crosslinking agents were utilized to improve the mechanical properties of 3D by causing different bonding and some gelation of graphene oxide sheets, which has the added benefit of allowing active functional groups to be attached to the 3D network and the development of interconnecting porosity channels (Dimiev and Tour, 2014).
Chitosan-functionalization is one of several surface functionalization procedures that are regarded to be a realistic way to increase adsorbent capacity and selectivity for sulfamethazine interactions. Several effects like pH, temperature, and initial SMZ concentration on the 3D GF-CS adsorption capacity were investigated, and the optimal experimental conditions were determined.
In this work, a sheet of graphene oxide was employed to create 3D GF-CS by crosslinked polymerization, which was subsequently functionalized with chitosan. TEM, SEM, Raman, TGA, and FTIR were used to characterize GO after it was synthesized and bonded to CS. The synthesized material was employed for sulfamethazine adsorption from aqueous solution and showed good adsorption capability as well as excellent regeneration. To add to the novelty of this study, Monte Carlo simulations and density-functional–based tight-binding (DFTB) were used to analyze the adsorption energies and how sulfamethazine adsorbs onto Graphene Oxide–Chitosan at various adsorption sites (3D GF-CS). Additionally, using density functional theory (DFT), the chemical reactivity (local and global) of the free drug was examined using the B3LYP and PBEPBE functionals with the 6-31+G (d, p) basis set. In addition, the free drug’s chemical reactivity (local and global) was examined using density functional theory (DFT), namely the B3LYP and PBEPBE functionals with the 6-31+G (d, p) basis set in gas phase and aqueous solution.
2 Materials and Methods
2.1 Chemicals and Materials
All chemical reagents and solvents used in this study were pure and analytical quality and were obtained from Sigma Aldrich in the United States. Chitosan (medium molecular weight), graphite powder, sulfamethazine, [4- amino -N-(4,6-dimethyl-2-pyrimidinyl) benzene sulfonamide, SMZ] (SMZ 99.0%), N-Hydroxysuccinimide (NHS), N-(3-Dimethylaminopropyl)-N′-ethylcarbodiimide hydrochloride (EDC) in 2-(N-Morpholino)-ethanesulfonic acid, 4-morpholineethanesulfonic acid (MES buffer), deionized water, potassium dichromate (KMnO4) (99%), sulfuric acid H2SO4 (96%), hydrogen peroxide H2O2 (35%), and hydrochloric acid (4%).
2.2 Synthesis of 3D GF-CS
Graphene oxide (GO) was synthesized using Hummer’s approach with modification (Emadi et al., 2017). A measure of 1 g of graphite solid was dissolved in approximately 23 ml of 96% (v/v) H2SO4 solvent and swirled in a three-necked flask for 36 h. The resulted mixture was chilled in an ice-water bath with addition of 5 g of potassium dichromate (KMnO4), causing the solution’s color to shift from black to dark green. Then, the mixture was transferred to an oil bath at 38–40°C with agitating it for half an hour before it was heated to 70°C for around 45 min. The solution’s color went from pale brown to dark brown. Then the suspension mixture was carried to a three-necked flask and dispersed with distilled water and heated to 105°C. After that, about 150 ml of distilled water with 15 ml of 35% (v/v) H2O2 were added to the solution to stop and end the process. The solution’s color was a yellowish-brown. The obtained GO was rinsed for 7 min using centrifugation at 11,000 rpm in the final phase. After the supernatant was removed, the precipitate was washed several times with 4% HCl (v/v), followed by deionized water. To synthesize GO-CS, an amidation method of GO with Chitosan (CS) together with EDC and NHS was employed (Khalaf et al., 2021a). An amidation technique of GO with CS in the presence of both EDC and NHS which they were used to synthesize GO-CS. To achieve a homogeneous colloidal mixture, 0.125 g of CS and 0.1 g of GO were sprayed in 25 ml of MES buffer (0.1M, pH adjusted to about 6) in a sonicator bath at about 25°C for 60 min. Under nitrogen gas and mixing 0.3 g of EDC with 0.4 g of NHS in the solution for 20 min, the suspension solution was sonicated and agitated for more than 20 h. At this point, a 0.2-micron nylon microporous membrane was used to filter the solution, and then washed with a 0.1 M acetic acid solution to eliminate some of the CS residues. The obtained solid was re-dispersed and dialyzed with DW at room temperature for 3 days (Khalaf et al., 2021b). We employed glutaraldehyde double-crosslinking and then hydrothermal with EDA working in both chitosan functionalization and cross-linking to establish the double-cross-linked chitosan-functionalized 3D graphene structures. This compound was used as an adsorbent and was labeled 3D GF- CS.
2.3 Analytical Characterizations of 3D GF- CS Networks
One of the most important instruments for characterization is the scanning electron microscope SEM) which was used to examine the morphology and surface of 3D GF-CS networks (SU8000 Hitachi, Japan). A spectrophotometer was used to record the Fourier Transform Infrared (FT-IR) spectra of the synthesized materials with a range between 4,000 and 400 cm−1 (FTIR-SHIMADZU, Japan, Model: FTIR-8700). Another important instrument is the Raman spectrometer model [laser Raman spectroscopy (NRS-5100)] nitrogen-cooled germanium diode detector and an ND: YAG laser producing an excellent NIR line at 532 nm was used for the analysis. To study the surface functional group of the synthesized polymer, X-ray photoelectron spectroscopy (XPS) together with a PHI Versaprobe 5000 Scanning XPS with a monochromated Al K X-ray source was involved. To calculate both the surface area and the volume pore, the Brunauer–Emmett–Teller of nitrogen operating at 77 K for adsorption/desorption isotherm was applied (Micromeritics, Norcross, GA, United States). The thermogravimetric analysis was studied using Thermal Analysis (TA instruments, United States) to examine temperatures ranging from 25 to 700°C in a nitrogen atmosphere. Finally, X-Ray Diffraction STOE q-q was employed with CuKa radiation and wavelength 1.5406 Å using a scintillation detector.
2.4 Batch Adsorption Experiments
Adsorption was used to assess the efficacy of SMZ removal from generated aqueous solution. A series of batch experiments were made in a 250 ml Erlenmeyer flask using a fixed SMZ concentration (50 mg L−1) and 50 ml volume and kept in a 180-rpm shaking incubator (OrbitexLett D, Scigenics) to investigate the effect of pH (4–12), temperature (15, 30, 35, and 45°C), and initial adsorbent amount (25–100 mg). A UV-vis spectrophotometer (U-2800 Hitachi Instrument, Japan) was applied to measure the concentration of SMZ in solution at 455 nm each time. In our calculation, we used a linear calibration equation curve between the absorbance and concentration of the SMZ solution. The equation was used to determine the new concentration of SMZ solution. The amount of SMZ adsorbed on 3D GF-CS (mg g −1) and % adsorption was calculated.
The SMZ adsorption behavior of the prepared 3D GF-CS networks was studied using Eqs 1–3 to calculate the adsorption capacity which is presented by q and has a unit of (mg. g−1); also, the removal efficiency is presented by η % and the adsorption rate which is denoted by r and a unit of (mg.g−1. min−1).
where Co (mg L−1) expresses the beginning of SMZ concentration in the prepared solution, while C of a unit of (mg L−1) expresses the residual SMZ concentration at any point throughout the adsorption experiment. The X coefficient is the adsorbent dosage (gL−1) that was placed in the solution, and finally, t is the time period (min).
All of the adsorption experiments were repeated at least three times to ensure the data’s validity and reproducibility, and the mean values were used to illustrate the results. The largest variation of repeated experiments was frequently less than 3%. Furthermore, to account for any SMZ that may have remained on the sides of the glass or other loss when the experiment was repeated several times and the control experiments were performed using the same batch parameters but without the adsorbent.
2.5 Adsorption Kinetics Studies
The kinetics and mechanism of SMZ adsorption on 3D GF-CS have been studied using pseudo-first-order and pseudo-second-order models (Hanbali et al., 2020a; Hanbali et al., 2020b). In separate 250-ml Erlenmeyer flasks, 50 ml of different beginning SMZ concentrations (50, 100, 200, 300, and 400 mgL−1) were created; then, specified adsorbate masses were added and incubated for 20 min at 25°C and 200 rpm. The linearized plot of the pseudo-first-order is expressed in Eq. 4 (Jodeh et al., 2021):
where k1 (min−1) denotes the pseudo-first-order rate constant, qt (mg g−1) the amount of SMZ adsorbed at time t (min), and qe (mg g−1) the amount of SMZ adsorbed at equilibrium. Plotting ln (qe−qt) vs. t provided the pseudo-first-order parameters k1 and qe (min). The pseudo-second-order model is expressed in Eq. 5 (Jodeh et al., 2018):
The constant qt (mg g−1) is representing the amount of SMZ adsorbed at time t, while the constant qe (mg g−1) is the value of SMZ adsorbed at equilibrium, and k2 (g mg−1 min−1) is the rate of adsorption constant. qe and k2 are calculated using the slope and intercept of the linear plot of t/qt values versus t. R2 value was found to find the optimum kinetic model.
2.6 Adsorption Isotherm Studies
Adsorption equilibrium tests were placed in 250 ml Erlenmeyer flasks with 50 ml of SMZ solution added at concentrations starting from 50–400 mg L−1 to examine the collision and compute the maximum adsorption capacity of SMZ on 3D GF-CS. The flask is generally incubated in a shaking incubator at 200 rpm and 25°C for around 24 h. The concentration of SMZ was measured using a UV–visible spectrophotometer. The adsorption isotherm was applied to both isotherms, Langmuir and Freundlich isotherms. The model of Langmuir isotherm, according to the literature, requires monolayer adsorption at limited sites that is energetically equivalent, with no interaction between surrounding adsorbed molecules (Massad et al., 2022). The linearized version of the Langmuir model is given in Eq. 6:
where the variable qm (mg g−1) is representing the maximum adsorption capacity during adsorption and the constant KL (L mg−1) is usually used for the Langmuir constant which expressed the adsorption capacity. Both constants qm and Kl were calculated using the slope and intercept of the linearized equations of the plots between Ce/qe and Ce. To assess whether or not the adsorption is favorable, the dimensionless separation factor (RL) was computed using Eq. 7.
If the value of RL is between 0 and 1, it means unfavorable adsorption; if RL = 0, it denotes irreversible adsorption; and if RL = 1, it denotes linear adsorption.
The Freundlich isotherm model, on the other hand, is often employed to simulate adsorption on heterogeneous surfaces. The linearity of the Freundlich isotherm model is represented by Eq. 8:
Kf is representing the Freundlich constant that defines adsorption capacity, and the value of 1/n is the heterogeneity factor. A favorable adsorption system has a n value greater than one. The values of Kf and n are usually measured by using both the slope and intercept of the linear plot of Ln qe vs. Ln Ce (Massad et al., 2022).
2.7 Adsorption Thermodynamic Study
To investigate SMZ adsorption on 3D GF-CS samples, thermodynamic parameters were employed in Eq. 9 was used to calculate the Enthalpy change (ΔH°) (kJ mol−1) and the change in entropy (ΔS°) (J mol−1 K−1) (Ferreira et al., 2017).
where Kc denotes the adsorption thermodynamic equilibrium constant, R represents the universal gas constant (8.314 J mol−1K−1) and T is the temperature (K).
Gibb’s free energy (kJ mol−1) was computed using the (H°) and (S°) values from Eq. 10:
2.8 Study of Reusability of 3D-GNf Networks
Desorption/adsorption generation was studied using batch tests. 50 ml of the best pH-adjusted SMZ solution with 100 mgL−1 SMZ concentration and 2.0 gL−1 adsorbent dosage was continuously shaken at 200 rpm and about 25°C to reach equilibrium. To avoid any unabsorbed SMZ remains, the 3D GF-CS was washed with DW many times after equilibration. To remove the adsorbed SMZ from 3D GF-CS, the concentrated adsorbent was washed with a solution of 1.0 M NaOH as eluent.
The adsorbent was rinsed with DW again before being utilized for SMZ adsorption to eliminate excess alkalinity. This study was repeated 10 times.
2.9 Computational Details
2.9.1 DFT Study
All computational studies in the current work were done using several series of Gaussian 09 software and then using density functional theory (DFT) (Carmona-Espíndola et al., 2015). Geometries of the SMZ medication were optimized using B3LYP (Yang and Wu, 2002; Geerlings et al., 2012) and PBEPBE (Wu et al., 2006; Peverati et al., 2011), functionals with the 6-31+G (d, p) basis set (Peng et al., 2016; Furness et al., 2020). The harmonic vibrational frequencies were found by computing analytical frequencies using the stationary points used to verify that the structure is minimum with no imaginary frequencies at the theoretical level.
For the computation of the electrical properties in this study, the Def2TZVP basis set was used (Weigend and Ahlrichs, 2005). The chemical reactivity (global and local) of the investigated medication was retrieved using the Multiwfn program (Lu and Chen, 2012). Within the DFT conceptual framework, key chemical characteristics that govern the global reactivity of the SMZ drug, such as several parameters including chemical potential (μ), hardness (η), electronegativity (χ), electrophilicity (ω), and softness (s) were defined as (Geerlings et al., 2003; Dimakis et al., 2021):
The abovementioned formulas and additional global reactivity indices may be expressed using a finite difference approximation and Koopmans’ theorem (Young, 2001; Jensen, 2017; Bethe and Jackiw, 2018):
The energies of both highest occupied and lowest empty orbitals are denoted by ∈H and ∈L, respectively. I and A represent the ionization potential (I = - ∈H) and electron affinity (A = - ∈L), respectively, as supported by Janak’s Theorem. Electron donating (ω−) and electron receiving (ω+) powers have been determined (Gázquez et al., 2007; Burke, 2012).
A higher value of ω+ indicates a system’s proclivity to take charge, whereas a lower value of ω− indicates a system’s proclivity to donate electrons. To compare ω+ with −ω−, the net electrophilicity has been suggested (Chattaraj and Roy, 2007):
Δω± refers to the electron absorbing power in comparison to the electron providing power. The condensed Fukui functions may also be used to calculate the reactivity of each atom in a molecule. The expressions that represent these functions are as follows:
where qk is the gross charge of the molecule’s atom k. The condensed Fukui functions were computed with the Multiwfn program, beginning with single-point calculations of the systems N, N-1, and N + 1 electrons using the Def2TZVP basis set at the optimal structure obtained with the 6-31+G (d, p) basis sets.
Even better, Ayers et al. (2007), Cárdenas et al. (2009), Morell et al. (2013), and Wang Y. G. et al. (2019) introduced a local reactivity descriptor (LRD) known as the dual descriptor (DD) f (2) (r), which is as follows:
2.9.2 DFTB
The DFTB + software tool was used to perform all density-functional–based tight-binding (DFTB) calculations (Aradi et al., 2007; Hourahine et al., 2007; Hourahine et al., 2020). DFTB+ is a complete open-source software suite that allows for fast and efficient atomistic quantum mechanical simulations. It enables reasonably accurate simulations of huge systems and long timescales and at the same time significantly faster than the used ab initio methods by applying different density functional theory (DFT) approximations, like the density-functional–based tight-binding (DFTB) and also the extended tight-binding method (Hourahine et al., 2020). When it comes to organic matter, insulators, solids, clusters, semi-conductors, and metals, DFTB is efficient and exact; it is also relevant to biological systems. We used the 3OB–Koster library set to calculate the possibility of interaction and collision between the pairs of C, N, O, H, and S. The convergence tolerance was found to be 0.01 kcal/mol for energy, 0.1 kcal/mol for force, and finally the displacement was 0.001. Figure 1 illustrates the model of the 3D GF-CS. The model has oxygenated functional groups (-OH, epoxy, and COOH) and also three side grafted chitosan chains.
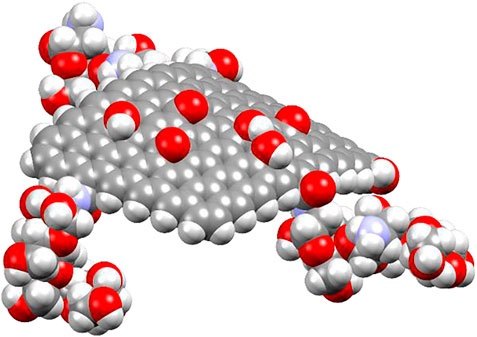
FIGURE 1. Optimized geometry of the 3D GF-CS model.
As indicated in previous work (Berisha, 2021), the following equation was used to calculate the adsorption energies Eads for all systems:
where E3D GF-CS |SMZ represents the total energy of the 3D GF-CS and adsorbed SMZ molecule, E3D GF-CS represents the energy of a clean 3D GF-CS surface, and ESMZ represents the energy of an isolated SMZ molecule. Under this concept, a negative value of Eads belongs to an almost stable adsorbate–substrate system.
2.9.3 Monte Carlo Calculations
In the simulated adsorption environment, Monte Carlo (MC) calculations are utilized to investigate the interaction between SMZ and the modeled 3D GF-CS surface. The 3D GF-CS surface, 1 SMZ, and 3,500 water molecules were used in the MC computations. For the simulations, MC (Monte Carlo) computations, the widely known COMPASS III forcefield was utilized (Ljungberg et al., 2012).
3 Results and Discussion
3.1 Characterization
3.1.1 FT-IR Analysis
As shown in Scheme 1 CS was attached to GO by amide linkage between both carboxylic acid of GO and the amine groups of chitosan by adding both EDC and NHS using MES buffer. In this case, the EDC activated the carboxylic acid groups in the GO and the NHS giving stability for the ester between GO and CS. The active ester that gained stability will react with the amine groups that are attached to CS establishing an amide group (Bao et al., 2011). As well, an extra amount of CS was added to degrade the excess carboxylic groups of GO, and the excess of unreacted CS was removed throughout filtration. GO, CS, and 3D GF-CS were characterized by FT-IR, and the results are shown in Figures 2A–C. The spectra of GO show peaks at 1,300, 1,633, 1740, 2,900, and 3,430 cm−1 which are corresponded to different oxygen-containing functional groups corresponding to the C–O–C stretching vibrations, C–OH stretching, C–C stretching mode of sp2 carbon skeleton, C–O stretching vibrations of the –COOH groups and OH stretching vibration bonds respectively. The FTIR spectra of CS show a peak at 3,445 cm−1 corresponding to N–H stretching vibration of amino group, a peak at 1,645 cm−1 corresponding to the C=O stretching vibration of amide, and a peak at 1,550 cm−1 corresponding to N–H bending of–NH2. The FT-IR spectra of the 3D GF-CS show a combination of characteristics peaks of CS and GO the intensity band of N–H deformation of amino group, a peak at 1,550 cm−1 was weakened compared to CS, and the peak carboxylic acid of GO at 1,740 cm−1 was weakened due to crosslinking reaction. On the other hand, a new peak was observed at 1,640 cm−1 as an indication of an amide linkage formation and new covalent functionalization between carboxylic group of GO and amine in CS (Ramya et al., 2016).
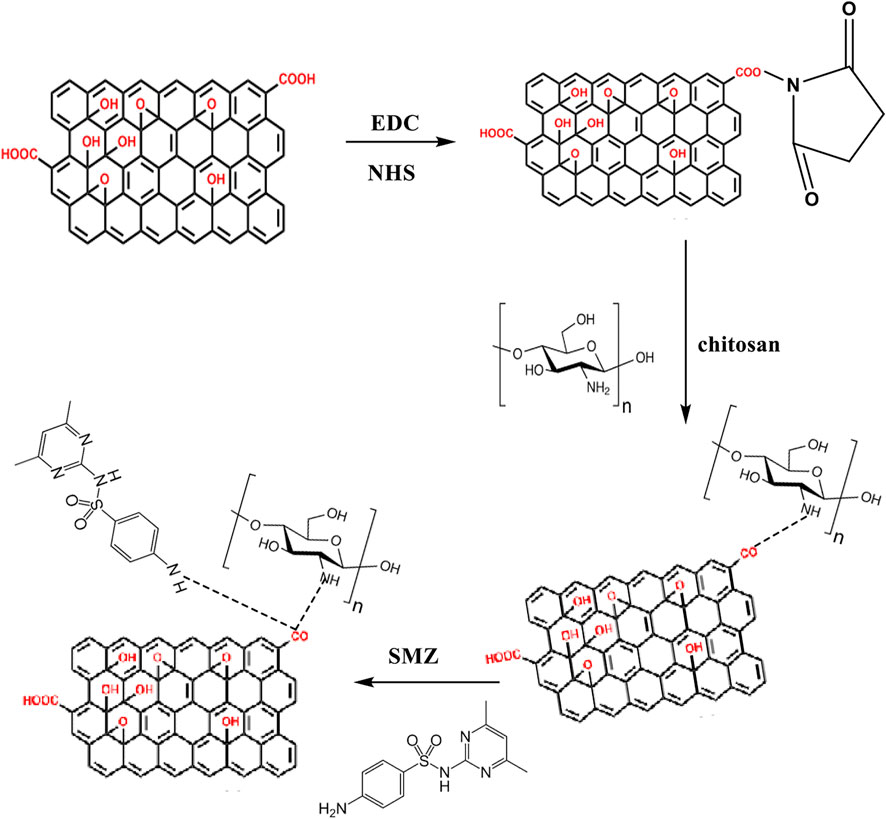
SCHEME 1. Synthesis of 3D GF-CS.
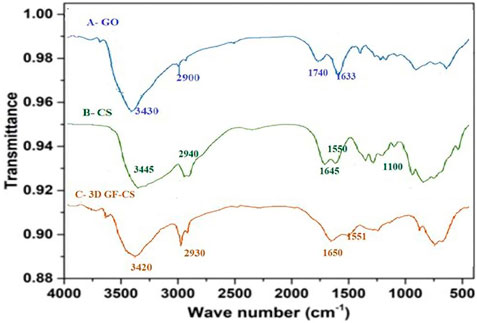
FIGURE 2. FTIR spectra of GO (A), CS (B), and 3D GF-CS (C).
3.1.2 SEM Analysis
The morphologies of synthesized 3D GF- CS were characterized and studied using SEM technique. As shown in Figure 3, the multilayer of graphene which looks wrinkled and silky-like proved the obtained production of the GO. From SEM morphology of the 3D GF- CS showed well attached and organized micro and mostly mesoporous surfaces and structures with more chances to make functionalized channels. At the same time, the three-dimensional porous network of the fabricated GO/CS skeleton was achieved throughout reorientation of chitosan while functionalization with graphene, and thus, 2D graphene matrix was not established. We obtained a 3D network with an acceptable specific surface area and reasonable number of active sites with hierarchically ordered pore size distribution (Karandish et al., 2018; Sobhan Ardakani et al., 2020).
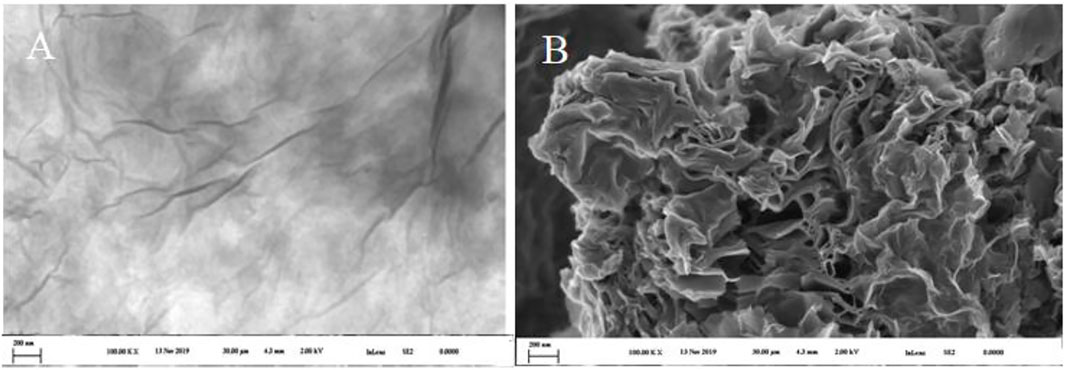
FIGURE 3. SEM for the GO (A) and 3D GF-CS (B).
3.1.3 Raman Spectrum
In several studies as in ours, the Raman spectrum of GO layer has bands marked as D, G, and 2D bands and shown in Figure 4. The first-orders of the D and G peaks consist of the vibrations of sp2 carbon shown at around 1,344 and 1,597 cm−1, respectively. The D-band reveals the disorders of crystalline materials and the defects associated with and accompanied by vacancies and grains (Lu et al., 2009). It is clear that both shape and the position of the D peak shift as the thickness of graphene oxide changes. That shift and shape of D-band which we call 2D appeared around 2,697 cm−1 and this has to do with the graphene layers. The G peak is caused by the stretching of sp2 carbon pairs in both rings and chains. In summary, both graphene oxide and 3D GF-CS have two major peaks appeared at 1,348 and 1,588 cm−1, which represents both the D and G bands of the nanomaterials of based carbon. In this case, the ratio of sp3/sp2 which belongs to the hybridization of carbon ratio of the polymer usually represents the degree of disorder and randomness and can be present during the intensity and the ratio of the two bands D and G (Li et al., 2013).
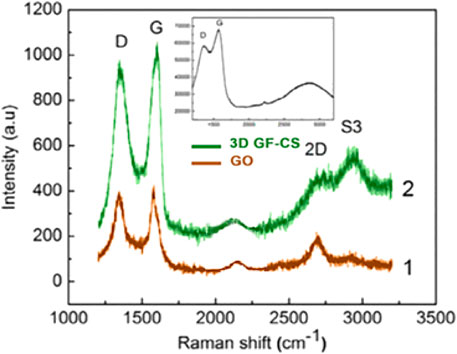
FIGURE 4. Raman spectra for 3D GF-CS.
3.1.4 X-Ray Photon Spectroscopy (XPS)
In this study, XPS was used to investigate the elemental contents of 3D GF-CS, CS, GO, respectively. As in the spectrum is shown in Figures 5A–C from the figure which shows that the C1s XPS spectrum has four kinds of carbon and is represented by different valences. For C 1s peaks that belong to GO like C=O, C-O, and O-C=O were shown at 283.9, 287.6, 287.2, and 288.9 eV. These four kinds of carbon exist in the functionalized graphene oxide. Figure 5B also shows different intensities ratios for the C1s of the XPS spectrum of the 3D GF-CS. The polymer chitosan showed an extra component at 286.1 eV representing the bond of carbonyl (C-N). Clearly, it shows that the intensity of peaks which is representing the carbon that has been oxidized in the 3D GF-CS was very small and the ratio of C/O atomic is clearly increased to 4.7, showing that major of the epoxide in addition to the hydroxyl groups almost not existed after chemical reaction with chitosan, leading and showing the GO was successfully improved (Fan et al., 2008). The peak of π – π* transition occurred in the basal plane during some chemical retention of the C1s peaks which belongs t O-C=O at 288.9 eV for the 3D GF-CS. From these obtained intensities, one can find any atomic percentile that can be calculated after functionalization. The summary of quantitative analysis for these intensities is reported in Table 1 with the levels of oxygen and nitrogen.
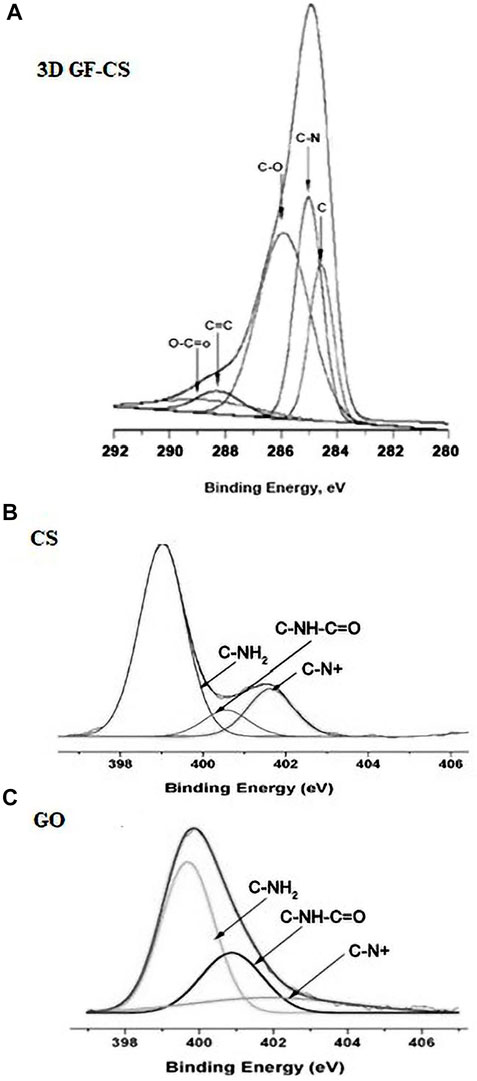
FIGURE 5. Spectra of XPS of (A) 3DGF-CS, (B) CS, and (C) GO.
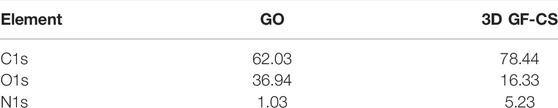
TABLE 1. Atomic composition of graphene oxide and functionalized with chitosan 3D GF-CS.
3.1.5 BET Analysis
The nitrogen adsorption/desorption isotherm technique from 3D GF-CS was used to determine the SBET values along with the pore size of the distributions for the polymer. Figure 6 shows the physisorption isotherms of the polymer for nitrogen. The physicochemical parameters obtained from these isotherms were summarized in Table 2. Both adsorption/desorption isotherms of 3D GF-CS nitrogen correspond to the IV-type adsorption isotherm with a hysteresis loop, which may be caused by the mesoporous content of the polymer. We also noted the remarkable increase in the low P/P0 region, which indicates the existence of microporous sites in the polymer.
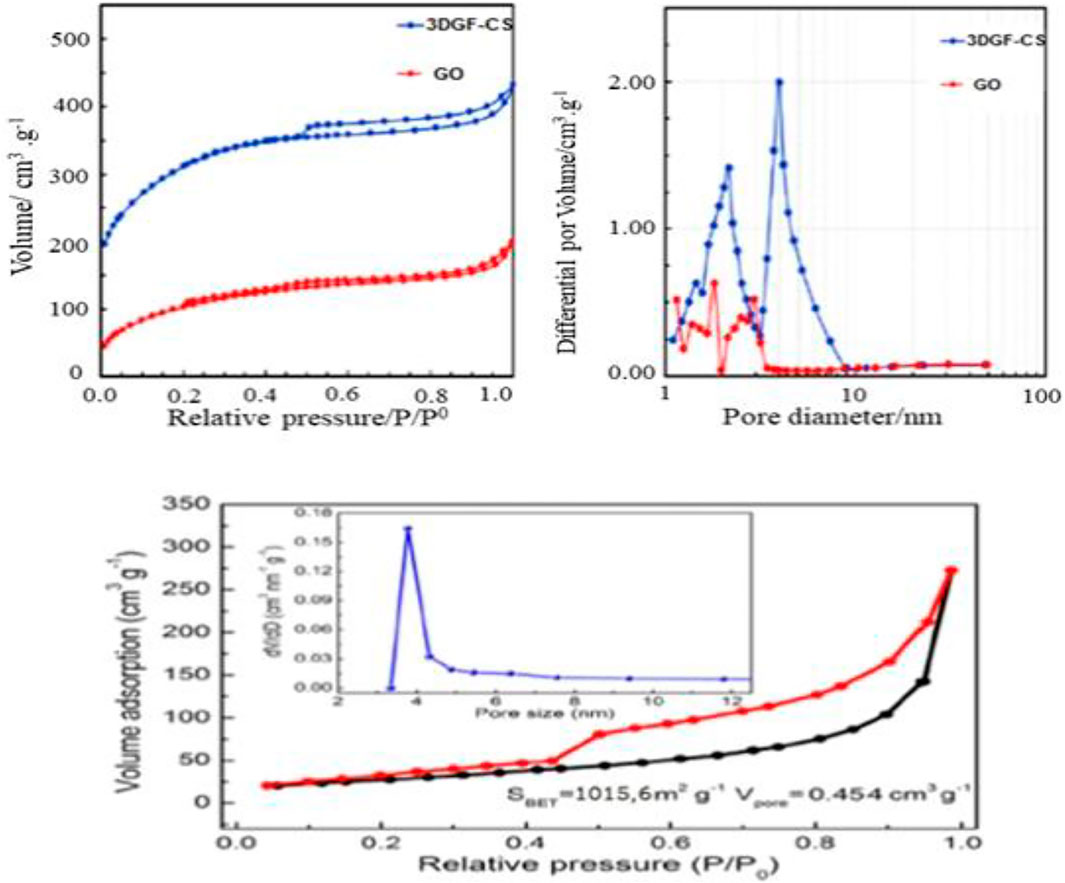
FIGURE 6. Nitrogen adsorption and desorption isotherms of 3D GF-CS.

TABLE 2. Physiochemical parameters obtained from XPS scan and nitrogen adsorption/desorption isotherm curves.
From Table 2, we can see that the 3D graphene framework networks formed are due to the hydrothermal self-assembly and the attachment of the chitosan functional groups on the graphene surface causes an increase in the specific surface area. The high 3D surface area of GF-CS can be attributed to a large number of amino and carboxyl groups in the chitosan molecule. After functionalization with GO, new groups were introduced into the compound, resulting in an increase in surface area. This functionalization also caused ion exchange and van der Waals force of adsorption on the inner and outer layers of the surface of the composites. All these factors lead to BET-specific areas of the material increased out (Liu et al., 2019). From the PSD curves of the samples (Figure 6), the 3D polymer GF-CS was hierarchical and contained both microporous and mesoporous polymer. Moreover, the specific surface area increased from 187 m2 g−1–1,016 m2 g−1 due to the restructuring of the GO sheets and layers that form the 3D scaffold and prevent agglomeration. When we obtain higher SBET values, we usually have more active sites, which results in 3D GF-CS having a very high adsorption capacity. The total pore volume was found to be 1.060 cm3 g−1 and the adsorption capacity is also increased.
On the other hand, the mesoporous compound has a large pore volume and the chitosan backbone contains amino groups, which become positively charged NH3+ adsorption sites in water. GO was not oxidized in the π-π-conjugate, which increases the active adsorption site and increases the surface area, resulting in the mass transfer of SMZ spreading in the solution and then adsorbing on the adsorbent surface. The pore volume of 3D GF-CS decreases to 0.45 cm3 g−1, which means that the reaction of chitosan and GO does not destroy the graphene skeleton structure. The whole process is based on 3D graphene (Wang et al., 2020; Zandipak and Sobhanardakani, 2018).
Nitrogen adsorption/desorption was also used for porosity analysis. As shown in Figure 6, both the BET surface area and pore volume of 3D GF-CS are 1,015 and 0.45 cm3 g−1, respectively. The main size of the pores is 3.8 nm, as indicated in the inset of Figure 6.
3.1.6 Analysis by X-Ray Diffraction
X-Ray diffraction (XRD) was used to study the crystalline and lattice structure of 3D GF-CS. Figure 7 shows structure after the functionalization of GO with CS. From the figure, the XRD for the GO (crystal plane [001] is 2 θ = 9.839° this is an indication for the oxygen-containing groups on the edges of each layer, therefore the distance increased between inter layers with pacing around 8.3 A°. Pure chitosan has two peaks are 2 θ = 10° and 2 θ = 20°. when a functionalization happened between GO with CS the peak of [002] was shown at 2θ = 26.568° which means that the interlayer distance of the 3D GF-CS was almost increased and caused a d-spacing of about 3.67 A°. Moreover, it showed that the 3D GF-CS exhibited an amorphous structure which was also found by the XPS. In summary, the conversion of graphene oxide to 3D-GF and the orientation of the crystal structure of the enlarged graphene (3D-GF) were formed. This was also confirmed by the appearance of the (002) diffraction peak at 25.5° and the removal of the (001) peak at about 9.839° in XRD pattern (Dreyer et al., 2010).
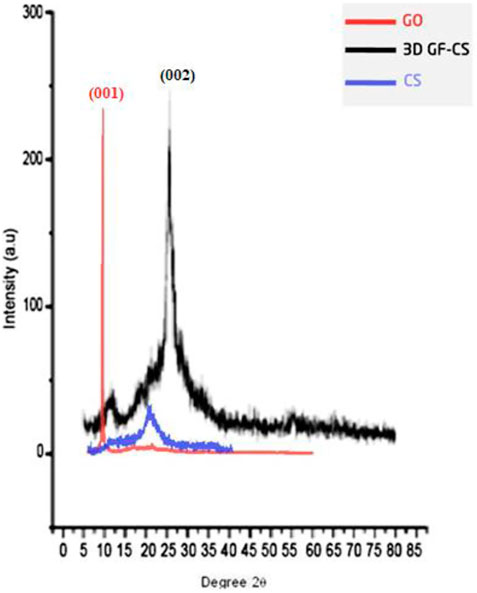
FIGURE 7. XRD of CS, GO, and 3D GF-CS.
3.1.7 TGA Analysis
Thermogravimetric analysis (TGA) is one of the most important analyses for the polymer and was performed under nitrogen conditions using a TA instruments Q50 with a heating rate of 10°C min−1.
Thermogravimetric analysis Figure 8 of pure chitosan, pure GO, and 3D GF-CS showed weight loss values of 15, 25, and 20%, respectively, between temperature ranges below 1,500°C due to water evaporation. The GO mainly shows high weight loss which is thermally unstable. This high weight loss is related to water evaporation and hydrophilic nature in the first phase of weight loss. The second weight loss between 200–300°C is due to the presence of oxygen functional groups, which reduce the thermal stability and π-stack structure. Due to the oxidation product of GO, which has a layered morphology with some oxygen functional groups, the van der Waals forces between these layers are weakened and some of the hexagonal carbons consisting of some basal planes present inside the prepared multilayer stacks of GO are disrupted. This leads to decomposition of hydroxyl, epoxy, and carboxylic acid functional groups on the surface and loss of other functional groups such as sulfate groups and water molecules in the interlayer at higher temperatures between 300°C and 400°C. This leads to the production of steam, CO, and CO2. The last phase of decomposition at higher temperatures above 400°C is related to the decomposition of phenols and carbonyl and unstable carbon radii in the structure and combustion of the carbon skeleton.
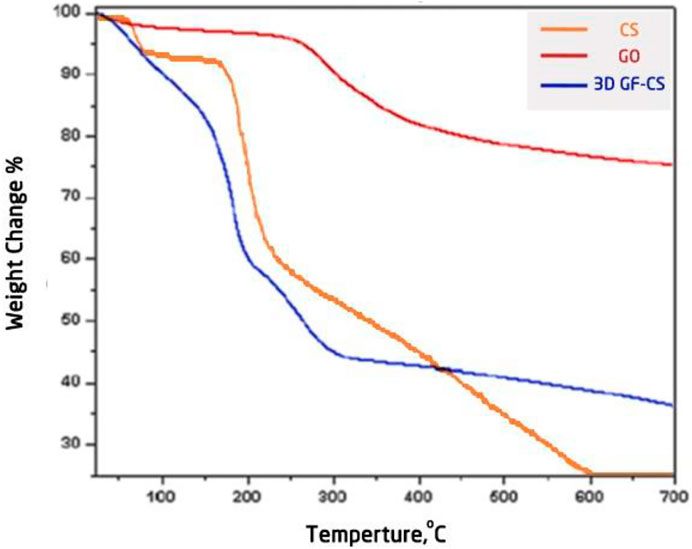
FIGURE 8. Thermogravimetric analysis (TGA) thermogram of Cs, GO, and 3D GF-CS.
On the other hand, most of the weight loss of pure chitosan is observed in the temperature range between 200°C and 300°C, which is due to the decomposition of the hydroxyl and amino groups in the compound. At temperatures above 300°C, this is due to the combustion and decomposition of the carbon skeleton (Akhavan and Ghaderi, 2013).
Meanwhile, the 3D GF-CS seems to be more thermally stable and effective because the combination of GO and chitosan exceeds 400°C, so the stages of decomposition earlier are similar to those shown on GO. The results showed a loss of 42% of most hydroxyl groups and epoxides after functionalization with chitosan. The other weight loss of 14% under 340°C was due to loss of degradation and accumulation of the chitosan ring and may also be due to residual functional groups on the 3D GF-CS polymer. Thus, thermal stability can be illustrated by electrostatic attraction and hydrogen bonding, which impede the movement of the chitosan chain through the dispersion of GO. Moreover, the conformation of the polymer molecule is more constrained than the intermolecular forces, resulting in higher thermal stability (Akhavan and Ghaderi, 2013).
3.2 Effect of Parameters on SMZ Removal Efficiency
In order to study the removal and adsorption process of SMZ onto graphene (3D GF-CS), several parameters were studied including the effects of adsorbent dose, pH, and temperature on SMZ removal efficiency in aqueous solution.
3.2.1 Effect of 3D GF CS Dosage
The effect of 3D GF-CS dosage on SMZ adsorption with an initial SMZ concentration of 50 mg L−1 at 27°C and 120 min of incubation is shown in Figure 9A. SMZ removal efficiency was directly proportional to the increase in graphene dosage in the SMZ solution. This has to do with the increased numbers of available adsorption sites on the polymer surface which is coming from the increased dose of adsorbent No major change in removal efficiency was observed when the graphene amount was raised from 50 to 150 mg. This might be due to the saturation of all the available adsorption sites with SMZ. Also, particulate interaction like aggregation usually results from a high sorbent dose that causes a decrease in total surface area thus negatively affecting the removal rate.
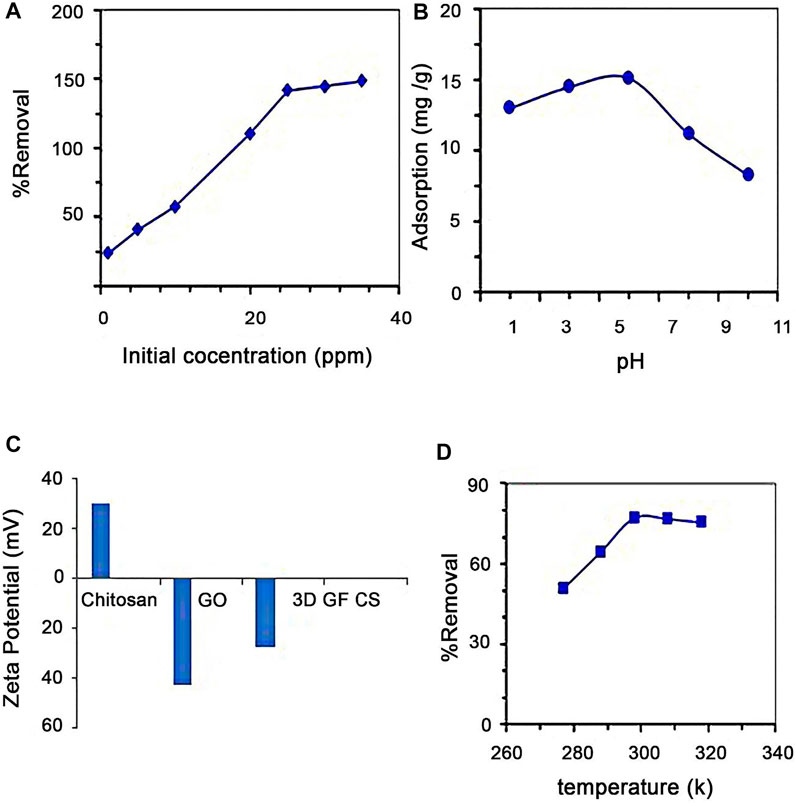
FIGURE 9. Effect on the removal of SMZ (A) SMZ initial concentration, (B) pH, (C) zeta potential, and (D) temperature using 3D GF-CS.
3.2.2 Effect of pH
The studied effect of pH (Jianlong et al., 2002; Shen et al., 2015; Wang and Wang, 2016; Danalıoğlu et al., 2017; Tang and Wang, 2018; Wang and Wang, 2018; Zhuang et al., 2019; Wang and Wang, 2019; Wang and Zhuang, 2019) on the removal and adsorption of SMZ onto graphene at a constant concentration of SMZ (50 mg L−1) and a fixed amount of adsorbent (50 mg) at 300 rpm and 26°C is shown in Figure 9B. Adsorption nature is always considered to be highly dependent on the pH of the SMZ solution. The removal efficiency of SMZ increased with the increase in pH. At higher pH, the polymer exhibits a negative surface charge that favors adsorption due to strong electrostatic attraction forces between the graphene and SMZ.
As mentioned before, the pH value showed a great effect on the adsorption and controls the dissociation degree of the surface of SMZ. In addition to that, the pH is very important for solubility and producing sulfamethazine. The shapes in which sulfamethazine exists were dependent on the pH values with two dissociation constants of 2.36 (pKa, 1) and 7.48 (pKa, 2). SMZ can be anionic or cationic depending on (Akhavan and Ghaderi, 2013). The highest adsorption capacities usually exist when SMZ is in neutral form. When decreasing pH, some parts of neutral SMZ decreased while the anionic SMZ starts increasing. Another thing is due to the huge amount of hydrophilic and may be hydrophilic groups that exist on the surface of the polymer making sulfamethazine to be removed by hydrophobic character using these functional groups. From literature and previous studies, sulfamethazine is mostly deprotonated at around pH above 7 making it a negative ion in the solution. As a result of electrostatic repulsion between SMZ and the presence of the negative charge on the polymer, this will lead to a decrease in the adsorption. The adsorption of sulfamethazine on the polymer will be increased at the beginning and then decreased for pH in the range between 3 and 10 as shown in Figure 9B. From the Figure 9B at pH of fewer than 5.0, adsorption starts increasing slowly. This may be explained due to the presence of severe adsorption with the proton H+, leading to a decrease in adsorption. During the increase of pH, the current type of adsorption was decreased while SMZ adsorption has been increased. The presence of weak deprotonating of amidogen on SMZ makes the adsorption increase. It is also; clear that pH between 5.0 and 7.0, SMZ there is a protonated neutral molecule. This can be explained as a result of the presence of the electron of benzene which can be drawn by the amide and sulfonic of neutral SMZ which becomes a π electron acceptor causing greater adsorption. The proportion of anion on the sulfamethazine usually increased at pH above 8.0, leading to an increase in the electrostatic repulsion and at the same time inhibiting the hydrophobic collision between neutral Sulfamethazine and graphene (Ghadirimoghaddam et al., 2021).
The zeta potential of GO is in the range of −30 mV to −35 mV in neutral pH which is an indication of oxygen repulsion forces between each other, forming a stable aqueous dispersion.
On other hand, CS zeta potential has a positive charge because of the amino groups; meanwhile, the hydroxyl group’s forms hydrogen bonds with water.
The addition of GO to CS decreases positive zeta potential of CS because of neutralization with negative charge of GO between amino groups in CS and carboxylic groups in GS (Figure 9C). Lowering the zeta potential values indicate a higher degree of cross-linking and thus the reduction of amino groups. The 3D GF-CS impaired the positive charge on the surface; this can be explained to cross-linking-function of negatively charged oxygen groups (Yan et al., 2017).
The pH of zero charge for 3D GF-CS usually ranges between 2.2– 6 (Wang J. et al., 2019; Lai et al., 2019). In the acidic condition, the composite adopts an overall positive charge, which is can be related to the protonated chitosan (NH3+) group repel cations. Meanwhile, when the pH increases the composite exhibits negative charge because of generation of –COO− and NH2 groups leading to more electrostatic interactions, and the cations will be eliminated from the solution phase. As pH further increases, it leads to increase in the ionic strength in the solution and thus reduces the adsorption efficiency (Wu et al., 2017).
3.2.3 Effect of Temperature
The effect of temperature of solution on the removal efficiency of SMZ of 3D GF-CS was investigated in the range of 15–45°C. In the case of both 15 and 25°C there was slight change in removal efficiency when the temperature was lowered from 25 to 15°C during the increase in concentration from 10 to 30 mg/L, as shown in Figure 9D.
This may be happened due to the increased rate of diffusion of the SMZ molecules during the increase in temperature. To conclude, the adsorption process was almost exothermic and this makes the adsorption more favorable when the temperature is low.
3.2.4 Adsorption Kinetics
Adsorption kinetics is usually studied to understand the behavior of the adsorption rate with time. From the study, the adsorption kinetics curves of the 3D GF-CS at 25°C in Figures 10A–C show an increase in adsorption when the time increases and equilibrium at 120 min has been reached. The adsorption process can be summarized in two stages: one stage is fast (0–80 min) at first, with adsorption quantities were 65.2%, and the second stage with 83.1% of the equilibrium adsorption quantity (4.14 mg/g and 14.73 mg/g for the second stage). The adsorption capacity showed linearity with time, while it slows down due to the surface-active sites of the polymer being occupied. The two stages of the adsorption process of SMZ can be explained as follow: During the fast stage, the dispersion of SMZ was high in water, and this will cause SMZ to diffuse rapidly into the active sites of the polymer. After that, SMZ was spread into internal pores of the polymer, and this will encourage the mass transfer struggle over time during the slow reaction stage. It has been known that adsorption rate is related to the adsorbent properties as pH and usually slows down with time so it reaches equilibrium. To understand the kinetic process of adsorption, three models have been applied to the study of SMZ on the polymer surface.
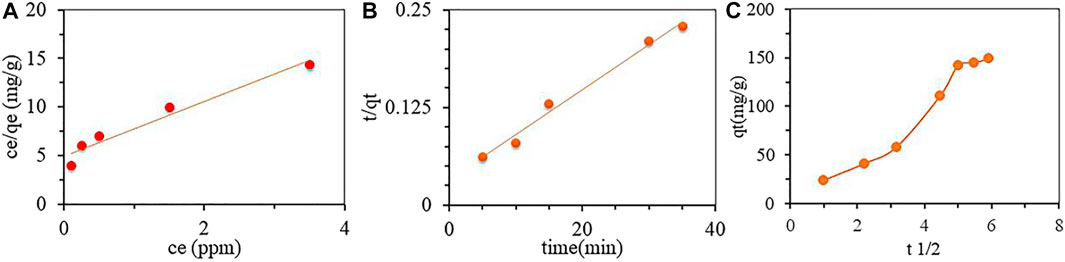
FIGURE 10. Adsorption kinetics of SMZ using 3D GF-CS (A) pseudo-first-order, (B) pseudo-second-order, and (C) intraparticle diffusion.
The following equations are representing the following models (Tan and Hameed, 2017):
The parameters qe and qt (mg/g) are representing the amounts of SMZ adsorbed per unit mass of the adsorbent during equilibrium and measuring time t (min). The coefficients k1 and k2 (g/mgmin−1) are usually expressed and present the pseudo-first-order and pseudo-second-order adsorption rate constants while k3 [mg/(gmin1/2)] is usually used for the rate constant of the intra-particle diffusion model and is usually related to the particle diffusion coefficient D, and K = (6qe/r) (D/π)1/2 and r is the particle radius.
The studies of both pseudo-first-order and second-order are summarized in Figures 10A,B, and Table 3. From the Table, pseudo-second-order shows more suitable fitting of the adsorption and the adsorption process on the prepared polymer with a correlation coefficient of R2 > 0.999. Also, the qe calculated values (qe cal.) were near the experimental values (qe exp.), suggesting that the adsorption follows pseudo-second-order and the rate was depending on the square of the pollutant concentration.
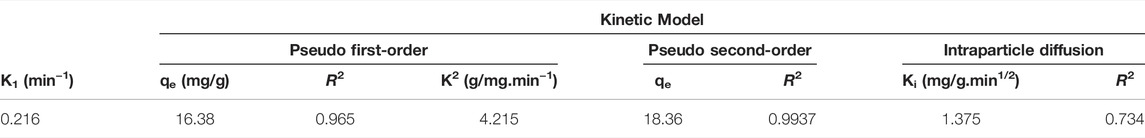
TABLE 3. Adsorption kinetics of SMZ using 3D GF-CS.
We have to discuss and see if the chemical reaction will be considered as limiting factor of the removal of SMZ and to check if it was affected by the interaction and collision between adsorbent and adsorbate and also the exchange of electrons (Tan and Hameed, 2017). Researchers use the pseudo-first-order kinetic equation usually to study the behavior of the dynamics of the initial process and this sometimes has effects on the application process. On the other hand, the equation of pseudo-second-order model describes three stages of the adsorption behavior process membrane and internal diffusion besides the surface adsorption (Kadiri et al., 2021).
To help us understand the kinetics process more, the intra-particle diffusion model was used to estimate the major controlling parameters that represent the adsorption rate during the adsorption process. Figure 10C summarized the results.
Both adsorption and diffusion experiments of SMZ on the polymer can be discussed using three stages as presented in Figure 10C. In first stage, we can see that adsorption rate at the beginning was high as a result of the adsorption on the surface of the polymer. In the second stage, there is process of intra-particle diffusion that happened and it was rapid while SMZ is slowly adsorbed onto the polymer, and seeing that the rate constant of adsorption is almost gradually decreased. For the final stage, both the characteristics of the boundary layer and at the same time, the mass transfer of the resistance of SMZ increased, and this lead to slowing of intra-particle diffusion. While looking at fitting equations for all noticed stages, the plotted data did not go through the origin of the plotted coordinates and this can lead to understand that intra-particle diffusion may not be considered to be the only step that controls and explain both adsorption rate and process and to see if it was affected by other parameters including membrane diffusion and may be surface adsorption.
As shown in Figures 10A–C and Table 3, pseudo-second order model showed better fitting with the data used to study the adsorption kinetics of SMZ and gave correlation coefficient (R2) value of 0.99 for 3D GF-CS as seen in Table 3. Another result is that the values of qe calculated and the experimental values (qe exp.) were much closed. This is very supportive for previous studies that showed pseudo-second-order kinetics for SMZ adsorption on 3D GF-CS support the presence and the function of chemisorption as the rate-limiting step caused by the use of physicochemical interactions between the two phases.
3.3 Adsorption Equilibrium Isotherm
The adsorption equilibrium is obtained when using a constant temperature; there is a remarkable distribution of SMZ in the solution and onto the adsorbent surface in a way, there is complete adsorption. We studied the isotherms to help understand the behavior and capacity of adsorption systems (Zhu et al., 2020).
There are several isotherm models that are always used to fit the experimental data and all of them are based on assumptions. The adsorption isotherm of SMZ on the polymer was studied using both Langmuir and Freundlich models, as shown in Supplementary Figure S1. Table 4 shows all parameters for the isotherm models. From our results, the Langmuir model showed R2 value of 0.985 compared to Freundlich model with R2 value of 0.8127. For Freundlich the value for the n was >1 which predicts favorable adsorption conditions. Since the adsorption isotherm fit Langmuir model much better this indicates that the surface sites on 3D GF-CS are homogeneous and the adsorption of SMZ is typically monolayer adsorption. The maximum monolayer adsorption capacity qmax was found to be 112.36 mg g−1 (Eftekhari et al., 2018). Other facts are Rl was less than 1 showing the adsorption was favorable. The adsorption capacity of 3D GF-CS into SMZ has shown acceptable adsorption capacity as indicated in Table 4.
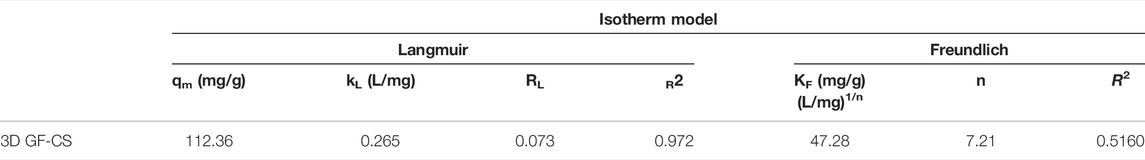
TABLE 4. Langmuir and Freundlich isotherm model parameters for the adsorption of SMZ by 3D GF-CS.
3.4 Thermodynamic Analysis
Different temperatures (i.e., 288, 298, 308, and 318 K) were used to study the thermodynamics parameters of the adsorption of SMT by the polymer and the results are summarized in Table 5. While the temperature was increasing, a decrease in the value of ΔG was noticed. The negative values of ΔG at all temperatures indicate that the adsorption of SMT by the polymer was a spontaneous process. A physical absorption was noticed from the values of ΔG that lie in the range of −24.76 to −27.1 kJ/mol. On the other hand, the values of ΔH were found to be negative suggesting an exothermic process of the adsorption. Finally, the positive values of ΔS showed the randomness and the stability of the adsorption process (Eftekhari et al., 2020).
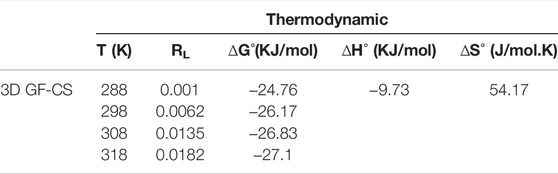
TABLE 5. Thermodynamics parameters of SMT adsorption by 3D GF-CS.
3.5 Evaluation of Reusability of 3D GF-CS Networks
To evaluate the process of desorption and regeneration studies of adsorbent (3D GF-CS) and how many times the adsorbent can be used without losing efficiencies, a batch of adsorption experiments using the found maximum removal parameters, the removal or desorption and regeneration experiment was studied. The polymer was recycled for 10 continuous adsorption and desorption cycles, and it shows the removal and desorption efficiency was decreased from 94.84 to 89.60% which indicates that the adsorbent can be regenerated with confidence for several uses (Supplementary Figure S2).
3.6 DFT Results
3.6.1 Free Drug
The geometry of the SMZ drug was optimized at the B3LYP and PBEPBE methods using 6- 31+G (d, p) basis sets in the gas phase and aqueous solution. The harmonic frequency calculation was used to ensure that the optimized geometry obtained is a minimum point in the PES since no imaginary frequency (negative frequency) was obtained. The optimized geometries at B3LYP/6-31+G (d, p) level of theory is shown Supplementary Figure S3. From the geometry optimization calculations, the Frontier molecular orbitals (HOMO and LUMO) are directly obtained and also shown in Supplementary Figure S3. Examination of the FMOs is essential to get the first appreciated information about the global and molecular chemical reactivity of the drug (Kadiri et al., 2021). The energies of FMOs and the energy gap of the investigated drug are listed in Table 6.
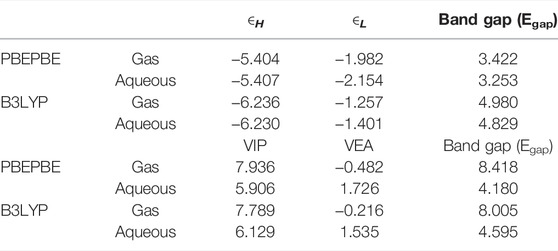
TABLE 6. ∈H, ∈L, and band gaps of the SMZ drug calculated by B3LYP and PBEPBE methods 770 with the 6-31+G (d,p) basis set. The calculation takes place in the gas phase and in an aqueous solution using the PCM solvation model.
Supplementary Figure S3 shows that the HOMO is mainly localized on the aniline sulfonamide framework, with little delocalization on the pyrimidine moiety. As can be seen in Supplementary Figure S3, the nitrogen atoms (N20 and N21) in the pyrimidine ring are partially contribute to the HOMO of the molecule, which indicates that sulfonamide group (NH-SO2−) group, which acts as electron-withdrawing group reduces the electron density on the N20 and N21. Therefore, the molecule can use these parts to get adsorbed on the adsorbate surface through the electron donation interaction. On the other hand, Supplementary Figure S3 shows that the LUMO of ZMS drug is mainly localized on the dimethyl pyrimidine moiety, which indicates that this part of the molecule is responsible to receive the electrons from the graphene adsorbent and, consequently, getting adsorbed on the adsorbate surface via back-donation interaction. These results are also confirmed when the electrostatic potential map is considered (Supplementary Figure S3).
As can be seen in Table 6 and Supplementary Figure S3, the band gap of the SMZ molecule as calculated by the difference between the ∈H and ∈L or by the difference between VIP and VEA using the B3LYP and PBEPBE methods is much higher in the gas phase than in the aqueous solution. These results show that the drug molecule is more reactive in the aqueous solution than in the gas phase, and therefore, its ability to interact with the adsorbent is higher in the aqueous solution than in the gas phase (see Supplementary Figure S4 and Table 7).
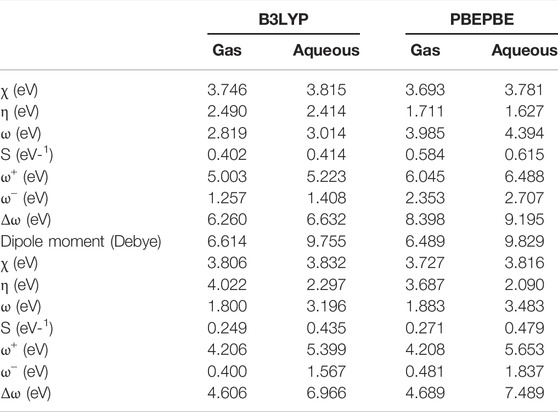
TABLE 7. Global quantum chemical descriptors of the SMZ drug calculated using the B3LYP and PBEPBE methods with 6-31+G (d,p) basis sets in the gas phase and aqueous solution. The upper part of the Table corresponds to the values obtained using the computed ∈H and ∈L values, while the lower part of the table corresponds to values obtained using the VIPs and VEAs.
To investigate the chemical reactivity the investigated drug molecules, the global and local descriptors of the molecules have been calculated according to the equations described in the computational details. Table 6 shows the global quantum chemical descriptors of the compounds calculated using the B3LYP and PBEPBE methods with 6- 31+G (d, p) basis sets in the gas phase and aqueous solution. The higher part of Table 7 shows the global chemical reactivity descriptors using the computed ∈H and ∈L, while the lower part of the Table 7 shows the global chemical reactivity descriptors using both vertical ionization potential (VIP) and electron affinity (VEA). The high electronegativity value, the small hardness value, and the high electrophilicity value of the free drug reveal that the drug is highly reactive and is expected to get adsorbed by the adsorbate surface (Erdoğan et al., 2017; Guo et al., 2018).
Previous studies reported that the adsorption process is inclined by hydrogen bonding (H- Bonding), van der Waals interactions, and π-π interactions (Baccar et al., 2012; Al-Khateeb et al., 2017). Additionally, the presence of the π-electrons on both organic compounds and the 3D GF-CS surface can lead to the π-π layering of the drug on the 3D GF-CS surface. It is expected that the dipole-dipole interactions between the 3D GF-CS surface and the adsorbed drug may be improved by the larger dipole moment (μ) value, which results in better adsorption. Table 7 shows that SMZ has a higher μ value than that of water (1.855 Debye), revealing that the dipole-dipole interactions between the drug and the 3D GF- CS surface are significant. Additionally, it is found that using both methods, the μ value of the drug is higher in the aqueous solution than that in the gas phase and is larger than that of water (1.8546 Debye), indicating that presence of water as a solution enhances the dipole-dipole interactions between the drug and the 3D GF-CS surface (Erdoğan et al., 2017).
Tables 6, 7 lists the Hirschfeld charges, condensed Fukui functions, and condensed dual descriptors as calculated by the 3LYP/Def2TZVP//B3LYP/6-31+G (d, p) and PBEPBE/Def2TZVP//B3LYP/6-31+G (d, p) levels of theories in gas phase and aqueous solution. The condensed Fukui functions (nucleophilic/electrophilic attacks centers) show very important numerical results about the reactivity of each site in the investigated molecule. These results were represented as shown in Supplementary Figures S5A,B. More importantly, to have together both the preferable sites for nucleophilic attacks [f2(r) > 0] and the most preferable sites for electrophilic attracts [f2(r) < 0] above the system and close to point r. As can be seen in Supplementary Figure S5C, the most preferred site for the electrophilic attracts in the amino nitrogen atoms N14, C4, C7, and C9, respectively. Whereas, the most preferable sites for the nucleophilic attacks are C22, C23, N20, and N21, respectively. These results showed when Supplementary Figures S5A,B are considered. Additionally, these results are also confirmed by looking at the iso surfaces of the Fukui functions, HOMO, LUMO, and ESP of the drug. Therefore, one may suggest that the adsorption of the drug may take place through the binding of the electrophilic/nucleophilic centers with the adsorbent via the above-mentioned sites using the van der Waal forces. All of these sites will be examined in the next section.
3.6.2 Drug 3D GF-CS
To evaluate the adsorptive interaction among the 3D GF-CS surface and SMZ molecule, three initial configurations of SMZ (Supplementary Figure S6) were used: 1) SMZ near the grafted chitosan group onto the 3D GF-CS surface; 2) on the grafted chitosan side chain; and 3) far away from the grafted chitosan group onto the 3D GF-CS surface.
The interaction energy is highly dependent on the geometry of the SMZ molecule when it is adsorbed onto the 3D GF-CS model. As seen in Supplementary Figure S6, the interaction energy is greatest for P1, indicating that H-bonding and van der Waals interactions which considered as important in the adsorption process.
3.7 Monte Carlo
Distinguishing the optimal adsorption configuration of the adsorbate molecules (SMZ) on the 3D GF-CS surfaces is critical for calculating the different energy outputs. Calculation of the adsorption energetics of this approach is enabled by the interaction of the adsorbate molecules with the 3D GF-CS surface. This is accomplished quantitatively by determining the adsorption energy using the following equation (Eads) (Guo et al., 2014; Hsissou et al., 2019; Dagdag et al., 2020)
where EGOx-chitosane/SMZ is usually considered as the total energy that represents the simulated adsorption system, EGOx-chitosane and ESMZ are the total energy of the adsorbent, and adsorbate molecules.
This method of calculating molecular complexity uses a large number of randomly generated parts of species that consist of molecules and ions in the simulation box. When seen in Supplementary Figure S7, the mean value of average energy flattens as additional configurations are tested, showing the system has attained energy equilibrium (after 750,000 steps).
As shown in Supplementary Figure S8, the SMZ molecule adsorbs preferentially onto the 3D GF surface nearby the grafted Chitosan chains. Supplementary Figure S9 shows the energy evolution of the most favorable that has low energy adsorption sites that contain adsorbates in the region of the 3D GF-CS surface which was represented by a huge number of randomly constructed Monte Carlo simulations. The experimental results are evidence of a noticeably large negative value of Eads of the removed molecules and adsorbed onto the 3D GF-CS surface.
4 Conclusion
In this work, a 3D graphene functionalized with chitosan (3D GF-CS) was synthesized from GO and CS, and it was characterized by SEM, FTIR, XPS, XRD, TGA, and Raman and then employed for the adsorption of antibiotic (sulfamethazine, SMZ) from aqueous solution. Optimized adsorption parameters revealed that the pH was one of the most important roles in SMZ adsorption while temperature had a nominal effect; the effectiveness of pH-responsive for 3D GF-CS was found 7 for highly SMZ adsorption efficiency. The high initial concentration of SMZ was 50 ppm a maximum sorption capacity of 14.4 mgg−1. Kinetics studies showed the maximum adsorption amount of SMZ was calculated to be 18.36 according to pseudo-second-order while the experimental data was best described by Freundlich isotherm model. Thermodynamic parameters analysis showed that the adsorption of SMZ was exothermic and spontaneous with loss of disorder. Regeneration of composite in ten consecutive cycles showed excellent reusability of it and a slightly decreased the removal efficiency. Moreover, to understand the effect of SMZ on the nature of the interaction with 3D GF-CS the molecular structure and the analysis of the Frontier molecular orbitals were employed. It is revealed the adsorption mechanism takes place by the electron donation interaction through the 4-amino-benzene sulfonamide and/or by the back-donation interaction through the dimethyl pyrimidine part. Based on, the calculated global reactivity, the dipole-dipole interaction is significant in the adoption process of the drug and the 3D GF-CS, and the calculated condensed Fukui indices showed the adsorption process of the drug molecule onto the 3D GF-CS surface can take place through the N14, C22, and C23 sites. Also, calculated adsorption energy (DFTB+), physisorption appears to be a feasible adsorption pathway for the SMZ molecule on the 3D GF-CS. Additionally, Monte Carlo simulations reveal the presence of a strong interaction between the SMZ molecule and the 3D GF-CS, which is corroborated by experimental evidence.
Our research findings of the adsorption methods as an experimental design and as a theoretical basis would actively encourage for implantation of the 3D GF-CS as an effective adsorbent for SMZ and other similar aquatic environmental pollutants.
Author Contributions
Conceptualization, GH and SJ. Formal analysis, RH and OD. Investigation, SJ. Methodology, RH. Supervision, SJ. Validation, GH. Writing—original draft, RH and GH. Writing—review and editing, SJ. Software and simulation, AB, ZS, and KX. All authors have read and agreed to the published version of the manuscript.
Funding
This work was supported by the Deanship of Scientific Research # ANNU-2021-SC005. This work was in part supported by the research project “Palestinian German Scientific Bridge (PGSB)” carried out by the Forschungszentrum Jülich and Palestinian Academy for Science and Technology-PALAST and funded by the German Federal Ministry of Education and Research (BMBF). This study was supported by PWA and MEDRC according (22-IN-08) project.
Conflict of Interest
The authors declare that the research was conducted in the absence of any commercial or financial relationships that could be construed as a potential conflict of interest.
Publisher’s Note
All claims expressed in this article are solely those of the authors and do not necessarily represent those of their affiliated organizations, or those of the publisher, the editors, and the reviewers. Any product that may be evaluated in this article, or claim that may be made by its manufacturer, is not guaranteed or endorsed by the publisher.
Acknowledgments
The authors would like to thank An-Najah National University for their partial support from the Deanship of Scientific Research # ANNU-2021-SC005. y.
Supplementary Material
The Supplementary Material for this article can be found online at: https://www.frontiersin.org/articles/10.3389/fenvs.2022.930693/full#supplementary-material
References
Akhavan, O., and Ghaderi, E. (2013). Graphene Nanomesh Promises Extremely Efficient In Vivo Photothermal Therapy. Small 9 (21), 3593–3601. doi:10.1002/smll.201203106
Akrami, M., Danesh, S., and Eftekhari, M. (2019). Comparative Study on the Removal of Cationic Dyes Using Different Graphene Oxide Forms. J. Inorg. Organomet. Polym. 29 (5), 1785–1797. doi:10.1007/s10904-019-01140-0
Al-Khateeb, L. A., Hakami, W., and Salam, M. A. (2017). Removal of Non-steroidal Anti-inflammatory Drugs from Water Using High Surface Area Nanographene: Kinetic and Thermodynamic Studies. J. Mol. Liq. 241, 733–741. doi:10.1016/j.molliq.2017.06.068
Aradi, B., Hourahine, B., and Frauenheim, T. (2007). DFTB+, a Sparse Matrix-Based Implementation of the DFTB Method. J. Phys. Chem. A 111 (26), 5678–5684. doi:10.1021/jp070186p
Ayers, P. W., Morell, C., De Proft, F., and Geerlings, P. (2007). Understanding the Woodward-Hoffmann Rules by Using Changes in Electron Density. Chem. Eur. J. 13 (29), 8240–8247. doi:10.1002/chem.200700365
Baccar, R., Sarrà, M., Bouzid, J., Feki, M., and Blánquez, P. (2012). Removal of Pharmaceutical Compounds by Activated Carbon Prepared from Agricultural By-Product. Chem. Eng. J. 211-212, 310–317. doi:10.1016/j.cej.2012.09.099
Bai, Y., Sun, Q., Sun, R., Wen, D., and Tang, X. (2011). Bioaugmentation and Adsorption Treatment of Coking Wastewater Containing Pyridine and Quinoline Using Zeolite-Biological Aerated Filters. Environ. Sci. Technol. 45, 1940–1948. doi:10.1021/es103150v
Bao, H., Pan, Y., Ping, Y., Sahoo, N. G., Wu, T., Li, L., et al. (2011). Chitosan-Functionalized Graphene Oxide as a Nanocarrier for Drug and Gene Delivery. Small 7 (11), 1569–1578. doi:10.1002/smll.201100191
Berisha, A. (2021). First Principles Details into the Grafting of Aryl Radicals onto the Free-Standing and borophene/Ag(1 1 1) Surfaces. Chem. Phys. 544, 111124. doi:10.1016/j.chemphys.2021.111124
Burke, K. (2012). Perspective on Density Functional Theory. J. Chem. Phys. 136 (15), 150901. doi:10.1063/1.4704546
Cárdenas, C., Rabi, N., Ayers, P. W., Morell, C., Jaramillo, P., and Fuentealba, P. (2009). Chemical Reactivity Descriptors for Ambiphilic Reagents: Dual Descriptor, Local Hypersoftness, and Electrostatic Potential. J. Phys. Chem. A 113 (30), 8660–8667. doi:10.1021/jp902792n
Carmona-Espíndola, J., Gázquez, J. L., Vela, A., and Trickey, S. (2015). Generalized Gradient Approximation Exchange Energy Functional with Correct Asymptotic Behavior of the Corresponding Potential. J. Chem. Phys. 142 (5), 054105.
Chattaraj, P. K., and Roy, D. R. (2007). Update 1 of: Electrophilicity Index. Chem. Rev. 107 (9), PR46–PR74. doi:10.1021/cr078014b
Chen, Y., Yang, Z., Liu, Y., and Liu, Y. (2020). Fenton-Like Degradation of Sulfamerazine at Nearly Neutral pH Using Fe-Cu-CNTs and Al0-CNTs for In-Situ Generation of H2O2/OH/O2−. Chem. Eng. J. 396, 125329. doi:10.1016/j.cej.2020.125329
Dagdag, O., Hsissou, R., El Harfi, A., Berisha, A., Safi, Z., Verma, C., et al. (2020). Fabrication of Polymer Based Epoxy Resin as Effective Anti-corrosive Coating for Steel: Computational Modeling Reinforced Experimental Studies. Surfaces Interfaces 18, 100454. doi:10.1016/j.surfin.2020.100454
Danalıoğlu, S. T., Bayazit, Ş. S., Kuyumcu, Ö. K., and Salam, M. A. (2017). Efficient Removal of Antibiotics by a Novel Magnetic Adsorbent: Magnetic Activated Carbon/chitosan (MACC) Nanocomposite. J. Mol. Liq. 240, 589–596.
Dimakis, N., Vadodaria, O., Ruiz, K., and Gupta, S. (2021). Molybdenum Disulfide Monolayer Electronic Structure Information as Explored Using Density Functional Theory and Quantum Theory of Atoms in Molecules. Appl. Surf. Sci. 555, 149545. doi:10.1016/j.apsusc.2021.149545
Dimiev, A. M., and Tour, J. M. (2014). Mechanism of Graphene Oxide Formation. ACS Nano 8 (3), 3060–3068. doi:10.1021/nn500606a
Dreyer, D. R., Park, S., Bielawski, C. W., and Ruoff, R. S. (2010). The Chemistry of Graphene Oxide. Chem. Soc. Rev. 39 (1), 228–240. doi:10.1039/b917103g
Eftekhari, M., Akrami, M., Gheibi, M., Azizi-Toupkanloo, H., Fathollahi-Fard, A. M., and Tian, G. (2020). Cadmium and Copper Heavy Metal Treatment from Water Resources by High-Performance Folic Acid-Graphene Oxide Nanocomposite Adsorbent and Evaluation of Adsorptive Mechanism Using Computational Intelligence, Isotherm, Kinetic, and Thermodynamic Analyses. Environ. Sci. Pollut. Res. 27 (35), 43999–44021. doi:10.1007/s11356-020-10175-7
Eftekhari, M., Gheibi, M., Akrami, M., and Iranzad, F. (2018). Solid-phase Extraction of Ultra-trace Levels of Lead Using Tannic Acid-Coated Graphene Oxide as an Efficient Adsorbent Followed by Electrothermal Atomic Absorption Spectrometry; Response Surface Methodology - Central Composite Design. New J. Chem. 42 (2), 1159–1168. doi:10.1039/c7nj03226a
Eftekhari, M., Gheibi, M., Monhemi, H., Gaskin Tabrizi, M., and Akhondi, M. (2022). Graphene Oxide-Sulfated Lanthanum Oxy-Carbonate Nanocomposite as an Adsorbent for the Removal of Malachite Green from Water Samples with Application of Statistical Optimization and Machine Learning Computations. Adv. Powder Technol. 33 (6), 103577. doi:10.1016/j.apt.2022.103577
Emadi, F., Amini, A., Gholami, A., and Ghasemi, Y. (2017). Functionalized Graphene Oxide with Chitosan for Protein Nanocarriers to Protect against Enzymatic Cleavage and Retain Collagenase Activity. Sci. Rep. 7 (1), 42258. doi:10.1038/srep42258
Erdoğan, Ş., Safi, Z. S., Kaya, S., Işın, D. Ö., Guo, L., and Kaya, C. (2017). A Computational Study on Corrosion Inhibition Performances of Novel Quinoline Derivatives against the Corrosion of Iron. J. Mol. Struct. 1134, 751–761.
Fan, X., Peng, W., Li, Y., Li, X., Wang, S., Zhang, G., et al. (2008). Deoxygenation of Exfoliated Graphite Oxide under Alkaline Conditions: a Green Route to Graphene Preparation. Adv. Mat. 20 (23), 4490–4493. doi:10.1002/adma.200801306
Ferreira, G. M. D., Ferreira, G. M. D., Hespanhol, M. C., de Paula Rezende, J., dos Santos Pires, A. C., Gurgel, L. V. A., et al. (2017). Adsorption of Red Azo Dyes on Multi-Walled Carbon Nanotubes and Activated Carbon: A Thermodynamic Study. Colloids Surfaces A Physicochem. Eng. Aspects 529, 531–540. doi:10.1016/j.colsurfa.2017.06.021
Furness, J. W., Kaplan, A. D., Ning, J., Perdew, J. P., and Sun, J. (2020). Accurate and Numerically Efficient r2SCAN Meta-Generalized Gradient Approximation. J. Phys. Chem. Lett. 11 (19), 8208–8215. doi:10.1021/acs.jpclett.0c02405
Gázquez, J. L., Cedillo, A., and Vela, A. (2007). Electrodonating and Electroaccepting Powers. J. Phys. Chem. A 111 (10), 1966–1970.
Geerlings, P., Ayers, P. W., Toro-Labbé, A., Chattaraj, P. K., and De Proft, F. (2012). The Woodward-Hoffmann Rules Reinterpreted by Conceptual Density Functional Theory. Acc. Chem. Res. 45 (5), 683–695. doi:10.1021/ar200192t
Geerlings, P., De Proft, F., and Langenaeker, W. (2003). Conceptual Density Functional Theory. Chem. Rev. 103 (5), 1793–1874. doi:10.1021/cr990029p
Ghadirimoghaddam, D., Gheibi, M., and Eftekhari, M. (2021). Graphene Oxide-Cyanuric Acid Nanocomposite as a Novel Adsorbent for Highly Efficient Solid Phase Extraction of Pb2+ Followed by Electrothermal Atomic Absorption Spectrometry; Statistical, Soft Computing and Mechanistic Efforts. Int. J. Environ. Anal. Chem. 101, 1–22. doi:10.1080/03067319.2020.1861260
Guo, L., Safi, Z. S., Kaya, S., Shi, W., Tüzün, B., Altunay, N., et al. (2018). Anticorrosive Effects of Some Thiophene Derivatives against the Corrosion of Iron: a Computational Study. Front. Chem. 6, 155. doi:10.3389/fchem.2018.00155
Guo, L., Zhang, S. T., Li, W. P., Hu, G., and Li, X. (2014). Experimental and Computational Studies of Two Antibacterial Drugs as Corrosion Inhibitors for Mild Steel in Acid Media. Mater. Corros. 65 (9), 935–942. doi:10.1002/maco.201307346
Hanbali, G., Jodeh, S., Hamed, O., Bol, R., Khalaf, B., Qdemat, A., et al. (2020a). Magnetic Multiwall Carbon Nanotube Decorated with Novel Functionalities: Synthesis and Application as Adsorbents for Lead Removal from Aqueous Medium. Processes 8 (8), 986. doi:10.3390/pr8080986
Hanbali, G., Jodeh, S., Hamed, O., Bol, R., Khalaf, B., Qdemat, A., et al. (2020b). Enhanced Ibuprofen Adsorption and Desorption on Synthesized Functionalized Magnetic Multiwall Carbon Nanotubes from Aqueous Solution. Materials 13 (15), 3329. doi:10.3390/ma13153329
Hourahine, B., Aradi, B., Blum, V., Bonafé, F., Buccheri, A., Camacho, C., et al. (2020). DFTB+, a Software Package for Efficient Approximate Density Functional Theory Based Atomistic Simulations. J. Chem. Phys. 152 (12), 124101. doi:10.1063/1.5143190
Hourahine, B., Sanna, S., Aradi, B., Köhler, C., Niehaus, T., and Frauenheim, T. (2007). Self-interaction and Strong Correlation in DFTB. J. Phys. Chem. A 111 (26), 5671–5677. doi:10.1021/jp070173b
Hsissou, R., Dagdag, O., Abbout, S., Benhiba, F., Berradi, M., El Bouchti, M., et al. (2019). Novel Derivative Epoxy Resin TGETET as a Corrosion Inhibition of E24 Carbon Steel in 1.0 M HCl Solution. Experimental and Computational (DFT and MD Simulations) Methods. J. Mol. Liq. 284, 182–192. doi:10.1016/j.molliq.2019.03.180
Jensen, F. (2017). Introduction to Computational Chemistry. Massachusetts Avenue, Cambridge: John Wiley & Sons.
Jianlong, W., Xiangchun, Q., Liping, H., Yi, Q., and Hegemann, W. (2002). Microbial Degradation of Quinoline by Immobilized Cells of Burkholderia Pickettii. Water Res. 36 (9), 2288–2296. doi:10.1016/s0043-1354(01)00457-2
Jiao, G.-J., Ma, J., Li, Y., Jin, D., Zhou, J., and Sun, R. (2022). Removed Heavy Metal Ions from Wastewater Reuse for Chemiluminescence: Successive Application of Lignin-Based Composite Hydrogels. J. Hazard. Mater. 421, 126722. doi:10.1016/j.jhazmat.2021.126722
Jodeh, S., Hamed, O., Melhem, A., Salghi, R., Jodeh, D., Azzaoui, K., et al. (2018). Magnetic Nanocellulose from Olive Industry Solid Waste for the Effective Removal of Methylene Blue from Wastewater. Environ. Sci. Pollut. Res. 25 (22), 22060–22074. doi:10.1007/s11356-018-2107-y
Jodeh, S., Shawahny, M., Hanbali, G., Jodeh, D., and Dagdag, O. (2021). Efficiency of Magnetic Chitosan Supported on Graphene for Removal of Perchlorate Ions from Wastewater. Environ. Technol. 42 (7), 1119–1131. doi:10.1080/09593330.2019.1657963
Johra, F. T., Lee, J.-W., and Jung, W.-G. (2014). Facile and Safe Graphene Preparation on Solution Based Platform. J. Industrial Eng. Chem. 20 (5), 2883–2887. doi:10.1016/j.jiec.2013.11.022
Kadiri, L., Ouass, A., Hsissou, R., Safi, Z., Wazzan, N., Essaadaoui, Y., et al. (2021). Adsorption Properties of Coriander Seeds: Spectroscopic Kinetic Thermodynamic and Computational Approaches. J. Mol. Liq. 343, 116971. doi:10.1016/j.molliq.2021.116971
Karandish, S., Chamsaz, M., Arbab Zavar, M. H., and Gheibi, M. (2018). Reduced Graphene Oxide-Polyaniline Nanocomposite as an Efficient Adsorbent for Solid Phase Extraction of Co2+ Followed by Electrothermal Atomic Absorption Spectrometry. Int. J. Environ. Anal. Chem. 98 (12), 1135–1148. doi:10.1080/03067319.2018.1523397
Karimi, F., Ayati, A., Tanhaei, B., Sanati, A. L., Afshar, S., Kardan, A., et al. (2022). Removal of Metal Ions Using a New Magnetic Chitosan Nano-Bio-Adsorbent; A Powerful Approach in Water Treatment. Environ. Res. 203, 111753. doi:10.1016/j.envres.2021.111753
Khalaf, B., Hamed, O., Jodeh, S., Bol, R., Hanbali, G., Safi, Z., et al. (2021a). Cellulose-Based Hectocycle Nanopolymers: Synthesis, Molecular Docking and Adsorption of Difenoconazole from Aqueous Medium. Ijms 22 (11), 6090. doi:10.3390/ijms22116090
Khalaf, B., Hamed, O., Jodeh, S., Hanbali, G., Bol, R., Dagdag, O., et al. (2021b). Novel, Environment-Friendly Cellulose-Based Derivatives for Tetraconazole Removal from Aqueous Solution. Polymers 13 (3), 450. doi:10.3390/polym13030450
Lai, K. C., Hiew, B. Y. Z., Lee, L. Y., Gan, S., Thangalazhy-Gopakumar, S., Chiu, W. S., et al. (2019). Ice-templated Graphene Oxide/chitosan Aerogel as an Effective Adsorbent for Sequestration of Metanil Yellow Dye. Bioresour. Technol. 274, 134–144. doi:10.1016/j.biortech.2018.11.048
Li, H., Zhang, H., Long, J., Zhang, P., and Chen, Y. (2019). Combined Fenton Process and Sulfide Precipitation for Removal of Heavy Metals from Industrial Wastewater: Bench and Pilot Scale Studies Focusing on In-Depth Thallium Removal. Front. Environ. Sci. Eng. 13 (4), 1–12. doi:10.1007/s11783-019-1130-7
Li, Z., Young, R. J., Wang, R., Yang, F., Hao, L., Jiao, W., et al. (2013). The Role of Functional Groups on Graphene Oxide in Epoxy Nanocomposites. Polymer 54 (21), 5821–5829. doi:10.1016/j.polymer.2013.08.026
Liu, F., Shi, R., Wang, Z., Weng, Y., Che, C. M., and Chen, Y. (2019). Direct Z-Scheme Hetero-phase Junction of Black/Red Phosphorus for Photocatalytic Water Splitting. Angew. Chem. 131 (34), 11917–11921. doi:10.1002/ange.201906416
Ljungberg, M., Strand, S-E., and King, M. A. (2012). Monte Carlo Calculations in Nuclear Medicine: Applications in Diagnostic Imaging. Lund, Sweden: CRC Press.
Lu, C. h. H., Yang, H. h. H., Zhu, C. h. L., Chen, X., and Chen, G. h. N. (2009). A Graphene Platform for Sensing Biomolecules. Angew. Chem. 121 (26), 4879–4881. doi:10.1002/ange.200901479
Lu, T., and Chen, F. (2012). Multiwfn: a Multifunctional Wavefunction Analyzer. J. Comput. Chem. 33 (5), 580–592. doi:10.1002/jcc.22885
Massad, Y., Hanbali, G., Jodeh, S., Hamed, O., Bzour, M., Dagdag, O., et al. (2022). The Efficiency of Removal of Organophosphorus Malathion Pesticide Using Functionalized Multi-Walled Carbon Nanotube: Impact of Dissolved Organic Matter (DOM). Sep. Sci. Technol. 57 (1), 1–12. doi:10.1080/01496395.2021.1881118
Medetalibeyoğlu, H., Beytur, M., Manap, S., Karaman, C., Kardaş, F., Akyıldırım, O., et al. (2020). Molecular Imprinted Sensor Including Au Nanoparticles/polyoxometalate/two-Dimensional Hexagonal Boron Nitride Nanocomposite for Diazinon Recognition. ECS J. Solid State Sci. Technol. 9 (10), 101006.
Meyer, J. C., Geim, A. K., Katsnelson, M. I., Novoselov, K. S., Booth, T. J., and Roth, S. (2007). The Structure of Suspended Graphene Sheets. Nature 446 (7131), 60–63. doi:10.1038/nature05545
Mohammadi, M., Gheibi, M., Fathollahi-Fard, A. M., Eftekhari, M., Kian, Z., and Tian, G. (2021). A Hybrid Computational Intelligence Approach for Bioremediation of Amoxicillin Based on Fungus Activities from Soil Resources and Aflatoxin B1 Controls. J. Environ. Manag. 299, 113594. doi:10.1016/j.jenvman.2021.113594
Morell, C., Grand, A., Toro-Labbé, A., and Chermette, H. (2013). Is Hyper-Hardness More Chemically Relevant Than Expected. J. Mol. Model. 19 (7), 2893–2900. doi:10.1007/s00894-013-1778-z
Ncibi, M. C., and Sillanpää, M. (2017). Optimizing the Removal of Pharmaceutical Drugs Carbamazepine and Dorzolamide from Aqueous Solutions Using Mesoporous Activated Carbons and Multi-Walled Carbon Nanotubes. J. Mol. Liq. 238, 379–388. doi:10.1016/j.molliq.2017.05.028
Novoselov, K. S., Fal′ko, V. I., Colombo, L., Gellert, P. R., Schwab, M. G., and Kim, K. (2012). A Roadmap for Graphene. nature 490 (7419), 192–200. doi:10.1038/nature11458
Peng, H., Yang, Z-H., Perdew, J. P., and Sun, J. (2016). Versatile van der Waals density functional based on a meta-generalized gradient approximation. Phys. Rev. X 6 (4), 041005. doi:10.1103/physrevx.6.041005
Peverati, R., Zhao, Y., and Truhlar, D. G. (2011). Generalized Gradient Approximation that Recovers the Second-Order Density-Gradient Expansion with Optimized Across-The-Board Performance. J. Phys. Chem. Lett. 2 (16), 1991–1997. doi:10.1021/jz200616w
Qi, C., Zhao, L., Lin, Y., and Wu, D. (2018). Graphene Oxide/chitosan Sponge as a Novel Filtering Material for the Removal of Dye from Water. J. colloid interface Sci. 517, 18–27. doi:10.1016/j.jcis.2018.01.089
Ramya, A. V., Manoj, B., and Mohan, A. N. (2016). Extraction and Characterization of Wrinkled Graphene Nanolayers from Commercial Graphite. Asian J. Chem. 28 (5), 1031–1034. doi:10.14233/ajchem.2016.19577
Razmjou, A., Hosseini, E., Cha-Umpong, W., Korayem, A. H., Asadnia, M., Moazzam, P., et al. (2020). Effect of Chemistry and Geometry of GO Nanochannels on the Li Ion Selectivity and Recovery. Desalination 496, 114729. doi:10.1016/j.desal.2020.114729
Shen, T., Pi, Y., Bao, M., Xu, N., Li, Y., and Lu, J. (2015). Biodegradation of Different Petroleum Hydrocarbons by Free and Immobilized Microbial Consortia. Environ. Sci. Process. Impacts 17 (12), 2022–2033. doi:10.1039/c5em00318k
Sobhan Ardakani, S., Cheraghi, M., Jafari, A., and Zandipak, R. (2020). PECVD Synthesis of ZnO/Si Thin Film as a Novel Adsorbent for Removal of Azithromycin from Water Samples. Int. J. Environ. Anal. Chem. 100, 1–18. doi:10.1080/03067319.2020.1793973
Tajik, S., Orooji, Y., Ghazanfari, Z., Karimi, F., Beitollahi, H., Varma, R. S., et al. (2021). Nanomaterials Modified Electrodes for Electrochemical Detection of Sudan I in Food. Food Meas. 15 (4), 3837–3852. doi:10.1007/s11694-021-00955-1
Tan, K. L., and Hameed, B. H. (2017). Insight into the Adsorption Kinetics Models for the Removal of Contaminants from Aqueous Solutions. J. Taiwan Inst. Chem. Eng. 74, 25–48. doi:10.1016/j.jtice.2017.01.024
Tang, J., and Wang, J. (2018). Metal Organic Framework with Coordinatively Unsaturated Sites as Efficient Fenton-like Catalyst for Enhanced Degradation of Sulfamethazine. Environ. Sci. Technol. 52 (9), 5367–5377. doi:10.1021/acs.est.8b00092
Veclani, D., and Melchior, A. (2020). Adsorption of Ciprofloxacin on Carbon Nanotubes: Insights from Molecular Dynamics Simulations. J. Mol. Liq. 298, 111977. doi:10.1016/j.molliq.2019.111977
Wang, J., and Wang, S. (2018). Activation of Persulfate (PS) and Peroxymonosulfate (PMS) and Application for the Degradation of Emerging Contaminants. Chem. Eng. J. 334, 1502–1517. doi:10.1016/j.cej.2017.11.059
Wang, J., and Wang, S. (2019). Preparation, Modification and Environmental Application of Biochar: a Review. J. Clean. Prod. 227, 1002–1022. doi:10.1016/j.jclepro.2019.04.282
Wang, J., and Wang, S. (2016). Removal of Pharmaceuticals and Personal Care Products (PPCPs) from Wastewater: a Review. J. Environ. Manag. 182, 620–640. doi:10.1016/j.jenvman.2016.07.049
Wang, J., Zhuan, R., and Chu, L. (2019). The Occurrence, Distribution and Degradation of Antibiotics by Ionizing Radiation: an Overview. Sci. Total Environ. 646, 1385–1397. doi:10.1016/j.scitotenv.2018.07.415
Wang, J., and Zhuang, S. (2019). Covalent Organic Frameworks (COFs) for Environmental Applications. Coord. Chem. Rev. 400, 213046. doi:10.1016/j.ccr.2019.213046
Wang, Y., Zhang, S., Li, F., Zhou, Y., Zhang, Y., Wang, Z., et al. (2020). Therapeutic Target Database 2020: Enriched Resource for Facilitating Research and Early Development of Targeted Therapeutics. Nucleic Acids Res. 48 (D1), D1031–D41. doi:10.1093/nar/gkz981
Wang, Y. G., Barnes, E. C., Kaya, S., and Sharma, V. (2019). The Reactivity of Ambident Nucleophiles: Marcus Theory or Hard and Soft Acids and Bases Principle. J. Comput. Chem. 40 (31), 2761–2777. doi:10.1002/jcc.26052
Weigend, F., and Ahlrichs, R. (2005). Balanced Basis Sets of Split Valence, Triple Zeta Valence and Quadruple Zeta Valence Quality for H to Rn: Design and Assessment of Accuracy. Phys. Chem. Chem. Phys. 7 (18), 3297–3305. doi:10.1039/b508541a
Westerhoff, P., Yoon, Y., Snyder, S., and Wert, E. (2005). Fate of Endocrine-Disruptor, Pharmaceutical, and Personal Care Product Chemicals during Simulated Drinking Water Treatment Processes. Environ. Sci. Technol. 39 (17), 6649–6663. doi:10.1021/es0484799
Wu, D., Zhang, Q., and Tao, M. (2006). LSDA+Ustudy of Cupric Oxide: Electronic Structure and Native Point Defects. Phys. Rev. B 73 (23), 235206. doi:10.1103/physrevb.73.235206
Wu, X.-L., Xiao, P., Zhong, S., Fang, K., Lin, H., and Chen, J. (2017). Magnetic ZnFe2O4@chitosan Encapsulated in Graphene Oxide for Adsorptive Removal of Organic Dye. RSC Adv. 7 (45), 28145–28151. doi:10.1039/c7ra04100d
Xiong, J., Zhang, D., Lin, H., and Chen, Y. (2020). Amphiprotic Cellulose Mediated Graphene Oxide Magnetic Aerogels for Water Remediation. Chem. Eng. J. 400, 125890. doi:10.1016/j.cej.2020.125890
Xu, J., Du, P., Bi, W., Yao, G., Li, S., and Liu, H. (2020). Graphene Oxide Aerogels Co-functionalized with Polydopamine and Polyethylenimine for the Adsorption of Anionic Dyes and Organic Solvents. Chem. Eng. Res. Des. 154, 192–202. doi:10.1016/j.cherd.2019.12.014
Yan, T., Zhang, H., Huang, D., Feng, S., Fujita, M., and Gao, X.-D. (2017). Chitosan-functionalized Graphene Oxide as a Potential Immunoadjuvant. Nanomaterials 7 (3), 59. doi:10.3390/nano7030059
Yang, W., and Wu, Q. (2002). Direct Method for Optimized Effective Potentials in Density-Functional Theory. Phys. Rev. Lett. 89 (14), 143002. doi:10.1103/physrevlett.89.143002
Young, D. C. (2001). A Practical Guide for Applying Techniques to Real-World Problems, 9. New York: Computational Chemistry, 390.
Zandipak, R., and Sobhanardakani, S. (2018). Novel Mesoporous Fe3O4/SiO2/CTAB-SiO2 as an Effective Adsorbent for the Removal of Amoxicillin and Tetracycline from Water. Clean. Techn Environ. Policy 20 (4), 871–885. doi:10.1007/s10098-018-1507-5
Zhu, W., Jiang, X., Liu, F., You, F., and Yao, C. (2020). Preparation of Chitosan-Graphene Oxide Composite Aerogel by Hydrothermal Method and its Adsorption Property of Methyl Orange. Polymers 12 (9), 2169. doi:10.3390/polym12092169
Keywords: sulfamethazine, adsorption, chitosan, graphene oxide, density-functional–based tight binding
Citation: Hamed R, Jodeh S, Hanbali G, Safi Z, Berisha A, Xhaxhiu K and Dagdag O (2022) Eco-Friendly Synthesis and Characterization of Double-Crossed Link 3D Graphene Oxide Functionalized With Chitosan for Adsorption of Sulfamethazine From Aqueous Solution: Experimental and DFT Calculations. Front. Environ. Sci. 10:930693. doi: 10.3389/fenvs.2022.930693
Received: 29 April 2022; Accepted: 09 June 2022;
Published: 15 August 2022.
Edited by:
Ahmed El Nemr, National Institute of Oceanography and Fisheries (NIOF), EgyptReviewed by:
Qingyang Liu, Nanjing Forestry University, ChinaRaziyeh Zandi Pak, Tarbiat Modares University, Iran
Ravin Manohar Jugade, Rashtrasant Tukadoji Maharaj Nagpur University, India
Mohammad Gheibi, Monterrey Institute of Technology and Higher Education (ITESM), Mexico
Copyright © 2022 Hamed, Jodeh, Hanbali, Safi, Berisha, Xhaxhiu and Dagdag. This is an open-access article distributed under the terms of the Creative Commons Attribution License (CC BY). The use, distribution or reproduction in other forums is permitted, provided the original author(s) and the copyright owner(s) are credited and that the original publication in this journal is cited, in accordance with accepted academic practice. No use, distribution or reproduction is permitted which does not comply with these terms.
*Correspondence: Shehdeh Jodeh, c2pvZGVoQGhvdG1haWwuY29t; Ghadir Hanbali, Zy5oYW5iYWxpQG5hamFoLmVkdQ==