 Jianhua Zhang1
 Yushan Liu
95% of researchers rate our articles as excellent or good
Learn more about the work of our research integrity team to safeguard the quality of each article we publish.
Find out more
HYPOTHESIS AND THEORY article
Front. Environ. Sci. , 22 June 2022
Sec. Environmental Economics and Management
Volume 10 - 2022 | https://doi.org/10.3389/fenvs.2022.929939
This article is part of the Research Topic Economic Development, Social Consequences, and Technological Innovation Under Climate Change COVID-19 Pandemic Conditions View all 48 articles
As a national pillar industry, the carbon emissions generated by the construction industry have received significant attention. As a large developing country, China has unbalanced regional development and imperfect modern energy infrastructure in some regions, leading to a prominent problem of energy poverty in China. Therefore, this study constructs the index system of energy poverty using panel data of 30 provinces and cities from 2004 to 2016. This article analyzes the influence of energy poverty on carbon intensity of the construction industry and constructs the influence model of carbon intensity of the construction industry. The results show that 1) the carbon intensity of the construction industry increases by 1.683 units per unit increase of energy poverty, showing a positive impact. 2) Energy consumption structure has a mediating effect on the impact of energy poverty on carbon intensity of the construction industry. 3) The technological level plays a moderating role in the main effect of energy poverty and carbon intensity in the construction industry; the degree of marketization plays a moderating role in the indirect effect of energy consumption structure and carbon intensity of the construction industry. These results offered valuable policy recommendations for sustainable industrial growth.
As the world’s second largest economy and largest energy consumer, China is the world’s largest carbon emitter. At the seventy-fifth Session of the United Nations General Assembly in 2020, it was proposed to enhance the “nationally determined contribution” and strive to reach the peak of carbon dioxide emissions by 2030 and achieve carbon neutrality by 2060. China is still in a medium-high speed of economic development, and the pace of industrialization cannot be slowed down. Weighing economic development and carbon emissions is worth thinking about. As the largest developing country in the world, China has a large population, uneven resources, and economic development among regions, leading to energy poverty as some people cannot fairly obtain and safely consume adequate, affordable, high-quality, environmentally friendly, and potential energy. Regional energy poverty will lead people to prefer cheaper but environmentally unfriendly energy production activities such as firewood and coal when making energy consumption choices. In the long run, air pollutants such as smog, dust, and inhalable particles will increase, and the environmental carrying capacity will reach the red line. In addition, the excessive use of non-clean energy will also lead to the rise of greenhouse gas emissions, such as climate change caused by excessive carbon dioxide emissions. According to the fifth assessment report of the United Nations Intergovernmental Panel on Climate Change (IPCC, 2013), the national average surface temperature has increased by 0.89°C (IPCC, 2013). Climate change is closely related to energy consumption. Acaroğlu (2022) explored the causal relationship between climate change, economic growth, and energy consumption in Turkey and found that the use of renewable energy can help reduce temperature (Acaroğlu and Güllü, 2022). The global spread of COVID-19 also affects the relationship between carbon dioxide and energy consumption. Adebayo (2022) takes the United Kingdom as the background to explore the impact of renewable energy, non-renewable energy, and COVID-19 on carbon dioxide emissions and finds that the positive transformation of the development of renewable energy reduces CO2 emissions, and the positive impact of fossil fuel energy has increased CO2 emissions (Adebayo et al., 2022). Global warming has become a serious environmental problem so far. Countries around the world have reached a consensus on “curbing temperature rise and reducing carbon emissions” and taken effective measures. The United Nations Framework Convention on Climate Change (UNFCCC), adopted by the Intergovernmental Negotiating Committee of the United Nations in 1992, became the first international convention for international cooperation to deal with the control of greenhouse gases such as carbon dioxide and global warming. The UNEP study concludes that the building sector accounts for a similar proportion of total energy consumption to carbon emissions. Therefore, the study of carbon emissions is closely related to energy consumption and emissions in the construction industry.
With the advancement of urbanization in China, the consumption of building materials and new floor space in China has become the first in the world. The construction industry accounts for about 35–50% of total emissions (Zhou et al., 2018). In recent years, with the strong support of the government and the promotion of low-carbon economic development, energy conservation, and emission reduction work, the construction industry has made good progress, and the carbon emission intensity of the construction industry has been declining year-by-year. On 22 April 2020, the World Meteorological Organization (WMO) said that the reduction in global carbon dioxide emissions this year due to the pandemic will be the largest annual decrease since World War II, but this is not enough to curb global warming, and the building sector still has great potential for energy conservation and emission reduction. China’s vast territory and uneven distribution of abundant energy reserves have led to irrational energy consumption structure in some regions, resulting in huge waste and resulting in energy poverty. What is the impact of energy poverty on energy consumption and carbon emissions of local construction industries? What are the effects of marketization and technological level? Based on this, this article uses the panel data regression model to analyze the mechanism of energy poverty, carbon emissions of the construction industry, and energy consumption structure in 30 provinces and cities (autonomous regions and municipalities directly under the Central Government) from 2004 to 2016 and discusses the mechanism and relationship of energy consumption structure, marketization degree, and technological level. The evolution mechanism of carbon emissions in the construction industry is deeply analyzed in order to provide practical reference suggestions for the future energy conservation and emission reduction and sustainable development of the country and region.
Existing studies focus on the relationship between carbon emissions and climate change, energy relationship and climate change, but there are few studies on the logical relationship between energy poverty and carbon intensity and their impact paths. Compared with the existing articles, the contribution of this article is as follows: 1) based on the existing research, we measured and calculated the energy poverty at provincial level in China, and found that the energy poverty will increase the carbon intensity of the construction industry. 2) This article will start with the logical relationship between energy poverty, energy consumption structure, and carbon emissions, and elaborate the path of energy consumption structure that energy poverty affects the carbon intensity of the construction industry. This article theoretically explores the influence path of energy relationship and carbon emission, strengthens the logical chain of energy relationship, carbon emission and climate change, and provides new ideas for regional governments to formulate energy conservation and emission reduction policies.
The structure of the article is as follows: 1) to sort out the research on energy poverty and carbon emissions by domestic and foreign scholars and determine the theoretical basis of the research. 2) Calculate the energy poverty index of 30 provinces and cities in China and build the influence model of carbon intensity of the construction industry to analyze the impact of energy poverty on carbon emissions of the construction industry. 3) Test the empirical results to ensure the accuracy of the results. 4) Conclusion and revelation.
Energy has brought convenience to human production and life. However, the traditional energy development model also brings energy exhaustion, climate change, and other problems. Therefore, most scholars at home and abroad have carried out relevant studies on energy poverty, mainly focusing on the definition, measurement, and influencing factors of energy poverty. Martina (2019) created a Structural Energy Poverty Vulnerability Index (SEPV) and explored the association between SEPV and EP morbidity, as well as excess winter mortality. Finally, the energy poverty vulnerability index was established by principal component analysis, and the correlation between the index and excess winter mortality was analyzed. The results found that the most vulnerable countries showed statistically higher rates of energy poverty and excess risk of winter mortality (Recalde et al., 2019). Raúl (2020) found that many people in Southern European countries live in cold and inefficient environments, unable to meet their energy needs for comfort and warmth, and are therefore at risk of cold-related diseases (Castaño -Rosa et al., 2020). Abidah (2020) found that the deployment of renewable energy in many remote areas could provide opportunities for significant and rare complementarities between energy security, energy access, and climate change mitigation (Setyowati, 2020). In order to assess the impact of the economic crisis on energy poverty in Europe, Halkos (2021) uses consensus methods and comprehensive measures to calculate energy poverty and identifies the price of electricity as the main driver of energy poverty (Halkos and Gkampoura, 2021). According to the current situation of China’s rural energy poverty, Zhao (2018) constructed an index system of China’s rural energy poverty, used Theil index and spatial autocorrelation analysis to describe the spatial-temporal evolution characteristics of China’s rural energy poverty, and analyzed the influencing factors (Zhao et al., 2018). There are significant differences not only between urban and rural areas but also between regions in energy poverty. Cai (2021) studied the spatio-temporal evolution pattern and influencing factors of energy poverty in 30 provinces of China and found that energy poverty improved significantly during the research period, with huge differences among provinces. Energy poverty was the most serious in the western region, followed by the central region. Energy poverty has significant spatial correlation characteristics, and the spatial development pattern shows a trend of rising first and then falling (Cai et al., 2021). In this study, the definition of energy poverty in China is based on the concept of Nussbaumer (2012) and Li et al. (2014): energy poverty is defined as the difficulty in equitable access and safe consumption of adequate, affordable, high-quality energy with development potential (Nussbaumer et al., 2012; Li et al., 2014).
The international community has been struggling to reach a consensus on tackling global warming and reducing carbon emissions. At present, studies on carbon emissions at home and abroad focus on the influencing factors of carbon emissions and the relationship between carbon emissions and climate change. Research on the influencing factors of carbon emissions focuses on energy intensity (Greening et al., 1998; Tang et al., 2021), energy structure (Li et al., 2022;2021), per capita GDP (Hatzigeorgiou et al., 2011; Işık, 2013; Azam et al., 2021), and green tech innovation (Razzaq et al., 2021; Sun and Razzaq, 2022; Sun et al., 2022a). Işık (2017) examined the dynamic causal relationship between economic growth, financial development, international trade, tourism expenditure, and carbon dioxide emissions in Greece from 1970 to 2014 and found that tourism as the leading sector of the Greek economy has a serious negative impact on the Greek environment (Işik et al., 2017). Alisa (2020) analyzed the feasibility of using carbon tax revenue to finance energy efficiency and renewable energy projects based on the case of Switzerland. The study showed that such policy could not only reduce carbon emissions but also help reduce the cost of home heating (Freyre et al., 2020). Rehman (2021) explored the interaction between carbon dioxide emissions and industrialization, energy imports, carbon intensity, economic development, and total capital by using data from 1971 to 2019 in Pakistan (Rehman et al., 2021). Nguyen (2021) made use of the data from 1978 to 2014 of the group of six countries and found that there was insufficient evidence for the environmental Kuznets curve, while economic growth, capital market expansion, and trade opening were the main drivers of carbon emissions (Nguyen et al., 2021). Solomon (2009) believes that climate change due to increased Co2 concentration is basically irreversible within 1,000 years after cessation of emissions; After emissions stop, the removal of carbon dioxide from the atmosphere reduces radiative forcing, but is largely compensated for by a slow loss of heat to the ocean, so atmospheric temperatures will not drop significantly for at least 1,000 years (Solomon et al., 2009). Since then, the relationship between carbon emissions and climate change has also become the focus of research, and it is found that energy poverty will also affect climate change through carbon emissions. Ürge-Vorsatz (2012) suggested that alleviating energy poverty and slowing down climate change are difficult goals, or both can be coordinated, if the internalization of external costs for carbon emissions cannot be offset by efficiency gains, so a strong action on climate change could lead to higher energy poverty levels, the most significant synergies deep found in building energy efficiency (Ürge-Vorsatz and Tirado Herrero, 2012). Shoibal (2013) found that policies to eliminate energy poverty would increase global end-use energy consumption by 7%, while generating a large amount of carbon emissions, and the additional energy facilities needed to eliminate energy poverty would increase global temperature by 0.13°C at most (Chakravarty and Tavoni, 2013). Hassan (2022) estimated the impact of energy poverty, education, income inequality, and globalization on carbon emissions in BRICS countries from 1989 to 2016, looking at carbon emissions and climate change from the relationship between energy security and energy poverty (Hassan et al., 2022). Wang (2014) discussed the impact of climate change by sorting out policies related to energy poverty. It found that improving household energy efficiency and promoting the development and utilization of renewable energy or other energy policies could help alleviate energy poverty and reduce carbon emissions (Wang et al., 2014). Liu (2022) analyzed the effect of an individual carbon trading mechanism on improving energy poverty by constructing an individual carbon trading model and using the latest public data of China’s household energy consumption survey, and designed the core parameters of the individual carbon trading mechanism such as quota and price (Liu et al., 2022). The research on energy poverty and carbon intensity of the construction industry, which is directly related to the core issue of this article, needs to be further studied. At present, the research on energy poverty and carbon emissions focuses on the causal relationship between renewable energy and non-renewable energy, climate change, and carbon emissions (Sun et al., 2022b). Işik (2019) examined the environmental Kuznet curve hypothesis for the ten states with the highest carbon dioxide emissions in the United States, using independent variables such as real GDP, population, and renewable and fossil energy consumption (Işık et al., 2019). Montoya (2021) found that renewable and non-renewable energy in Brazil would have an impact on global climate change through international trade (Montoya et al., 2021). Gernaat (2021) uses climate and integrated assessment models to estimate the impact of climate change on key renewable energy sources, with the availability of bioenergy increasing under the baseline warming scenario (Gernaat et al., 2021). Therefore, in order to clarify the energy relationship and the impact path of climate change, this article explores the relationship between potential energy poverty and carbon emissions, so as to make the path and relationship of energy, carbon emission, and climate change clearer.
With the rapid development of China’s economy, while rapidly promoting urbanization and increasing infrastructure construction, China also faces the problem of increasing carbon emissions from the construction industry caused by excessive energy consumption and low efficiency of energy use. Ürge-Vorsatz (2012) found that improving building energy efficiency could reduce carbon emissions while alleviating energy poverty (Ürge-Vorsatz and Tirado Herrero, 2012). Energy poverty is a unique form of poverty. The unbalanced economic development between provinces in China, on the one hand, shows that people in some areas of China cannot afford the living energy, which makes people prefer to use traditional biomass coal, which directly leads to the increase of carbon emissions. On the other hand, inadequate access to electricity is manifested, which is more serious in developing countries. The lack of electricity service means the lack of access to clean energy, which leads to the characteristics of high carbonization and non-clean energy consumption of residents. By constructing an energy poverty index and comparing the energy poverty in China and Germany, Bonatz (2018) found that the development of China’s low-carbon strategy can improve energy efficiency and alleviate energy poverty. At this time, we will find that energy poverty and carbon emissions will affect each other, and most low-carbon development policies are consistent with energy poverty policies, which will reduce carbon emissions while alleviating energy poverty (Bonatz et al., 2019). McGee (2019) finds through research that renewable energy can alleviate energy poverty to a certain extent and has significant energy saving and emission reduction effects. But further study found that the correlation between renewable energy consumption and carbon emissions fell sharply as the income share of the top 20 percent of earners grew (McGee and Greiner, 2019). Therefore, the research hypothesis is proposed.
H1: Energy poverty increases construction intensity.
The energy consumption structure is the ratio of individual energy consumption to the total energy consumption. From the perspective of energy consumption structure, traditional biomass energy and electricity are two main types of energy consumption. With the national emphasis on energy conservation and emission reduction and the implementation of relevant policies, Hao and Yin (2014) found that during the decade from 1998 to 2007, the proportion of traditional biomass energy in residential energy consumption continued to decline, while the proportion of electricity consumption kept rising, effectively alleviating the energy poverty in China (Hao et al., 2014). But some parts of China suffer from severe energy poverty due to its vast territory. Chen (2019) made an empirical analysis of the dynamic cross-sectional data of 30 provinces in China and found that technological innovation, economic growth, and energy consumption structure would have a significant positive effect on the increment of carbon emissions (Chen, 2019). Xu (2020) made scenario prediction of carbon peak and found that carbon emissions would not reach the peak under normal circumstances, but after reasonable planning of energy structure, carbon emissions would reach the peak in 2030, and under low-carbon energy structure, it would reach the peak in 2025 (Xu et al., 2020). Zhao (2021) reestimated the impact of energy poverty on CO2 emissions by using the systematic generalized moment method, and found that there is a two-way causal relationship between energy poverty and CO2 emissions in regions with high energy poverty in China, while there is a one-way causal relationship between energy poverty and CO2 emissions in regions with low energy poverty (Zhao et al., 2021). Therefore, it is speculated that energy consumption structure also has a certain influence mechanism on energy poverty and carbon emissions of the construction industry, and the hypothesis is proposed as follows:
H2: Energy consumption structure has a mediating effect on the impact of energy poverty on carbon intensity of the construction industry.
Technological progress will bring about the improvement of labor productivity, making the production of products of the same value consume fewer resources, and reduce carbon emissions from the perspective of reducing energy consumption. Wei (2010) analyzed the influencing factors of China’s interprovincial carbon emissions from 1997 to 2007 and proposed that technological progress played a significant role in promoting China’s carbon emissions, showing obvious regional differences (Wei and Yang, 2010). Li (2019) uses the IPCC calculation method to calculate China’s carbon emissions, and the STIRPAT model to analyze the impact of factors such as total population, technological level, and industrial structure on carbon emissions, and finds that improving the technological level can effectively control carbon emissions (Li et al., 2019). Li (2020) constructed the super-era total factor carbon emission performance index of the construction industry in 30 provinces, and concluded that the growth of NMTCPI was mainly caused by technological progress, but the regional technological gap gradually widened after 2011 (Li et al., 2020a). Zhao (2022) investigated the mediating effect of technological innovation on the relationship between energy poverty and green growth, and found that eliminating energy poverty and increasing technological innovation can effectively promote national green growth, and the interaction between energy poverty and technological innovation has a positive impact on green growth (Zhao et al., 2022). Technological innovation plays an important role in the process of energy saving and emission reduction and promoting green growth.
H3a: The technology level plays a moderating role in the relationship between energy poverty and carbon intensity of the construction industry.
Marketization degree refers to the sensitivity of the market to the changes of supply and demand. According to the relevant theories of Western economics, the higher the marketization degree of enterprises, the more efficient the allocation of market resources. At the same time, relevant literature has also studied the influence of marketization degree on carbon emission of the construction industry. Hu (2015) found that the increase of marketization degree would have a negative impact on carbon emissions, and found that in areas with high marketization degree, the marketization degree had a more obvious impact on carbon emissions. However, in places with low degree of marketization, the impact of marketization on carbon emissions was not obvious (Hu and Wang, 2015). For a long time, in China’s construction industry, compared with other industries, the degree of marketization has been low. However, since the establishment of the market economy system in 1992, the rapid development of the market economy has made the resource allocation of the construction industry optimized. Therefore, the improvement of marketization degree will accelerate the optimization of energy consumption structure and reduce the carbon emission of the construction industry. Hence the hypothesis is proposed.
H3b: The marketization degree plays a moderating role in the relationship between energy consumption structure and carbon intensity of the construction industry.
Limited by the availability of data, annual data of 30 Chinese provinces from 2004 to 2016 were selected. The carbon emission data and energy consumption of the construction industry are from the China Carbon Emission database. The total output value of the construction industry from the Statistical Yearbook of the construction industry. The original data of energy consumption structure came from the energy balance sheet of the China Carbon Emission database. The degree of marketization data comes from the marketization composite index in The Report of Marketization Indexes by Provinces in China. R&D expenditure comes from the official website of the National Bureau of Statistics, Statistical Bulletin and China Statistical Yearbook. The total population and GNP come from China Statistical Yearbook, and the GDP of the construction industry comes from the Statistical Yearbook of China Construction Industry.
1) Dependent variable: The dependent variable in this article is carbon intensity (CI) of the construction industry. In this article, the carbon emission intensity of the construction industry is expressed by the ratio of carbon emission to the total output value of the construction industry (Feng et al., 2017).
2) Independent variable: Energy poverty (EP) based on the Multidimensional Energy Poverty Index and the energy poverty assessment system is constructed by Li et al. (2014); this article builds China’s regional energy poverty system from two aspects of energy access and energy service. Energy access refers to the provision of modern energy services, such as electricity, to all people. Modern energy services specifically refer to access to electricity and clean kitchen appliances in homes. For regional energy poverty, urban and rural areas should be considered at the same time, so indicators representing urban and rural areas are selected in terms of energy access and energy services.
The aforementioned indicators are standardized, and the calculation formula is as follows:
In Eq. 1, yij is the standardized value of item j of province i; xij is the actual value of the j item in province i. Through standardization, each index can be expressed as a value between 0 and 1. A simple arithmetic average method was used to calculate the energy poverty index of different provinces. The basic formula is as follows:
In Eq. 2, EPij is the energy poverty index of item j in province i. yij is the standardized value of the j item in province i; Take 0.125 as wij. The higher the energy poverty index, the more serious the energy poverty in the region.
3) Intermediate variable: Energy consumption structure (ES). In the research of energy consumption structure in recent years, most scholars use the proportion of electricity consumption in total energy consumption or coal consumption in total energy consumption to express energy consumption structure (Gao et al., 2020; Wang, 2020; Zhang et al., 2021). Since carbon emissions are studied in this article, all the energies in the energy consumption structure will be considered comprehensively. Therefore, all energies are multiplied by correlation coefficients and converted into standard coal for subsequent research.
4) Moderating variables: Technical level (Tec) and marketization degree (Mar). Nowadays, it is not enough to control carbon emissions only by optimizing the energy structure and optimizing the allocation of market resources. Technology will also play a certain role. Through the introduction of advanced processes to improve the energy efficiency of equipment and reduce pollution emissions, carbon emissions can be directly reduced. This article adopts R&D/GDP (Li et al., 2020b). The index of marketization degree can be expressed by the ratio of the total output value of non-state–owned construction enterprises and the total output value of the construction industry in the region (Zhang et al., 2019). You can also use Fan Gang et al.ʼs China Marketization Index: Report on the Relative Progress of Marketization in Different Regions in 2009 (Fan et al., 2010). Considering the authority and universality of application, this article chooses the latter.
5) Control variables: Total population, energy intensity, and industrial structure. In order to exclude the influence of other influencing factors on carbon emissions of the construction industry, this study controls the total population, energy intensity, and industrial structure of the region, so as to measure the impact of energy poverty on carbon emissions of the construction industry more accurately (Jiang et al., 2016; Song et al., 2018; Cheng et al., 2019).
The variable definitions are shown in Table 1.
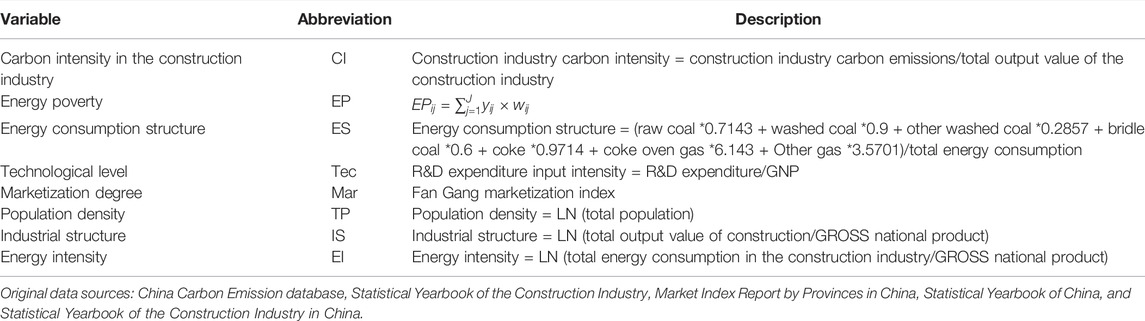
TABLE 1. Variable definition table.
This section uses panel data to analyze the impact of energy poverty on carbon intensity of China’s construction industry. Eq. 3 is a regression model of the impact of energy poverty on carbon intensity of the construction industry, which is used to verify hypothesis H1.
Equation 4 is the regression model of the impact of energy poverty on energy consumption structure, and Eq. 5 is the regression model of the impact of energy poverty on carbon intensity of the construction industry after the addition of energy consumption structure, used to test hypothesis H2.
Eqs 6–8 is the regression model of the moderating effect of technology level on energy poverty and carbon intensity of the construction industry, which is used to verify hypothesis H3a.
Eqs 9–11 is the regression model of the moderating effect of the marketization degree on energy poverty and carbon intensity of the construction industry, which is used to verify hypothesis H3b.
where
After sorting out the data, in order to have a more intuitive understanding of the impact of energy poverty on construction intensity, descriptive statistical analysis of relevant variables of 390 valid samples in 30 provinces and cities from 2004 to 2016 was conducted. The results are shown in Table 2.
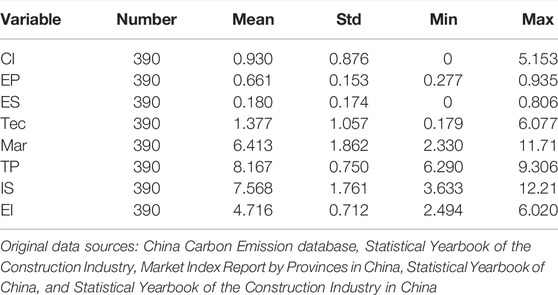
TABLE 2. Descriptive statistical results.
According to the results of descriptive statistical analysis in Table 2, the mean value of CI is 0.93, the minimum value is 0, and the maximum value is 5.15, which indicates that the overall carbon intensity is good during the sample period, but there are still large differences among provinces and cities. The value of carbon intensity is 0 because the carbon emission in some areas is less than 0.001 mt, and the value becomes 0 after two decimal digits are reserved. The reason why the energy consumption structure appears 0 is that in some areas, such as Hainan in 2013, the main energy consumption is electricity and the coal consumption is 0, so the energy consumption structure is 0. The mean value of EP is 0.661, the minimum value is 0.153, and the maximum value is 0.935, indicating that the energy poverty degree is not bad during the sample period. On the whole, the standard deviations of all variables in the sample are less than the mean, indicating that the statistical characteristics of variables are good on the whole.
The correlation between variables is shown in Table 3. Table 3 shows that there is a correlation between the main variables, and the variance inflation factor (VIF) calculated is significantly less than 10, indicating that there is no serious multicollinearity problem in regression analysis.
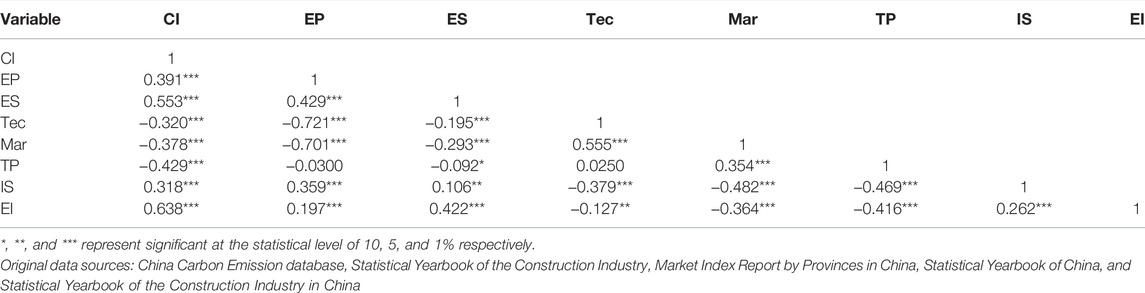
TABLE 3. Pearson correlation coefficients.
The regression results of the impact of energy poverty on carbon intensity of the construction industry are shown in Table 4. The OLS method and the 2SLS model were used to test the impact of energy poverty on carbon intensity of the construction industry in this study.
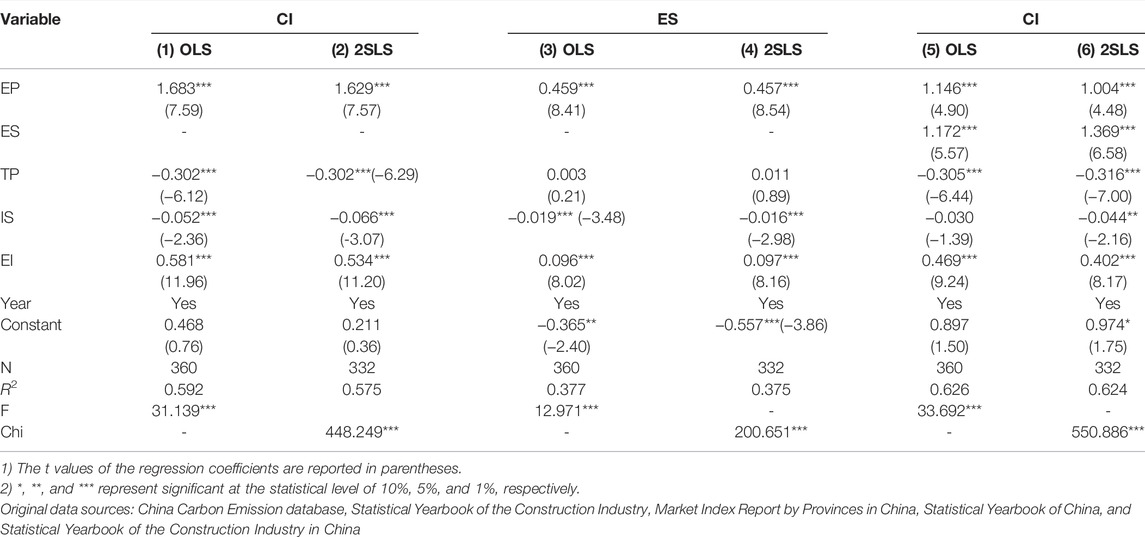
TABLE 4. Main effect and mediation effect test results.
Column 2 shows the regression results made by OLS. There is a positive correlation between energy poverty and carbon intensity of the construction industry, and the carbon intensity of the construction industry increases by 1.683 units for every increase of energy the poverty level by one unit. R2 reflects the explanatory effect of independent variables of the model on dependent variables, while F-statistics represents the overall significance index of the model. R-square is 0.592, indicating that the degree of explanation of the model reaches 59.2%. F-statistic is 13.961 and significant at 1%, indicating that the overall significance of the model is good.
Column 3 is regression using 2SLS. In this study, the existence of endogenous variables is confirmed by the Hausman test, which conforms to the idea of the model. The model reported chi-square statistics, and the comparison p value was 0.000, indicating that the model had a good fitting effect.
The regression results of the aforementioned two models are consistent, that is, energy poverty increases the carbon intensity of the construction industry, so the hypothesis H1 is valid. Then the mediating effect model of Wen (2004) is used to analyze the mediating effect of energy consumption structure (Wen et al., 2004). Models (1)–(2) in Table 4 are regression of the impact of energy poverty on carbon intensity of the construction industry; Model (3)–(4) is the regression of the impact of energy poverty on energy consumption structure; Model (5)–(6) is the regression of the impact of energy poverty on carbon intensity of the construction industry after the addition of energy consumption structure.
As can be seen from Column (3), the regression coefficient of energy poverty on energy consumption structure is significantly positive (
To test whether the moderating effect of technical level exists, this study applies Wen’s (2014) moderated mediation model to test (Wen and Ye, 2014). The first step is to examine whether the direct effect of energy poverty on carbon intensity is moderated by the technology level. The second step is to test whether the mediating effect of energy consumption structure on the impact of energy poverty on carbon intensity is adjusted by the technology level. The results are shown in Table 5.
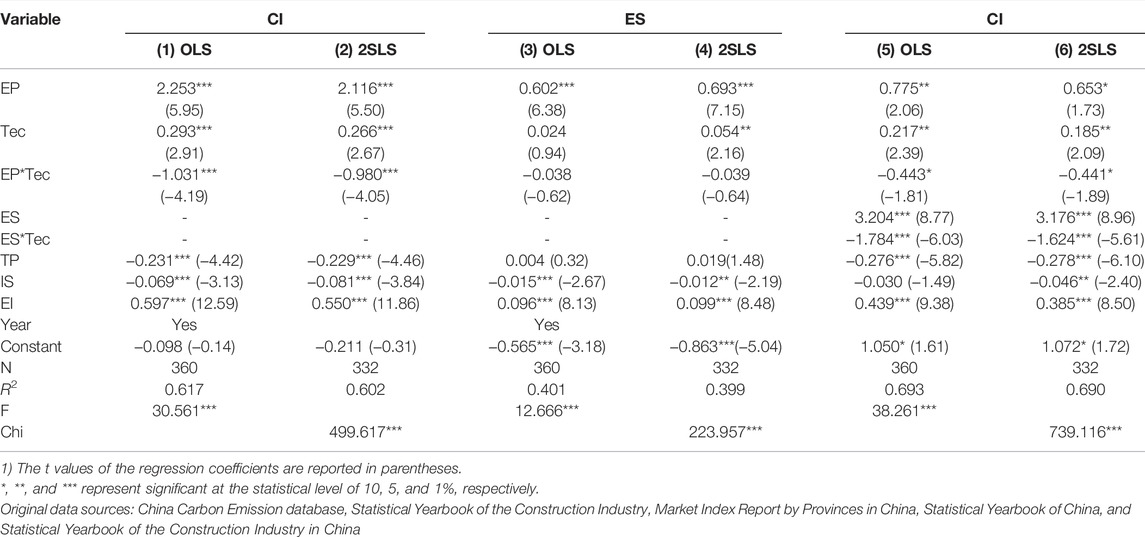
TABLE 5. Test of moderating effect of the technical level.
As can be seen from columns (1)–(2) in Table 5, EP*Tec is the cross product of adding Tec and moderating effect test. Energy poverty had a significant positive effect on carbon intensity in the construction industry, while EP*Tec had a significant negative effect on carbon intensity in the construction industry (
Similarly, to test whether the moderating effect of the degree of marketization exists, the first step is to test whether the direct effect of energy poverty on carbon intensity is regulated by the degree of marketization. The second step is to test whether the mediating effect of energy consumption structure on energy poverty on carbon intensity of the construction industry is regulated by the degree of marketization. The test results are shown in Table 6.

TABLE 6. Test of the moderating effect of the marketization degree.
In columns (1)–2) of Table 6, after adding EP*Mar, the cross product of Mar and moderating effect test, energy poverty has a positive and significant effect on carbon intensity of the construction industry, while EP*Mar has no significant effect on carbon intensity of the construction industry (
To ensure the robustness of the empirical results, this study tested the validity of the “weak instrumental variable,” and the result showed that the F-statistic was greater than 10, so there was no “weak instrumental variable.” Using the finite information maximum likelihood method (LIML) regression, the positive impact of energy poverty on carbon intensity of the construction industry still exists. The regression coefficient between LIML and 2SLS did not change significantly. Based on this, it can be considered that the conclusion of this study is robust. The test results are shown in Table 7.

TABLE 7. Robustness test results of the LIML replacement method.
Based on the interprovincial panel data of China from 2004 to 2016, this article conducts an empirical analysis on the impact of energy poverty and energy consumption structure on carbon emissions of the construction industry and finds that energy poverty has a significant positive impact on carbon intensity. The viewpoint of Ürge-Vorsatz (2012) that improving building energy efficiency can alleviate energy poverty and reduce carbon emissions also confirms this point (Ürge-Vorsatz and Tirado Herrero, 2012). At the same time, the path of energy poverty affecting carbon intensity of the construction industry was explored, and it was found that energy poverty has an impact on carbon intensity of the construction industry through energy consumption structure, and energy consumption institutions play an intermediary role. Furthermore, the moderating effect of the external market environment and the industrial technology level on the influencing path was considered. It was found that the technology level has a moderating effect on the energy consumption structure and building carbon intensity. The market degree has a moderating effect on the relationship between energy consumption structure and carbon intensity of the construction industry.
The limitations of this study are also the focus of future research in two aspects 1) this article explores the impact of energy poverty on carbon intensity of the construction industry, and the research object was limited to the construction industry. This may restrict the impact path between energy relationship and carbon emissions by the construction industry, and the industrial heterogeneity path will be studied in the future. 2) This article studied the relationship between energy poverty and carbon emissions, and may further extend the research chain in the future to explore the impact pathways of energy poverty, carbon emissions, and climate change.
This article analyzes the influencing mechanism of carbon intensity in the construction industry. First, the energy poverty index of each province in China is measured in Section 3.3. Second, in Section 4.3, the regression model is used to test the mediating effect and the moderating effect of the technology level and the marketization degree on the influence mechanism of energy poverty on carbon emissions from the construction industry through energy consumption structure. The main research conclusions are as follows: 1) energy poverty has a positive impact on carbon intensity of the construction industry, and the carbon intensity of the construction industry increases by 1.683 units per unit increase of energy poverty. Regression analysis shows that energy poverty has a positive impact on carbon intensity of the construction industry. Energy poverty is severe in the region, and access to clean, safe, and consumable energy is difficult. This situation leads to the construction industry and other industries tend to use coal and other primary energy. However, the extensive use of energy will lead to low energy efficiency and a large number of carbon emissions. 2) Energy consumption structure plays a mediating role in the influence of energy poverty on carbon intensity of the construction industry. 3) The moderating effect of the technology level and the marketization degree exists. The technology level will reduce the positive impact of energy poverty on carbon intensity of the construction industry, that is, technologically advanced areas where carbon dioxide emissions are reduced through carbon capture, sequestration, and advances in production technology. The improvement of marketization degree of the construction industry enables construction enterprises to strive to improve their core competitiveness in the market close to perfect competition, including but not limited to the use of green technology innovation to improve energy utilization efficiency, development of carbon capture, carbon sequestration, carbon secondary utilization, and other technologies to reduce carbon dioxide emissions.
From the outbreak of COVID-19 in 2019 to the current pandemic, social and economic uncertainties have increased, which in turn affects the macro economy (Işık et al., 2020; Ahmad et al., 2021). Macroeconomic fluctuation makes the economic parameters of the construction industry fluctuate as well, which affects the production cost of the construction industry. This will theoretically affect the choice of energy sources and energy efficiency in the construction industry. The effective utilization of energy is related to the construction industry energy conservation, and emission reduction target can be achieved smoothly. Based on the analysis of the research results, the following policy recommendations are put forward: 1) industrial low-carbon and clean energy consumption structure transformation in coordination. The normalized development trend of COVID-19 poses severe challenges to energy conservation and emission reduction. The public’s requirements for buildings and structures tend to be green, energy saving, and environment friendly, making construction enterprises aware of using cleaner energy in production. However, the difficulty of obtaining clean energy in different regions leads to the difference in energy use cost of construction enterprises. Therefore, local governments should be urged to make full use of their resource endowment and location advantages, focus on project construction according to local conditions, and effectively change the mode of economic development. We will give appropriate subsidies and policy support to enterprises for clean energy, and effectively guide the coordinated development of the low-carbon construction industry and clean energy consumption structure. 2) Introduce and localize carbon reduction technologies. At present, the building materials and energy used in China’s construction industry are highly carbonized. In order to achieve the goal of reducing carbon dioxide in the context of the COVID-19 pandemic, it is suggested that the construction sector take the lead in introducing foreign advanced carbon emission reduction technologies and clean energy acquisition technologies. At the same time, increase investment in green technology, research low-carbon, or carbon-free building materials. Use BIM technology to simulate construction, encourage the recycling of building materials, and promote the use of recycled cement, recycled concrete, and other recycled building materials. 3) Accelerate the establishment of a national carbon emission trading market. With the carbon market as the starting point, the construction enterprises with high emissions and high pollution will be forced to retire or transform their development, the transformation of energy structure will be accelerated, the innovation of low-carbon technology will be promoted, and the market will play an effective role in the allocation of resources, so as to effectively reduce carbon emissions.
Publicly available datasets were analyzed in this study. This data can be found here 1) the carbon emission data and energy consumption of the construction industry are from the China Carbon Emission database (CEADS) https://www.ceads.net.cn/. 2) The rest of the variables come from the official website of the National Bureau of Statistics, Statistical Bulletin, China Statistical Yearbook, and Statistical Yearbook of China Construction Industry. http://www.stats.gov.cn/.
JZ was responsible for determining the theme of energy poverty and carbon intensity in the construction industry and reviewing the revised draft of the paper at various stages and making suggestions. YL was responsible for the design of the study, data collection, collation and analysis, and paper drafting and revision. In the revision of the paper, NS made innovative suggestions on the structure and content of the paper, and made contributions to the improvement of the quality of the paper. HWK made substantial contributions to the revision of the article, including the revision of the article language, the search for new materials to be added to the article, analysis, classification and enrichment of the article, and made contributions to the improvement of the quality of the article.
This research was supported by the National Natural Science Foundation of China project (Grant No. 72002029); Heilongjiang Postdoctoral Research Foundation project (Grant No. 16190026), the open fund project of the liberal arts base of Northeast Petroleum University (Grant No. WKJD202001), the Heilongjiang Provincial Philosophy and Social Science Research Planning Project (Grant No. 20JYE280), and the Heilongjiang Higher Education Reform Project (Grant Nos. SJGZ20200037 and SJGZ20190011).
The authors declare that the research was conducted in the absence of any commercial or financial relationships that could be construed as a potential conflict of interest.
All claims expressed in this article are solely those of the authors and do not necessarily represent those of their affiliated organizations, or those of the publisher, the editors, and the reviewers. Any product that may be evaluated in this article, or claim that may be made by its manufacturer, is not guaranteed or endorsed by the publisher.
Acaroğlu, H., and Güllü, M. (2022). Climate Change Caused by Renewable and Non-renewable Energy Consumption and Economic Growth: A Time Series ARDL Analysis for Turkey. Renew. Energy 04, 138. doi:10.1016/j.renene.2022.04.138
Adebayo, T. S., AbdulKareem, H. K. K., Bilal, D., Kirikkaleli, D., Shah, M. I., and Abbas, S. (2022). CO2 Behavior amidst the COVID-19 Pandemic in the United Kingdom: The Role of Renewable and Non-renewable Energy Development. Renew. Energy 189, 492–501. doi:10.1016/j.renene.2022.02.111
Ahmad, M., Akhtar, N., Jabeen, G., Irfan, M., Khalid Anser, M., Wu, H., et al. (2021). Intention-based Critical Factors Affecting Willingness to Adopt Novel Coronavirus Prevention in Pakistan: Implications for Future Pandemics. Ijerph 18 (11), 6167. doi:10.3390/ijerph18116167
Azam, A., Rafiq, M., Shafique, M., Zhang, H., and Yuan, J. (2021). Analyzing the Effect of Natural Gas, Nuclear Energy and Renewable Energy on GDP and Carbon Emissions: A Multi-Variate Panel Data Analysis. Energy 219, 119592. doi:10.1016/j.energy.2020.119592
Bonatz, N., Guo, R., Wu, W., and Liu, L. (2019). A Comparative Study of the Interlinkages between Energy Poverty and Low Carbon Development in China and Germany by Developing an Energy Poverty Index. Energy Build. 183, 817–831. doi:10.1016/j.enbuild.2018.09.042
Cai, H. Y., Zhao, Y. L., and Xu, Y. Z. (2021). Research on Temporal and Spatial Evolution Pattern and Influencing Factors of China's Energy Poverty. Soft Sci. 35 (04), 28–33+42. doi:10.13956/j.ss.1001-8409.2021.04.05
Castaño-Rosa, R., Solís-Guzmán, J., and Marrero, M. (2020). Energy Poverty Goes South? Understanding the Costs of Energy Poverty with the Index of Vulnerable Homes in Spain. Energy Res. Soc. Sci. 60, 101325. doi:10.1016/j.erss.2019.101325
Chakravarty, S., and Tavoni, M. (2013). Energy Poverty Alleviation and Climate Change Mitigation: Is There a Trade off? Energy Econ. 40, S67–S73. doi:10.1016/j.eneco.2013.09.022
Chen, J. (2019). Research on the Correlation between Technological Innovation, Carbon Emission and Economic Growth in China. Statistics Decis. 35 (22), 126–130. doi:10.13546/j.cnki.tjyjc.2019.22.030
Cheng, T. J., Wang, M., and Wang, J. G. (2019). Driving Effect of Carbon Emission in Jiangsu Province under the Background of Economic New Normal. Sci. Technol. Manag. Res. 39 (23), 242–249.
Fan, G., Wang, X. L., and Zhu, H. P. (2010). Marketization Index in China: Report on Relative Progress of Marketization by Region 2009. Peking: Economic science publishing house.
Feng, Y., Zhu, L. Y., and Zhang, D. H. (2017). Spatial Econometric Study on the Impact of China's Industrial Structure Adjustment on Carbon Intensity[J]. Soft Sci. 31 (07), 11–15. doi:10.13956/j.ss.1001-8409.2017.07.03
Freyre, A., Klinke, S., and Patel, M. K. (2020). Carbon Tax and Energy Programs for Buildings: Rivals or Allies? Energy Policy 139, 111218. doi:10.1016/j.enpol.2019.111218
Gao, Y., Yang, G. H., and Xie, Q. H. (2020). The Impact Mechanism of Heterogeneous Environmental Regulation on Green Total Factor Productivity: Based on the Moderating Effect of Energy Consumption Structure. Resour. Industries 22 (03), 1–10. doi:10.13776/j.cnki.resourcesindustries.20200529.001
Gernaat, D. E. H. J., de Boer, H. S., Daioglou, V., Yalew, S. G., Müller, C., and van Vuuren, D. P. (2021). Climate Change Impacts on Renewable Energy Supply. Nat. Clim. Chang. 11 (2), 119–125. doi:10.1038/s41558-020-00949-9
Greening, L. A., Davis, W. B., and Schipper, L. (1998). Decomposition of Aggregate Carbon Intensity for the Manufacturing Sector: Comparison of Declining Trends from 10 OECD Countries for the Period 1971-1991. Energy Econ. 20 (1), 43–65. doi:10.1016/s0140-6701(98)80785-6
Halkos, G. E., and Gkampoura, E.-C. (2021). Evaluating the Effect of Economic Crisis on Energy Poverty in Europe. Renew. Sustain. Energy Rev. 144, 110981. doi:10.1016/j.rser.2021.110981
Hao, Y., Yin, J. Y., and Yang, D. W. (2014). Regional Differences in Energy Poverty in China. China energy 36 (11), 34–38.
Hassan, S. T., Batool, B., Zhu, B., and Khan, I. (2022). Environmental Complexity of Globalization, Education, and Income Inequalities: New Insights of Energy Poverty. J. Clean. Prod. 340, 130735. doi:10.1016/j.jclepro.2022.130735
Hatzigeorgiou, E., Polatidis, H., and Haralambopoulos, D. (2011). CO2 Emissions, GDP and Energy Intensity: A Multivariate Cointegration and Causality Analysis for Greece, 1977-2007. Appl. Energy 88 (4), 1377–1385. doi:10.1016/j.apenergy.2010.10.008
Hu, L., and Wang, J. F. (2015). Impacts of Urbanization Regional Differences and Marketization Process on CO2 Emissions in China. Urban Dev. Stud. 22 (09), 28–35.
IPCC (2013). Climate Change 2007: The Physical Science Basis(Summary for Policy Makers). Switzerland: Intergovernmental Panel on Climate Change.
Işik, C., Kasımatı, E., and Ongan, S. (2017). Analyzing the Causalities between Economic Growth, Financial Development, International Trade, Tourism Expenditure And/on the CO2emissions in Greece. Energy Sources, Part B Econ. Plan. Policy 12 (7), 665–673. doi:10.1080/15567249.2016.1263251
Işık, C., Ongan, S., and Özdemir, D. (2019). Testing the EKC Hypothesis for Ten US States: an Application of Heterogeneous Panel Estimation Method. Environ. Sci. Pollut. Res. 26 (11), 10846–10853. doi:10.1007/s11356-019-04514-6
Işık, C., Sirakaya-Turk, E., and Ongan, S. (2020). Testing the Efficacy of the Economic Policy Uncertainty Index on Tourism Demand in USMCA: Theory and Evidence. Tour. Econ. 26 (8), 1344–1357. doi:10.1177/1354816619888346
Işık, C. (2013). The Importance of Creating a Competitive Advantage and Investing in Information Technology for Modern Economies: an ARDL Test Approach from Turkey. J. Knowl. Econ. 4 (4), 387–405. doi:10.1007/s13132-011-0075-2
Jiang, F. L., Huang, W. B., and Ma, G. W. (2016). Decomposition of Influencing Factors of Energy Consumption Carbon Emission in Sichuan Province. China Population,Resources Environ. 26 (S1), 45–48.
Li, J. K., Ma, J. J., and Wei, W. (2020). Regional Differences of Energy Carbon Emission Efficiency in Eight Comprehensive Economic Zones in China. J. Quantitative Tech. Econ. 37 (06), 109–129. doi:10.13653/j.cnki.jqte.2020.06.006
Li, K., Wang, K., and Wang, Y. X. (2014). A Comprehensive of China's Regional Energy Poverty. J. Beijing Inst. Technol. Soc. Sci. Ed. 16 (2), 1–12. doi:10.15918/j.jbitss1009-3370.2014.02.015
Li, W., Wang, W., Gao, H., Zhu, B., Gong, W., Liu, Y., et al. (2020). Evaluation of Regional Metafrontier Total Factor Carbon Emission Performance in China's Construction Industry: Analysis Based on Modified Non-radial Directional Distance Function. J. Clean. Prod. 256, 120425. doi:10.1016/j.jclepro.2020.120425
Li, X., Zhang, N., and Song, P. (2022). Research on Energy Saving and Emission Reduction Effect and Mechanism of Carbon Emission Trading System: Based on Empirical Evidence of Synthetic Control Method. Mod. Finance Economics-Journal Tianjin Univ. Finance Econ. 42 (04), 96–113. doi:10.19559/j.cnki.12-1387.2022.04.007
Li, Y., Yang, X., Ran, Q., Wu, H., Irfan, M., and Ahmad, M. (2021). Energy Structure, Digital Economy, and Carbon Emissions: Evidence from China. Environ. Sci. Pollut. Res. 28 (45), 64606–64629. doi:10.1007/s11356-021-15304-4
Li, Z., Li, Y., and Shao, S. (2019). Analysis of Influencing Factors and Trend Forecast of Carbon Emission from Energy Consumption in China Based on Expanded STIRPAT Model. Energies 12 (16), 3054. doi:10.3390/en12163054
Liu, Z. M., Deng, M. Y., and Zhu, P. H. (2022). Can Individual Carbon Trading Schemes Improve Household Energy Poverty? Also on the Design of the Core Parameters of China's Individual Carbon Trading Market. Stat. Res., 1–15. doi:10.19343/j.cnki.11-1302/c.2022.03.008
McGee, J. A., and Greiner, P. T. (2019). Renewable Energy Injustice: The Socio-Environmental Implications of Renewable Energy Consumption. Energy Res. Soc. Sci. 56, 101214. doi:10.1016/j.erss.2019.05.024
Montoya, M. A., Allegretti, G., Sleimann Bertussi, L. A., and Talamini, E. (2021). Renewable and Non-renewable in the Energy-Emissions-Climate Nexus: Brazilian Contributions to Climate Change via International Trade. J. Clean. Prod. 312, 127700. doi:10.1016/j.jclepro.2021.127700
Nguyen, D. K., Huynh, T. L. D., and Nasir, M. A. (2021). Carbon Emissions Determinants and Forecasting: Evidence from G6 Countries. J. Environ. Manag. 285, 111988. doi:10.1016/j.jenvman.2021.111988
Nussbaumer, P., Bazilian, M., and Modi, V. (2012). Measuring Energy Poverty: Focusing on what Matters. Renew. Sustain. Energy Rev. 16 (1), 231–243. doi:10.1016/j.rser.2011.07.150
Razzaq, A., Wang, Y., Chupradit, S., Suksatan, W., and Shahzad, F. (2021). Asymmetric Inter-linkages between Green Technology Innovation and Consumption-Based Carbon Emissions in BRICS Countries Using Quantile-On-Quantile Framework. Technol. Soc. 66, 101656. doi:10.1016/j.techsoc.2021.101656
Recalde, M., Peralta, A., Oliveras, L., Tirado-Herrero, S., Borrell, C., Palència, L., et al. (2019). Structural Energy Poverty Vulnerability and Excess Winter Mortality in the European Union: Exploring the Association between Structural Determinants and Health. Energy Policy 133, 110869. doi:10.1016/j.enpol.2019.07.005
Rehman, A., Ma, H., and Ozturk, I. (2021). Do industrialization, Energy Importations, and Economic Progress Influence Carbon Emission in Pakistan. Environ. Sci. Pollut. Res. 28 (33), 45840–45852. doi:10.1007/s11356-021-13916-4
Setyowati, A. B. (2020). Mitigating Energy Poverty: Mobilizing Climate Finance to Manage the Energy Trilemma in Indonesia. Sustainability 12 (4), 1603. doi:10.3390/su12041603
Solomon, S., Plattner, G.-K., Knutti, R., and Friedlingstein, P. (2009). Irreversible Climate Change Due to Carbon Dioxide Emissions. Proc. Natl. Acad. Sci. U.S.A. 106 (6), 1704–1709. doi:10.1073/pnas.0812721106
Song, J. Z., Yuan, X. Y., and Wang, X. P. (2018). Analysis on Influencing Factors of Carbon Emission Intensity in China's Construction Industry. Environ. Eng. 36 (01), 178–182. doi:10.13205/j.hjgc.201801035
Sun, Y., Anwar, A., Razzaq, A., Liang, X., and Siddique, M. (2022). Asymmetric Role of Renewable Energy, Green Innovation, and Globalization in Deriving Environmental Sustainability: Evidence from Top-10 Polluted Countries. Renew. Energy 185, 280–290. doi:10.1016/j.renene.2021.12.038
Sun, Y., Guan, W., Razzaq, A., Shahzad, M., and Binh An, N. (2022). Transition towards Ecological Sustainability through Fiscal Decentralization, Renewable Energy and Green Investment in OECD Countries. Renew. Energy 190, 385–395. doi:10.1016/j.renene.2022.03.099
Sun, Y., and Razzaq, A. (2022). Composite Fiscal Decentralisation and Green Innovation: Imperative Strategy for Institutional Reforms and Sustainable Development in OECD Countries. Sustain. Dev., 1–14. doi:10.1002/sd.2292
Tang, S., Fu, J. W., and Wu, J. L. (2021). Analysis on Influencing Factors of Carbon Emission in Typical Chinese Cities. Statistics Decis. 37 (23), 59–63. doi:10.13546/j.cnki.tjyjc.2021.23.013
Ürge-Vorsatz, D., and Tirado Herrero, S. (2012). Building Synergies between Climate Change Mitigation and Energy Poverty Alleviation. Energy policy 49, 83–90. doi:10.1016/j.enpol.2011.11.093
Wang, Q., Wang, L. W., Mi, Z. F., and Li, K. (2014). The Impact of China's Energy Poverty Eradication Policy on Climate Change. Energy China 36 (10), 39–43.
Wang, W. X. (2020). Energy Consumption Structure Optimization and Agricultural Economic Growth Based on VAR Model. Mod. Agric. Sci. Technol. 8, 237–240.
Wei, W. X., and Yang, F. (2010). The Impact of Technological Progress on Carbon Dioxide Emissions in China. Stat. Res. 27 (07), 36–44. doi:10.19343/j.cnki.11-1302/c.2010.07.006
Wen, Z. L., and Ye, B. J. (2014). Moderated Mediation Model Testing: Competition or Substitution? Acta Psychol. Sin. 46 (05), 714–726. doi:10.3724/sp.j.1041.2014.00714
Wen, Z. L., Zhang, L., and Hou, J. T. (2004). Mediation Effect Test Program and its Application. Acta Psychol. Sin. 36, 614–620.
Xu, G., Schwarz, P., and Yang, H. (2020). Adjusting Energy Consumption Structure to Achieve China's CO2 Emissions Peak. Renew. Sustain. Energy Rev. 122, 109737. doi:10.1016/j.rser.2020.109737
Zhang, J., Liu, Y., Zhang, W., and Lin, X. (2021). Study on the Impact of Energy Poverty on Energy Efficiency of Construction Industry: Mediating Role of Energy Consumption Structure. Front. Energy Res. 9, 760895. doi:10.3389/fenrg.2021.760895
Zhang, P. W., Jia, G. S., and Mou, Q. (2019). Club Convergence and Causes of Carbon Productivity in China's Construction Industry. China Population,Resources Environ. 29 (01), 40–49.
Zhao, H. Y., Chen, H. H., and Ma, Y. Y. (2018). Spatial-temporal Changes and Influencing Factors of Rural Energy Poverty in China from 2000 to 2015. Geogr. Res. 37 (06), 1115–1126. doi:10.13956/j.ss.1001-8409.2021.04.05
Zhao, J., Jiang, Q., Dong, X., and Dong, K. (2021). Assessing Energy Poverty and its Effect on CO2 Emissions: The Case of China. Energy Econ. 97, 105191–191. doi:10.1016/j.eneco.2021.105191
Zhao, J., Shahbaz, M., and Dong, K. (2022). How Does Energy Poverty Eradication Promote Green Growth in China? the Role of Technological Innovation. Technol. Forecast. Soc. Change 175, 121384. doi:10.1016/j.techfore.2021.121384
Keywords: carbon intensity, energy poverty, energy structure, technical level, marketization degree
Citation: Zhang J, Liu Y, Saqib N and Waqas Kamran H (2022) An Empirical Study on the Impact of Energy Poverty on Carbon Intensity of the Construction Industry: Moderating Role of Technological Innovation. Front. Environ. Sci. 10:929939. doi: 10.3389/fenvs.2022.929939
Received: 27 April 2022; Accepted: 10 May 2022;
Published: 22 June 2022.
Edited by:
Cem Işık, Anadolu University, TurkeyReviewed by:
Hakan Acaroğlu, Eskişehir Osmangazi University, TurkeyCopyright © 2022 Zhang, Liu, Saqib and Waqas Kamran. This is an open-access article distributed under the terms of the Creative Commons Attribution License (CC BY). The use, distribution or reproduction in other forums is permitted, provided the original author(s) and the copyright owner(s) are credited and that the original publication in this journal is cited, in accordance with accepted academic practice. No use, distribution or reproduction is permitted which does not comply with these terms.
*Correspondence: Yushan Liu, MTM5NDYyMTAzMDFAMTYzLmNvbQ==
Disclaimer: All claims expressed in this article are solely those of the authors and do not necessarily represent those of their affiliated organizations, or those of the publisher, the editors and the reviewers. Any product that may be evaluated in this article or claim that may be made by its manufacturer is not guaranteed or endorsed by the publisher.
Research integrity at Frontiers
Learn more about the work of our research integrity team to safeguard the quality of each article we publish.