 Hui Cheng
 Xiaowei Wang
 Danling Chen
94% of researchers rate our articles as excellent or good
Learn more about the work of our research integrity team to safeguard the quality of each article we publish.
Find out more
ORIGINAL RESEARCH article
Front. Environ. Sci., 30 June 2022
Sec. Land Use Dynamics
Volume 10 - 2022 | https://doi.org/10.3389/fenvs.2022.929760
This article is part of the Research TopicLand Governance, Integrated Socio-Ecosystem and Sustainable DevelopmentView all 33 articles
The period from 2010 to 2020 is a period of rapid economic development in China, with the increasing population and the urbanization level reaching 63.89%. Cultivated land plays an extremely important role in China’s food security. In order to grasp the spatial and temporal distribution and change of cultivated land use in China in time, based on GlobeLand30 data in 2010 and 2020, this study studied the spatial and temporal change characteristics of total cultivated land resources, cultivated land development and utilization degree, dynamic change degree of cultivated land utilization rate, and cultivated land use center and direction by using GIS technology, reclamation index, cultivated land utilization rate dynamic change degree model, cultivated land center shift model and standard deviation ellipse model. The results show that: ①The cultivated land area in China has changed greatly during 2010–2020, with the largest increase in cultivated land area in Inner Mongolia and Xinjiang, while the largest decrease in cultivated land area in Shandong, Jiangsu, Hebei, Guangdong, Henan and Zhejiang; ②The areas with the highest degree of cultivated land development and utilization are mainly concentrated in Shandong, Jiangsu, Henan, Anhui and other provinces in the east, while Qinghai, Tibet and Xinjiang have the lowest degree of cultivated land development and utilization; ③The regions with the highest dynamic change degree index of cultivated land utilization rate are mainly concentrated in Inner Mongolia, Xinjiang, Tibet and Qinghai, while the dynamic change degree index of cultivated land utilization rate in Liaoning, Hebei, Shandong, Jiangsu, Shanghai, Zhejiang and Guangdong shows obvious negative changes; ④The spatial and temporal migration of the center of gravity of cultivated land use in China shows the trend of “moving westward to northward”, and the spatial distribution direction of cultivated land use roughly presents the overall characteristics of northeast-southwest direction. This study can effectively reveal the temporal and spatial variation characteristics of cultivated land use at provincial level in China based on GlobeLand30, and provide a scientific reference for further rational development, utilization and protection of cultivated land resources in China.
According to the data of China’s seventh national population census in 2020, China’s current population exceeds 1.41 billion, an increase of 5.38% over the total population in 2010, ranking first in the world population. Food security is the top priority of China’s economic and social sustainable development, and food self-sufficiency needs sufficient cultivated land resources as a guarantee (Huang et al., 2021). Under the background of increasing population, decreasing per capita cultivated land and great challenges to food security in China, it has an important practical significance to study the overall distribution and temporal and spatial changes of cultivated land resources in China (Deng et al., 2015). As a mountainous country, China’s terrain is high in the west and low in the east, with complex and diverse terrain, mainly mountainous areas, with plain areas accounting for only about 12%. Cultivated land resources in China have great spatial distribution differences and temporal and spatial variation characteristics both in quantity and quality. Therefore, it is of great practical significance to study the spatial distribution and temporal and spatial variation characteristics of cultivated land use in China for coordinating the overall utilization of cultivated land resources and land management policies in China.
In the previous studies on cultivated land use in China, most of the research data come from the statistical data of the country and provinces and cities, but the statistical data are limited by the statistical caliber and statistical methods. With the increase of research time span and the continuous adjustment of administrative divisions at all levels, the comparability of statistical data in temporal and spatial analysis is very poor (Liu et al., 2009). Remote sensing satellite image data can solve this problem well. With the continuous development of Earth observation technology, remote sensing technology has become an important means to investigate and monitor land cover change with its advantages of strong timeliness, wide coverage area and low cost (See et al., 2015). High-precision remote sensing satellite data can objectively record the real situation of land cover, and at the same time, it is convenient to obtain long-time series historical image data for comparative analysis. GlobeLand30 is a mainstream data source for land cover research at present. Scholars such as Qiong Hu (Hu Q. et al., 2018), Di Chen (Chen et al., 2018), Mingtao Xiang (Xiang et al., 2018), Yuqiao Long (Long et al., 2018), Li Zhang (Zhang et al., 2018) and Juanjuan Cao (Cao et al., 2018) used this data to study the global and continental cultivated land use change characteristics from 2000 to 2010 from the perspectives of the world, Asia, Europe, America, Africa and Oceania. Jun Chen (Chen et al., 2015) Carried out statistical analysis of spatial distribution changes of urban and rural construction land on a global scale based on GlobeLand30. The research on cultivated land in China based on GlobeLand30 mostly focuses on the period from 2000 to 2010 (Hu J. et al., 2018). Yang Yang studied the loss process of cultivated land based on GlobeLand30 taking Bohai Rim for instance from 2000 to 2010 (Yang et al., 2016). Jiayue Wang analyzed the spatial-temporal variations of cultivated land and grain production in China based on GlobeLand30 from 2000 to 2010 (Wang and Xin, 2017). With the generation of the latest GlobeLand30 data, the research on the new characteristics of cultivated land use change in China in recent 10 years has a strong research trend.
Therefore, based on the GlobeLand30 land cover data in 2010 and 2020, this study studies the spatial distribution pattern of cultivated land use, the degree of cultivated land development and utilization, the dynamic change degree of cultivated land utilization rate, and the spatial and temporal variation characteristics of the center of gravity and direction of cultivated land use in China, in order to reveal the overall spatial and temporal variation characteristics of cultivated land use in China, and provide scientific reference for further rational development, utilization and protection of cultivated land resources in China.
The basic geographic administrative division data of China in the scale of one-millionth with vector format (ESRI shapefiles) comes from National Catalog Service for Geographical Information (http://www.webmap.cn), and this data is re-projected to Albers Equal-area Conic Projection using ArcGIS 10.2.
GlobeLand30 is the world’s first global land cover data product with a resolution of 30 m independently developed by China. It was presented to the United Nations by the Chinese government in September 2014 for sharing by the international community (Chen, 2018). In this paper, the global land cover data of GlobeLand30 with 30 m resolution in 2010 and 2020 is used as the data source of cultivated land information (http://www.globallandcover.cn). The global land cover data of GlobeLand30 with 30 m resolution is developed by China. The GlobeLand30 2000 and 2010 editions were released in 2014 (Pesaresi et al., 2015). The Ministry of Natural Resources started updating this data in 2017, and the GlobeLand30 2020 version has been completed. The classified images used in the development of GlobeLand30 data are mainly 30-m multispectral images, including TM5, ETM +, OLI multispectral images of Landsat and HJ-1 multispectral images of China Environmental Disaster Reduction Satellite. The 2020 edition of data also uses 16-meter resolution Gaofen-1 (GF-1) multispectral images (Yimuranjiang et al., 2021). The GlobeLand30 data includes 10 first-class types, namely: cultivated land, woodland, grassland, shrub land, wetland, water body, tundra, artificial surface, bare land, glacier and permanent snow. The overall accuracy of GlobeLand30 V2010 data is 83.50%, and the overall accuracy of GlobeLand30 V2020 data is 85.72% (Pesaresi et al., 2015). This data is a global land cover data set with the highest spatial resolution and accuracy, which is open to the public. The GlobeLand30 data in the WGS-84 coordinate system was re-projected to the Albers Equal-area Conic Project using ArcGIS 10.2.
Reclamation index is the proportion of cultivated land in a certain area, which measures the degree of development and utilization of land resources in a region. The higher the reclamation index, the higher the degree of development and utilization of cultivated land in this region. The reclamation index used in this paper is (Xiang et al., 2018):
In Eq. 1, I is the cultivated land reclamation index of a certain area. CA is the cultivated land area of a certain area, and LA is the total land area of a certain area. The greater the I value, the higher the degree of development and utilization of cultivated land resources in this area; the smaller the I value, the lower the development and utilization degree of cultivated land resources in this area.
In the past study of cultivated land use change, most scholars used reclamation index and other indicators to measure the degree of land resources development and utilization in a region, that is, the higher the reclamation index, the higher the degree of cultivated land development and utilization in this region. However, the reclamation index in a single year can not reflect the dynamic change degree of land use in a certain period. This study draws lessons from the research results of Mingtao Xiang (Xiang et al., 2018) and others, and constructs a dynamic change degree model of cultivated land utilization rate:
In Eq. 2, I is the dynamic change degree index of cultivated land utilization rate in the statistical unit, which reflects the intensity of dynamic change of cultivated land utilization rate in a period. CA2010 and CA2020 are the cultivated land area in 2010 and 2020 respectively, and LA2010 and LA2020 are the total land area in 2010 and 2020 respectively.
The overall characteristics of cultivated land use change can be characterized by the shift of cultivated land use center of gravity, which can reflect the overall change trend of cultivated land spatial distribution pattern (Wang and Xin, 2017). The essence of cultivated land center of gravity is the point where the moment of regional cultivated land area reaches balance on the spatial plane in a certain period of time (Zhu and Li, 2003), and the characteristics of center of gravity movement such as direction and speed can well reflect the spatial changes of cultivated land elements. The calculation formula of cultivated land center of gravity is expressed as (Huang et al., 2021):
Where: X and Y respectively represent the abscissa and ordinate of the center of gravity of cultivated land distribution in China. N is the number of provincial administrative regions in China, Si represents the cultivated land area of provincial administrative region I, and Xi and Yi represent the abscissa and ordinate of the geographical center of gravity of provincial administrative region I respectively.
The Standard deviation ellipse (SDE) spatial statistical method was first proposed by Lefever in 1926, which is used to measure the global characteristics of spatial distribution of geographical elements from multiple angles. It can accurately reveal the various characteristics of spatial distribution of research objects, including the concentration, dispersion trend and distribution direction of objects, and can quantitatively study the distribution information of research objects in various aspects of spatial distribution (Zuo et al., 2022). In this study, the standard deviation ellipse model was used to explore the spatial evolution trend and development direction of cultivated land use in China during the decade from 2010 to 2020. The relevant calculation formula of the standard deviation ellipse model is expressed as (Ren et al., 2016; Zuo et al., 2022):
Where:
By processing the data of GlobeLand30 in 2010 and 2020, the distribution data of cultivated land resources in 31 regions in Chinese mainland was obtained in Table 1. It can be seen from the table that the cultivated land resources in China are unevenly distributed in 31 provinces and cities, among which Heilongjiang, Inner Mongolia, Sichuan, Shandong, Yunnan and other provinces are rich in cultivated land resources, while Hainan, Tianjin, Tibet, Beijing and Shanghai rank lower in the country. From 2010 to 2020, the total amount of cultivated land resources decreased from 2012708 km2 in 2010–1981488 km2 in 2020, with an average annual decrease of 3121.95 km2 and an average annual decrease of 0.16%.
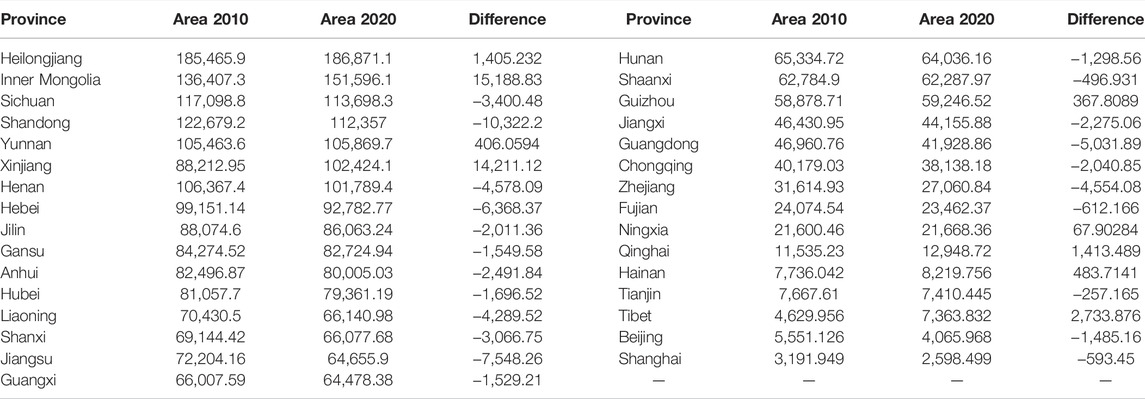
TABLE 1. The area of cultivated land resources of 31 regions in China during 2010–2020 (km2).
According to the cultivated land utilization data extracted from GlobeLand30 data in 2010 and 2020, the cultivated land reclamation index data in Table 2 of 31 regions in Chinese mainland is calculated. According to the definition of reclamation index, it can be seen that the reclamation index measures the degree of land resources development and utilization in a region, and it can be seen that the reclamation index in Shandong, Jiangsu, Tianjin, Henan, Anhui and other regions is higher in 2020, all exceeding 50%, indicating that the higher the degree of cultivated land development and utilization in these regions; However, the reclamation index of Inner Mongolia, Xinjiang, Qinghai, Tibet and other regions in 2020 is low, all below 15%, and the degree of cultivated land development and utilization in these regions is low.

TABLE 2. The reclamation index of 31 regions in China during 2010–2020.
According to the dynamic change degree model of cultivated land utilization rate, the dynamic change degree index of cultivated land utilization rate in 31 regions in Chinese mainland was calculated, in Table 3 and the intensity of dynamic change of cultivated land utilization rate in 2010–2020 was studied by this index. It can be seen that the dynamic change degree index of cultivated land utilization rate in Tibet, Xinjiang, Qinghai, Inner Mongolia, Hainan and other regions is relatively high, which shows that the dynamic change of cultivated land development and utilization in these regions in the past ten years is more drastic, showing a greater growth trend; However, in Jiangsu, Guangdong, Zhejiang, Shanghai, Beijing and other regions, the dynamic change degree index of cultivated land utilization rate is low, showing a great decreasing trend.
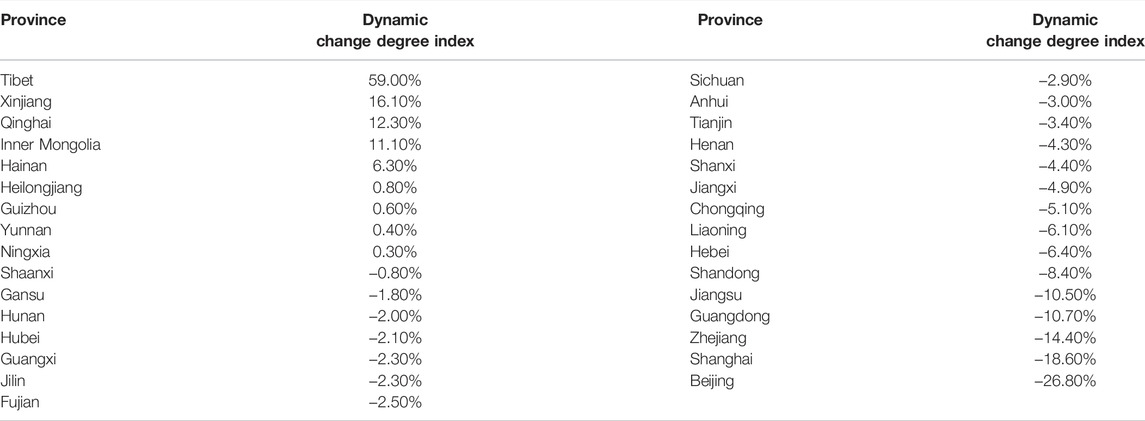
TABLE 3. The dynamic change degree Index of cultivated land utilization rate of 31 regions in China.
According to the cultivated land data extracted from GlobeLand30 images in 2010 and 2020, the distribution of cultivated land center of gravity in 31 regions in China is calculated, as shown in Figure 1. In 2010, the barycentric coordinates of cultivated land in China were (650273, 3840938), located in Qinshui County, Shanxi Province; In 2020, the barycentric coordinates of cultivated land in China were (619846, 3859611), located in Fushan County, Shanxi Province. During the 10 years from 2010 to 2020, the migration distance of cultivated land use center of gravity to the northwest reached 35.7 km. The spatial and temporal migration of the center of gravity of cultivated land use in China presents a development trend of “moving westward and northward”.
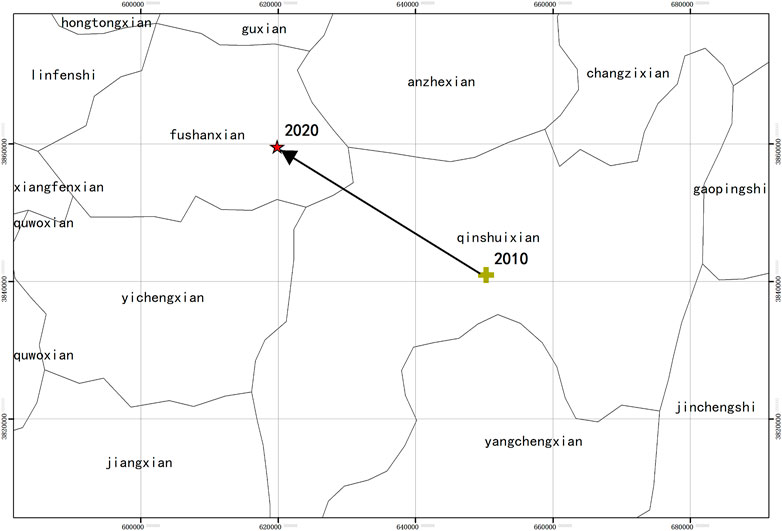
FIGURE 1. The distribution of cultivated land center of gravity in China during 2010–2020.
According to the cultivated land data extracted from GlobeLand30 images in 2010 and 2020, the standard deviation ellipses of 31 regions in China are made, as shown in Figure 2. Among them, the yellow contour line is the standard deviation ellipse of cultivated land of 31 regions in China in 2010, and its ellipse center is completely consistent with the center of gravity of cultivated land in 2010; The red contour line is the standard deviation ellipse of cultivated land of 31 regions in China in 2020, and its ellipse center is completely consistent with the center of gravity of cultivated land in 2020. Ellipse is the main area of cultivated land resources distribution. During the 10 years from 2010 to 2020, there are some differences in the main scope of cultivated land use, the spatial distribution direction and spatial dispersion of cultivated land use.
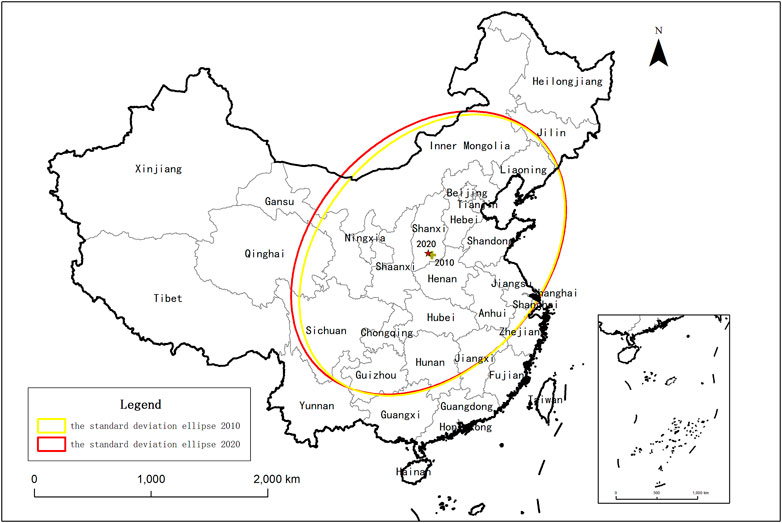
FIGURE 2. The standard deviation ellipse of China during 2010–2020.
According to the natural breaks classification, the national cultivated land use data of GlobeLand30 of 31 regions in China in 2020 are divided into five grades, as shown in Figure 3. It can be seen that the areas rich in cultivated land resources in China are mainly concentrated in Heilongjiang in Northeast China, Xinjiang in Northwest China, Inner Mongolia, Hebei, Henan and Shandong in North China, Sichuan and Yunnan provinces in Southwest China. However, Qinghai, Tibet in the plateau area, Hainan, and Tianjin, Beijing, Shanghai are relatively short of cultivated land resources.
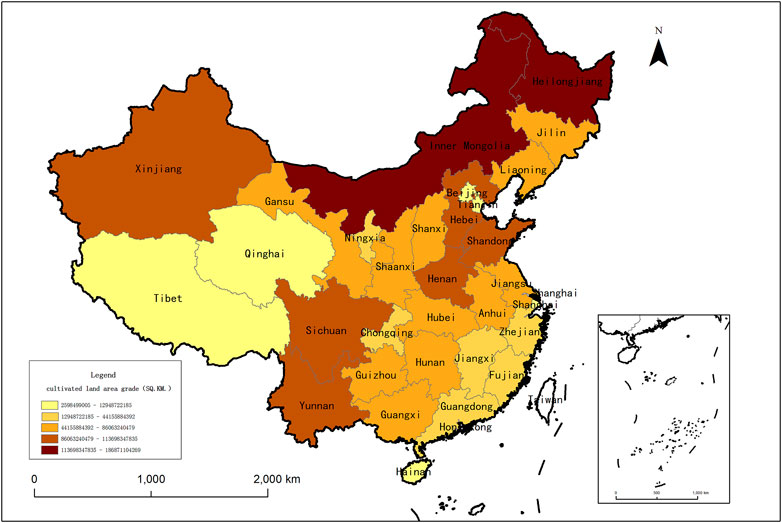
FIGURE 3. The classification map of cultivated land area of China in 2020.
The change difference of cultivated land use area of GlobeLand30 of 31 regions in China in 2010 and 2020 is shown in Figure 4. It can be seen that Inner Mongolia and Xinjiang have the largest increase in cultivated land area, increasing by 15,188 square kilometers and 14,211 square kilometers respectively, far ahead of other provinces and cities. However, it is worth noting that although the amount of cultivated land has increased, the overall quality of cultivated land is not high, the amount of unstable cultivated land is large, and the demand for land for ecological construction and economic and social development is large, so we must unswervingly adhere to the strictest cultivated land protection system. Hainan, Yunnan, Guizhou, Ningxia, Tianjin, Shaanxi have a small change in cultivated land area. Shandong, Jiangsu, Hebei, Guangdong, Henan, Zhejiang have the largest decline in cultivated land area. Due to the rapid economic development in these areas, the scale of urban land is expanding, and a large number of agricultural land is converted into urban construction land, resulting in a large reduction in cultivated land area.
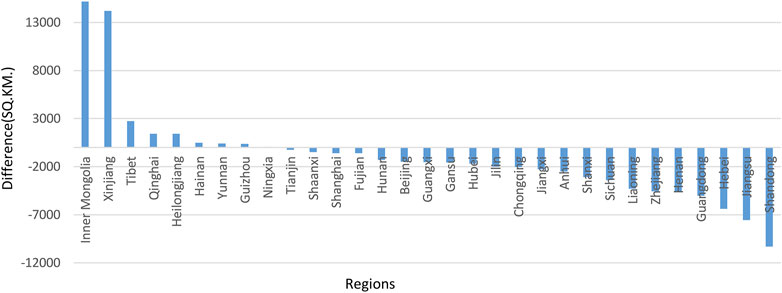
FIGURE 4. The difference of cultivated land area of 31 regions in China during 2010–2020.
The cultivated land reclamation index data of 31 regions in Chinese mainland are divided into five grades according to natural breaks classification, as shown in Figure 5. It can be seen that the areas with the highest degree of cultivated land development and utilization in China are mainly concentrated in Shandong, Jiangsu, Henan, Anhui and other provinces in the east. The reasons are that these provinces have relatively flat terrain, high degree of agricultural mechanization and high reclamation efficiency, and a large amount of high-quality land is suitable for agricultural planting. In addition, Heilongjiang, Jilin and Liaoning in Northeast China, Hebei and Shanxi in North China, Hubei and Chongqing in Central China have high reclamation indexes. These areas are also major grain producing areas in China, with fertile land and suitable climate and other planting conditions. However, Qinghai, Tibet, Xinjiang and other provinces in plateau areas have the lowest degree of cultivated land development and utilization. The reason is that a large amount of land in these provinces is unsuitable for agricultural planting, such as plateau, mountain and desert, with small population, dry climate, less precipitation and less land suitable for agricultural planting.
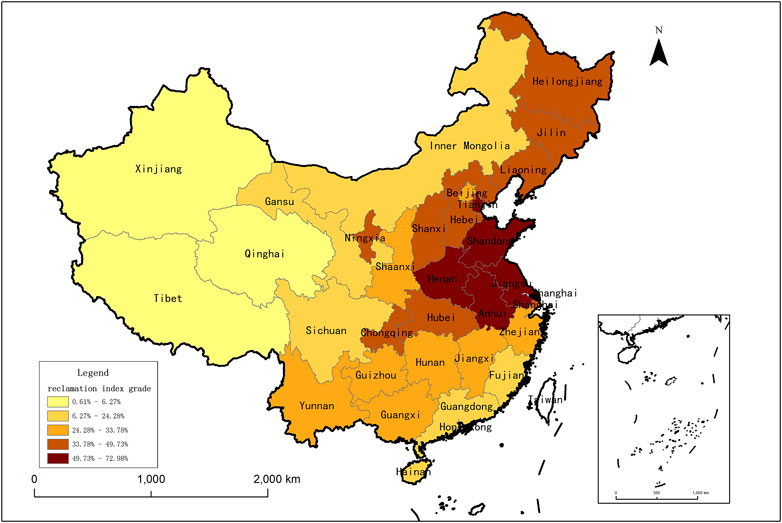
FIGURE 5. The classification map of reclamation index of China in 2020.
The change difference of GlobeLand30 cultivated land reclamation index of 31 regions in China in 2010 and 2020 is shown in Figure 6. It can be seen that Hainan, Inner Mongolia, Xinjiang have the largest increase in cultivated land reclamation index, increasing by 1.4, 1.3 and 0.9% respectively, far ahead of other provinces and cities with positive increase in reclamation index, indicating that although the overall quality of cultivated land in these areas is not good, they still insist on the development of cultivated land. Hainan Province strictly requires that construction land should not occupy high-quality cultivated land by implementing the subsidy project of cultivated land fertility protection, and vigorously carries out land remediation activities. The newly increased cultivated land area is obvious, giving full play to the important function of land remediation in improving the ecological environment of rural areas and mining areas. Inner Mongolia is one of the 13 major grain producing provinces in China, and it is also one of the eight major grain transferring provinces, with more than 20 billion kilograms of grain transferred all the year round. It is one of the four provinces with the highest amount of cultivated land in China, and the total grain output of Inner Mongolia ranks eighth in China in 2020. The main sources of cultivated land increase in Xinjiang are land development and improvement and agricultural structure adjustment. Although the amount of cultivated land has increased, the overall quality of cultivated land in Xinjiang is not high, the amount of unstable cultivated land is large, and the demand for land for ecological construction and economic and social development is large. The decline of cultivated land reclamation index in Shanghai, Beijing, Jiangsu, Shandong, Zhejiang is the largest. These provinces are in the stage of rapid economic development. In order to build roads, cities, industrial mines and villages occupy a large amount of cultivated land, and the high-quality cultivated land in the suburbs is reduced a lot. Moreover, the industrial land exceeds the reasonable limit, and the scale of industrial land is too large and occupies the original high-quality agricultural areas, which not only leads to the rapid reduction of cultivated land area, but also leads to the low output rate of existing agricultural land.
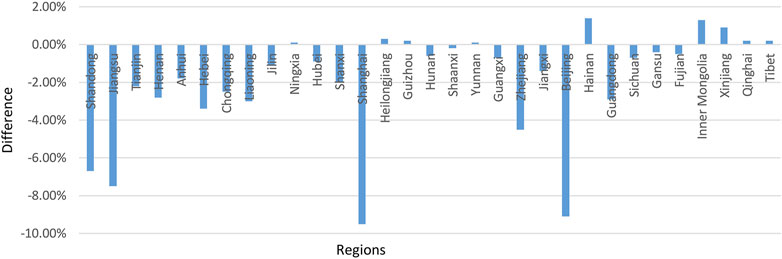
FIGURE 6. The difference of reclamation index of 31 regions in China during 2010–2020.
According to the natural breaks classification, the index data of dynamic change degree of cultivated land utilization rate of 31 regions in Chinese mainland are divided into five grades, as shown in Figure 7. It can be seen that the areas with the highest dynamic change degree index of cultivated land utilization rate in China are mainly concentrated in Inner Mongolia in North China, Xinjiang in Northwest China, Tibet and Qinghai in Qinghai-Tibet Plateau. These provinces have a vast territory and rich land resources. With the continuous progress of agricultural technology, more cultivated land can be continuously reclaimed to meet the needs of food security and modern agricultural development, so the dynamic changes of cultivated land development and utilization are quite drastic. At the same time, it can be seen from Figure 7 that the dynamic change degree index of cultivated land utilization rate in Heilongjiang and Jilin in Northeast China and most provinces and cities in Central China has a small change range. As high-quality agricultural planting areas in China, these areas have unique advantages such as topography and climate. With the proposal and implementation of the strictest cultivated land protection system of the Chinese government’s “the red line of 1.8 billion mu of arable land ", these provinces with high-quality agricultural land distribution minimize the encroachment on cultivated land from the policy level, and the dynamic change degree of all cultivated land development and utilization will not appear obvious. However, the dynamic change degree index of cultivated land utilization rate in Liaoning, Hebei, Shandong, Jiangsu, Shanghai, Zhejiang, Guangdong and other provinces and cities along the eastern coast shows obvious negative changes, which is consistent with the development characteristics of the decrease of cultivated land area in Section 4.1 and the decrease of reclamation index in Section 4.2. Therefore, in the process of rapid industrialization development in these economically developed eastern provinces, how to balance economic development with the red line protection of cultivated land and food security has become an unavoidable problem in these areas, and more attention should be paid to improving the quality and efficiency of existing land in the future utilization of cultivated land.

FIGURE 7. The classification map of dynamic change degree Index of cultivated land utilization rate.
As shown in Table 4, the area of standard deviation ellipse of cultivated land use in China increased by 205,266.69 km2 from 2010 to 2020, indicating that cultivated land use in 2020 is more dispersed and covers a larger area than that in 2010. The center of the standard deviation ellipse shifted from (650.27, 3840.94) to the northwest (619.85, 3859.61), with an offset of about 35.7 km, which was completely consistent with the temporal and spatial change of the center of gravity of cultivated land use. As shown in Figure 4, in the past ten years, the provinces with the largest growth in cultivated land area are provinces in northwestern such as Inner Mongolia, Xinjiang, Tibet. At the same time, the provinces with the greatest decrease in cultivated land area are provinces in southeast such as Shandong, Jiangsu, Hebei, Guangdong, Henan, Zhejiang. The long axis of standard deviation ellipse increased from 956.90 km in 2010 to 994.70 km in 2020, an increase of 37.8 km. The short axis of standard deviation ellipse increased from 1350.67 km in 2010 to 1365.04 km in 2020, an increase of 14.37 km. According to the definition of long and short axes of standard deviation ellipse, the long axis of ellipse indicates the direction of data distribution, and the increase of long axis value indicates that China has further extended the direction of cultivated land use in the past 10 years. The short axis of the ellipse represents the distribution of data dispersion, and the increase of the short axis value represents that the dispersion of cultivated land use in China has a further expanding trend in the past 10 years. The angle of the ellipse is slightly inclined from 40.04° in 2010 to 42.15° in 2020, showing the overall characteristics of northeast-southwest direction, and the axis of the ellipse shows a clockwise rotation trend. This is basically consistent with the spatial distribution characteristics of the total cultivated land resources in Section 4.1.
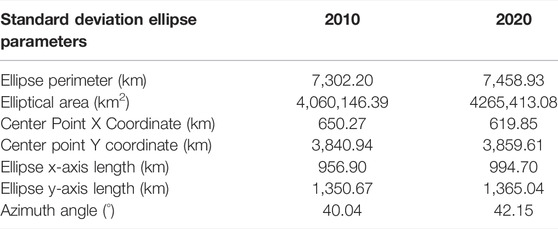
TABLE 4. The parameters of standard deviation ellipse in China during 2010–2020.
From the perspective of remote sensing information technology, this study extracts the cultivated land use data of China in 2010 and 2020 by using GlobeLand30 data, and obtains the spatial distribution pattern of cultivated land use, the degree of cultivated land development and utilization, the dynamic change degree of cultivated land utilization, and the spatial and temporal change characteristics of the center of gravity and direction of cultivated land use in China: ① During the 10 years from 2010 to 2020, the largest increase in cultivated land area in China was in Inner Mongolia and Xinjiang, while the largest decrease was in Shandong, Jiangsu, Hebei, Guangdong, Henan, Zhejiang; ②The areas with the highest degree of cultivated land development and utilization in China are mainly Shandong, Jiangsu, Henan, Anhui, while the provinces with the lowest degree of development and utilization are Qinghai, Tibet and Xinjiang; ③ The regions with the highest dynamic change degree index of cultivated land utilization rate in China are mainly Inner Mongolia, Xinjiang, Tibet and Qinghai, while the provinces with the largest negative change are Liaoning, Hebei, Shandong, Jiangsu, Shanghai, Zhejiang and Guangdong; ④ The spatial and temporal migration of the center of gravity of cultivated land use in China shows the trend of “moving westward to northward”, and the spatial distribution direction of cultivated land use roughly presents the overall characteristics of northeast-southwest direction.
At present, there are few studies on the cultivated land use in China from the scale of provincial administrative regions based on the GlobeLand30 data, in particular, there are fewer related studies during 2010–2020. In order to study the overall change characteristics of cultivated land use in China in the latest period from 2010 to 2020, this study uses the latest released 2020 edition data to improve the timeliness of this research field. This study focuses on the spatial and temporal changes of cultivated land use at the provincial level in China, but there are objective differences in the spatial and temporal distribution of cultivated land use within each province. Therefore, on the basis of clear analysis of the overall law of spatial and temporal variation of cultivated land use at provincial levels in China, we can combine other higher-resolution satellite images, topographic and meteorological data to do a more in-depth study on the spatial and temporal variation law of cultivated land use within each province in the future. In addition, it is also very important for food security to study the correlation between grain production and the cultivated land area change, it is necessary to analyze the output efficiency of cultivated land and its security for cities and population in future research.
The datasets presented in this study can be found in online repositories. The names of the repository/repositories and accession number(s) can be found in the article/Supplementary Material.
All authors listed have made a substantial, direct, and intellectual contribution to the work and approved it for publication.
This paper is supported by the National Natural Science Foundation of China (42101240), Shandong Women’s University High-level Scientific Research Project Cultivation Fund (2019GSPGJ04), Shandong Women’s University School-level Scientific Research Project in 2016 (2016YB10).
The authors declare that the research was conducted in the absence of any commercial or financial relationships that could be construed as a potential conflict of interest.
All claims expressed in this article are solely those of the authors and do not necessarily represent those of their affiliated organizations, or those of the publisher, the editors and the reviewers. Any product that may be evaluated in this article, or claim that may be made by its manufacturer, is not guaranteed or endorsed by the publisher.
Cao, J., Wu, W., Liu, Y., Hu, Q., Chen, D., Xiang, M., et al. (2018). Changes in Cultured Land Use Pattern in Oceania Based on GlobeLand30. Sci. Agric. Sin. 51, 1156–1166. doi:10.3864/j.issn.0578-1752.2018.06.014
Chen, D., Wu, W., Zhou, Q., Hu, Q., Xiang, M., Lu, M., et al. (2018). Changes of Cultured Land Utilization Pattern in Asia from 2000 to 2010. Sci. Agric. Sin. 51, 1106–1120. doi:10.3864/j.issn.0578-1752.2018.06.010
Chen, J. (2018). Framing the Spatial-Temporal Changes in Globe Cultured Land Using GlobeLand3. Sci. Agric. Sin. 51, 1089–1090. doi:10.3864/j.issn.0578-1752.2018.06.008
Chen, J., Chen, L., Li, R., Liao, A., Peng, S., Lu, N., et al. (2015). Spatial Distribution and Ten Years Changes of Globe Build-Up Area Derived from Globeland30. Acta Geod. Cartogr. Sinaica 44, 1181–1188. doi:10.11947/j.AGCS.2015.20140677
Deng, X., Huang, J., Rozelle, S., Zhang, J., and Li, Z. (2015). Impact of Urbanization on Cultivated Land Changes in China. Land Use Policy 45, 1–7. doi:10.1016/j.landusepol.2015.01.007
Hu, J., Chen, J., and Peng, S. (2018). Hot-Spot Analysis of GlobeLand30 Data Studying. Remote Sens. Inf. 33, 1–7. doi:10.3969/j.issn.1000-3177.2018.04.001
Hu, Q., Wu, W., Xiang, M., Chen, D., Long, Y., Song, Q., et al. (2018). Spatial-Temporary Changes in Global Cultured Land over 2000-2010. Sci. Agric. Sin. 51, 1091–1105. doi:10.3864/j.issn.0578-1752.2018.06.009
Huang, H., Wen, L., Kong, X., Chen, W., and Sun, X. (2021). The Impact of Spatial Pattern Evolution of Cultured Land on Cultured Land Suitability in China and its Policy Implementation. China Land Sci. 35, 61–70. doi:10.11994/zgtdkx.20210309.151912
Liu, Y., Wang, J., and Guo, L. (2009). The Spatial-Temporary Changes of Grain Production and Arable Land in China. Sci. Agric. Sin. 42, 4269–4274. doi:10.3864/j.issn.0578-1752.2009.12.018
Long, Y., Wu, W., Hu, Q., Chen, D., Xiang, M., Lu, M., et al. (2018). Spatio-Temporal Changes in America's Cropland over 2000-2010. Sci. Agric. Sin. 51, 1134–1143. doi:10.3864/j.issn.0578-1752.2018.06.012
Pesaresi, M., Ehrlich, D., Ferri, S., Florczyk, A., Freire, S., Haag, F., et al. (2015). Global Human Settlement Analysis for Disaster Risk Reduction. Int. Arch. Photogramm. Remote Sens. Spat. Inf. Sci. XL-7/W3, 837–843. doi:10.5194/isprsarchives-XL-7-W3-837-2015
Ren, J., Fang, B., and Xu, S. (2016). Study on Spatial Distribution and Impact Factors of Reserved Cultivated Land Resources in the Middle and Lower Reaches of Yangtze River. China Land Sci. 30, 71–79. doi:10.11994/zgtdkx.20160607.105432
See, L., Schepaschenko, D., Lesiv, M., McCallum, I., Fritz, S., Comber, A., et al. (2015). Building a Hybrid Land Cover Map with Crowdsourcing and Geographically Weighted Regression. ISPRS J. Photogramm. Remote Sens. 103, 48–56. doi:10.1016/j.isprsjprs.2014.06.016
Wang, J., and Xin, L. (2017). Spatial-Temporary Variations of Cultured Land and Grain Production in China Based on GlobeLand30. Trans. Chin. Soc. Agric. Eng. 33, 1–8. doi:10.11975/j.issn.1002-6819.2017.20.001
Xiang, M., Wu, W., Hu, Q., Chen, D., Lu, M., and Yu, Q. (2018). Spatial-Temporary Changes in Cultured Lands in Europe over 2000-2010. Sci. Agric. Sin. 51, 1121–1133. doi:10.3864/j.issn.0578-1752.2018.06.011
Yang, Y., Ma, X., and He, C. (2016). The Loss Process of Cultured Land Based on GlobeLand30: A Case Study of Binhai Rim. China Land Sci. 30, 72–79. doi:10.11994/zgtdkx.20160817.134456
Yimuranjiang, A., Zhang, Y., and Zibibula, S. (2021). A Study on Change of Land Use Pattern in Hami City during 2000-2020 Based on GlobeLand 30. Bull. Soil Water Conserv. 41, 182–189. doi:10.13961/j.cnki.stbctb.2021.01.026
Zhang, L., Wu, W., Song, Q., Zong, Z., Hu, Q., Chen, D., et al. (2018). Changes in Africa's Cultured Land Use and its Eco-Environmental Factors over 2000-2010. Sci. Agric. Sin. 51, 1144–1155. doi:10.3864/j.issn.0578-1752.2018.06.013
Zhu, H., and Li, X. (2003). Discussion on the Index Method of Regional Land Use Change. ACTA Geogr. Sin. 58, 643–650. doi:10.3321/j.issn:0375-5444.2003.05.001
Keywords: GlobeLand30, land cover, cultivated land use, temporal and spatial change, spatial distribution
Citation: Cheng H, Wang X and Chen D (2022) Research on Spatial-Temporal Variations of Cultivated Land in China Based on GlobeLand30. Front. Environ. Sci. 10:929760. doi: 10.3389/fenvs.2022.929760
Received: 27 April 2022; Accepted: 31 May 2022;
Published: 30 June 2022.
Edited by:
Qingsong He, Huazhong University of Science and Technology, ChinaReviewed by:
Zhang Xupeng, China University of Geosciences Wuhan, ChinaCopyright © 2022 Cheng, Wang and Chen. This is an open-access article distributed under the terms of the Creative Commons Attribution License (CC BY). The use, distribution or reproduction in other forums is permitted, provided the original author(s) and the copyright owner(s) are credited and that the original publication in this journal is cited, in accordance with accepted academic practice. No use, distribution or reproduction is permitted which does not comply with these terms.
*Correspondence: Xiaowei Wang, d2FuZ3hpYW93ZWlzZHd1QDE2My5jb20=
Disclaimer: All claims expressed in this article are solely those of the authors and do not necessarily represent those of their affiliated organizations, or those of the publisher, the editors and the reviewers. Any product that may be evaluated in this article or claim that may be made by its manufacturer is not guaranteed or endorsed by the publisher.
Research integrity at Frontiers
Learn more about the work of our research integrity team to safeguard the quality of each article we publish.