 Xuesen Cai
 Xiaowei Song*
- School of Management, Ocean University of China, Qingdao, China
Under the new normal of economy, a series of active fiscal policies such as tax reduction and fee reduction and new infrastructure construction in China have reduced the source of local government revenue, while the expansion of fiscal expenditure and the widening gap between revenue and expenditure have further exacerbated the motivation of local governments to borrow. Using the spatial econometric model and based on the data of 30 provinces in China from 2006 to 2018, this article deeply studies the impact of local government debt on economic growth and its spatial spillover effect and discusses the regional location heterogeneity of this growth effect. The research shows that: (1) local government debt has significantly promoted regional economic growth; (2) the growth promoting effect of local government borrowing has significant spatial spillover; (3) borrowing debt has the greatest effect on promoting economic growth in the central region, followed by the east, and the west is almost unaffected. Therefore, the Chinese government needs to continue to implement an active fiscal policy, improve the promotion and assessment mechanism of local officials, and adhere to the goal of balanced regional development.
1 Introduction
In the process of accelerating China’s economic construction, local governments have played an important role (Fang et al., 2022; Yang et al., 2021). Local governments are the backbone of China’s rapid economic growth (Wang et al., 2022; Jinru et al., 2021). Under China’s unique financial system, the local government’s financial resources are limited (Abbasi et al., 2022; Irfan and Ahmad 2022), and the local economic and social construction is limited by the funding gap (Chai et al., 2021; Feng et al., 2021; Hao et al., 2020). Under the constraint of funds, local governments seek to make up the funding gap by borrowing money to better perform government functions (Cai et al., 2021; Wu et al., 2021a). In 2021, China’s “Government Work Report” pointed out that it was planning to allocate 3.65 trillion yuan of local government special bonds in that year, accounting for 3.10% of the GDP of that year. Under the new economic normal, a series of active fiscal policies, such as cut taxes and fees and new infrastructure in China, have reduced the revenue source of local governments, while the local fiscal expenditure has expanded (Guo and Shi, 2021). The contradiction between local fiscal revenue and expenditure has further aggravated the motivation of local governments to borrow (Yumei et al., 2022; Yan et al., 2021), resulting in the continuous expansion of the debt scale and the increasing financial burden of local governments (Chen et al., 2020; Rauf et al., 2021; Shi et al., 2022). According to the latest data from the Ministry of Finance of the People’s Republic of China, as of the end of December 2021, the national local government debt balance was 30.47 trillion yuan. Compared with about 15 trillion yuan in 2016, the debt scale doubled in 6 years. The continuous expansion of local government debt has gradually become an important risk hidden in the operation of China’s local financial system. Therefore, the problem of local government debt is a topic worthy of study and of practical significance.
Local government borrowing is a double-edged sword (Feng, 2019; Irfan and Ahmad 2021; Irfan et al., 2022). On the one hand, if the scale of local government debt is too large or uncontrolled, it may lead to the problem that it cannot be paid when it is due, which will lead to financial and even political risks (Li et al., 2022). On the other hand, local government borrowing has played a positive role in economic growth (Cuestas and Regis, 2018). Specifically, borrowing money can temporarily relieve the financial pressure of local governments. The local government’s capital demand for economic infrastructure construction and investment attraction has been met. The improvement of the business environment will attract investors and promote the development of related industries. At the same time, industrial development will promote employment, stimulate the total social demand, and then have a positive impact on economic growth. With the demand of supply-side reform and high-quality economic development, China’s economic growth is slowing down (Ren et al., 2022; Wang et al., 2022). So, can local government borrowing play a role in stimulating economic growth? Under the “political tournament,” does this growth effect have spatial spillover? In addition, in the case of unbalanced regional development, will there be regional heterogeneity in this growth effect? It is of practical significance to discuss these issues at a time when the government’s financial expenditure is expanding.
The possible contributions of this article are as follows: first, compared with the literature on the economic effects of government debt from the national level (Cheng and Gong, 2014; Yusuf and Mohd, 2021), based on the data of China’s regional level, this article uses the OLS model and spatial model to illustrate that local government debt has a direct promoting effect and spatial spillover effect on economic growth. Second, this article not only analyzes the overall effect of local debt on economic growth but also further discusses the heterogeneous impact of local government debt on economic growth in the eastern, central, and western regions.
2 Literature Review
After the financial crisis in 2008 and the subsequent European sovereign debt crisis, the controversial classic topic of the relationship between government debt and economic growth has once again been hotly debated by domestic and foreign scholars (Tang et al., 2022; Qiu et al., 2022). Due to the limitation of the availability of China’s debt data, most of the research in this period was based on foreign data and focussed on the study of the impact of national debt on economic growth (Albu and Albu, 2021; Checherita-Westphal and Roether, 2012; Cheng and Gong, 2014; Guo and Wang, 2014; Panizza and Presbitero, 2014;2021; Yusuf and Mohd, 2021). However, China’s financial system is special, and the universality of these research results to China remains to be discussed. The publication of China’s local debt data shed light on the severity of the local government debt problem and the downward pressure on the economy. In recent years, the research on the economic growth effect of local government debt in China has increased. However, there are differences or even great differences in the conclusions drawn by using different debt data and different research methods. At present, there are three views on the economic growth effect of local government debt.
First, the impact of local government debt on economic growth is non-linear. Local government debt can promote economic growth within a certain debt scale, but it has a negative impact if it exceeds this threshold. Scholars who hold this view believe that the increase in financial resources caused by local government debt will stimulate investment and consumption through such means as undertaking administrative affairs, infrastructure construction, and official competition, which will bring about economic growth. However, when the debt ratio exceeds a certain threshold, it will squeeze out private investment, bring huge debt repayment pressure, and have a negative impact on economic growth (Lv, 2015; Diao, 2017; Chen, 2018; Wu and Bao, 2019; Liu et al., 2020). In addition, due to the different data caliber and indicators of local government debt, scholars have not reached an agreement yet on a specific threshold.
Second, local government debt has a positive effect on economic growth. According to the research of Fan and Mo, (2014), local government debt promotes economic growth by increasing investment and lowering the price of industrial land, which provides a new perspective of the land market for studying the growth effect of borrowing. Zhu and Chen, (2014) found that by using the data of debt audits, China’s local government debt has a pulling effect on regional economic growth, but this effect has convergence characteristics. In addition, local government debt can enable the government to increase investment in green technology innovation such as renewable energy (Adebayo and Kirikkaleli, 2021; Kirikkaleli and Adebayo, 2021; Adebayo, 2022; Adebayo et al., 2022; Fareed et al., 2022), thus promoting sustainable economic growth.
Third, local government debt has a negative hindering effect on economic growth. Sun and Han, (2019) made an empirical study on 30 provinces in China by using the mixed effect model and found that the increase of local government debt is not conducive to economic growth, and this negative impact is obviously heterogeneous in areas with different levels of economic development.
Based on the aforementioned analysis, we can find that the research on the economic growth effect of local government debt has made rich achievements, but unfortunately: (1) the spillover effect of debt between regions has not been taken seriously, which may lead to the deviation of the results. Under the official promotion system in China, horizontal competition, including taxation and fiscal expenditure, exists among local governments (Diao, 2016; Wang, 2017; Zheng et al., 2017; Hong et al., 2020; Huang and Liu, 2020), and ignoring the spatial correlation of local government debt will reduce the credibility of empirical results to some extent. (2) The published articles seldom consider the regional differences of the growth effect of local government debt.
This article tries to use the spatial econometric method to evaluate the impact of local government debt on regional economic growth and its spatial spillover effect. Also, the regional heterogeneity of influence is also analyzed.
3 Mechanism Analysis and Research Hypothesis
Adam pursued liberalism and believed that the government’s bond issuance would encroach on capital and hinder economic growth. Later generations summed up his view as “the theory of harmful debt”; David Ricardo advocated “debt neutrality” and thought that the effect of government bond issuance is like taxation, that is, the “Ricardo equivalence theorem.” With the outbreak of the economic crisis in 1929, Keynes’s “debt benefit theory” has become the mainstream of academic circles. Keynes believed that the expansionary fiscal policy (increasing fiscal expenditure) would stimulate economic growth by stimulating investment and expanding demand. Based on Keynes’s “debt beneficial theory,” this article holds that the mechanism of the influence of local government borrowing on economic growth is as follows: first, according to the financial functions of the new era summarized by Liu et al. (2020), namely, social protection, economic growth, and income distribution functions, the expenditure of local government borrowing is mainly divided into two parts. First, it is used for public infrastructure investment, which is the embodiment of the financial and economic growth function; second, it is used to provide the bottom guarantee for members with weak social development ability. It is the embodiment of financial social protection and income distribution functions. In addition, the increase of investment in public infrastructure will lead to the increase of private investment and increase employment opportunities. In addition, it will stimulate consumer demand by providing all-out protection to the members of society (such as relief to the bottom people and the enterprises that are temporarily struggling to operate due to force majeure) and finally stimulate economic growth. Based on this, the following research hypothesis is put forward: 1. local government debt is positively correlated with regional economic growth.
4 Description of Variables and Data Sources
Based on the provincial panel data of 30 provinces (autonomous regions and municipalities) in China from 2006 to 2018 (except Tibet, Hong Kong, Macau, and Taiwan Province), this article analyzes the impact of local government debt on regional economic growth and its spatial spillover effect.
4.1 The Explained Variable
The explained variable in this article is per capita GDP (Avegdp), and the ratio of GDP of each region to the total population at the end of the year represents the economic growth level of the region (Wu et al., 2019), with the unit of 10,000 yuan.
4.2 Explaining Variables
In this article, the balance of provincial debt data that has not expired after the issuance of bonds every year is selected as the proxy variable of local government debt, that is, the annual bond balance of each province is calculated according to the issuance date and the issuance period of each province, and the unit is one trillion yuan.
4.3 Control Variables
According to the economic theory, common sense, and literature in related research fields, this article selects the following control variables: (1) Labor force growth rate (Lab): expressed by the growth rate of employees at the end of the year, and the unit is %; (2) Investment growth rate (Inv): expressed approximately by the growth rate of fixed asset investments in the whole society, with the unit of %; (3) Openness to the outside world (Ope): learn from the practices of most studies, expressed by the proportion of total regional import and export trade to regional GDP, that is, the degree of opening to the outside world = (total regional import and export trade * current exchange rate)/regional GDP; (4) Education level (Edu): this article uses the proportion of the number of college students in a region to the total population of that region in that year to indicate the education level of that region. That is, the education level = the number of students enrolled as ordinary college students in different regions/the population in different regions; (5) Urbanization rate (Urb): expressed by the proportion of the urban population to the total population, with the unit of %. Table 1 reports the descriptive statistics of each variable. Data quality is the forerunner of the empirical analysis. From the results of the descriptive statistical analysis, the data used in this article have no extreme outliers and systematic errors.
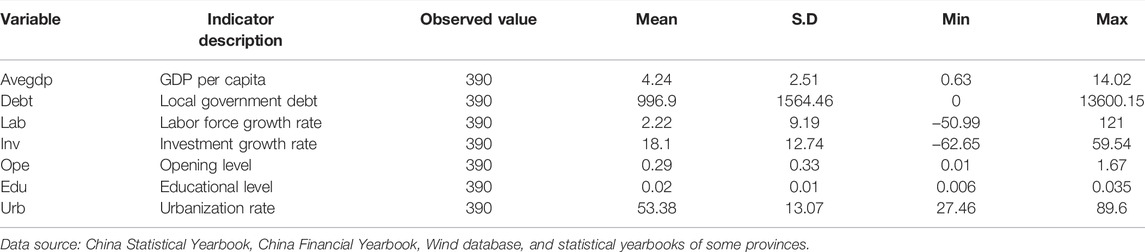
TABLE 1. Descriptive statistical analysis of table variables (2006–2018).
5 Empirical Analysis and Test
5.1 The Construction of Spatial Weight Matrix
The construction of a spatial weight matrix is the key to spatial econometric analysis. Remember that the distance between regions is
According to the different ways of distance division, there are many types of spatial weight matrices, such as adjacency matrix and economic distance weight matrix. The first-order adjacency matrix, that is, 0–1 matrix, is constructed in this article. If area A and area B have a common boundary, it is 1; otherwise, it is 0, as follows:
5.2 Spatial Autocorrelation Test
If there is spatial dependence between data, it is necessary to take the spatial effect into account in the empirical analysis; otherwise, the classical econometric analysis can be used. In this article, Moran ‘I is used to test the spatial autocorrelation of the explained variable per capita GDP:
where sample variance
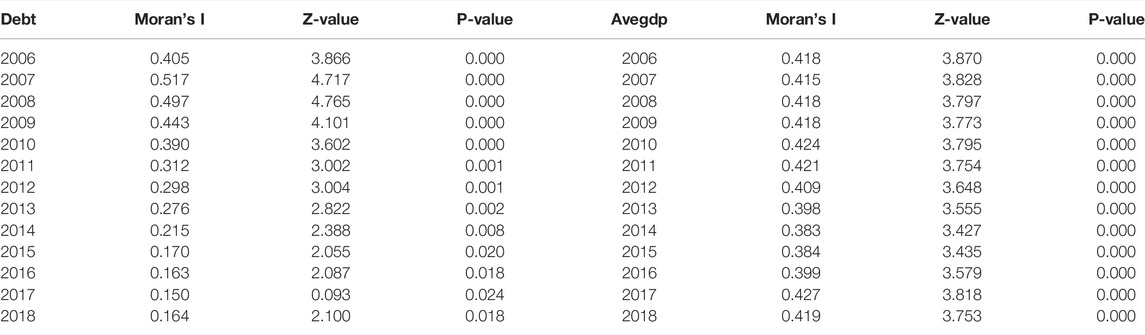
TABLE 2. Global Moran index of local government debt and per capita GDP (2006–2018).
According to Table 2, from 2006 to 2018, the global Moran index of the local government debt level and regional per capita GDP were both greater than 0 and passed the significance test of 1%. This result shows that there is a strong spatial positive correlation between the level of local government debt and economic growth in various regions of China and shows a trend of increasing volatility.
In order to further analyze this spatial dependence, this article uses the constructed spatial weight matrix, i.e., the first-order adjacency matrix, to draw the local Moran scatter diagram of the local government debt and economic growth level in some years (2006, 2010, 2014, and 2018), as shown in Figure 1; Figure 2. From the Moran scatter diagram, we can see that most of China’s provinces are in the first and third quadrants, and there are “high–high” and “low–low” agglomeration phenomena, that is, high (local government debt level or economic growth) level and high (local government debt level or economic growth) level, and low (local government debt level or economic growth) level and low (local government debt level or economic growth) level agglomeration phenomena. Among them, Beijing, Tianjin, Shanghai, Jilin, Heilongjiang, and other provinces (municipalities directly under the central government) are located in the first quadrant, while Gansu, Qinghai, Ningxia, and Xinjiang are in the third quadrant. At the same time, we can see from the local Moran scatter charts in 2006, 2010, 2014, and 2018 that the quadrants of each province are relatively stable, indicating that the spatial dependence of the local government debt and economic growth level in China is relatively stable.
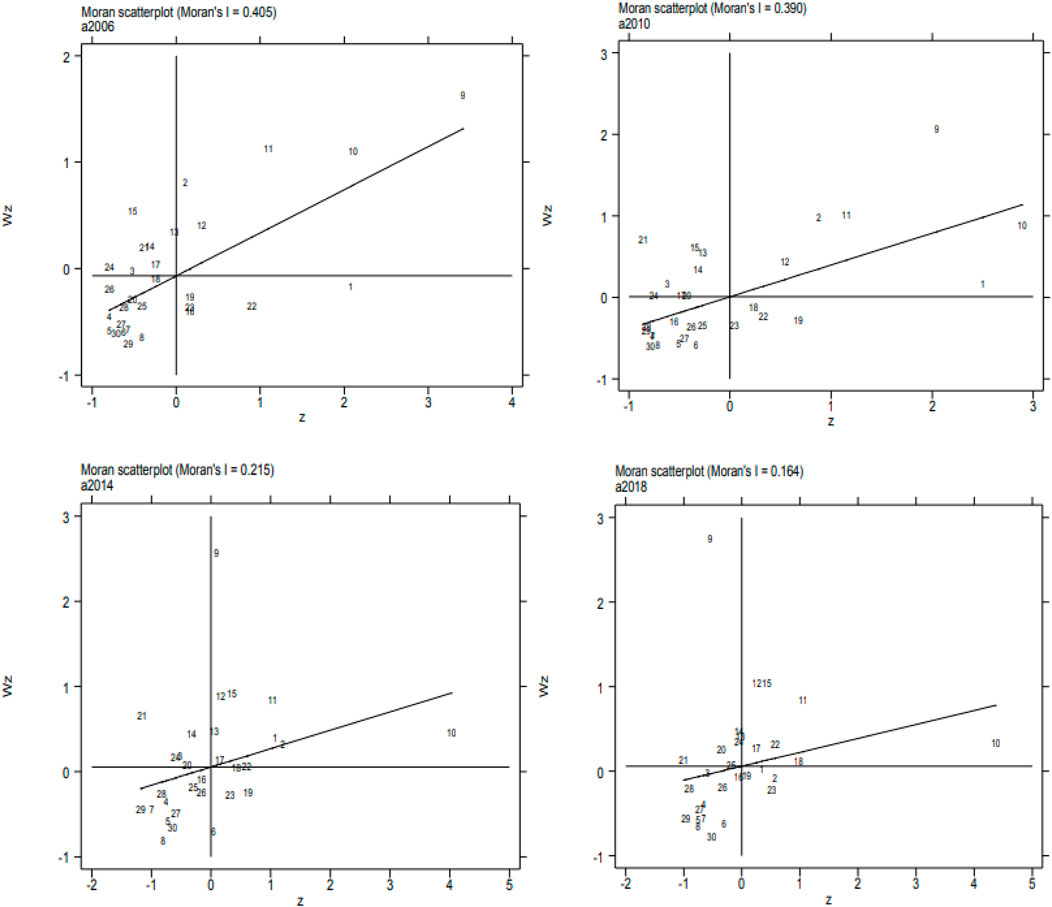
FIGURE 1. Local Moran scatter chart of the local government debt level (2006, 2010, 2014, and 2018).
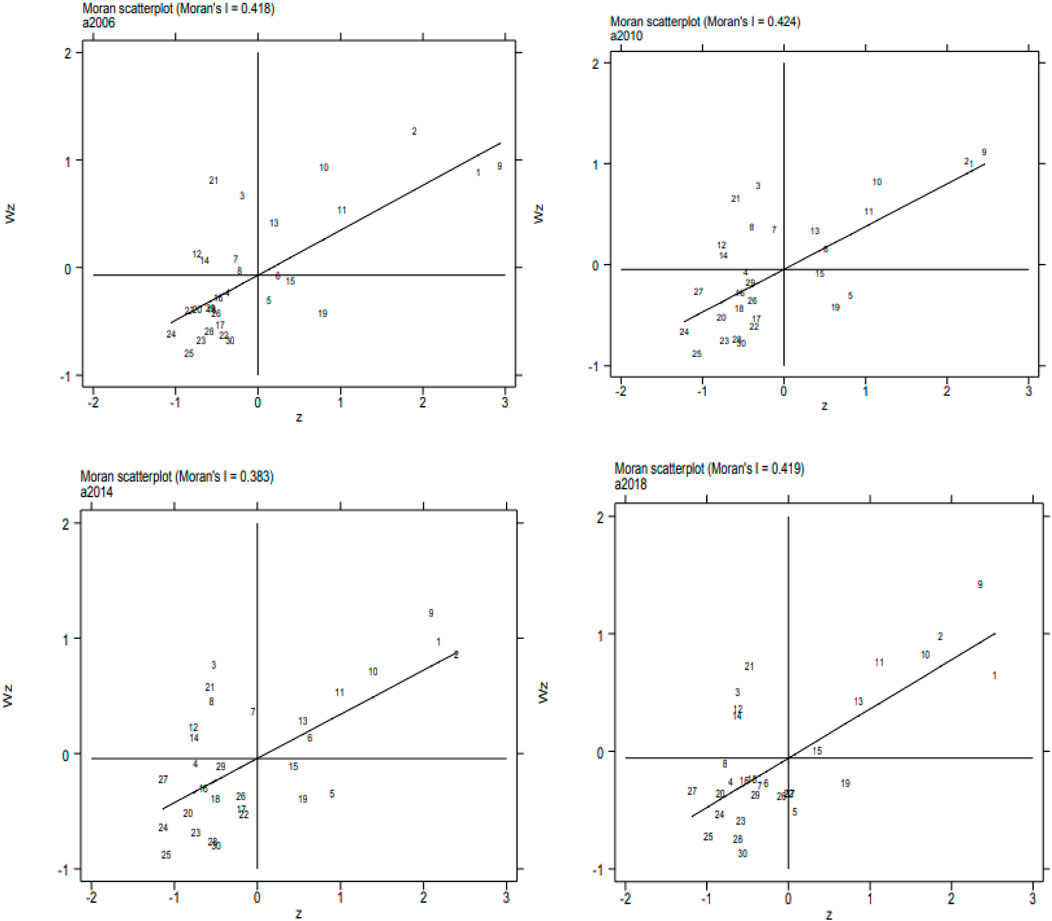
FIGURE 2. Local Moran scatter chart of per capita GDP (2006, 2010, 2014, and 2018).
5.3 Setting and Selection of the Spatial Metrology Model
In the aforementioned research and analysis, Moran’s I value is greater than 0, which shows that there is spatial dependence between the local government debt and economic growth level in China. If we only use ordinary OLS to carry out regression analysis on variables, this spatial effect will be ignored and the regression results will be biased. Based on this, this article uses the spatial lag model (SLM) and spatial error model (SEM) to analyze the impact of the local government debt level on regional economic growth.
5.3.1 Spatial Lag Model
Based on the ordinary econometric model, the spatial lag model adds the spatial lag term of the explained variables and considers the influence of adjacent regions on a region and takes the spatial spillover effect into account in the econometric model. The formula is as follows:
where y is the explained variable,
5.3.2 Spatial Error Model
This kind of spatial error may not be explained by the spatial variable but by the spatial error. The specific formula is as follows:
where y is the dependent variable; X is an independent variable;
5.3.3 Selection of the Spatial Metrology Model (LM Test)
Whether to choose the spatial lag model or the spatial error model, or both, we need to perform LM lag, LM error, and robust tests to make the final judgment. If the LM lag result is significant but the LM error result is not significant, the spatial panel lag model is selected for econometric analysis; otherwise, the spatial panel error model is selected for econometric analysis; if both are significant, SLM and SEM can be used for regression analysis. This article studies the impact of local government debt on regional economic growth. On this basis, it uses Stata software to conduct the LM test on OLS regression results of total samples. Table 3 shows the results of the OLS regression test. It can be seen from Table 3 that the Lagrange multiplier for the spatial error fails the significance test; both Lagrange multiplier and robust Lagrange multiplier tests for spatial errors are significant at the level of 1%. This result shows that the spatial lag model can be used in the quantitative analysis of samples.
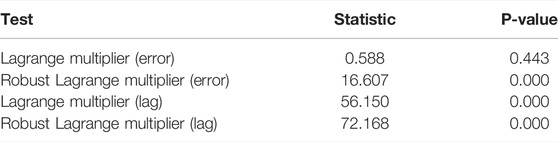
TABLE 3. Results of the OLS regression test.
5.3.4 Results and Discussion
Table 4 shows the test results of the benchmark model and spatial econometric model of the relationship between local government debt level and economic growth. From the OLS regression results, the coefficient of the local government debt level (Debt) is 4.975, which means that if the local government debt level increases by 1%, the per capita GDP will increase by 4.975% and the debt level of local government will promote economic growth. This result is consistent with Zhu and Chen, (2014) and Fan and Mo, (2014). The possible reason is that bonds issued by local governments are mainly used for infrastructure projects and the provision of public services (Huang and Du, 2018). The provision of public goods and services by the government can create a good investment environment, which is conducive to local investment (Shahbaz et al., 2020). Furthermore, government purchase can boost the total social demand, thus stimulating economic growth (Erdoğan et al., 2020).
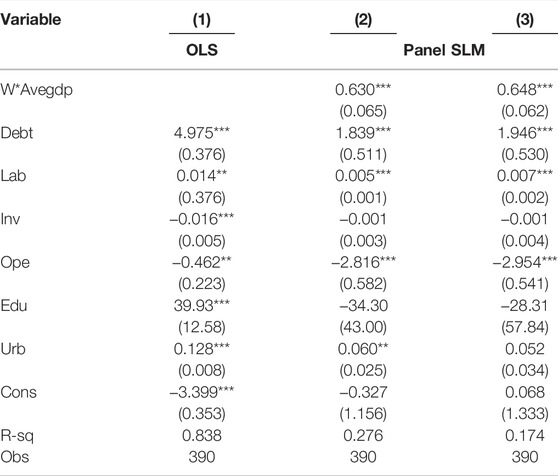
TABLE 4. OLS and SLM test results of the impact of the local government debt level on regional economic growth in 2006–2018.
In the third column of SLM, we can see that the positive effect of debt on local economic growth is 1.9%. The effect of debt on local economic growth is 1.9%. The coefficient of the spatial lag of the dependent variable is 0.630, which has passed the significance test of 1%, and it shows that the growth effect of the local government debt level has obvious spatial spillover. The possible reasons are as follows: under China’s unique financial system and official promotion system, officials will launch promotion tournaments with the goal of GDP, especially referring to the fact that higher-level officials mainly assess and promote lower-level officials according to economic growth, so lower-level officials have a strong motivation to develop the economy in order to get political promotion (Li and Zhou, 2005). In this context, the mutual reference and imitation of government debt decisions between neighboring provinces will create an impact on economic growth. Therefore, the impact of local government debt on economic growth will produce spatial spillover (Zhao et al., 2019).
In addition, the elasticity coefficient of the labor growth rate (Lab) is 0.00541. Through the significance test of 1%, it shows that a labor force increase promotes economic growth. The coefficients of investment in fixed assets (Inv) and education level are −0.00110 and −34.30, respectively, which failed to pass the significance test. The regression coefficient of the degree of opening to the outside world (Ope) is −2.816, and it has passed the significance test of 1% in statistics. It shows that the degree of opening to the outside world has played a significant negative role in China’s economic growth during the observation period. The reason may be that local government officials blindly pursue political achievements and blindly attract foreign investment without evaluating the quality of foreign investment, thus affecting China’s economic growth (Wu et al., 2020; Irfan et al., 2021). The elasticity coefficient of the urbanization rate (Urb) is 0.0602, which indicates that urbanization plays a positive role in economic growth (Ren et al., 2021).
6 Robustness Test
In the aforementioned part, this article discusses the growth effect and spatial spillover effect of local government debt but does not systematically discuss the endogenous problem. The robustness of the empirical results needs to be tested. The possible endogenous problems in this article are: (1) the model setting error is caused by missing variables. The economic growth of a region will be affected by many factors, which are impossible to list the models one by one, but they are mistakenly placed in the error terms, which leads to the deviation of causal identification. (2) Two-way causality: there is a bidirectional causal relationship between local government debt and economic growth that leads to endogenous deviation, that is, “simultaneous equation deviation.” On the one hand, the debt level of a region will affect its growth; conversely, the speed of economic growth in a region will also have an impact on the scale of government bond issuance, so the independence and exogenous nature of variables cannot be guaranteed (Wu et al., 2021b; Yang et al., 2021).
The solution proposed in this article is to learn from the Diao (2016) method, and select the future period of per capita GDP (Avegdp) as the dependent variable to conduct the robustness test. The empirical results are shown in model (3) in Table 4, which are basically consistent with the regression results of model (2). The empirical results after considering endogeneity are still robust and reliable.
7 Heterogeneity Analysis
There is a large gap in local government debt and economic growth in the eastern, central, and western regions of China (Cai et al., 2002). From Table 5, there are large differences in local government debt (Debt), economic growth (Avegdp), labor growth rate (Lab), opening degree (OPE), and education level (Edu). Therefore, it is of great significance to explore the growth effect of regional government debt.
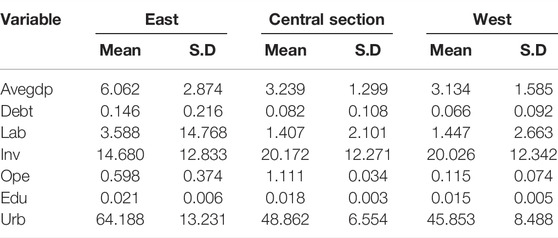
TABLE 5. Descriptive statistical analysis of eastern, central, and western regions of China.
In Table 6, models (4), (5), and (6) give the results of sub-sample regression in eastern, central, and western China, respectively. The regression results of SLM show that: (1) the debt coefficient of eastern and central China is significantly positive at the significance level of 1 and 10%, while that of the western region is not significant, and the elasticity coefficient is 1.612 and 2.386, respectively. For each unit of increase in the level of local government debt in the eastern and central regions, the per capita GDP will increase by 1.612 and 2.386 units, respectively. Local government debt has the greatest pulling effect on the economic growth of the central region, followed by the eastern region, and has little impact on the western region. (2) In terms of the coefficient of the spatial lag term of the dependent variable, the eastern, central, and western regions are significantly positive at the level of 1%. Among them, the eastern region has the largest spatial spillover effect, followed by the western region, and the central region has the smallest.
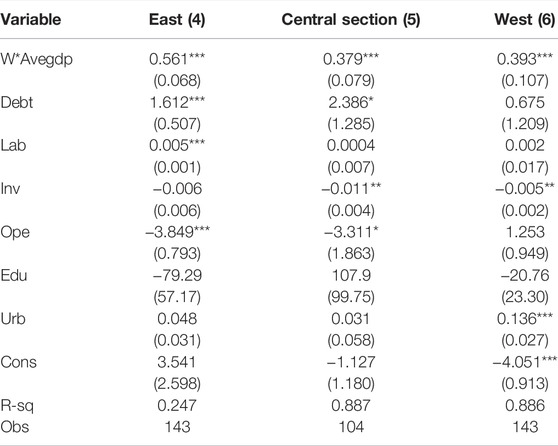
TABLE 6. Regression results of SLM in eastern, central, and western regions of China.
8 Conclusion and Policy Recommendations
Based on the panel data of 30 provinces in China (excluding Tibet) from 2006 to 2018, this article analyzes the impact of local government debt on regional economic growth and its spatial correlation by constructing a spatial econometric model. The empirical results show that, in the sample observation period, the local government’s borrowing behavior can promote economic growth to a certain extent. At the same time, this growth effect has a spatial correlation. Further analysis shows that the growth-promoting effect of local government debt on the economy is heterogeneous in regions. Based on the aforementioned conclusions, this article puts forward the following policy recommendations:
(1) Local government should continue to implement a proactive fiscal policy, improve its efficiency, and prevent systemic local government debt risks. First, in the case of controllable risks, a moderately proactive fiscal policy can inject vitality into the economy and promote short-term economic recovery and long-term economic growth, especially in the period of increasing uncertainty risks such as COVID-19 pandemic, the proactive fiscal policy should be more active and promising, and local government bonds of a certain scale should be issued under the controllable deficit level. Second, China’s local governments need to comprehensively promote budget performance management, monitor local financial operation, continuously improve financial resource allocation efficiency and financial capital performance, and prevent and resolve local government debt risks. Third, the local debt limit should match its level of economic development. Local governments should actively explore market-oriented ways for development, encourage and promote market-oriented investment and financing of platform companies, and broaden investment and financing channels.
(2) Improve the promotion and assessment systems of local officials, and advocate that “Whoever borrows money is responsible.” Under the assessment systems that pay too much attention to the GDP, local competition will easily lead to the increase of expenditure scale, which will lead to the expansion of local debt and aggravate the possibility of debt risk. In addition, excessive and ineffective competition among local governments will lead to redundant construction and waste of resources, which will lead to inefficient use of local financial funds. Therefore, it is necessary to improve the evaluation systems of government officials’ promotion. Specifically, the promotion appraisal systems should not only pay attention to whether the short-term economic growth target is achieved but also pay attention to long-term and hidden achievements such as environmental protection and people’s livelihood and emphasize on high-quality economic development.
(3) According to the research conclusion of this article, there is regional heterogeneity in the role of local government debt in promoting economic growth in China. Based on this conclusion, this article holds that China should continue to adhere to the goal of regional balanced development. Specifically, policies on the scale and structure of local government borrowing should be formulated “according to local conditions” to avoid “one size fits all.” At present, the development gap between regions in China is still relatively large. In different stages of economic development, the economic growth-promoting effect of local government borrowing is different. Therefore, the local government bond-issuing policy should be formulated according to the actual regional development.
Furthermore, we must point out that due to the limitations of the data, this article only discusses the impact of local government debt on economic growth at the provincial level. In addition, due to the short time span of the data, the research of this article is limited to the direct impact of local government debt on economic growth in the short term but failed to investigate the indirect impact of government expenditure in transportation and education on local economic growth in the long term.
Data Availability Statement
The original contributions presented in the study are included in the article/supplementary material; further inquiries can be directed to the corresponding author.
Author Contributions
XC: conceived the idea and contributed to the writing of the manuscript. XS: performed the data collection and statistical analysis. All authors have read and agreed to the published version of the manuscript.
Conflict of Interest
The authors declare that the research was conducted in the absence of any commercial or financial relationships that could be construed as a potential conflict of interest.
Publisher’s Note
All claims expressed in this article are solely those of the authors and do not necessarily represent those of their affiliated organizations, or those of the publisher, the editors, and the reviewers. Any product that may be evaluated in this article, or claim that may be made by its manufacturer, is not guaranteed or endorsed by the publisher.
References
Abbasi, K. R., Shahbaz, M., Zhang, J., Irfan, M., and Lv, K. (2022). Analyze the Environmental Sustainability Factors of China: The Role of Fossil Fuel Energy and Renewable Energy. Renew. Energy 187, 390–402. doi:10.1016/j.renene.2022.01.066
Adebayo, T. S. (2022). Environmental Consequences of Fossil Fuel in Spain amidst Renewable Energy Consumption: A New Insights from the Wavelet-Based Granger Causality Approach. Int. J. Sustain. Dev. World Ecol., 1–14. doi:10.1080/13504509.2022.2054877
Adebayo, T. S., and Kirikkaleli, D. (2021). Impact of Renewable Energy Consumption, Globalization, and Technological Innovation on Environmental Degradation in Japan: Application of Wavelet Tools. Environ. Dev. Sustain 23 (11), 16057–16082. doi:10.1007/s10668-021-01322-2
Adebayo, T. S., Oladipupo, S. D., Adeshola, I., and Rjoub, H. (2022). Wavelet Analysis of Impact of Renewable Energy Consumption and Technological Innovation on CO2 Emissions: Evidence from Portugal. Environ. Sci. Pollut. Res. 29 (16), 23887–23904. doi:10.1007/s11356-021-17708-8
Albu, A.-C., and Albu, L.-L. (2021). Public Debt and Economic Growth in Euro Area Countries. A Wavelet Approach. Technol. Econ. Dev. Econ. 27 (3), 602–625. doi:10.3846/tede.2021.14241
Cai, F., Wang, D., and Du, Y. (2002). Regional Disparity and Economic Growth in China: The Impact of Labor Market Distortions. China Econ. Rev. 13 (2-3), 197–212. doi:10.1016/s1043-951x(02)00072-x
Cai, M., Fan, J., Ye, C., and Zhang, Q. (2021). Government Debt, Land Financing and Distributive Justice in China. Urban Stud. 58 (11), 2329–2347. doi:10.1177/0042098020938523
Chai, J., Hao, Y., Wu, H., and Yang, Y. (2021). Do constraints Created by Economic Growth Targets Benefit Sustainable Development? Evidence from China. Bus. Strat. Env. 30 (8), 4188–4205. doi:10.1002/bse.2864
Checherita-Westphal, C., and Rother, P. (2012). The Impact of High Government Debt on Economic Growth and its Channels: An Empirical Investigation for the Euro Area. Eur. Econ. Rev. 56 (7), 1392–1405. doi:10.1016/j.euroecorev.2012.06.007
Chen, J. (2018). Analysis of the Threshold Effect of Local Government Debt on Economic Growth in China. Contemp. Finance 10, 33–44. (In Chinese). doi:10.13676/j.cnki.cn36-1030/f.2018.10.005
Chen, Z., He, Z., and Liu, C. (2020). The Financing of Local Government in China: Stimulus Loan Wanes and Shadow Banking Waxes. J. Financial Econ. 137 (1), 42–71. doi:10.1016/j.jfineco.2019.07.009
Cheng, Y., and Gong, L. (2014). The Influence of Government Debt on Economic Growth and its Action Channels. Res. Quantitative Econ. 31 (12), 22–37. (In Chinese). doi:10.13653/j.cnki.jqte.2014.12.002
Cuestas, J. C., and Regis, P. J. (2018). On the Dynamics of Sovereign Debt in China: Sustainability and Structural Change. Econ. Model. 68, 356–359. doi:10.1016/j.econmod.2017.08.003
Diao, W. (2016). Research on the Economic Growth Effect of Chinese Local Government Debt under Spatial Correlation. J. Yunnan Univ. Finance Econ. (4), 46–53. (In Chinese). doi:10.16537/j.cnki.jynufe.000124
Diao, W. (2017). The Threshold Effect of Local Government Debt on Economic Growth in China. Quantitative Econ. Res. 34 (3), 59–77. (In Chinese). doi:10.13653/j.cnki.jqte.2017.03.004
Erdoğan, S., Yıldırım, D. Ç., and Gedikli, A. (2020). Natural Resource Abundance, Financial Development and Economic Growth: An Investigation on Next-11 Countries. Resour. Policy 65, 101559. doi:10.1016/j.resourpol.2019.101559
Fan, J., and Mo, J. (2014). Local Debt, Land Market and Regional Industrial Growth. Econ. Res. 49 (1), 41–55. (In Chinese).
Fang, Z., Razzaq, A., Mohsin, M., and Irfan, M. (2022). Spatial Spillovers and Threshold Effects of Internet Development and Entrepreneurship on Green Innovation Efficiency in China. Technol. Soc. 68, 101844. doi:10.1016/j.techsoc.2021.101844
Fareed, Z., Rehman, M. A., Adebayo, T. S., Wang, Y., Ahmad, M., and Shahzad, F. (2022). Financial Inclusion and the Environmental Deterioration in Eurozone: The Moderating Role of Innovation Activity. Technol. Soc. 69, 101961. doi:10.1016/j.techsoc.2022.101961
Feng, J. (2019). Local Government Debt in China: Development in Seven Decades, Current Situation, and Reform Suggestions. China Finance Econ. Rev. 8 (4), 83–97. 10.1515/cfer-2019-080406.
Feng, Y., Wu, F., and Zhang, F. (2021). Changing Roles of the State in the Financialization of Urban Development through Chengtou in China. Reg. Stud., 1–12. doi:10.1080/00343404.2021.1900558
Guo, B., and Wang, B. (2014). Overnment Debt and Economic Growth: An Analysis of Threshold Effect Based on Return on Capital. World Econ. 9, 95–118. (In Chinese).
Guo, Y. M., and Shi, Y. R. (2021). Impact of the VAT Reduction Policy on Local Fiscal Pressure in China in Light of the COVID-19 Pandemic: A Measurement Based on a Computable General Equilibrium Model. Econ. Analysis Policy 69, 253–264. doi:10.1016/j.eap.2020.12.010
Hao, Y., Gai, Z., and Wu, H. (2020). How Do Resource Misallocation and Government Corruption Affect Green Total Factor Energy Efficiency? Evidence from China. Energy Policy 143, 111562. doi:10.1016/j.enpol.2020.111562
Hong, Y., Chen, Li., and Cao, Y. (2020). Does Local Government Competition Hinder the Improvement of Local Government DebtPerformance? Financial Res. 478 (4), 70–90. (In Chinese).
Huang, C., and Liu, R. (2020). Local Government Debt, Regional Difference and Spatial Spillover Effect : A Study on Spatial Econometric Model. J. Central Univ. Finance Econ. 4, 3–14. (In Chinese). doi:10.19681/j.cnki.jcufe.2020.04.001
Huang, Z., and Du, X. (2018). Holding the Market under the Stimulus Plan: Local Government Financing Vehicles' Land Purchasing Behavior in China. China Econ. Rev. 50, 85–100. doi:10.1016/j.chieco.2018.04.004
Irfan, M., and Ahmad, M. (2022). Modeling Consumers' Information Acquisition and 5G Technology Utilization: Is Personality Relevant? Personality Individ. Differ. 188, 111450. doi:10.1016/j.paid.2021.111450
Irfan, M., and Ahmad, M. (2021). Relating Consumers' Information and Willingness to Buy Electric Vehicles: Does Personality Matter? Transp. Res. Part D Transp. Environ. 100, 103049. doi:10.1016/j.trd.2021.103049
Irfan, M., Elavarasan, R. M., Ahmad, M., Mohsin, M., Dagar, V., and Hao, Y. (2022). Prioritizing and Overcoming Biomass Energy Barriers: Application of AHP and G-TOPSIS Approaches. Technol. Forecast. Soc. Change 177, 121524. doi:10.1016/j.techfore.2022.121524
Irfan, M., Hao, Y., Ikram, M., Wu, H., Akram, R., and Rauf, A. (2021). Assessment of the Public Acceptance and Utilization of Renewable Energy in Pakistan. Sustain. Prod. Consum. 27, 312–324. doi:10.1016/j.spc.2020.10.031
Jinru, L., Changbiao, Z., Ahmad, B., Irfan, M., and Nazir, R. (2021). How Do Green Financing and Green Logistics Affect the Circular Economy in the Pandemic Situation: Key Mediating Role of Sustainable Production. Econ. Research-Ekonomska Istraživanja, 1–21. doi:10.1080/1331677x.2021.2004437
Kirikkaleli, D., and Adebayo, T. S. (2021). Do renewable Energy Consumption and Financial Development Matter for Environmental Sustainability? New Global Evidence. Sustain. Dev. 29 (4), 583–594. doi:10.1002/sd.2159
Li, H., and Zhou, L. A. (2005). Political Turnover and Economic Performance: The Incentive Role of Personnel Control in China. J. public Econ. 89 (9-10), 1743–1762. doi:10.1016/j.jpubeco.2004.06.009
Li, Z., Wu, F., and Zhang, F. (2022). A Multi-Scalar View of Urban Financialization: Urban Development and Local Government Bonds in China. Reg. Stud., 1–13. doi:10.1080/00343404.2021.1998419
Liu, Z., Ren, J., and Chen, X. (2020). The Impact of Local Government Debt on Economic Growth : Based on the Dual Perspective of DebtScale and Debt Structure. Reform 4, 100–115. (In Chinese).
Lv, J. (2015). Analysis of the Influence of Local Debt on Economic Growth-From the Perspective of Liquidity. China Ind. Econ. 11, 16–31. (In Chinese). doi:10.19581/j.cnki.ciejournal.2015.11.002
Panizza, U., and Presbitero, A. F. (2014). Public Debt and Economic Growth: Is There a Causal Effect? J. Macroecon. 41, 21–41. doi:10.1016/j.jmacro.2014.03.009
Qiu, W., Bian, Y., Zhang, J., and Irfan, M. (2022). The Role of Environmental Regulation, Industrial Upgrading, and Resource Allocation on Foreign Direct Investment: Evidence from 276 Chinese Cities. Environ. Sci. Pollut. Res., 1–17. doi:10.1007/s11356-022-18607-2
Rauf, A., Ozturk, I., Ahmad, F., Shehzad, K., Chandiao, A. A., Irfan, M., et al. (2021). Do Tourism Development, Energy Consumption and Transportation Demolish Sustainable Environments? Evidence from Chinese Provinces. Sustainability 13 (22), 12361. doi:10.3390/su132212361
Ren, S., Hao, Y., and Wu, H. (2022). The Role of Outward Foreign Direct Investment (OFDI) on Green Total Factor Energy Efficiency: Does Institutional Quality Matters? Evidence from China. Resour. Policy 76, 102587. doi:10.1016/j.resourpol.2022.102587
Ren, S., Hao, Y., Xu, L., Wu, H., and Ba, N. (2021). Digitalization and Energy: How Does Internet Development Affect China's Energy Consumption? Energy Econ. 98, 105220. doi:10.1016/j.eneco.2021.105220
Shahbaz, M., Raghutla, C., Song, M., Zameer, H., and Jiao, Z. (2020). Public-private Partnerships Investment in Energy as New Determinant of CO2 Emissions: The Role of Technological Innovations in China. Energy Econ. 86, 104664. doi:10.1016/j.eneco.2020.104664
Shi, C., Lu, N., Qin, Y., Liu, M., Li, H., and Li, H. (2021). Study on Mechanical Properties and Permeability of Elliptical Porous Scaffold Based on the SLM Manufactured Medical Ti6Al4V. PloS one 16 (3), e0247764. doi:10.1371/journal.pone.0247764
Shi, R., Irfan, M., Liu, G., Yang, X., and Su, X. (2022). Analysis of the Impact of Livestock Structure on Carbon Emissions of Animal Husbandry: A Sustainable Way to Improving Public Health and Green Environment. Front. Public Health 10, 835210. doi:10.3389/fpubh.2022.835210
Sun, Y., and Han, Z. (2019). Study on the Influence Mechanism of Local Government Debt on Regional Economic Growth in China. Quantitative Econ. Res. 10 (4), 104–126. (In Chinese).
Tang, C., Irfan, M., Razzaq, A., and Dagar, V. (2022). Natural Resources and Financial Development: Role of Business Regulations in Testing the Resource-Curse Hypothesis in ASEAN Countries. Resour. Policy 76, 102612. doi:10.1016/j.resourpol.2022.102612
Wang, J., Wang, W., Ran, Q., Irfan, M., Ren, S., Yang, X., et al. (2022). Analysis of the Mechanism of the Impact of Internet Development on Green Economic Growth: Evidence from 269 Prefecture Cities in China. Environ. Sci. Pollut. Res. 29 (7), 9990–10004. doi:10.1007/s11356-021-16381-1
Wang, S. (2017). Fiscal Pressure, Expenditure Competition and Local Government Debts- an Analysis Based on SpatialEconometric Model. Econ. Manag. Rev. 33 (5), 74–82. (In Chinese).
Wu, H., Ba, N., Ren, S., Xu, L., Chai, J., Irfan, M., et al. (2021a). The Impact of Internet Development on the Health of Chinese Residents: Transmission Mechanisms and Empirical Tests. Socio-Economic Plan. Sci. 81, 101178. doi:10.1016/j.seps.2021.101178
Wu, H., Hao, Y., and Ren, S. (2020). How Do Environmental Regulation and Environmental Decentralization Affect Green Total Factor Energy Efficiency: Evidence from China. Energy Econ. 91, 104880. doi:10.1016/j.eneco.2020.104880
Wu, H., Hao, Y., and Weng, J.-H. (2019). How Does Energy Consumption Affect China's Urbanization? New Evidence from Dynamic Threshold Panel Models. Energy policy 127, 24–38. doi:10.1016/j.enpol.2018.11.057
Wu, H., Xue, Y., Hao, Y., and Ren, S. (2021b). How Does Internet Development Affect Energy-Saving and Emission Reduction? Evidence from China. Energy Econ. 103, 105577. doi:10.1016/j.eneco.2021.105577
Wu, T., and Bao, J. (2019). The Economic Growth Effect of Local Government Financing in the Bond Market. New Finance 10, 23–29. (In Chinese).
Yan, G., Peng, Y., Hao, Y., Irfan, M., and Wu, H. (2021). Household Head's Educational Level and Household Education Expenditure in China: The Mediating Effect of Social Class Identification. Int. J. Educ. Dev. 83, 102400. doi:10.1016/j.ijedudev.2021.102400
Yang, C., Hao, Y., and Irfan, M. (2021). Energy Consumption Structural Adjustment and Carbon Neutrality in the Post-COVID-19 Era. Struct. Change Econ. Dyn. 59, 442–453. doi:10.1016/j.strueco.2021.06.017
Yumei, H., Iqbal, W., Irfan, M., and Fatima, A. (2022). The Dynamics of Public Spending on Sustainable Green Economy: Role of Technological Innovation and Industrial Structure Effects. Environ. Sci. Pollut. Res. 29 (16), 22970–22988. doi:10.1007/s11356-021-17407-4
Yusuf, A., and Mohd, S. (2021). The Impact of Government Debt on Economic Growth in Nigeria. Cogent Econ. Finance 9 (1), 1946249. doi:10.1080/23322039.2021.1946249
Zhang, M., Tan, S., and Zhang, X. (2022). How Do Varying Socio-Economic Factors Affect the Scale of Land Transfer? Evidence from 287 Cities in China. Environ. Sci. Pollut. Res., 1–13. doi:10.1007/s11356-021-18126-6
Zhao, R., Tian, Y., Lei, A., Boadu, F., and Ren, Z. (2019). The Effect of Local Government Debt on Regional Economic Growth in China: A Nonlinear Relationship Approach. Sustainability 11 (11), 3065. doi:10.3390/su11113065
Zheng, W., Lu, Y., and Li, X. (2017). Does Local Government Competition Promote the Growth of Local Debt——Empirical evidence from China's provincial urban investment bonds and spatial spillover effect. J. Southwest Unniversity Natl. Humanit. Soc. Sci. 2, 135–141. (In Chinese).
Keywords: local government debt, economic growth, space spillover effect, China, environmental consequences
Citation: Cai X and Song X (2022) Analyzing the Mechanism Between Local Government Debts and China’s Economic Development: Spatial Spillover Effects and Environmental Consequences. Front. Environ. Sci. 10:928975. doi: 10.3389/fenvs.2022.928975
Received: 26 April 2022; Accepted: 16 May 2022;
Published: 30 June 2022.
Edited by:
Muhammad Irfan, Beijing Institute of Technology, ChinaReviewed by:
Tomiwa Sunday Adebayo, Cyprus International University, TurkeyMahejabin Sayyad, Agasti Arts, Commerce, and Dadasaheb Rupwate Science College, Akole, India
Copyright © 2022 Cai and Song. This is an open-access article distributed under the terms of the Creative Commons Attribution License (CC BY). The use, distribution or reproduction in other forums is permitted, provided the original author(s) and the copyright owner(s) are credited and that the original publication in this journal is cited, in accordance with accepted academic practice. No use, distribution or reproduction is permitted which does not comply with these terms.
*Correspondence: Xiaowei Song, c29uZ3hpYW93ZWlAc3R1Lm91Yy5lZHUuY24=