 Wei Huang
 Jiaxin Li
- Research Center for Territorial Spatial Planning, Ningxia, China
To understand the complex relationship between urbanization and carbon emissions, this study measures the urbanization level and land-use carbon emissions of 19 counties and districts in Ningxia from 2009 to 2019 using the integrated index method and carbon emission model, respectively, and explores the coupling relationship based on the coupling coordination degree model, to provide theoretical support for low-carbon urbanization and carbon emission reduction planning in Ningxia. The research results showed that the comprehensive evaluation index of the Ningxia urbanization system shows a linear increasing trend with an average annual growth of 1.6%, but the overall level is low, and the overall spatial pattern being high in the North and low in the South is shown. The dominant type of urbanization is population and economic urbanization. The average annual growth rate of net carbon emissions from land use in Ningxia is 4.75 106t/a. Spatially, it is characterized by higher levels in cities in the North along the Yellow River Ecological and Economic Zone and lower levels in the central arid zone and southern mountainous areas. The coupling degree and coupling coordination degree of Ningxia urbanization and land use carbon emissions show a fluctuating upward trend but belong to a low level of mutual constraints, i.e., the low level of development of Ningxia urbanization, backward industries, and low energy utilization lead to the growth of carbon emissions in Ningxia and restrict the development of urbanization. The government should take into account the regional differences when formulating carbon emission reduction policies to maintain appropriate population size, optimize the economic structure, and improve the land use efficiency.
1 Introduction
With the growth of the global population and rapid socio-economic development, global warming, glacial melting, and other environmental pollution issues, especially greenhouse gases, are becoming increasingly prominent (Green 2020; Dragan et al., 2021). Since the release of the Fourth Assessment Report of the Intergovernmental Panel on Climate Change (IPCC) in 2007, the global academic community has made many new findings on various aspects of climate change (Frank et al., 2002), among which the “land use change plays an important role in the increase in global atmospheric carbon dioxide levels, second only to fossil fuel combustion,” is a very important conclusion (Houghton, 2010; Sreekanth 2021). According to the carbon emission calculator of the World Resources Organization, the global carbon emissions between 1850 and 1998, land use change, and the carbon emissions caused by it are 1/3 of the total emissions influenced by human activities; and the cumulative carbon emission from land use change in China from 1950 to 2005 is 10.6 PGC, accounting for the cumulative carbon emissions from land use change in China from 1950 to 2005, which accounted for 30% of all carbon emissions from anthropogenic sources and 12% of global carbon emissions from land use change in the same period. China is the largest carbon emitter in the world, with greenhouse gas emissions of 14 billion tons of CO2 equivalent in 2019, accounting for 26.7% of the total global emissions (Ahmad et al., 2020). In September 2020, President Xi Jinping proposed at the 75th session of the United Nations General Assembly that China would increase its national contribution, adopt more vigorous policies and measures, strive to peak CO2 emissions by 2030, and achieve carbon neutrality by 2060. In September 2021, the “Opinions of the Central Committee of the Communist Party of China (CPC) and the State Council on the Complete and Accurate Implementation of the New Development Concept to Achieve Carbon Neutrality” made systematic planning and overall planning for China to achieve peak carbon and carbon neutrality. In October 2021, the State Council issued the “Action Plan for Achieving Carbon Neutrality by 2030,” which further elaborated the requirements for achieving carbon neutrality in various key areas (Shi and Guo, 2022) such as how to accelerate the improvement of all-factor carbon emission efficiency and effectively reduce total carbon emissions and climate change (Elahi et al., 2021; Elahi et al., 2022). It would help achieve the goal of carbon peaking and carbon neutrality which is an inevitable requirement for high-quality economic and social development and a hot topic of widespread concern from all walks of life (Anser et al., 2020; Chandio et al., 2020; Booth et al., 2021; Foster et al., 2021).
Urbanization is not only a process of continuous industrial, population concentration and rapid economic and social development but also a process of massive energy consumption and a high concentration of carbon emissions (Liu and Yang, 2022). Since the reform and opening up, China has experienced rapid urbanization and industrialization, and its total economic volume has increased rapidly (Wang and Pu, 2022). This crude urbanization development model has brought about serious negative resource and environmental effects, which in turn have fed back into the speed and quality of urbanization development (Chen et al., 2019). According to the seventh census data (as of November 2020), from 1978 to 2020, the urbanization rate of China increased from 17.9 to 63.89. Based on the general rule of urbanization development in the world, China is still in the rapid development interval of an urbanization rate of 30%–70%. In March 2014, the State Council released the National New Urbanization Plan (2014–2020), the first urbanization plan promulgated by the central government. The plan clearly puts forward the new urbanization construction strategy of “Green development, recycling development, and low-carbon development,” aiming to change the original “rough and loose” urbanization, whose theoretical connotation includes human-centeredness, synergy, and sustainability. It is a major change to realize the development concept from “urbanization of population” to “urbanization of people” (Chen et al., 2019). It points out that during the rapid development of China’s urbanization, there are some outstanding contradictions and problems that must be highly valued and addressed, one of which is that “urbanization of land” is faster than “urbanization of the population,” and construction land is sloppy and inefficient. From 2000 to 2011, the national urban built-up area grew by 76.4%, much faster than the urban population growth rate of 50.5% (National New Urbanization Plan, 2014–2020), which reflects the problem that the lack of synergy among multiple elements in the urbanization process, such as population, land, economy, and society, hinders the healthy development of urbanization. The multidimensional elements in urbanization should maintain a compatible and matching rate of evolution and also match the spatial set-up process in order to facilitate the realization of new urbanization. In addition, sustainability is also an important connotation of the new type of urbanization, which must fully consider new issues such as resource and environmental bearing and adaptation to climate change (Martínez-Zarzoso, 2011; Nathaniel and Adeleye, 2021). Therefore, it is instructive to consider the dual objectives of rational urbanization development and climate protection and adjust urbanization development to adapt to the changing climate to strengthen the exploration of new urbanization with green and low-carbon energy.
Empirical studies conducted by domestic and foreign scholars based on several perspectives show that urbanization and carbon emission growth are interactively and dynamically coupled in several aspects (Zhou et al., 2003; Pahunang et al., 2021; Elahi et al., 2022). Hanif (2018) explored the impact of economic growth, urban expansion, and energy consumption on environmental degradation in developing economies in sub-Saharan Africa. The findings suggest an inverted U-shaped relationship between per capita economic growth and carbon emissions, which is consistent with the findings of Zarzoso et al. (2011). However, in Ansell (2021), by analyzing the effects of urbanization, economic growth, and population size on residential carbon emissions in the South Asian Association for Regional Cooperation (SAARC) member countries between 1994 and 2013, the empirical results showed a U-shaped relationship between urbanization and residential carbon emissions and residential carbon emissions initially decrease with increasing urbanization, reaching a turning point at 25.33% and then increases with urbanization. Suo and Li (2020) suggested that there are regional differences in the effect of urbanization on carbon emissions, with a positive correlation between high-income groups and a negative correlation among low-income groups. Elsewhere, Wang et al. (2017) showed that the urban population size has both an impact and a spatial spillover effect on carbon emissions in the province in a study of 30 prefecture-level cities. Zhang et al. (2013) showed that for every 1 km2 increase in urban construction land on the East and West sides of the Hu Huanyong line, the average annual carbon emissions increased by 1.79 million t and 2.58 million t, respectively (Musah et al., 2021). The study examined the relationship between urbanization and carbon emissions in West Africa. Economic growth has a substantial positive effect on CO2 emissions, while renewable energy consumption has a substantial negative effect on CO2 emissions. Lin (2016) argued that developing the tertiary sector, increasing investment in human capital, improving market competition, and reducing energy intensity are effective measures to achieve a win-win situation for both carbon intensity reduction and economic growth during urbanization.
In a comprehensive view, there are still shortcomings in the previous studies. First, most of the relevant studies have focused on the national and provincial scales, and not enough attention has been paid to the ecologically fragile and less developed cities in the Yellow River basin. Second, urbanization is essentially a change in economic, social, and spatial structures, which affects CO2 emissions in various ways (Wang and Pu, 2022). In the process of urbanization, the agglomeration of population and economic and other factors contribute to carbon emissions, and their joint efforts shape the dynamic relationship between urbanization and carbon emissions. Therefore, mapping the coupled and coordinated relationship between urbanization and carbon emissions is an effective path to explore the carbon emission reduction of urbanization.
In this study, Ningxia is chosen as the research object. The Ningxia Hui Autonomous region is located in the arid-semi-arid region and desert-steppe transition zone in inland northwest China. Surrounded by deserts in the East, West, and North, the unique geographical location and climatic conditions make Ningxia with sparse vegetation and severe soil erosion one of the most fragile ecological regions in China. Due to the rough use and disorderly development of land in the historical period, the degree of intensive land use in the region is low, the per capita urban construction land is 1.85 times the national average, and the average investment intensity and output intensity per mu of the 23 industrial zones are 35.77 and 11.39% of the national average, respectively, and the non-construction land such as arable land, grassland, and wetland is commonly occupied. The degree of exploitation of mineral resources is insufficient, and the energy structure dominated by coal is difficult to change in the short term. In this case, the pressure to complete the energy consumption per unit of GDP, the proportion of non-fossil energy, and other energy-saving emission reduction targets is very high. With the continuous development of the economy and society, the intensity of energy development and utilization in Ningxia will further increase. Clarifying the relationship between the spatial and temporal effects of land use carbon emissions and urbanization development is conducive to scientifically grasping the law of carbon emission growth and spatial expansion and providing a theoretical basis for formulating regional differentiated energy conservation and emission reduction policies in the future.
The remainder of the study is organized as follows. Section 2 describes the study area, methodology, and data sources, including the selection of new urbanization evaluation indicators, the measurement of land use carbon emissions, and the coupling coordination degree model. Section 3 uses the approach described in Section 2 to empirically investigate the coupling relationship between the level of new urbanization and land-use carbon emissions in Ningxia since 2009. In Section 4, the innovation points and limitations to this study are analyzed by comparing them with existing studies. Section 5 summarizes the study and proposes policy recommendations from the perspective of balanced urbanization development and a low carbon economy.
2 Materials and Methods
2.1 Study Area
The Ningxia Hui Autonomous region is located in the inland northwest of China, 104°17′–107°39′ East longitude and 35°14′–39°23′ North latitude (Figure 1). It covers an area of 66,400 km2 with a population of 6.95 million. The terrain slopes from southwest to northeast, with a drop of nearly 1,000 m and a step-like descent.
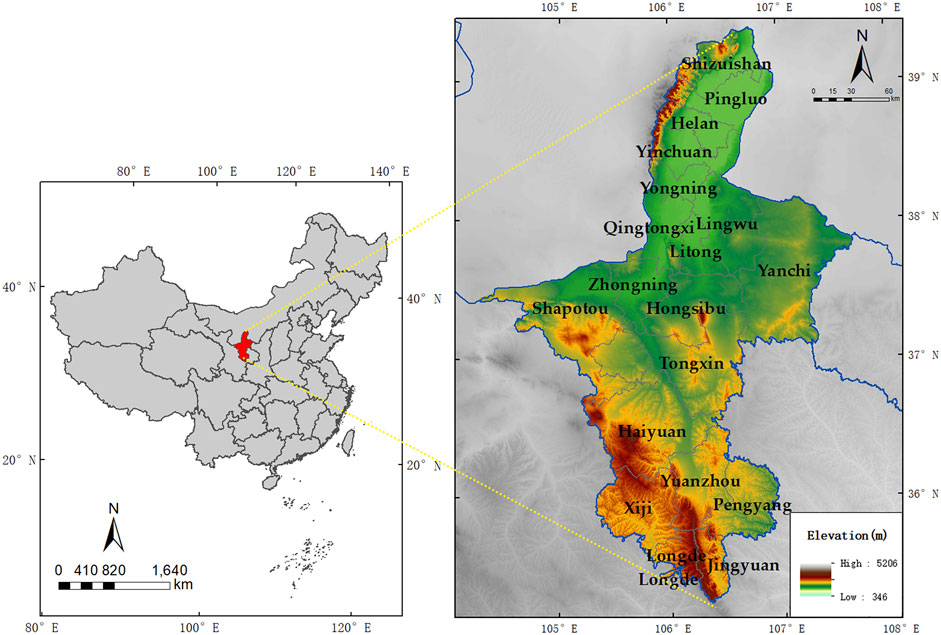
FIGURE 1. Location and administrative districts of Ningxia, China.
2.1.1 Resource Situation
The land use in Ningxia is mainly composed of grassland, cultivated land, and other types. Among them, the grassland area is the largest, with an area of 14,962.63 km2 in 2018, accounting for 28.80% of the total watershed area, mainly distributed in the western and eastern regions of the autonomous region, with a complete and continuous spatial shape. The second is the cultivated land, distributed in the central and northern regions, which is more scattered. Artificial surface areas are the smallest, 3,537.98 km2, accounting for 6.81%.
2.1.2 Economic Profiles
In recent years, Ningxia’s economy has been comprehensively developed, and its comprehensive strength has been greatly enhanced. According to the Ningxia Statistical Bulletin, by the end of 2019, the region’s GDP was 374.488 billion yuan, with per capita reaching 54,217 yuan. Also, the economic structure has been continuously optimized, shifting from an industrial-oriented to a service-oriented economy. The service sector exceeded 50% in 2019, becoming a major source of economic growth. Although Ningxia has made great achievements in economic development, it is still confronted with such prominent problems as extensive development mode, low level of industrial development, obvious characteristics of dependence on energy, increasingly tight resources, and environmental constraints.
2.2 Methodology
2.2.1 Carbon Emission From Land Use
Carbon emission from land use is classified into two categories, direct and indirect. Direct carbon emissions are caused by land use such as cultivated land, garden, grassland, and forest, while indirect carbon emissions are mainly caused by human activities on construction lands (Scott et al., 1999; Schneck et al., 2015; Rehman et al., 2020). This study uses the direct carbon emission coefficient method to calculate the carbon emission of non-construction lands such as arable land, forest, and grassland.
where Cd is direct carbon emissions, Ai is the area of land type I, and Bi represents the carbon emission factor of the land type i.
Regarding the research of related scholars (Fang et al., 2007; Zhao et al., 2013; Zheng and Wen, 2020), the carbon emission coefficients in this study are shown in Table 1, where negative values represent carbon absorption, and positive values represent carbon emission.
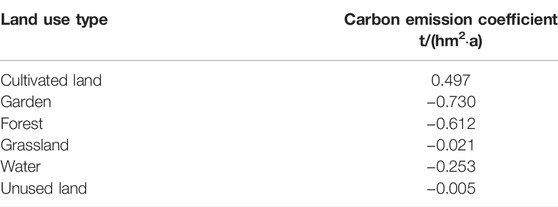
TABLE 1. Carbon emission coefficients in Ningxia.
The indirect carbon emission is calculated by summing up the product of various energy consumption and energy carbon emission coefficients.
Ci is the consumption of various energy sources, θi is the standard coal conversion coefficient of various energy sources, and fi is the carbon emission coefficient, as shown in Table 2. The carbon emission coefficient is calculated according to IPCC 2019, and the conversion coefficient of standard coal is calculated according to the China Energy Statistical Yearbook.
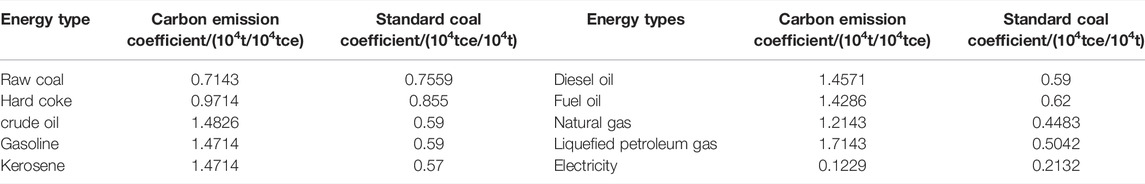
TABLE 2. Standard coal conversion factors and carbon emission factors for various energy sources.
2.2.2 Evaluation Model
The entropy method is used to estimate the weight of each index, which is essentially calculated by using the value coefficient of the index information (Xu and Ma, 2020; Yang et al., 2020). The higher the value coefficient is, the greater the contribution to the evaluation result will be.
The information entropy of Xij is as follows.
The constant K is related to the number of areas m. For a system with the complete disorder of information, the degree of order is 0, and its entropy value is the highest, e = 1. When m samples are in a state of complete disorder distribution, Xij = 1/m, and K = 1/ln m.
The information utility value of the jth index is as follows.
The weight of the jth index can be expressed as follows.
The product of the weight of the jth index and the standard value Xij of the standardized matrix was used as the evaluation value fij.
The evaluation value of the expression layer in region i can be expressed as follows.
2.2.3 Evaluation Index System
Regarding the level of urbanization, scholars mostly measure several aspects closely related to urbanization, such as population, economy, society, and urban space. (Chen et al., 2009; Qi et al., 2013). Therefore, this study constructs an index system of urbanization development from four aspects: population urbanization, economic urbanization, land urbanization, and social urbanization, which comprehensively reflects the expansion scale, development quality, and socio-economic level of cities and towns. Among them, population urbanization indicators reflect the process of urban population agglomeration, economic urbanization indicators reflect the transformation of the economic structure to non-agriculturalization, social urbanization indicators reflect the changes in urban living conditions, and land urbanization indicators reflect the changes in urban space (Table 3).
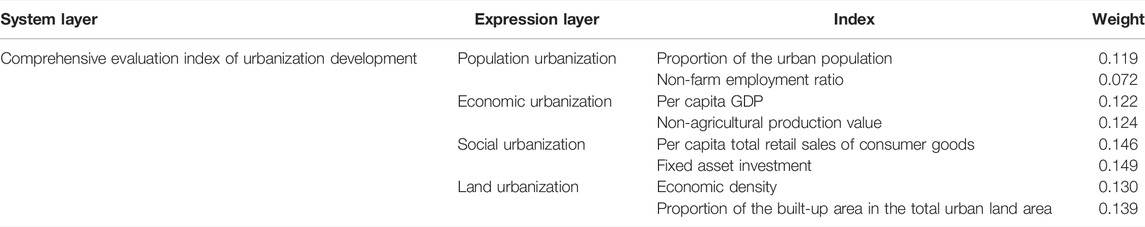
TABLE 3. Evaluation index system.
2.2.4 Coupling Degree and Coupling Coordination Degree Model
The coupling degree function reflects the degree of interaction between subsystems (Airong et al., 2013).
In the formula, u1 is the comprehensive evaluation index of urbanization development, u2 is the comprehensive evaluation index of land use carbon emissions, C is the coupling degree, and the value is [0,1]. When C approaches 0, it indicates that the correlation between the two subsystems is minimal, and there is no coupling relationship. When C approaches 1, it indicates that the coupling degree of the two subsystems is large, and there is good resonance coupling.
The coupling coordination degree (coordination degree) measures the degree of benign coupling in the coupling relationship of multiple systems, reflecting the quality of coordination.
T is the comprehensive evaluation index; D is the coupling coordination degree; and α and β are undetermined coefficients, α + β = 1.
Referring to relevant studies (Zhou et al., 2019; Zhang and Jiao, 2015), the coordination degree is divided into five categories (Table 4).
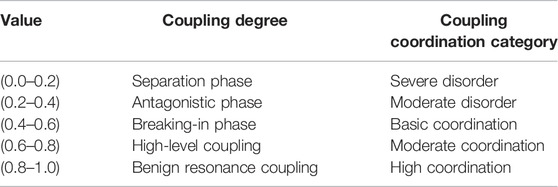
TABLE 4. Classification standards of the coupling degree and coupling coordination degree.
2.3 Data Sources
The land data involved in calculating land use carbon emissions include six types of land: the arable land, garden land, forest land, grassland, water, and unused land, which use the land use change survey data from 2009 to 2018 from the Ningxia Department of Natural Resources Other data, such as total population, GDP, fixed asset investment, and total energy consumption. are all from the Statistical Yearbook of Ningxia Hui Autonomous Region 2009–2020 (https://nxdata.com.cn/publish.htm?cn=G01) and related socio-economic data.
3 Results
3.1 Overall Analysis of Carbon Emissions
Based on land use data, fossil energy consumption data, and the carbon emission estimation model, net carbon emissions of Ningxia from 2009 to 2019 were calculated, as shown in Figure 2.
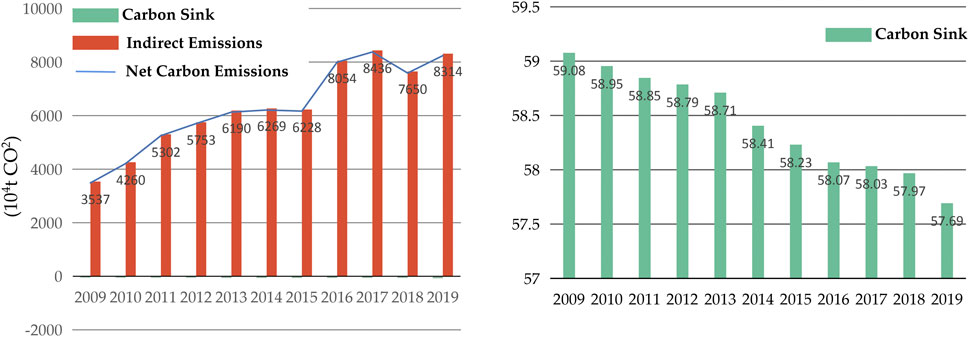
FIGURE 2. Carbon sink and net carbon emissions from land use, 2009–2019.
From 2009 to 2019, Ningxia’s land use carbon emissions continued to increase, reaching a peak in 2017, while the size of carbon sinks continued to decrease. Net carbon emissions increased from 34.87 106t in 2009 to 82.4 106t in 2019, with an average annual growth rate of 4.75 106t/a. Carbon emissions from arable land are relatively weak, basically stable at about 6 104t. The scale of carbon sink decreased by 48.06% in 10 years, from 59.08 104t to 57.69 104t. The carbon sink effect was in the order of forest, grassland, garden, water surface, and unused land, among which the contribution of forest to the carbon absorption was the largest at 77%.
3.2 Temporal and Spatial Analysis of Net Carbon Emissions
From the perspective of spatial distribution, the land use carbon emission in Ningxia is generally high in the North and low in the South. The carbon emission intensity of each county is divided into five grades, as shown in Figure 3.
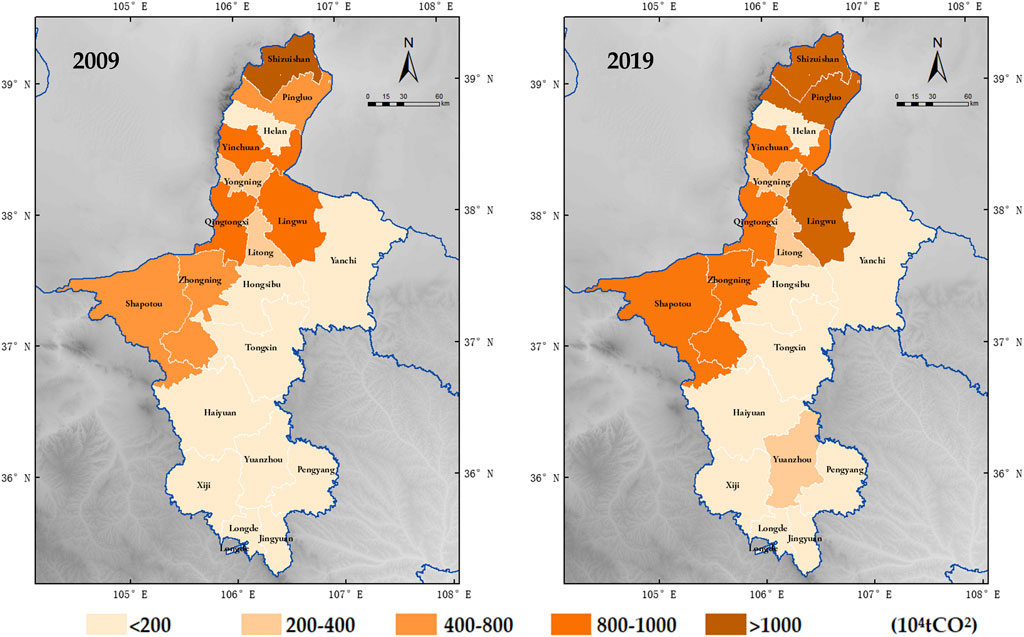
FIGURE 3. Spatial and temporal distribution of carbon emission in Ningxia, 2009–2019.
Dividing the net carbon emissions from land use in Ningxia into five classes, it is obvious that the net carbon emissions from land use vary greatly by region. Carbon emissions are mainly concentrated in the northern development areas along the Yellow River, such as Lingwu, Shizuishan, Pingluo, and Qingtongxia, while less in the central arid zone and southern mountainous areas, showing an overall spatial pattern of being high in the North and low in the South, which is closely related to the regional industrial development and natural background conditions. During the study period, net carbon emissions in Lingwu increased significantly, from 468.97 104t in 2009 to 3,627.08 104t in 2018, an increase of 594%, accounting for 42.9% of the total carbon emissions in the region in 2018. This is mainly because the 13th Five-Year Plan period is the peak period of coal conversion projects such as coal power and coal chemical industry in the Lingwu Ningdong Energy Base. The carbon emissions of Yinchuan, Shizuishan, and Qingtongxia show a decreasing trend, decreasing from 628.28 104t, 1,194.10 104t, and 776.16 104t in 2009 to 476.04 104t, 812.34 104t, and 522.40 104t in 2018, with Shizuishan decreasing by 31.97% during the decade. The main reason is that Shizuishan is trying to change from a resource-depleted city to a non-coal field and production services. In contrast, the total carbon emissions of other cities changed less during the decade, such as Jing Yuan and Longde from 10.52 104t and 1.03 104t in 2009 to 17.68 104t and 17.67 104t in 2018, respectively, an increase of 7.16 104t and 16.64 104t during the decade.
3.3 Overall Analysis of Urbanization
The comprehensive evaluation index of urbanization development in Ningxia from 2009 to 2019 was obtained by using the entropy weight TOPSIS method, as shown in Figure 4.
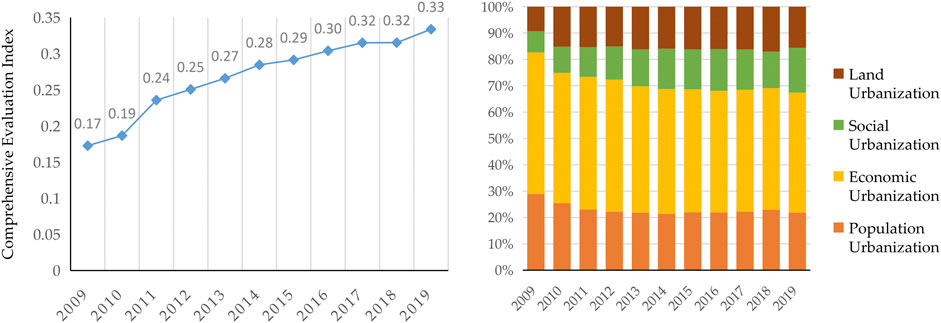
FIGURE 4. Comprehensive evaluation of urbanization in Ningxia from 2009 to 2019.
The comprehensive evaluation index of the Ningxia urbanization system shows a linear upward trend. From 2009 to 2019, it increased from 0.17 to 0.33, with an average annual increase of 1.6%, but the overall level is low. In terms of each dimension, economic urbanization has always dominated the development of urbanization in Ningxia during the decade, accounting for 53.79% in 2009 and decreasing to 45.57% in 2019, while the proportion of land urbanization and social urbanization has gradually increased, indicating that the development of urbanization in Ningxia has changed from focusing solely on economic development to comprehensive and coordinated development. However, due to backward industries, relatively poor resource endowment, sloppy development mode, and low energy utilization, it is generally in a slow growth stage.
3.4 Temporal and Spatial Analysis of New Urbanization
The urbanization level of Ningxia counties showed a fluctuating growth trend in stages from 2009 to 2019, and there were large differences between regions (Figure 5).
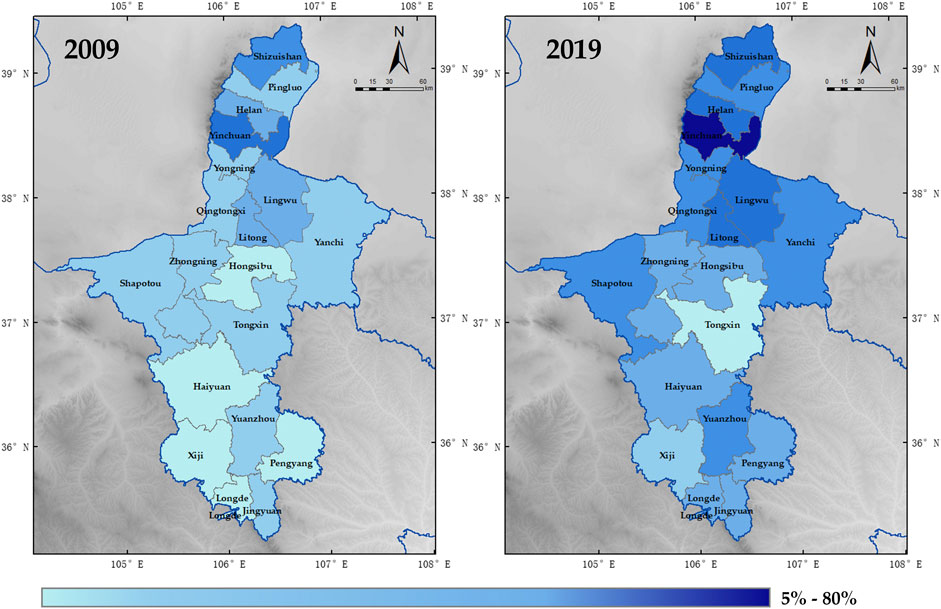
FIGURE 5. Evaluation of urbanization of various regions in Ningxia from 2009 to 2019.
The overall urbanization level of cities in the northern Yellow River Ecological and Economic Zone is high, followed by the central anti-sand control zone and the southern water connotation zone; for example, in 2019, the ranking of the urbanization level from the highest to lowest is as follows: Yinchuan (79.55%) > Shizuishan (49.07%) > Lingwu (44.78%) > Helan (44.59%) > Litong (41.26%) > Yongning (34.66%) > Pingluo (34.00%) > Hongshibao (32.50%) > Yuanzhou (32.22%) > Shapotou (31.02%) > Qingtongxia (30.64%), while the rest of the cities are below 30%. As the provincial capital, Yinchuan is the social, economic, political, and cultural center of Ningxia, and its urbanization development is far ahead of other regions, growing from 48% in 2009 to 80% in 2019, with an average annual growth rate of up to 3.2%. It is now in the late and stable development stage of urbanization, with quality and efficiency improvement as the main development goal in the future. However, Yinchuan’s radiation-driven capacity needs to be improved, and the level of integration of the development of the counties and districts along the Yellow River in Ningxia is not high. The urbanization level of Tongxin and Xiji is still in the initial stage, both at 18% in 2019, with an average annual growth rate of 0.2 and 1.3%, respectively. The urbanization levels of Tongxin and Xiji are still in the initial stage, both at 18% in 2019, with average annual growth rates of 0.2 and 1.3%, respectively. Due to the poor agricultural farming conditions in southern Ningxia and the lack of industrial development momentum, there is a large loss of local employment, including a cumulative net outflow of 93,000 people in Xiji in 10 years, and the urban population of Xiji in 2019 is only 29%, making the task of future urbanization development more arduous Figure 6.
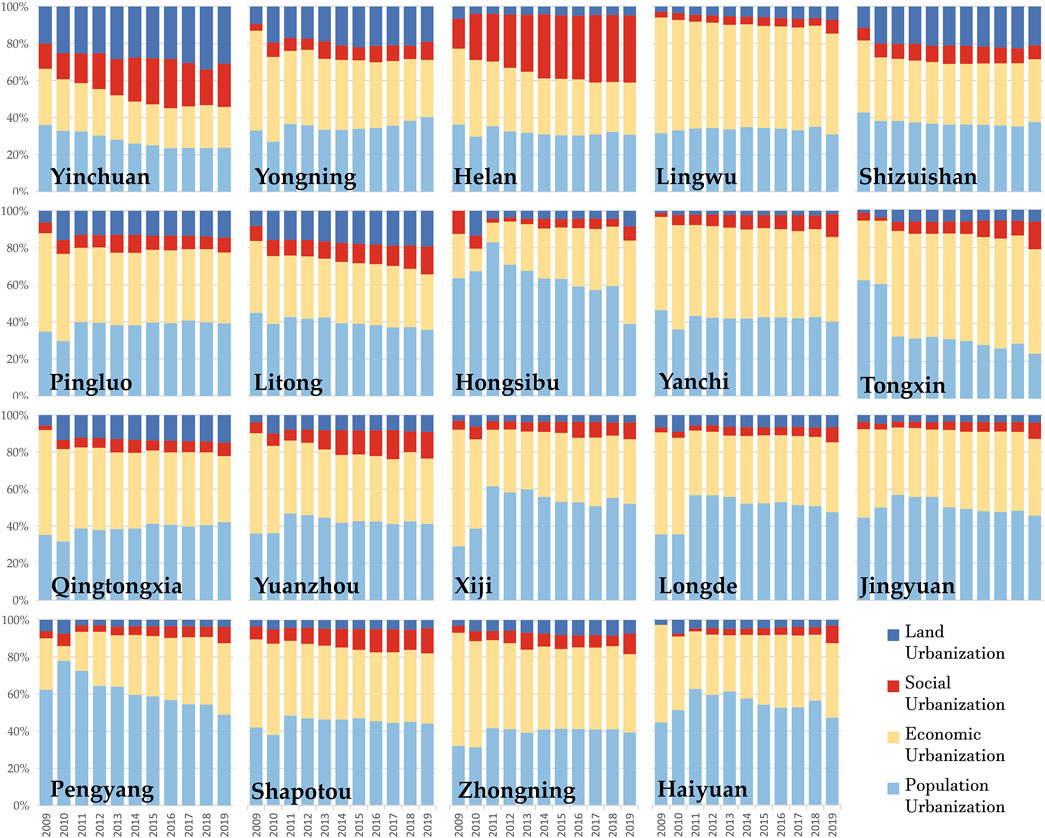
FIGURE 6. Changes in the proportion of different dimensions of urbanization in Ningxia from 2009 to 2019.
In terms of the proportion of each dimension (Figure 6), except for Yinchuan, where the dominant type of urbanization shifted from population urbanization to homogenization and Helan shifted from economic urbanization and population urbanization to socio-economic-demographic development, the remaining counties and districts are dominated by economic urbanization and population urbanization, with the proportion of both reaching 80%, among which, the population urbanization of Hongshibao, Xiji, Lund, Panyang, and Haiyuan exceeds 50%. Yinchuan, Yongning, Shizuishan, and Litong land urbanization accounted for more than 20%.
3.5 Coupling Degree and Coordination Degree Analysis
The coupling degree of urbanization and land use carbon emissions in Ningxia generally shows a fluctuating upward trend, and the coupling degree increased from 0.51 in 2009 to 0.62 in 2019, with an average annual increase of 1.1%. The type of coupling degree has realized a change from the antagonistic development period to the grinding period (Figure 7).
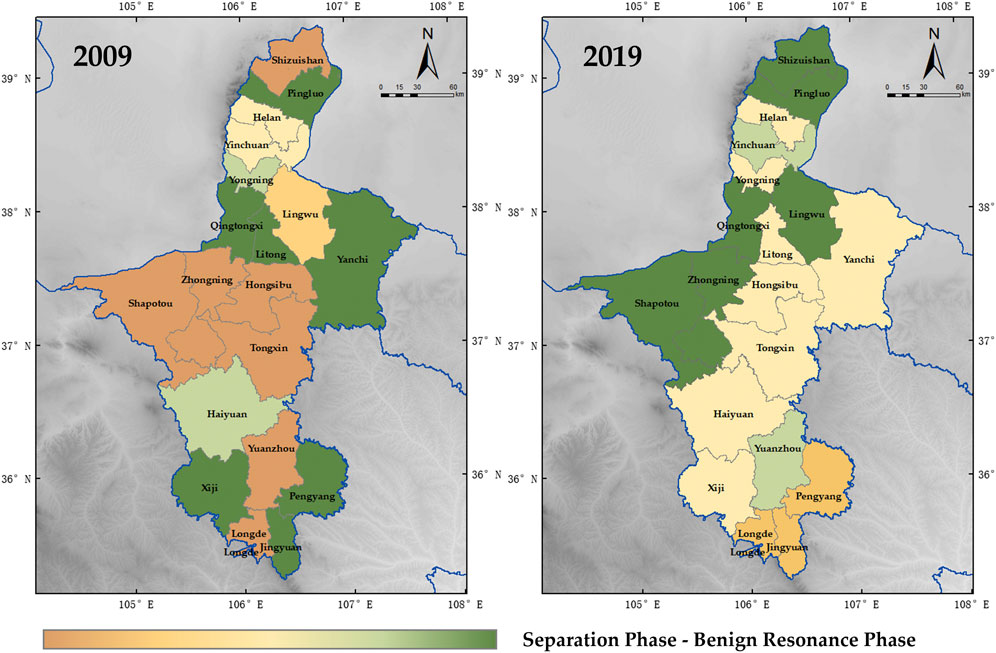
FIGURE 7. Degree of coupling between urbanization and land use carbon emissions in Ningxia from 2009 to 2019.
Spatially, 47.37% of the regions in Ningxia are in the high-level coupling stage and benign coupling stage, and the radiation-driven role of central towns and resource agglomeration effects make the overall coupling degree in northern Ningxia reach a higher level. There is a strong relationship between urbanization and carbon emission in these regions, and the accumulation of energy consumption increases gradually due to urbanization development. In Hongxibao, Concentric, Yanchi, Xiji, and Haiyuan, the coupling gradually shifts from a low level to antagonistic stage, indicating that the relationship between carbon emission and urbanization degree in these areas is smaller, which is closely related to the relatively backward urban economic development and low economic density Figure 8.
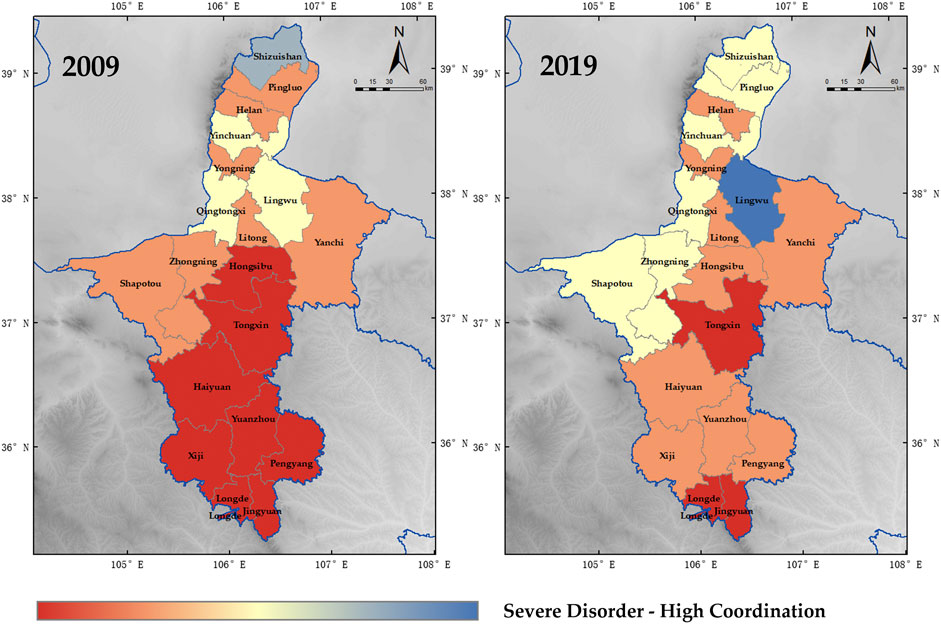
FIGURE 8. Degree of coupling coordination between urbanization and land use carbon emissions in Ningxia from 2009 to 2019.
The coupling coordination degree of urbanization and land use carbon emission in Ningxia is on the rise, and the average coupling coordination degree increased from 0.22 to 0.37 from 2009 to 2019, with an average annual increase of 1.5%, but the overall coupling coordination degree is low, with 63.16% of areas in the uncoordinated state, 26.32% in the basic coordination state, and only Lingwu and Shizuishan reaching primary coordination (Figure 8), indicating that Ningxia. The new urbanization level and carbon emission level are mutually constrained at a low level. The low level of new urbanization has led to the growth of carbon emissions in Ningxia, while the low energy utilization rate, the sloppy development pattern, and the backward industries have constrained the development of urbanization.
4 Discussion
According to the aforementioned analysis, the spatial and temporal patterns of coupling and coordination between urbanization and land use carbon emissions in Ningxia vary significantly, with the spatial dimension showing the spatial characteristics of high North and low South, and the temporal dimension showing the wave-like evolution characteristics from low-level coupling to high-level coupling. Further analysis of the coupling and coordination relationship between the elements of urbanization and land use carbon emissions shows that the highest coupling degree is economic urbanization, which reaches a high level of coupling, while population urbanization is in the grinding stage, and land urbanization and social urbanization are less coupled, indicating that the most important factor affecting land use carbon emissions in Ningxia during the study period is the development of the economic level.
On the one hand, Ningxia’s economic volume is small and its growth rate is slow. In 2020, the region’s gross domestic product will be 392.055 billion yuan, 1.16 times higher than in 2010, ranking at the bottom of the nine provinces in the Yellow River Basin. As an important coal chemical and thermal power base in China, Ningxia undertakes the task of national strategic energy reserves. Since the 13th Five-Year Plan, Ningxia has focused on the development of a large number of energy-intensive industries such as the coal chemical industry, resulting in the continuous expansion of carbon emissions. At present, Ningxia wind power, photovoltaic, and other renewable energy development sources is difficult to support the effective transformation of the energy structure; in the short term, this high-carbon energy and industrial structure is hardly a significant adjustment, and low-carbon development is facing a very serious situation. In addition, economic development will also cause the built-up area to expand outward. After the 12th Five-Year Plan, Ningxia entered into a period of high-speed development and began to undertake the transfer of chemical industries from the East to the West, which occupied a large number of ecological lands such as the grassland and forest land, and the ecological land decreased by 84,279.22 hectares or 2.08% in 10 years. This led to a decrease in the carbon sink scale and the expansion of the carbon source area, which resulted in an increase in net carbon emissions from land use.
On the other hand, the distribution of population-scale and economic level in the North and South of Ningxia is unbalanced. Regional differences lead to large spatial differences in the degree of coordination of urbanization and carbon emission coupling across the region. The northern part of Ningxia along the Yellow River concentrates 57% of the region’s population and 80% of the towns, creates 90% of the total economic volume and 94% of the fiscal revenue, and is an important energy, chemical, raw material and basic industrial base with increasing population and industrial agglomeration capacity. In the central region, there is drought and water shortage, serious land sanding, and the industries are mainly mining and special agricultural product processing industry, and the population share is basically stable. The southern region has prominent soil erosion problems, poor agricultural cultivation conditions, insufficient industrial development momentum, and a declining trend in population share.
Therefore, this study makes the following suggestions from the perspective of balanced urbanization development and a low carbon economy. First, the energy utilization efficiency is improved, and the development of clean energy is increased. Ningxia is located in the intersection and transition zone of three natural regions in China, rich in wind and solar energy resources, which provides favorable conditions for increasing the proportion of renewable energy in the energy system. Second, Ningxia needs to implement a differentiated strategy of zoning development. In the northern cities along the Yellow River, industrial policies that promote rapid population concentration should be implemented, the core driving role of the provincial capital Yinchuan should be strengthened further, the land should be planned rationally, comprehensive industries led by manufacturing and service industries should be developed, the dependence of the secondary industry on energy should be reduced, and energy efficiency should be improved. In the central and southern regions, ecological function zones with distinctive features will be formed in accordance with their ecological carrying capacity, so as to promote the gradual evacuation of the population and the development of tourism, logistics, agricultural and sideline product processing and other industries. In addition, based on improving the carrying capacity of city clusters and central cities, more efforts should be made to build medium-sized cities, increase the allocation of resources to medium-sized cities, make up for the development shortcomings of these cities, and enhance their attractiveness.
There are also some uncertainties in this study. Due to differences in geographic location, latitude and longitude, and climatic conditions, there are large differences in land-use carbon emission factors across regions. In fact, it is difficult to determine the particular coefficients for each land type in each city. This study followed the practice of previous studies (Fang et al., 2007; Huang, 2013; Zhang et al., 2013; Zhao et al., 2013) and used the same coefficients to estimate the carbon emission levels of different cities in Ningxia. In addition, seasonal variations and long-term changes in carbon emissions were not considered. This study assessed carbon emissions and carbon sink levels on an annual basis without identifying their changes in different seasons of the year. Third, this study has a more objective control on the coordination of carbon emission and urbanization coupling in Ningxia and their spatial correlation characteristics, but it is necessary to further explore how to coordinate the level of carbon emission and urbanization development in Ningxia by indicators and multiple dimensions, which are uncertainties and limitations that need to be studied in depth in the next direction.
5 Conclusion
This study constructs a regional urbanization comprehensive development evaluation index system, analyzes the urbanization development level and land use carbon emission of each county and district in Ningxia from 2009 to 2019, and further explores the coupling relationship between the two. The main conclusion is as follows.
The comprehensive evaluation index of the Ningxia urbanization system and land use carbon emission both showed an increasing trend during the decade and showed a spatial pattern of being high in the North and low in the South. The coupling degree of the two increases from 0.51 in 2009 to 0.62 in 2019, with an average annual increase of 1.1%. The coupling coordination degree increases from 0.22 to 0.37, with a low overall level, indicating that Ningxia’s low level of urbanization, low energy utilization, and sloppy development patterns lead to the growth of carbon emissions in Ningxia, which in turn restricts the development of urbanization. Ningxia should promote the construction of a new type of urbanization and facilitate its transformation from economic urbanization to comprehensive development.
Data Availability Statement
The raw data supporting the conclusion of this article will be made available by the authors, without undue reservation.
Author Contributions
WH designed and performed the experiment, analyzed the data, and wrote the manuscript; JL contributed reagents/materials/analysis tools. All authors have read and agreed to the published version of the manuscript.
Conflict of Interest
The authors declare that the research was conducted in the absence of any commercial or financial relationships that could be construed as a potential conflict of interest.
Publisher’s Note
All claims expressed in this article are solely those of the authors and do not necessarily represent those of their affiliated organizations, or those of the publisher, the editors, and the reviewers. Any product that may be evaluated in this article, or claim that may be made by its manufacturer, is not guaranteed or endorsed by the publisher.
References
Ahmad, M., Rehman, A., Shah, S. A. A., Solangi, Y. A., Chandio, A. A., and Jabeen, G. (2020). Stylized Heterogeneous Dynamic Links Among Healthcare Expenditures, Land Urbanization, and CO2 Emissions across Economic Development Levels. Sci. Total Environ. 753, 142228. doi:10.1016/j.scitotenv.2020.142228
Airong, Q. I., Zhou, Z., and Liu, H. (2013). The Coupling Relationship between Urbanization and Urban Agriculture Development in Xi'an City. Geogr. Res. 32 (11), 2133–2142. doi:10.11821/dlyj201311014
Anser, M. K., Alharthi, M., Aziz, B., and Wasim, S. (2020). Impact of Urbanization, Economic Growth, and Population Size on Residential Carbon Emissions in the SAARC Countries. Clean. Techn Environ. Policy 22 (4), 923–936. doi:10.1007/s10098-020-01833-y
Booth, M. T., Urbanic, M., Wang, X., and Beaulieu, J. J. (2021). Bioturbation Frequency Alters Methane Emissions from Reservoir Sediments. Sci. Total Environ. 789, 148033. doi:10.1016/J.SCITOTENV.2021.148033
Chandio, A. A., Akram, W., Ahmad, F., and Ahmad, M. (2020). Dynamic Relationship Among Agriculture-Energy-Forestry and Carbon Dioxide (CO2) Emissions: Empirical Evidence from China. Environ. Sci. Pollut. Res. 27, 34078–34089. doi:10.1007/s11356-020-09560-z
Chen, Mingxing, Lu, Da-Dao, and Zhang, Hua (2009). A Comprehensive Measure of Urbanization Level in China and its Dynamics Factor Analysis. J. Geogr. 64 (004), 387–398. doi:10.3321/j.issn:0375-5444.2009.04.001
Chen, Mingxing, Ye, Chao, Lu, Daodao, Sui, Yuwen, and Guo, Shasha (2019). Perception and Construction of the Theoretical Connotation of New Urbanization with Chinese Characteristics. J. Geogr. 74 (4), 633–647. doi:10.11821/dlxb201904002
Dragan, P., Fatih, E., and Muhammet, D. (2021). Assessment of Alternative Fuel Vehicles for Sustainable Road Transportation of United States Using Integrated Fuzzy FUCOM and Neutrosophic Fuzzy MARCOS Methodology. Sci. Total Environ. 788, 147763. doi:10.1016/J.SCITOTENV.2021.147763
Elahi, E., Khalid, Z., Tauni, M. Z., Zhang, H., and Lirong, X. (2021). Extreme Weather Events Risk to Crop-Production and the Adaptation of Innovative Management Strategies to Mitigate the Risk: a Retrospective Survey of Rural punjab, pakistan. Technovation (4), 102255. doi:10.1016/j.technovation.2021.102255
Elahi, E., Khalid, Z., and Zhang, Z. (2022). Understanding Farmers' Intention and Willingness to Install Renewable Energy Technology: A Solution to Reduce the Environmental Emissions of Agriculture. Appl. Energy 309, 118459. doi:10.1016/j.apenergy.2021.118459
Elahi, E., Zhang, Z., Khalid, Z., and Xu, H. (2022). Application of an Artificial Neural Network to Optimise Energy Inputs: An Energy- and Cost-Saving Strategy for Commercial Poultry Farms. Energy 244, 123169. doi:10.1016/j.energy.2022.123169
Fang, J., Guo, Z., Piao, S., and Chen, P. (2007). Terrestrial Vegetation Carbon Sinks in China, 1981–2000. Sci. China Ser. D 50, 1341–1350. doi:10.1007/s11430-007-0049-1
Foster, Vivien, Jennifer Uju, Dim, Sebastian, Vollmer, and Zhang, Fan (2021). Understanding Drivers of Decoupling of Global Transport CO2 Emissions from Economic Growth: Evidence from 145 Countries. Washington: The World Bank.
Frank, A. B., Liebig, M. A., and Hanson, J. D. (2002). Soil Carbon Dioxide Fluxes in Northern Semiarid Grasslands. Soil Biol. Biochem. 35 (02), 343. doi:10.1016/S0038-0717(02)00062-7
Green, C. (2000). Potential Scale-Related Problems in Estimating the Costs of CO2 Mitigation Policies. Clim. Change 44, 331–349. doi:10.1023/A:1005597112439
Hanif, I. (2018). Impact of Economic Growth, Nonrenewable and Renewable Energy Consumption, and Urbanization on Carbon Emissions in Sub-Saharan Africa. Environ. Sci. Pollut. Res. 25 (15), 15057–15067. doi:10.1007/s11356-018-1753-4
Houghton, R. A. (2010). How Well Do We Know the Flux of CO2 From Land-Use Change. Tellus Ser. B-Chemical Phys. Meteorology 62 (5), 337–351. doi:10.1111/j.1600-0889.2010.00473.x
Huang, X. (2013). Urban Carbon Cycle and Land Regulation: A Review. Acta Geog. Sin. 68 (06), 872. CNKI:SUN:DLXB.0.2013-06-018
Lin, Mei-Shun (2016). Carbon Emission Reduction in China's Urbanization stage:Economic Costs and Emission Reduction Strategies. Res. Quantitative Econ. Technol. Econ. 33 (3), 19. CNKI:SUN:SLJY.0.2016-03-005
Liu, Linjie, and Yang, Shuwang (2022). Regional Heterogeneity of Urbanization Process Affecting Total Factor Carbon Emission Efficiency in China. Yunnan Soc. Sci. (02), 101–110.
Martínez-Zarzoso, I. (2011). The Impact of Urbanization on Co2 Emissions: Evidence from Developing Countries. Ecol. Econ. 70 (7), 1344–1353. doi:10.1016/j.ecolecon.2011.02.009
Musah, M., Kong, Y., Mensah, I. A., Antwi, S. K., and Donkor, M. (2021). The Connection between Urbanization and Carbon Emissions: a Panel Evidence from West Africa. Environ. Dev. Sustain 23 (8), 11525–11552. doi:10.1007/s10668-020-01124-y
Nathaniel, S. P., and Adeleye, N. (2021). Environmental Preservation amidst Carbon Emissions, Energy Consumption, and Urbanization in Selected African Countries: Implication for Sustainability. J. Clean. Prod. 285, 125409. doi:10.1016/j.jclepro.2020.125409
Pahunang, R. R., Buonerba, A., Senatore, V., Oliva, G., Ouda, M., Zarra, T., et al. (2021). Advances in Technological Control of Greenhouse Gas Emissions from Wastewater in the Context of Circular Economy. Sci. Total Environ. 792, 148479. doi:10.1016/J.SCITOTENV.2021.148479
Rehman, A., Ma, H., Irfan, M., and Ahmad, M. (2020). Does Carbon Dioxide, Methane, Nitrous Oxide, and GHG Emissions Influence the Agriculture? Evidence from China. Environ. Sci. Pollut. Res. 27, 28768–28779. doi:10.1007/s11356-020-08912-z
Schneck, R., Reick, C. H., Pongratz, J., and Gayler, V. (2015). The Mutual Importance of Anthropogenically and Climate-Induced Changes in Global Vegetation Cover for Future Land Carbon Emissions in the MPI-ESM CMIP5 Simulations. Glob. Biogeochem. Cycles 29 (10), 1816–1829. doi:10.1002/2014GB004959
Scott, N. A., Tate, K. R., Ford-robertson, J., Giltrap, D. J., and Smith, C. T. (1999). Soil Carbon Storage in Plantation Forests and Pastures: Land-Use Change Implications. Tellus B 51, 326–335. doi:10.1034/j.1600-0889.1999.0001510.1034/j.1600-0889.1999.00015.x
Shi, Yulong, and Guo, Wei (2022). A Mirror of International Experience in Promoting High-Quality Urbanization and Carbon Peaking in China - An Examination Based on OECD Data. Ecol. Econ. 38 (04), 29–34.
Sreekanth, K. J. (2021). An In-Depth Look at Carbon Emissions. New york, UN: Nova Science Publishers, Inc.
Suo, K.-D., and Li, Y. (2020). A Study on the Impact of Income Inequality on Co2 Emissions Based on Urbanization Perspective. Econ. Meridian 37 (1), 7. doi:10.15931/j.cnki.1006-1096.20191118.004
Wang, C., and Pu, C. L. (2022). Construction and Empirical Evidence of Carbon Emission Accounting System for Urbanization in China. Statistics Decis. Mak. (07), 57–61. doi:10.13546/j.cnki.tjyjc.2022.07.011
Wang, F., Qin, Y.-H., Liu, J., and Wu, C. X. (2017). A Study on the Factors Influencing Carbon Emissions from a Multidimensional Urbanization Perspective - a Spatial Durbin Panel Model Based on Chinese Provincial Data. China Popul. - Resour. Environ. 27 (9), 11. doi:10.12062/cpre.20170434
Xu, X., and Ma, R. P. (2020). A Study on the Comprehensive Measurement of New Urbanization Level and Financial Support in the Northwest Ethnic Areas Taking Ningxia Hui Autonomous Region as an Example. Mod. Urban Stud. (10), 75–80. doi:10.3969/j.issn.1009-6000.2020.10.010
Yang, X. P., Zhang, D. C., Yuan, P. P., and Zhang, X. B. (2020). A Study on the Coordination Degree of Tourism-Ecological Environment-Urbanization System Coupling - Taking Ningxia Hui Autonomous Region as an Example. Math. Pract. Underst. 50 (02), 35–47.
Zhang, Mei, Lai, Li, Huang, Xianjin, Tui, Xiaowei, and Tan, Junzhong (2013). Study on Carbon Emission Intensity of Regional Land Use Type Transformation in China. Resour. Sci. 35 (4), 8. CNKI:SUN:ZRZY.0.2013-04-016
Zhang, R., and Jiao, H. (2015). Exploring the Coupled Coordination and Optimization of Inter-provincial Urbanization and Ecological Environment in China. Arid Zone Resour. Environ. (7), 6. doi:10.13448/j.cnki.jalre.2015.214
Zhao, R., Huang, X., Zhong, T., and Xiaowei, T. (2013). Carbon Effect Assessment and Low Carbon Optimization of Regional Land Use Structure. J. Agric. Eng. 29 (17), 220–229. doi:10.3969/j.issn.1002-6819.2013.17.029
Zheng, Y. C., and Wen, Q. (2020). Land Use Change and Carbon Emission Effects in Ningxia Autonomous Region. Res. Soil Water Conservation 27 (01), 207–212. doi:10.13869/j.cnki.rswc.2020.01.029
Zhou, L., Che, L., and Sun, D. Q. (2019). The Coupling and Coordinated Development of Urbanization and Economic Growth in China and its Influencing Factors. Econ. Geogr. (6), 97–107. doi:10.15957/j.carolcarrollnkiJJDL.2019.06.011
Keywords: urbanization, coupling relationship, Ningxia, land use, carbon emission
Citation: Huang W and Li J (2022) The Coupling Relationship Between Urbanization and Carbon Emissions From Land Use in Ningxia. Front. Environ. Sci. 10:927798. doi: 10.3389/fenvs.2022.927798
Received: 25 April 2022; Accepted: 13 June 2022;
Published: 14 July 2022.
Edited by:
Salvador García-Ayllón Veintimilla, Technical University of Cartagena, SpainReviewed by:
Xinyuan Liang, Nanjing University, ChinaEhsan Elahi, Shandong University of Technology, China
Copyright © 2022 Huang and Li. This is an open-access article distributed under the terms of the Creative Commons Attribution License (CC BY). The use, distribution or reproduction in other forums is permitted, provided the original author(s) and the copyright owner(s) are credited and that the original publication in this journal is cited, in accordance with accepted academic practice. No use, distribution or reproduction is permitted which does not comply with these terms.
*Correspondence: Wei Huang, d2VpaHVhbmcwMjI1QDE2My5jb20=