 Xiaoqun Liu
 Changrong Yang
 Youcong Chao2*
- 1Hainan University, Haikou, China
- 2North China Institute of Aerospace Engineering, Langfang, China
By featuring the link of investor heterogeneity to the persistence of the overnight and intraday components of returns, we examine the ESG–overnight (intraday) alpha relation in the Chinese stock market. The empirical results show that ESG score has a significantly negative effect on the expected stock overnight returns in Fama–MacBeth regression. Consistently, given the biggest market capitalization and the least illiquidity subsamples, the trading strategies by going long (short) the top (bottom) ESG quintile would yield negative profits. In addition, we conduct the implication of the ESG pricing by dividing the full sample into green stock subsample and sin stock subsample, and the empirical results present that the ESG pricing is pervasive of the green-type stocks. These conclusions verify the pricing of ESG and support the conjecture that green stocks have lower expected returns because ESG investors value sustainability.
Introduction
Nowadays, the global top-level design policy advocating carbon neutrality makes sustainable investment, an investment approach considering environmental, social, and governance (ESG) factors in portfolio construction and asset management, as well as attractive to scholars, practitioners, policymakers, and regulators. Given that social norms have a great influence on the financial market (Hong and Kacperczyk, 2009), and investors value sustainability (Pástor et al., 2021a; Bauer et al., 2021), it is of great importance to understand the effects of ESG investing on asset price and return.
Actually, ESG is increasingly discussed as a potential alpha signal in academic outlets (Sloan, 1996; Avramov et al., 2021; Gibson et al., 2021; Pedersen et al., 2021). Certain ESG measures predict returns positively, while others predict negatively. For instance, Avramov et al. (2021) confirmed that the average ESG rating negatively predicts the future stock performance only for low-ESG disagreement stocks. Pedersen et al. (2021) proposed an ESG-adjusted capital asset pricing model, showing when ESG raises or lowers the required return. More recently, Pástor et al. (2021b) found that green stocks would outperform brown when there is bad information shock about climate change. Gibson et al. (2021) systematically tested that the second moment of ESG rating has positive consequences for stock return, and they considered that the higher ESG rating disagreement may be perceived as a source of Knightian uncertainty that commands an uncertainty premium.
As one of the largest markets in the world, the China A-shares market has experienced complex changes in recent decades. A great deal of researches focus on Chinese economic and financial phenomenon and have achieved fruitful theoretical and empirical achievements, such as energy finance (Ren et al., 2022; Wen et al., 2021; Zheng et al., 2021; Dai et al., 2021), stock return–risk tradeoff or risk management (Gokmenoglu et al., 2021; Cao et al., 2021; Chen et al., 2022; Dai et al., 2021; Xiao et al., 2021; Wen et al., 2021; Liow et al., 2021; Sikiru et al., 2021; Wen et al., 2021; Umutlu et al., 2021), and financial networks (Cao et al., 2021a; Cao et al., 2021; Wen et al., 2021). The literature has previously identified the pricing of carbon risk and climate risk in China. For example, Ren et al. (2022) evaluated the predictability of a large group of factors on carbon future returns using the quantile-on-quantile method. In addition, Ren et al. (2022) investigated the impact of extreme national climate risk on corporate environmental performance in the context of China. Thus, it can be seen that the evidence associated with the Chinese market can shed new light on the whole world.
China’s A-share market has its own characteristics, among which the investor structure and T+1 trading rules are the two most prominent features (Wen et al., 2021; Wen et al., 2021; Chen et al., 2022). With regard to the investor structure, compared to the U.S., there are less institutional investors in the Chinese stock market; thus, the investor sentiment really matters. For example, Li et al. (2021) used the Chinese equity market as the testing venue to explore how investor sentiment affects the immediate reaction of stock prices to earnings news in high- and low-sentiment periods. On the other hand, Qiao and Dam (2020) asserted that “T+1” trading rule prohibits traders from selling the shares they bought on the same day. This restriction leads to a discount on daily opening prices, thus inducing negative overnight returns. In recent years, literature on the components of return, that is, intraday return and overnight return, is widely studied by scholars (Aboody et al., 2018; Lou et al., 2019; Barardehi et al., 2021). Aboody et al. (2018) demonstrate that individual stock overnight returns possess the same characteristics as the investor sentiment; thus, we can use the stock overnight return as the proxy of the investor sentiment at the stock level. Lou et al. (2019) found that, in all cases, profits are either earned entirely overnight (for reversal and a variety of momentum strategies) or entirely intraday, typically with profits of opposite signs across these components.
Moreover, the literature provides evidence that investor heterogeneity can affect asset pricing (Harrison and Kreps, 1978; Constantinides and Duffie, 1996; Boudoukh et al., 2019; Lou et al., 2019). For instance, Lou et al. (2019) confirmed that different types of agents tend to trade at different times during the day, that is, some investors may tend to trade at the morning open, while others may prefer to trade during the rest of the day up to and including the market close, which makes the price movement during the day and at night vary. Also, Boudoukh et al. (2019) and Barardehi et al. (2021) argued that overnight price movements are mainly due to public news, as opposed to the revelation of private information through trading. Consequently, in this study, based on the investor structure, T+1 trading rules, and price movements at night vs. during the day, we empirically analyze the cross-sectional relation between ESG and expected overnight and intraday components of returns in the Chinese stock market. Specifically, our model features the link of investor heterogeneity to the persistence of the overnight and intraday components of returns. In addition, we divide the stocks into green stock subsample and sin stock subsample based on the ESG score to reexamine the cross-sectional ESG–alpha relation. More specifically, we first examine the relation between ESG score and the expected overnight and intraday components of returns in the Chinese stock market. Because the coefficients of ESG score in Fama and MacBeth, (1973) regression of intraday return on the ESG score and Fama–French five-factor ESG score of intraday alpha generated by the zero-cost trading strategy are statistically insignificant, we only report the empirical results of the overnight return. We next zoom in the cross-sectional implication of ESG pricing on green stocks and sin stocks. We define green and sin stocks based on the ESG score, that is, the higher (lower) the ESG score, the greener (sinner) the stock is. More specifically, green (sin) stock subsample is those stocks with ESG scores in the top (bottom) 30%. We state the following hypotheses development:
H1: the ESG score has an asymmetric effect on the components of expected stock return.
H2: firm characteristics matter in the ESG–overnight (intraday) alpha relation.
H3: green stocks would have lower expected returns because ESG investors value sustainability.
The empirical results present that the ESG score has a negative effect on the expected stock overnight returns in Fama–MacBeth regression. In addition, given the biggest market capitalization and the least illiquidity subsamples, the trading strategies by going long (short) the top (bottom) ESG quintile would yield negative profits. These conclusions parallel those of Bauer et al. (2021) and Pástor et al. (2021a), who provided evidence of green assets having lower expected returns. Finally, the implication of the ESG pricing on green stock subsample and sin stock subsample reveals that the ESG pricing is pervasive of the green-type stocks. These conclusions parallel those of Bauer et al. (2021) and Pástor et al. (2021a), who provided evidence of green assets having lower expected returns.
Our contributions are two-fold. First, we contribute to the growing discussion on the cross-sectional pricing of the ESG and sustainable investing. Prior literature documents the overall negative return predictability of the ESG score and emphasizes that responsible investors are in favor of sustainability due to taste of ESG (Fama and French, 2007; Hartzmark, 2019; Fama and French 2015; Pástor et al., 2021a, b; Barber et al., 2021). More specifically, a recent work by Pástor et al. (2021a) used a range of ESG proxies that reflect different clienteles of investors and found that when the economy has many ESG-motivated investors, then high-ESG stocks actually deliver low expected returns because ESG-motivated investors are willing to accept a lower return for a higher ESG portfolio. In contrast to Pedersen et al. (2021), we focus on the link of investor heterogeneity to the persistence of the overnight and intraday components of returns. In all, we offer novel insights into the cross-sectional ESG–overnight (intraday) alpha relation and the pricing of ESG on green stocks and sin stocks.
Second, we contribute to the stream of literature on the pricing of financial anomalies and overnight returns (Avramov and Chordia, 2006; Jacobs, 2015; Aboody et al., 2018; Lou et al., 2019; Hou et al., 2020). Specifically, we study how the ESG score would affect the overnight and intraday components of returns. ESG is a factor related to investors' tastes, while the extant financial anomalies, including trading frictions, momentum, value-versus-growth, and profitability, can be mostly attributed to firm characteristic-related factors (Hou et al., 2020). Therefore, our research would shed light on the asset pricing consequence of increasing sustainable investments by responsible investors.
The remainder of this study is organized as follows: Section 2 describes the data and the calculation of intraday and overnight components of returns. Section 3 presents the empirical analysis. Section 4 analyzes the mechanism analysis. Section 5 discusses the implication of the ESG pricing on green stock subsample and sin stock subsample. Conclusion is given in Section 6.
Data and Descriptive Statistics
Data Description
Our sample consists of all listed A-share stocks in China. Daily stock data, Fama–French five factors, turnover, size (market capitalization), BM (book-to-market) ratio, Amihud (2002) illiquidity, and risk-free rate are obtained from the China Stock Market & Accounting Research Database (CSMAR). Individual stocks’ environmental, social, and governance score (ESGscore), environmental score (Escore), social score (Sscore), and governance score (Gscore) are obtained from Bloomberg. The sample period is from January 2011 to July 2019.
Calculation of Components of Return
We calculate the intraday and overnight components of firm-level returns according to Lou et al. (2019). Specifically, for each stock i, the definition of intraday return is the price appreciation between market open and close of the same day s, while the overnight return is the price appreciation between market open price of day s and close of the day s-1,
In further research, we calculate intraday return and overnight return for each stock i of each year t by accumulating corresponding daily intraday return and overnight return:
Descriptive Statistics
Table 1 shows the basic descriptive statistics of individual stocks’ environmental, social, and governance score (ESGscore), environmental score (Escore), social score (Sscore), governance score (Gscore), yearly close-to-close return (Rclose-to-close), overnight return (Rovernight), intraday return (Rintraday), log market capitalization (Size), book-to-market ratio (BM), Amihud (2002) illiquidity (illiquidity), and turnover (Turnover). On average, there are about 3,096 observations in our sample each year. The average log capitalization of stocks in our sample is 16.049. The mean ESG score is 22.39, and the average components of ESG score including E score, S score, and G score are 11.53, 25.98, and 43.84, respectively. In addition, the average overnight return and intraday return of stocks in our sample are negative (−0.19) and positive (0.41), respectively, which is consistent with previous work by Qiao and Dam, (2020) that has argued that the overnight return is negative due to the “T+1” trading system in the Chinese stock market.
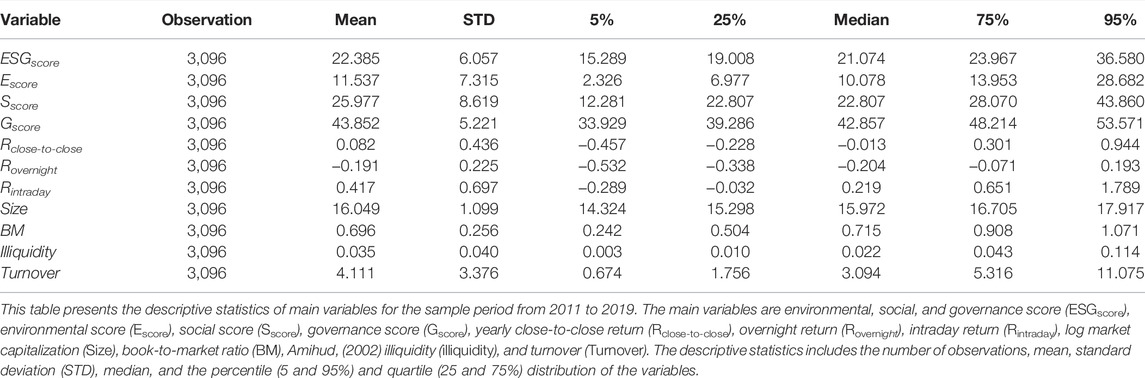
TABLE 1. Descriptive statistics.
Empirical Analysis
In this section, using portfolio analysis and Fama–MacBeth regression, we examine the relation between ESG score and subsequent overnight (or intraday) returns in the Chinese stock market. First, we implement the long–short trading strategies to obtain Fama–French (2015) five factors adjusted overnight (intraday) alpha:
where the subscript P (p = 1,2,…,10) represents the stock portfolio deciles based on the ESG score,
Next, we turn to Fama and MacBeth, (1973) regressions to test the cross section of overnight (or intraday) expected return. Based on the works of Dai and Zhu, (2020, 2022), our corresponding Fama–MacBeth regression model is as follows:
where for each stock i,
Finally, we conduct mechanism tests by conditional two-dimensional portfolio analysis based on the ESG score and the firm characteristics, including market capitalization (Size), book-to-market (BM), and illiquidity of the stocks. Specifically, at the beginning of each year, we first divide stocks into five subsamples based on size, BM, and illiquidity, respectively. Then, in each size or BM or illiquidity subsample, stocks are sorted into quintiles based on their lagged ESG score over the past 1 year.
It is worth noting that we only report the empirical results of the overnight return for the following two reasons: first, the coefficient on intraday return is statistically insignificant in Fama–Macbeth regression. Second, there is no abnormal long–short ESG intraday return: Fama–French five-factor alpha is insignificant.
Environmental, Social, and Governance and Overnight Return: Portfolio Sort
In this section, we first utilize the portfolio analysis to explore whether the ESG score is mispriced. The results are based on value-weighted portfolios. Columns 1–3 of Table 2 show that the trading portfolios that go long the top ESG score quintile and go short the bottom ESG score quintile could generate statistically significant positive yearly positive raw overnight return (0.0377, t-statistics of 3.58), Fama–French three-factor overnight alpha (0.0377, t-statistics of 8.41), and Fama–French five-factor overnight alpha (0.0699, t-statistics of 5.70), respectively. This result represents that the higher the ESG score, the lower the expected overnight return. We explain this result from the view of China’s unique “T+1” trading rule and investors’ taste of ESG. First, Qiao and Dam, (2020) asserted that the “T+1” trading rule prohibits traders from selling the shares they bought on the same day. This restriction leads to a discount on daily opening prices, thus inducing negative overnight return, which could be understood as the illiquidity discount on asset prices (Bian and Sun, 2010). In addition, Pástor et al. (2021a) presented that ESG investors enjoy an “investor surplus”: they sacrifice less return than they are willing to in order to hold their desired ESG portfolio. Consequently, we can expect that compared with non-ESG investors, ESG investors do not mind accepting lower liquidity discount, leading to a positive ESG–overnight alpha. In fact, in the next section, we find that illiquidity plays an important role in the sign of ESG–overnight alpha relation.
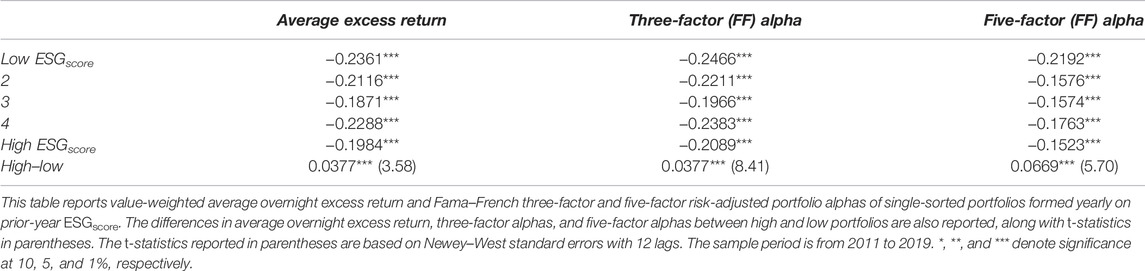
TABLE 2. ESG and overnight return: one-dimensional portfolio sort.
Environmental, Social, and Governance and Overnight Return: Fama–MacBeth Regressions
Compared to the portfolio sorts, which is a nonparametric method to investigate the relationship between a characteristic and the cross section of average overnight returns with difficulty in controlling for more other characteristics, Fama and MacBeth, (1973) regression is better to avoid measuring problematic partial effects. Columns 1–4 of Table 3 present the following four Fama–MacBeth regressions forecasting the cross section of overnight return with ESG score and its components E, S, and G. The control variables are the same in the four respective regressions, which are size, book-to-market ratio, illiquidity, and turnover. The results in Table 3 show that the coefficient of the ESG score is statistically significantly negative, −0.003 (t-statistics of −4.43), demonstrating that the firms with higher ESG score will experience a lower expected overnight return. In other words, ESG negatively affects the overnight return, which means investors are willing to accept lower overnight returns for more responsible stocks.
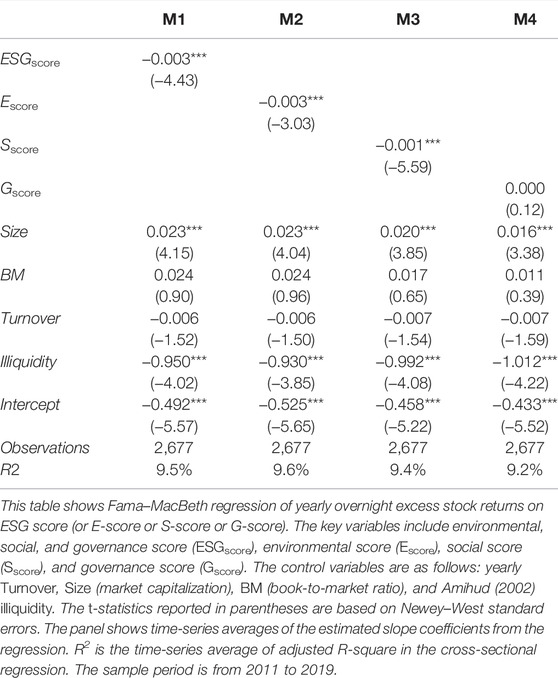
TABLE 3. ESG and overnight return: Fama–MacBeth regression.
In addition, for other control variables, size is significantly positive (0.023, t-statistics of 4.15), indicating that the bigger the size of the firm, the larger the overnight return will be, that is, the opening price of the current day is less discounted than the closing price of the previous day for those larger stocks. The coefficient of BM is positive as well, although statistically insignificant. Meanwhile, the illiquidity is significantly negative (−0.950, t-statistics of −4.02), which means that the worse the liquidity, the smaller the overnight return, which is consistent with prior work by Qian and Dam, (2020) which confirms that the unique T+1 trading rule in the Chinese stock market would induce liquidity discount of the overnight return.
Finally, the components of ESG score, E score, and S score are statistically significantly negative as well, −0.003 (t-statistics of −3.03) and −0.001 (t-statistics of −5.59), respectively, while the coefficient of G-score is insignificantly positive.
To conclude, first, the results of Fama–MacBeth regressions parallel the findings of Pedersen et al. (2021a); they found that the investor demand appears stronger for E, S, and overall ESG score, which could explain the high valuations of stocks that score well on these metrics and the low returns. In addition, it seems that we reach an opposite result with the portfolio analysis and Fama–MacBeth regression. Therefore, in Section 5, we will implement the mechanism analysis by classifying two-dimension portfolio sorts based on the ESG score and firm characteristics.
Mechanism Analysis
In this section, we turn to double-sort portfolio analysis based on three firm characteristics (i.e., stock market capitalization, book-to-market ratio, and illiquidity) and the ESG to reexamine the cross-section expected overnight return. Panels A–C of Table 4 report the following three double-sort portfolio analyses: a zero-costing trading strategy obtaining abnormal overnight return based on ESG and size, book-to-market ratio, and Amihud illiquidity measures, respectively.
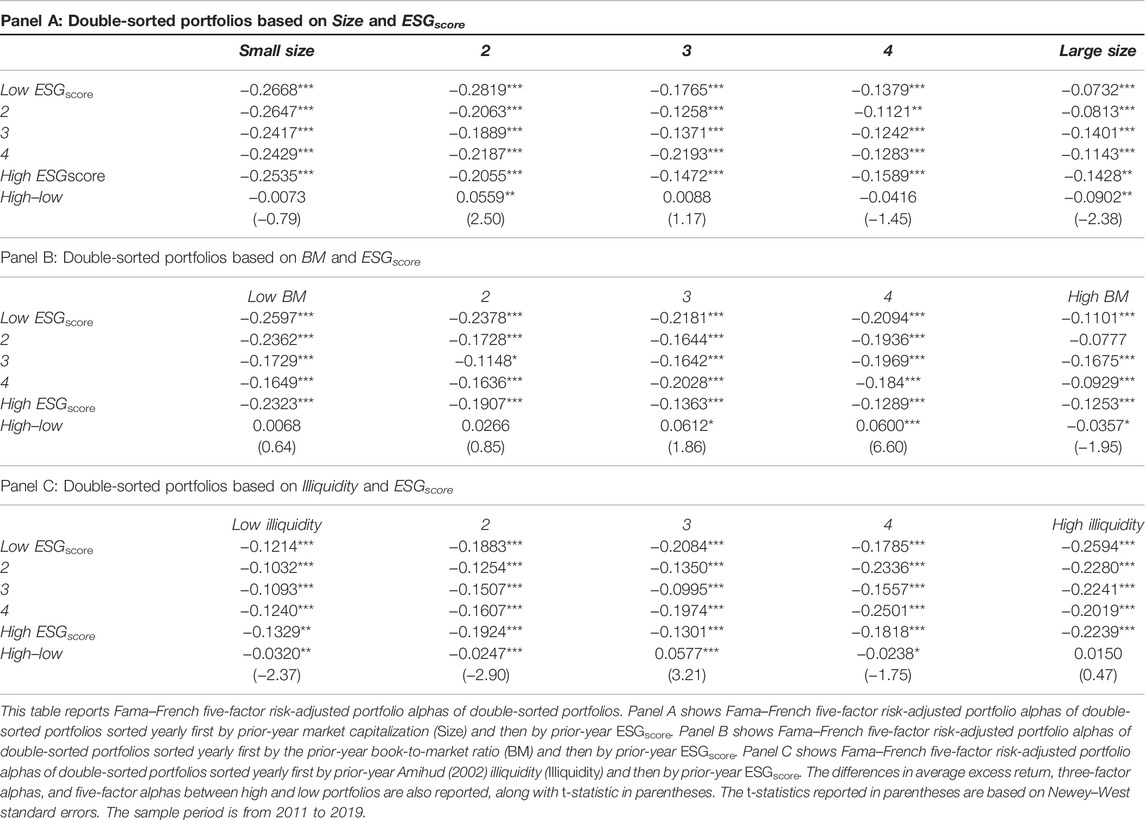
TABLE 4. ESG and overnight return: conditional double-sorted portfolio analysis.
Panel A of Table 4 presents that the spreads in yearly Fama–French five-factor overnight returns between the top and bottom quintiles become statistically significantly negative (−0.0902, t-statistic −2.38) for the biggest size combinations. That is, the positive overnight return is pervasive of the small-median size firms, while it experiences a sharp reversal for big size firms. Overall, size plays a big role in the sign of the abnormal overnight alpha, that is, for big size firms, a contrarian strategy by going long (short) the bottom (top) ESG would earn positive profits, which is consistent with the result of Fama–MacBeth regression.
Similarly, Panel B of Table 4 presents that the spreads in yearly Fama–French five-factor overnight returns between the top and bottom quintiles become statistically significantly negative (−0.0357, t-statistic −1.95) for the highest book-to-market (BM) combinations, while the spreads only remain significantly positive for the median BM quintiles and insignificantly positive for the lowest two BM. That is, the positive overnight return is pervasive of the small-median BM firms, and it experiences a sharp reversal for highest growth-type firms. Overall, the book-to-market ratio also plays a big role in the sign of the abnormal overnight alpha, that is, for top BM growth-type stocks, a contrarian strategy by going long (short) the bottom (top) ESG would earn positive profits.
Finally, Panel C of Table 4 presents that the spreads in yearly Fama–French five-factor overnight returns between the top and bottom quintiles become statistically significantly negative for the least four illiquidity combinations, while the spread is only insignificantly positive for the most illiquidity quintile. That is, the one-dimensional trading strategy of positive overnight return experiences a sharp reversal for the liquidity stocks. Overall, liquidity also plays a big role in the sign of the abnormal overnight alpha, that is, a contrarian strategy by going long (short) the bottom (top) ESG would earn positive profits.
To conclude, Size, BM, and liquidity play a big role in the sign of the abnormal overnight alpha, which is consistent with the result of Fama–MacBeth regression.
The Implication of Environmental, Social, and Governance Pricing
We implement the ESG pricing implication on green stock subsample and sin stock subsample through the portfolio sort and Fama and MacBeth (1973) regressions. Green (Sin) stock subsample are those stocks with ESG scores in the top (bottom) 30%.
Table 5 presents that, compared with sin stock subsample, the mean of ESG score and its components (E-score, S-score, and G-score) are much larger for the green stock subsample. In addition, the average overnight return and intraday return for both green and sin stock subsamples are negative (−0.18 vs. −0.21) and positive (0.39 vs. 0.44), respectively, preliminarily verifying the rationality of featuring the link of investor heterogeneity to the persistence of the overnight and intraday components of returns.
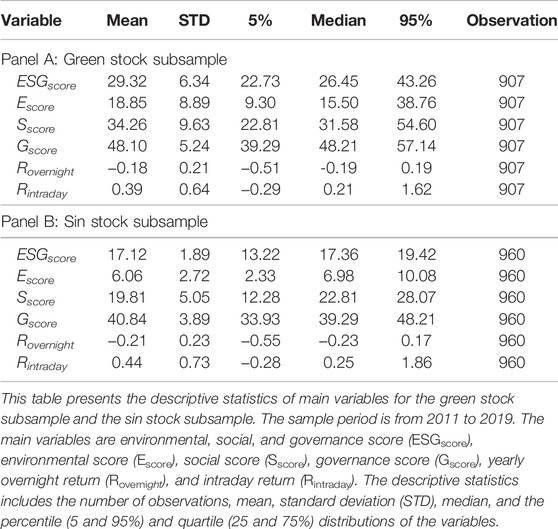
TABLE 5. Descriptive statistics.
For both sin and green stock subsamples, we only report the results of the overnight return for the following two reasons: first, the coefficients of intraday return are statistically insignificant in Fama and MacBeth, (1973) regressions. Second, Fama–French five-factor ESG score–intraday alphas generated by the trading strategies are insignificant as well.
As seen in column 1 of Table 6, for green stock subsample, the coefficient of the ESG score is statistically significantly negative, −0.003, with an associated t-statistics of −1.67. In addition, the coefficient of the E-score is −0.003 (t-statistics of −2.72). These results demonstrate that the firms with higher ESG scores will experience a lower expected overnight return. For other control variables, the coefficient of illiquidity is significantly negative, which is consistent with prior work by Qiao and Dam, (2020) who confirmed that the unique T+1 trading rule would induce liquidity discount of the overnight return.
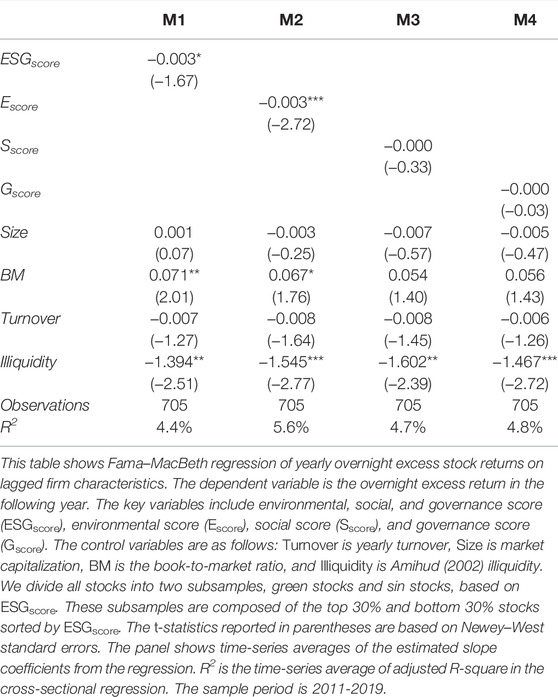
TABLE 6. ESG and overnight return: Fama–MacBeth regression for green stock subsample.
To summarize, the result parallels that of Pástor et al. (2021a), who argued that preference for holding green stocks negatively affects prices. However, for the sin stock subsample, we find that the coefficients of the ESG score are not statistically significant. Due to space limit, we do not add the tables which report the Fama and MacBeth, (1973) regression and double-sort portfolio analysis for sin stocks.
Next, we turn to a five-by-five conditional double sort based on three firms’ characteristics and the ESG. For green stock subsample, Panel A of Table 7 reports yearly Fama–French five-factor overnight returns for a five-by-five conditional double-sort strategy. Interestingly, we find that the one-dimensional trading strategy of positive overnight return is pervasive in the median-sized firms and experiences a sharp reversal for other size firms. Overall, size plays a big role in the sign of the abnormal overnight alpha, which is consistent with the result of Fama–MacBeth regression. In addition, for sin stock subsample, we find that the spreads become significantly positive for the biggest size quintile and remains negative for the median and the fourth size quintile.
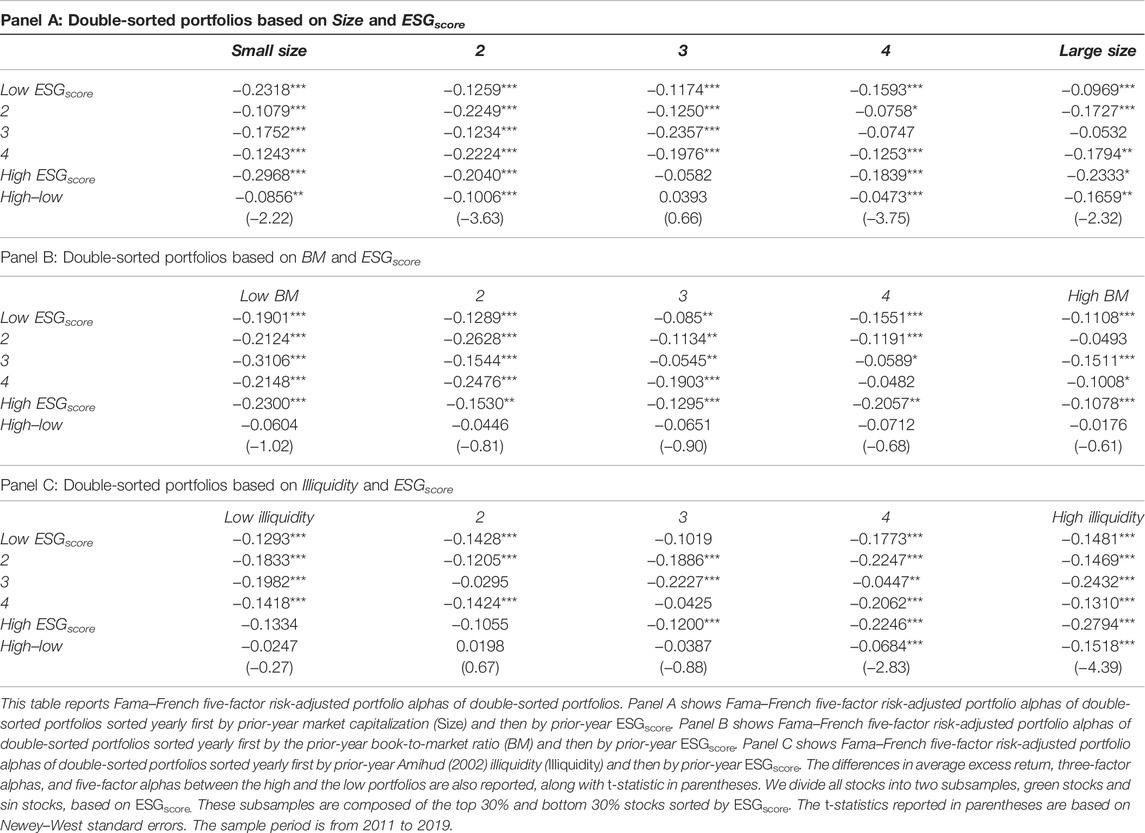
TABLE 7. ESG and overnight return: conditional double-sorted portfolio analysis for green stock subsample.
Panel B of Table 7 presents the book-to-market ratio, which also plays a role in the sign of the abnormal overnight alpha to some extent for green stocks. In addition, for sin stock subsample, we find that the spreads become significantly positive for the highest BM quintile and remains negative for the second and the median BM quintile.
At last, Panel C of Table 7 shows that the one-dimensional trading strategy of positive overnight return experiences a sharp reversal for the liquidity stocks. Overall, liquidity also plays a big role in the sign of the abnormal overnight alpha, which is consistent with the result of Fama–MacBeth regression. In addition, for sin stock subsample, we find that the spreads become significantly positive for the least illiquidity quintile and remains negative for the other four illiquidity quintiles.
To summarize, these results confirm that, on the one hand, the size and liquidity are likely to drive the pricing of the ESG for the green stock subsample, and on the other hand, the ESG score is not a pricing factor for the sin stock subsample, and it is the green stocks that contribute to the overnight premium of the ESG score.
Conclusion
Whether the price of stocks considering the ESG score has efficiently reflected the market information involves important implications for asset pricing of green finance and carbon finance. While financial economists have long studied the profitability of trading strategies based on the close-to-close return and devoted to the pricing of ESG stocks, we investigate the pricing of ESG based on the relation between ESG score and expected overnight and intraday components of returns in the Chinese stock market.
Our Fama and MacBeth, (1973) cross-sectional regressions present that the coefficient of ESG score is statistically significantly negative, demonstrating that the firms with higher ESG scores will experience a lower expected overnight return. Consistently, conditional double-sort portfolio analysis based on the stock characteristics and ESG score confirms that the contrarian strategies long (short) the bottom (top) ESG would generate five-factor overnight profits per year for the biggest size quintile, the highest book-to-market quintile, and the liquidity quintile. To conclude, the firm characteristics are likely to drive the pricing of the ESG.
In addition, we reexamine the ESG pricing for green stock subsample and sin stock subsample. Overall, the results confirm that the ESG score is not a pricing factor for the sin stock subsample, and it is the green stocks that contribute to the overnight premium of the ESG score. Our mechanism analysis shows that size and illiquidity play a big role in the signs of the abnormal overnight alpha, which indicates that responsible investing may lead some corporates to become greener, and in the long run, ESG investors can also make profits.
Our study has implications of the asset pricing of responsible investing. Specifically, we empirically verify that a stock’s environment, social, and governance (ESG) score is beneficial to affecting investor preferences and show the feasibility of responsible investing by using ESG in investing. The main challenge of ESG lies in the absence of a reliable measure of the true ESG performance. We find the ESG scores of the Chinese A-shares stocks are different in different databases, and the database providers do not publish their calculation standards, so we need to cope with incomplete and opaque ESG data. In the future, we can employ the standard deviation of ESG scores from several providers as a proxy for ESG uncertainty and examine the cross-sectional ESG uncertainty–overnight (intraday) alpha relation.
Data Availability Statement
The original contributions presented in the study are included in the article/Supplementary Material; further inquiries can be directed to the corresponding author.
Author Contributions
Conceptualization: XL and YC; Methodology: XL and CY; Software: CY and XL; Validation: XL, CY, and YC; Formal analysis: XL and YC; Investigation: CY and YC; Resources: XL and YC; Data Curation: CY; Writing—Original Draft: XL, CY, and YC; Writing—Review and Editing: XL, YC, and CY; Visualization: CY; Supervision: XL and YC; Project administration: XL and YC; and Funding acquisition: XL.
Funding
XL acknowledges financial support from the National Nature Science Foundation of China (#72101067) and the Nature Science Foundation of Hainan Province (#722RC626).
Conflict of Interest
The authors declare that the research was conducted in the absence of any commercial or financial relationships that could be construed as a potential conflict of interest.
Publisher’s Note
All claims expressed in this article are solely those of the authors and do not necessarily represent those of their affiliated organizations, or those of the publisher, the editors, and the reviewers. Any product that may be evaluated in this article, or claim that may be made by its manufacturer, is not guaranteed or endorsed by the publisher.
Supplementary Material
The Supplementary Material for this article can be found online at: https://www.frontiersin.org/articles/10.3389/fenvs.2022.927420/full#supplementary-material
References
Aboody, D., Even-Tov, O., Lehavy, R., and Trueman, B. (2018). Overnight Returns and Firm-specific Investor Sentiment. J. Financ. Quant. Anal. 53 (2), 485–505. doi:10.1017/s0022109017000989
Amihud, Y. (2002). Illiquidity and Stock Returns: Cross-Section and Time-Series Effects. J. Financial Mark. 5 (1), 31–56. doi:10.1016/s1386-4181(01)00024-6
Avramov, D., Cheng, S., Lioui, A., and Tarelli, A. (2021). Sustainable Investing with ESG Rating Uncertainty. J. Financial Econ..2021. 1. doi:10.1016/j.jfineco.2021.09.009
Avramov, D., and Chordia, T. (2006). Asset Pricing Models and Financial Market Anomalies. Rev. Financ. Stud. 19 (3), 1001–1040. doi:10.1093/rfs/hhj025
Barardehi, Y. H., Bernhardt, D., Ruchti, T. G., and Weidenmier, M. (2021). The Night and Day of Amihud's (2002) Liquidity Measure. Rev. Asset Pricing Stud. 11 (2), 269–308. doi:10.1093/rapstu/raaa022
Barber, B. M., Morse, A., and Yasuda, A. (2021). Impact Investing. J. Financial Econ. 139 (1), 162–185. doi:10.1016/j.jfineco.2020.07.008
Bauer, R., Ruof, T., and Smeets, P. (2021). Get Real! Individuals Prefer More Sustainable Investments. Rev. Financial Stud. 34 (8), 3976–4043. doi:10.1093/rfs/hhab037
Bian, J. Z., and Su, T. (2010). The T+1 Trading Rule and the Chinese Warrant Market Premium. J. Financial Res. 2010, 143–161. (in Chinese).
Bogousslavsky, V. (2021). The Cross-Section of Intraday and Overnight Returns. J. Financial Econ. 141 (1), 172–194. doi:10.1016/j.jfineco.2020.07.020
Boudoukh, J., Feldman, R., Kogan, S., and Richardson, M. (2019). Information, Trading, and Volatility: Evidence from Firm-specific News. Rev. Financial Stud. 32 (3), 992–1033. doi:10.1093/rfs/hhy083
Cao, J., Wen, F., and Eugene Stanley, H. (2021). Measuring the Systemic Risk in Indirect Financial Networks. Eur. J. Finance 2021, 1–46. doi:10.1080/1351847x.2021.1958244
Cao, J., Wen, F., Stanley, H. E., and Wang, X. (2021). Multilayer Financial Networks and Systemic Importance: Evidence from China. Int. Rev. Financial Analysis 78, 101882. doi:10.1016/j.irfa.2021.101882
Cao, J., Wen, F., Zhang, Y., Yin, Z., and Zhang, Y. (2021). Idiosyncratic Volatility and Stock Price Crash Risk: Evidence from China. Finance Res. Lett. 2021, 102095.
Chen, R., Wang, Z., Yang, L., Ng, C. T., and Cheng, T. C. E. (2022). A Study on Operational Risk and Credit Portfolio Risk Estimation Using Data Analytics*. Decis. Sci. 53 (1), 84–123. doi:10.1111/deci.12473
Chen, R., Xu, G., Xu, F., Jin, C., and Yu, J. (2022). A Clientele Effect in Online Lending Markets: Evidence from the Comovement between Investor Sentiment and Online Lending Rates. J. Int. Financial Mark. Institutions Money 76, 101461. doi:10.1016/j.intfin.2021.101461
Constantinides, G. M., and Duffie, D. (1996). Asset Pricing with Heterogeneous Consumers. J. Political Econ. 104 (2), 219–240. doi:10.1086/262023
Dai, Z., Kang, J., and Wen, F. (2021). Predicting Stock Returns: a Risk Measurement Perspective. Int. Rev. Financial Analysis 74, 101676. doi:10.1016/j.irfa.2021.101676
Dai, Z., Zhou, H., Kang, J., and Wen, F. (2021). The Skewness of Oil Price Returns and Equity Premium Predictability. Energy Econ. 94, 105069. doi:10.1016/j.eneco.2020.105069
Dai, Z., and Zhu, H. (2020). Forecasting Stock Market Returns by Combining Sum-Of-The-Parts and Ensemble Empirical Mode Decomposition. Appl. Econ. 52 (21), 2309–2323. doi:10.1080/00036846.2019.1688244
Dai, Z., Zhu, H., and Zhang, X. (2022). Dynamic Spillover Effects and Portfolio Strategies between Crude Oil, Gold and Chinese Stock Markets Related to New Energy Vehicle. Energy Econ. 109, 105959. doi:10.1016/j.eneco.2022.105959
Fama, E. F., and French, K. R. (2015). A Five-Factor Asset Pricing Model. J. Financial Econ. 116 (1), 1–22. doi:10.1016/j.jfineco.2014.10.010
Fama, E. F., and French, K. R. (2007). Disagreement, Tastes, and Asset Prices. J. Financial Econ. 83 (3), 667–689. doi:10.1016/j.jfineco.2006.01.003
Fama, E. F., and MacBeth, J. D. (1973). Risk, Return, and Equilibrium: Empirical Tests. J. Political Econ. 81 (3), 607–636. doi:10.1086/260061
Gibson Brandon, R., Krueger, P., and Schmidt, P. S. (2021). ESG Rating Disagreement and Stock Returns. Financial Analysts J. 77 (4), 104–127. doi:10.1080/0015198x.2021.1963186
Gokmenoglu, K., Eren, B. M., Eren, B. M., and Hesami, S. (2021). Exchange Rates and Stock Markets in Emerging Economies: New Evidence Using the Quantile-On-Quantile Approach. Quantitative Finance Econ. 5 (1), 94–110. doi:10.3934/qfe.2021005
Harrison, J. M., and Kreps, D. M. (1978). Speculative Investor Behavior in a Stock Market with Heterogeneous Expectations. Q. J. Econ. 92 (2), 323–336. doi:10.2307/1884166
Hartzmark, S. M., and Sussman, A. B. (2019). Do investors Value Sustainability? A Natural Experiment Examining Ranking and Fund Flows. J. Finance 74 (6), 2789–2837. doi:10.1111/jofi.12841
Hong, H., and Kacperczyk, M. (2009). The Price of Sin: The Effects of Social Norms on Markets. J. Financial Econ. 93 (1), 15–36. doi:10.1016/j.jfineco.2008.09.001
Hou, K., Xue, C., and Zhang, L. (2020). Replicating Anomalies. Rev. Financial Stud. 33 (5), 2019–2133. doi:10.1093/rfs/hhy131
Jacobs, H. (2015). What Explains the Dynamics of 100 Anomalies? J. Bank. Finance 57, 65–85. doi:10.1016/j.jbankfin.2015.03.006
Li, Z., Tian, M., Ouyang, G., and Wen, F. (2021). Relationship between Investor Sentiment and Earnings News in High and Low Sentiment Periods. Int. J. Fin. Econ. 26 (2), 2748–2765. doi:10.1002/ijfe.1931
Liow, K. H., Song, J., Song, J., and Zhou, X. (2021). Volatility Connectedness and Market Dependence across Major Financial Markets in China Economy. Quantitative Finance Econ. 5 (3), 397–420. doi:10.3934/qfe.2021018
Lou, D., Polk, C., and Skouras, S. (2019). A Tug of War: Overnight versus Intraday Expected Returns. J. Financial Econ. 134 (1), 192–213. doi:10.1016/j.jfineco.2019.03.011
Pástor, L., Stambaugh, R. F., and Taylor, L. A. (2021b). Dissecting Green Returns. Work. Pap. 2021, 58.
Pástor, L., Stambaugh, R. F., and Taylor, L. A. (2021a). Sustainable Investing in Equilibrium. J. Financial Econ. 142 (2), 550–571.
Pedersen, L. H., Fitzgibbons, S., and Pomorski, L. (2021). Responsible Investing: The ESG-Efficient Frontier. J. Financial Econ. 142 (2), 572–597. doi:10.1016/j.jfineco.2020.11.001
Qiao, K., and Dam, L. (2020). The Overnight Return Puzzle and the "T+1" Trading Rule in Chinese Stock Markets. J. Financial Mark. 50, 100534. doi:10.1016/j.finmar.2020.100534
Ren, X., Duan, K., Tao, L., Shi, Y., and Yan, C. (2022). Carbon Prices Forecasting in Quantiles. Energy Econ. 108, 105862. doi:10.1016/j.eneco.2022.105862
Ren, X., Li, Y., Shahbaz, M., Dong, K., and Lu, Z. (2022). Climate Risk and Corporate Environmental Performance: Empirical Evidence from China. Sustain. Prod. Consum. 30, 467–477. doi:10.1016/j.spc.2021.12.023
Ren, X., Tong, Z., Sun, X., and Yan, C. (2022). Dynamic Impacts of Energy Consumption on Economic Growth in China: Evidence from a Non-parametric Panel Data Model. Energy Econ. 107, 105855. doi:10.1016/j.eneco.2022.105855
Sikiru, A. A., Salisu, A. A., and Salisu, A. A. (2021). Hedging with Financial Innovations in the Asia-Pacific Markets during the COVID-19 Pandemic: the Role of Precious Metals. Quantitative Finance Econ. 5 (2), 352–372. doi:10.3934/qfe.2021016
Sloan, R. G. (1996). Do stock Prices Fully Reflect Information in Accruals and Cash Flows about Future Earnings? Account. Rev. 1996, 289–315.
Umutlu, M., and Bengitoz, P. (2020). Return Range and the Cross-Section of Expected Index Returns in International Stock Markets. Quantitative Finance Econ. 5 (3), 421–451.
Wen, F., Cao, J., Liu, Z., and Wang, X. (2021). Dynamic Volatility Spillovers and Investment Strategies between the Chinese Stock Market and Commodity Markets. Int. Rev. Financial Analysis 76, 101772. doi:10.1016/j.irfa.2021.101772
Wen, F., Li, C., Sha, H., and Shao, L. (2021). How Does Economic Policy Uncertainty Affect Corporate Risk-Taking? Evidence from China. Finance Res. Lett. 41, 101840. doi:10.1016/j.frl.2020.101840
Wen, F., Liu, Z., Cao, J., Zhang, Y., and Yin, Z. (2021). Mood Seasonality: Evidence from the Chinese A-Share Market. Finance Res. Lett. 2021, 102232.
Wen, F., Yuan, Y., and Zhou, W. X. (2021). Cross-shareholding Networks and Stock Price Synchronicity: Evidence from China. Int. J. Fin. Econ. 26 (1), 914–948. doi:10.1002/ijfe.1828
Wen, F., Zhang, K., and Gong, X. (2021). The Effects of Oil Price Shocks on Inflation in the G7 Countries. North Am. J. Econ. Finance 57, 101391. doi:10.1016/j.najef.2021.101391
Wen, F., Zou, Q., and Wang, X. (2021). The Contrarian Strategy of Institutional Investors in Chinese Stock Market. Finance Res. Lett. 41, 101845. doi:10.1016/j.frl.2020.101845
Xiao, J., Wen, F., Zhao, Y., and Wang, X. (2021). The Role of US Implied Volatility Index in Forecasting Chinese Stock Market Volatility: Evidence from HAR Models. Int. Rev. Econ. Finance 74, 311–333. doi:10.1016/j.iref.2021.03.010
Keywords: ESG pricing, overnight return, trading strategy, Fama–MacBeth regression, green stock
Citation: Liu X, Yang C and Chao Y (2022) The Pricing of ESG: Evidence From Overnight Return and Intraday Return. Front. Environ. Sci. 10:927420. doi: 10.3389/fenvs.2022.927420
Received: 24 April 2022; Accepted: 24 May 2022;
Published: 05 July 2022.
Edited by:
Xiaohang Ren, Central South University, ChinaReviewed by:
Zhengke Ye, Central South University, ChinaZhifeng Dai, Changsha University of Science and Technology, China
Copyright © 2022 Liu, Yang and Chao. This is an open-access article distributed under the terms of the Creative Commons Attribution License (CC BY). The use, distribution or reproduction in other forums is permitted, provided the original author(s) and the copyright owner(s) are credited and that the original publication in this journal is cited, in accordance with accepted academic practice. No use, distribution or reproduction is permitted which does not comply with these terms.
*Correspondence: Youcong Chao, Y2hhb3lvdWNvbmc4N0AxNjMuY29t