 Yafeng Zou
 Min Deng
 Qi Wang
 Qian Zhang
 Yao Rong
- 1College of Environment and Safety Engineering, Fuzhou University, Fuzhou, China
- 2School of Public Administration, Inner Mongolia University, Hohhot, China
- 3Institute of Geographic Sciences and Natural Resources Research, Chinese Academy of Sciences (CAS), Beijing, China
- 4Faculty of Geographical Science, Beijing Normal University, Beijing, China
Urbanization is both a global concept and a project that is connected with all aspects of the society. China’s new urbanization process has been attracting wide attention internationally due to its rapid development and rich content. This new urbanization has significant impacts on hundreds of millions of people’s lives, as well as global wellbeing. Although Western China has always been in a relatively weak state of development when compared to the other parts of China, it has a large area and a significant amount of people, which all require a reasonable urbanization method. To show the development level of new urbanization in western China, we constructed an evaluation system and used entropy and weighted summation methods to get the development scores. We then obtained the correlation coefficient with the partial correlation analysis method. The results indicate that: 1) economic, land, and social urbanization are significant influencing factors; 2) temporal and spatial differences were significant during the 15-year period in these 11 cities; 3) among the factor layers, the score of social urbanization fluctuated the most, ecological civilization and economic urbanization showed an upward trend, and population urbanization and land urbanization have been relatively stable in the last few years; 4) for the western capitals, although economic urbanization and ecological civilization have achieved coordinated development in recent years, the endogenous power of the economy still needs to be tapped, and ecological development is facing greater pressure. Meanwhile the expansion of urban land has been too fast to respond well to population growth, which also damages the urban ecosystem to a certain extent. We conclude that it is necessary to realize the coordinated development of different factors in new urbanization, promote new urbanization, while considering the actual needs of the city and also developing the rural areas. This study can provide decision support for the development of new urbanization in the western region.
1 Introduction
Developed countries have generally reached a stable stage of urbanization, with more than 70% of the population living in urban areas. The focus of world urbanization has therefore shifted to developing countries, and the global urbanization pattern is rapidly changing (Wei et al., 2018). As the largest developing country in the world, China plays an important role in the world urbanization pattern. In the nearly 30 years from 1949 (foundation of the state) to 1978 (reform and opening up), the tortuous pathway of the country’s development (Chen C. et al., 2018) meant that China’s urbanization rate had only increased from 10.64% to 17.92%, with an average annual growth rate of 1.81%. Following the reform period and opening up, the speed and scale of China’s urbanization have been unprecedented, reaching 57.35% in 2016 (Friedmann, 2006; Guan et al., 2018). However, along with the achievements, a series of problems have emerged, such as the blind expansion of urban space, the semi-urbanization problem, a dual urban–rural structure, and ecological deterioration (Lu et al., 2014; Zhang and Xu, 2017; Chen M. et al., 2018; Li et al., 2018). Throughout the history of China’s urbanization, the achievements and challenges have been closely related to national policies. This is also the main reason why China’s urbanization differs from other countries and presents distinct stages.
In view of these issues, in 2002 the Chinese government formally put forward the idea of “taking the road of urbanization with Chinese characteristics,” explicitly using the term “new urbanization” at the 18th National Congress of the Communist Party of China (CPC) in 2012. The pilot work was started in 2014. New urbanization focuses on not only the transfer of rural residents to cities but also on the development of all aspects of a society. For instance, when promoting new urbanization, sustainability is an important characteristic as well as a goal. In the process of new urbanization, development should be realized without sacrificing resources and the environment (Deng and Bai, 2014). Sustainable new urbanization should consider cleaning waterways, sewage treatment, resource shortages, and air pollution, which are definitely responses that are capable of well-off societies (Chen et al., 2019). Sustainability is not the sole goal that new urbanization pursues but it is one unique feature that differs new urbanization from traditional urbanization.
The academic world has discussed the characteristics and connotations (Taylor, 2015; Griffiths and Schiavone, 2016; Chen C. et al., 2018), the problems (Wang et al., 2015), the route to realization (Kim, 2015; Chen et al., 2016; Wu et al., 2016), and the potential impacts (Hu and Chen, 2015) of new urbanization, thus laying a theoretical foundation to promote the concept in China. Meanwhile, to evaluate the quality of new urbanization in cities, and to guide decisions, experts and scholars have constructed a variety of index evaluation systems (Fang et al., 2015; Yang and Lu, 2016; Chen M. et al., 2018), using the entropy method (Zhao and Wang, 2018), variation coefficient method (Zhao and Wang, 2018), expert evaluation method (Yang and Lu, 2016), as well as other subjective and or objective approaches to index calculation. While they usually concentrated on the horizontal and static comparison of a time node between regions, they lacked dynamic trend analysis on the vertical scale of time and did not pay attention to the western underdeveloped region.1
Obviously, new urbanization is a complex research topic. Therefore, a discussion of the connotation and multi-dimensional assessment of new urbanization are necessary to help understand its meaning and characteristics. Meanwhile, a study of the typical research area could manifest the evolution features and dynamic changes in promoting new urbanization. Therefore, this paper discusses the concept of new urbanization. It then uses existing research results to construct a comprehensive evaluation system from an examination of five aspects: population urbanization, economic urbanization, land urbanization, social urbanization, and ecological civilization. It measures the level of new urbanization in the western provincial capital cities from 2005 to 2019, and analyzes the cause of the changes. Finally, it provides decision support for the promotion of new urbanization in the western region.
2 Materials and Methods
2.1 Study Area
Western China includes six provinces (i.e., Shaanxi, Sichuan, Yunnan, Guizhou, Gansu, and Qinghai), five autonomous regions (i.e., Inner Mongolia, Guangxi, Ningxia, Xinjiang, and Tibet), and one municipality (i.e., Chongqing). Due to the policy and location disadvantage, the western region lags far behind the central and eastern regions. In particular, its urbanization and the gap between urban and rural areas are serious (Chen C. et al., 2018; Chen et al., 2019; Feng et al., 2019). However, the development of the western region is directly related to the realization of national modernization, and has an important strategic position in the country (Luo et al., 2018). Considering the difference of economic development and administrative management in Chongqing, the other 11 provincial capitals were finally selected as the research object (Figure 1).
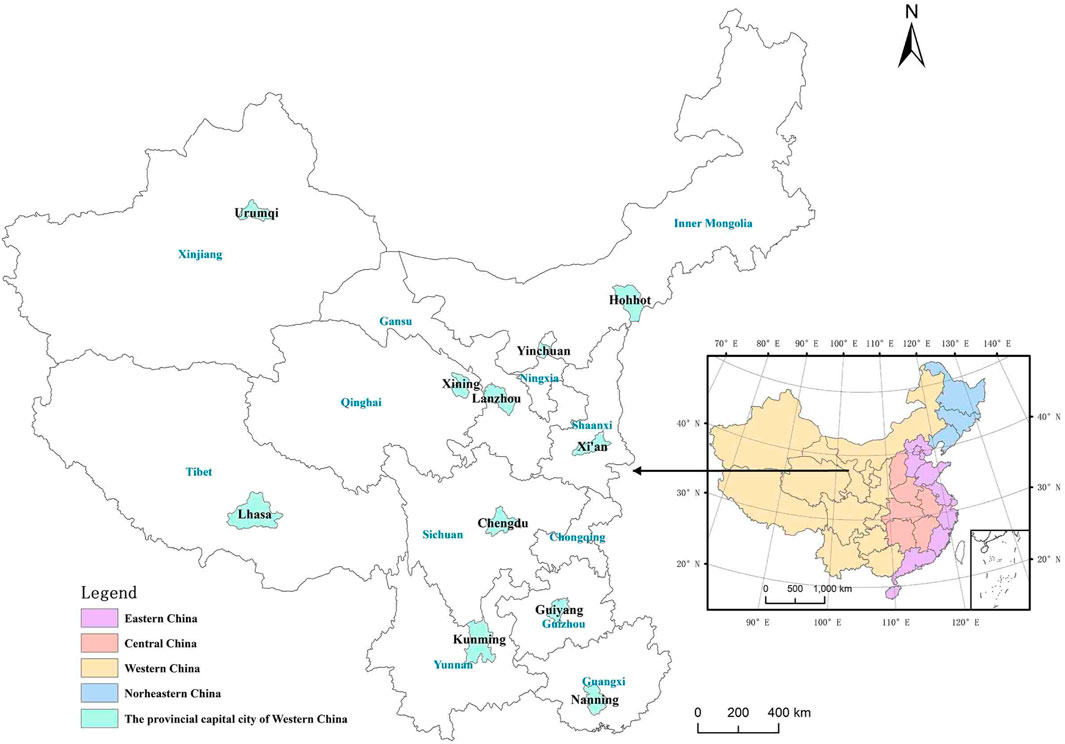
FIGURE 1. Study area.
2.2 Data Sources and Processing
The data in this paper were all collected from national and provincial statistical sources, including the China Statistical Yearbook, China City Statistical Yearbook, China Statistical Yearbook on Environment and other statistical yearbooks and bulletins from various cities. Because of the lack of some data in Lhasa, interpolation has been used to complete the results from there.
2.3 Methodology
Inspired by the key goals of National New Urbanization Plan (2014–2020) (NNUP) and recent research on new urbanization, the connotation of new urbanization was defined. Based on that, a comprehensive evaluation index system for new urbanization was constructed, including five factor layers: population urbanization, economic urbanization, land urbanization, social urbanization, and ecological civilization. The entropy method (Zhao J. et al., 2018; Wei et al., 2018) was used to determine the index weight, and the weighted summation method was used to calculate the new urbanization comprehensive scores of the western provincial capitals. The standard deviation method (Tang and Song, 2006) was then used to define three levels: high, medium, and low, and regional comparison was made with ArcGIS software. The development status of each city was finally classified into one of four categories: increased erratically; increased rapidly; increased then decreased; and decreased sharply and then leveled out. Geared towards differences at the monomial level of new urbanization for western provincial capitals, this paper made dynamic comparisons from these five factors and explored the driving factors for the differences. The effects of policies on the score of each factor, each city, and each index were analyzed in detail. The evolution characteristics of new urbanization in western provincial capitals in the past 15 years from 2005 to 2019 and the trend of new urbanization in the future were concluded. Finally, the correlation and coordination of each factor were discussed by using partial correlation analysis (Figure 2).
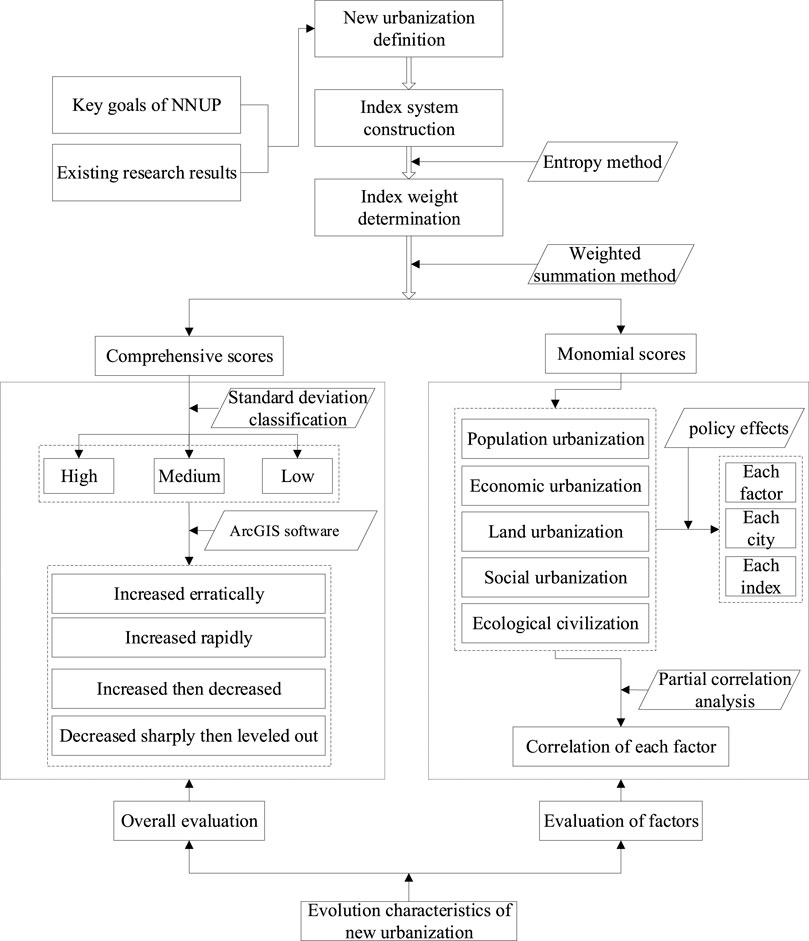
FIGURE 2. Research flowchart.
2.4 Definition of New Urbanization
The word urbanization was first proposed by the Spanish Engineer Cerdà in the General Theory of Urbanization in 1867. Early scholars defined urbanization as the concentration of population into cities (Hertzler, 1956; Kuznets, 1966). However, this definition ignored the changes in industrial structure, economic development, lifestyle, ideology, and other aspects brought about by population flow. With the development of cities in Western countries, the connotations of urbanization were: increased transition from a rural economy to an urban economy, from primary industry to secondary and tertiary industry (Kuznets, 1971; Hirsch, 1984), and from rural lifestyle to urban lifestyle (Wirth, 1938; Mendras, 1970), as well as the encroachment of the urban landscape into rural areas (Antrop, 2004). Scholars of different fields have interpreted urbanization from many dimensions, such as economy, society, and geography. These various interpretations imply that the subject of transformation is as complex as the process of urbanization itself. Friedmann and Wolf (1982) considered various viewpoints and divided urbanization into two types: I and II. Urbanization I refers to the transformation of physical aspects, such as population, economic activities, space, and landscape, which are visible. Meanwhile, urbanization II refers to the transformation of ideas such as values, social relations, and lifestyle, which are invisible.
Traditional urbanization has on the one hand brought economic growth and improved living standards, but on the other hand it has caused pollution and urban diseases (Cui et al., 2019; Liang and Yang, 2019). In addition, new problems have emerged in China, such as semi-urbanization, land urbanization progressing faster than population urbanization, and a dual urban–rural structure. Clearly, China can no longer take the traditional road of urbanization, and has little experience to learn from (Gu et al., 2012). After exploring (in 2003) the idea of “taking the road of urbanization with Chinese characteristics,” in 2012 the 18th CPC national congress formally proposed the term “new urbanization.” To promote new urbanization, the Decision of the Central Committee of the CPC on Some Major Issues Concerning Comprehensively Deepening the Reform was published in November 2013, which required acceleration of reform to the household registration system (hukou) and improvements to the system of urban–rural integration. In December 2013, the Central Economic Work Conference (CEWC) further defined it as “a new type of intensive, smart, green, and low-carbon urbanization path.” In March 2014, the NNUP was issued. As the government anticipated, the gap in urbanization rate between the resident and registered populations in cities is expanding year by year. For rural migrants, the absence of urban household registration means that they cannot enjoy the same level of public services as urban residents, and their consumption will also be limited because they lack social security. Therefore, in July 2014, the State Council issued Opinions on Further Promoting the Reform of the Household Registration System ended the dual household registration management model that had prevailed for half a century and instead laid a foundation for the healthy development of urbanization in China. From the end of 2014–2016, the central government determined three batches of pilot lists of places implementing new urbanization,2 which meant that it had now entered the development stage. However, the connotations of new urbanization have not yet been unified and made clear.
In 2012, the report of the 18th CPC National Congress pointed out that the “new” part of new urbanization is urban–rural coordination, integration, and interaction. This entails intensive economic, ecological viability, and harmonious growth, and also represents the coordinated development of large, medium, and small cities, small towns, and new rural communities. Scholars tend to define new urbanization considering its characteristics, especially the differences from traditional urbanization, which pursues an increase of urban population and expansion of urban areas. However, traditional urbanization involves turning non-urban land into urban land, which results in loss of biodiversity, and environmental damage. In contrast, new urbanization is a process of urban–rural integration with humans placed at the core, emphasizing the rights of the individual, and attaching importance to harmony between humans and nature. People-oriented target, urban–rural integration, ecological protection, and sustainable development (Kim, 2015; Li and Martin, 2017; Bai et al., 2018; Chen et al., 2016; Chen et al., 2019) are therefore the key components of a new urbanization. The realization of new urbanization requires resource saving, especially with regard to land, optimization and upgrading of industrial structure and economic development, regional coordination, equalization of public services, and improvements of urban livability (Tan, 2017; Yang et al., 2017; Ma et al., 2018; Shang et al., 2018; Zhan et al., 2018; Zhao Z. et al., 2018). Therefore, new urbanization is a multi-factor and multi-level systematic process, in which people-oriented urbanization is at the core and population urbanization is pivotal. High-quality economic development is the driving force, and consequently economic urbanization is an important part of this concept. Urban construction emphasizes saving, intensive, and livable, and therefore land urbanization is the optimization part. Effective protection of the ecological environment and harmonious development between man and nature are new aspects. The ultimate goal is urban–rural integration, with social urbanization leading to social security and public service realization.
2.5 Construction of an Index System
Inspired by the NNUP, the connotations of new urbanization and existing research results (Fang et al., 2015; Yang and Lu, 2016; Chen M. et al., 2018; Zhang and Wang, 2018), an index system of new urbanization (Table 1) was constructed from five factors: population urbanization, economic urbanization, land urbanization, social urbanization, and ecological civilization.
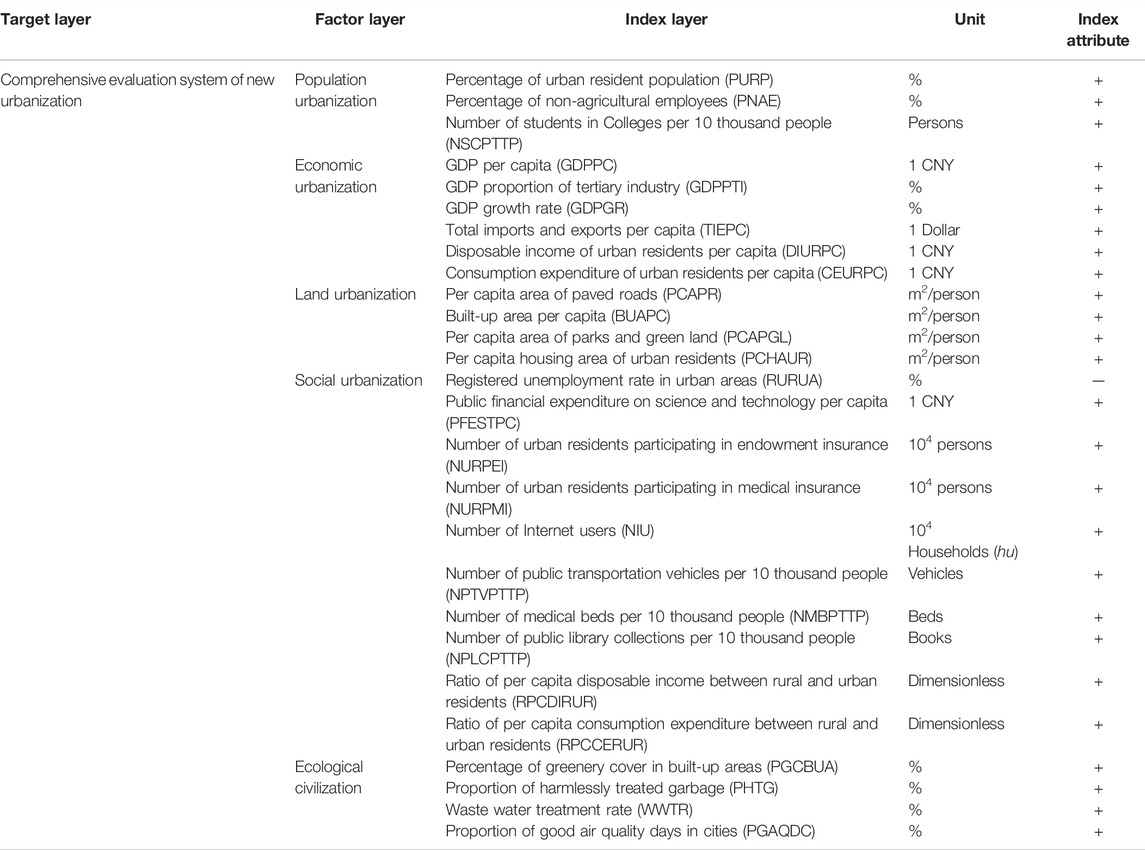
TABLE 1. Comprehensive evaluation index system of new urbanization level.
Population urbanization reflects the concentration of people moving from rural areas to urban areas, leading to a change in the employment pattern of the migrant population. The new urbanization pays attention to the new migrants and their significance to the development of the new urban areas. Hence, percentage of urban resident population (PURP) is used to reflect urban population agglomeration. Percentage of non-agricultural employees (PNAE) indicates the change in lifestyle of the migrant people. The number of students in colleges per 10 thousand people (NSCPTTP) reflects the quality of the population and directly embodies the popularization of higher education.
Economic urbanization means not only the efficient development of the urban economy and the upgrading of industrial structure but also sharing of the fruits of economic development. The GDP growth rate (GDPGR) is the efficiency index, and the GDP per capita (GDPPC) is the quality index. A combination of the two can measure the local economic development more effectively. The GDP proportion of tertiary industry (GDPPTI) represents the upgrading of the existing industrial structure. Total imports and exports per capita (TIEPC) is an important driver of the development of the western cities in the context of greater reform and opening up. Disposable income of urban residents per capita (DIURPC) and consumption expenditure of urban residents per capita (CEURPC) can express whether urban residents benefit from economic achievements, it can also indicate improvements in their quality of life.
Land urbanization (the transformation of agricultural land into non-agricultural land) is accompanied by the expansion of the urban landscape and an increase in land investment. Infrastructure plays an important role in land investment and the per capita area of paved roads (PCAPR) is chosen as a measure in this paper. Although the huge incremental value of non-agricultural land makes rapid urbanization a reality, urbanization requires efficient use of the newly developed land, therefore built-up area per capita (BUAPC) is chosen to reflect the expansion of urban landscape. Analyzing it from the “people-oriented” perspective leads to the important questions of whether the urban housing supply matches the population growth and whether the urban environment is livable. Therefore, two indexes—per capita housing area of urban residents (PCHAUR) and per capita area of parks and green land (PCAPGL)—have been selected.
The index of social urbanization is the richest, mainly due to the varied activities associated with social development (e.g., construction of infrastructure, public services, and social security). Urban–rural coordination development and the narrowing of the wealth gap between urban and rural residents have also become key issues. The number of Internet users (NIU), the number of public transportation vehicles per 10 thousand people (NPTVPTTP), the number of medical beds per 10 thousand people (NMBPTTP), and the number of public library collections per 10 thousand people (NPLCPTTP) are selected to represent public service. The number of urban residents participating in endowment insurance (NURPEI) and the number of urban residents participating in medical insurance (NURPMI) indicate social security. The ratio of per capita disposable income between rural and urban residents (RPCDIBRUR), and the ratio of per capita consumption expenditure between rural and urban residents (RPCCEBRUR) measure the coordination of the two areas. With both indicators, the ratio is closer to one when the gap between urban and rural residents’ income and expenditure is smaller. The registered unemployment rate in urban areas (RURUA) is the only negative index. The higher the rate is, the lower the new urbanization level will be.
Ecological civilization is a special emphasis of new urbanization, entailing the inclusion of sustainability, resource conservation, and environmental friendliness as rigid constraints during urbanization. This can be measured by improvements to environmental indicators. The percentage of greenery cover in built-up areas (PGCBUA) should be increased, as should be the proportion of harmlessly treated garbage (PHTG) and the waste water treatment rate (WWTR). The proportion of good air quality days in cities (PGAQDC) (i.e., days whose air pollution index is equal to or less than 100) is the most intuitive and easily monitored index of pollution, therefore it has been chosen to represent the air quality of a city.
3 Results
3.1 Weight Determination
The trend chart (Figure 3) was used to show changes in the weight of each index over the years. To find significant influencing factors, the average index weight for each year was calculated, and was found to be 0.0370. This was treated as a critical value, a figure above this value would indicate a significant effect on the new urbanization (Yang and Lu, 2016). We found that significant influencing indicators were mainly concentrated in economic urbanization, land urbanization, and social urbanization, but the weight of these indicators changed widely. The weight of population urbanization and social urbanization increased notably for each factor layer for the 15-year period, showing that their impact on new urbanization has been significantly strengthened. The weight of economic urbanization increased before 2012 but then decreased rapidly, which indicates that the influence of the economy on new urbanization weakened from 2012. However, the weight of land urbanization is the opposite, and land expansion became a driving force instead of the economy after 2012. The weight of ecological civilization did not stop declining until 2013, and then kept rising in fluctuation until 2017. The year 2013 was also the time when new urbanization was widely discussed, and ecological civilization development became gradually more widespread.
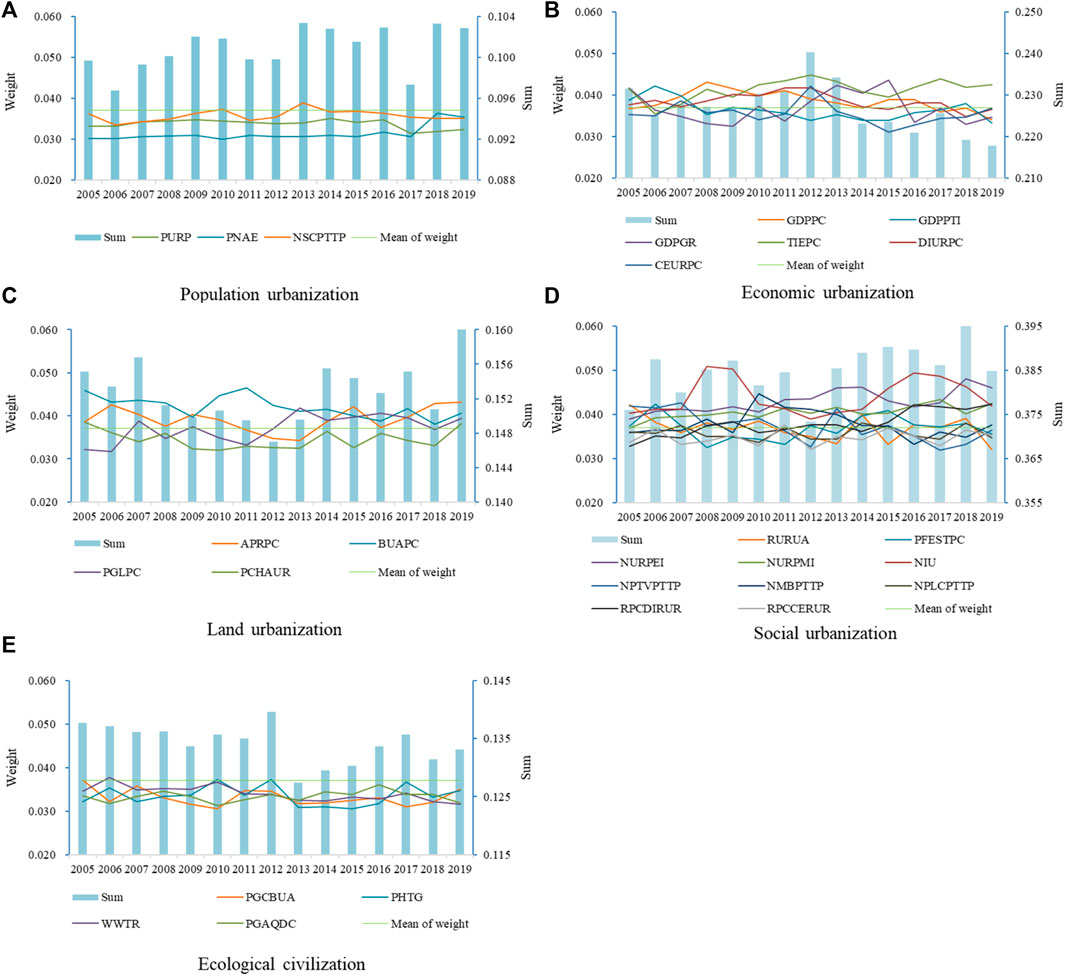
FIGURE 3. Weights of each index over the years. (A) Population urbanization. (B) Economic urbanization. (C) Land urbanization. (D) Social urbanization. (E) Ecological civilization.
3.2 Overall Evaluation
First, for each year, the score for each index was calculated according to the weight, and the score for each city was obtained by summing up the indexes. We then added up the score for each city to get the total score for new urbanization of western provincial capitals for each year. Finally, by graphing the data (Figure 4), we visualized the total score for new urbanization from 2005 to 2019. The results show that the level of new urbanization in the western provincial capitals has risen in a zigzag way, and the total score tends to reach a low point every 3 years. This means that these cities lack experience in the process of developing new urbanization, and are still in an exploratory phase. Furthermore, it achieved “great-leap-forward” status in and after the 12th Five-Year Plan period. And the 13th Five-Year Plan period is a smoothly developing period.
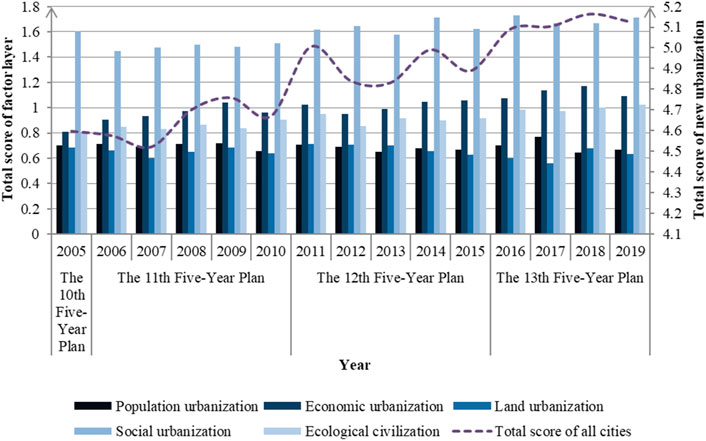
FIGURE 4. Total scores of new urbanization and factor layers in western provincial capitals from 2005 to 2019.
The year 2007 was the fastest for GDPGR in most western provincial capitals, during which time ecological civilization was neglected and its total score decreased. In 2010, the GDPGR of each city was quite different, highlighting the imbalance of development, and the total score declined. In 2011, the beginning of the 12th Five-Year Plan, this imbalance narrowed, due to the change in the orientation of economic development from speed to quality in this new period. The economy of each city entered a steady rapid growth stage, and the economic urbanization score increased significantly. Sustainability and ecological development also played a key role in the process of new urbanization, and therefore this year achieved a leapfrog increase. Since then, the total score has fluctuated, but all the years were above 4.800. In 2013, the economy remained positive but the score for NSCPTTP dropped generally, which was affected by the suspension of the policy of college enrollment expansion in 2012. The score for social urbanization also dropped. In 2015, most cities were limited by built-up areas and guided by the acceleration of ecological development. The construction of paved roads dropped, while the parks and green land and greenery cover increased. However, the score for NPTVPTTP and NIU decreased, which eventually led to the decline of land urbanization and social urbanization scores in this year, and the total score decreased again.
Thus, before the 12th Five-Year Plan, the focus of new urbanization was on the contradiction between economic development and ecological protection. Since 2011, the focus has shifted to the coordination of economy and society. At the same time, the contradiction between ecological development and urban expansion has gradually emerged. However, after entering the 13th Five-Year Plan period, only social urbanization and ecological civilization were steadily rising. Population urbanization, economic urbanization, and land urbanization all suffered a sudden fall in 2017 and then subtly rose.
To further evaluate the level of new urbanization and trends in each city, as well as to explore the driving factors, we visualized the score and level of each city through ArcGIS software (Figure 5). The development of new urbanization of 11 western provincial capitals can be divided into four categories during the period of 2005–2019.
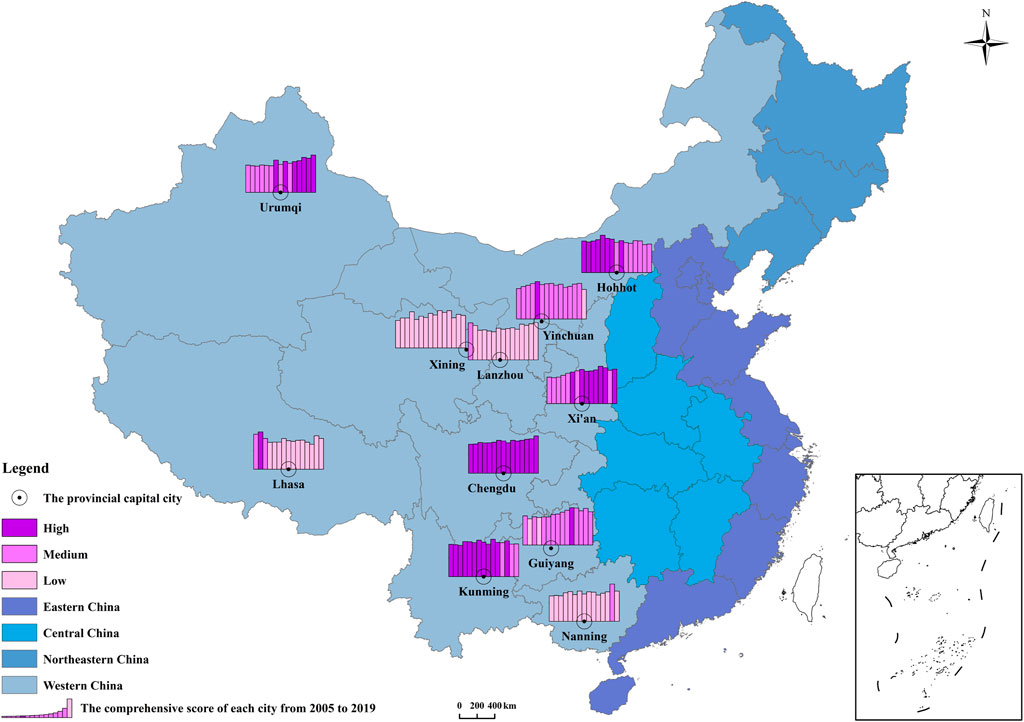
FIGURE 5. Spatial distribution of new urbanization in western provincial capitals.
3.2.1 Increased Erratically: Chengdu, Kunming, Urumqi, and Xining
Chengdu has always been at a high level of new urbanization, but Kunming dropped to a medium level in 2016, 2018, and 2019. Kunming’s score fluctuated more obviously than Chengdu’s, especially since 2013. In 2013, Kunming dropped to fifth place, it then rose to second place in 2014 and dropped to a medium level in 2016. Xining reached a small peak in 2008 and then began to develop rapidly after 2012. However, it has always been at a low level and has always ranked low. Urumqi rose sharply in 2011 and has been at a high level for most of the years since then.
Specifically, Chengdu is the only sub-provincial city and megalopolis3 in western China. Whether measured by population, city scale, economy, or public service, Chengdu is the leader of the western4 provincial capitals, and its new urbanization score has always been ranked first. However, serious air pollution also restricts Chengdu’s development. It is predicted that the new round of the urban overall plan (2016–2035) will bring new opportunities for Chengdu.
Kunming, located in the middle of the Yunnan-Guizhou plateau, has good conditions for the diffusion of air pollution. Consequently, its air quality is better than that of all other western provincial capitals. In 2013, when the China-South Asia Expo (nanbohui) convened, the air quality declined due to construction dust and congestion. In 2014, Kunming implemented a large number of projects benefiting the people. The integration of medical insurance for urban and rural residents has been successfully promoted and expenditure on people’s livelihood increased. Various social undertakings were developed in a coordinated manner, thus scoring a small peak. However, by and after 2016, the establishment of the new district in central Yunnan (Dianzhongxinqu) and other major projects affected the results. Although the scores in population, economy and land improved, the low green coverage rate and the widening gap between urban and rural incomes in the new district still resulted in a small decrease of the score in that year. Therefore, ecology and society are the two driving forces of Kunming’s new urbanization.
Urumqi and Xining are both located in the northwest of China. Due to geographical and climatic constraints, natural vegetation coverage in both of them lags behind that of other cities and they are less attractive to the population. However, Urumqi had a higher score in TIEPC due to its positional advantage of being close to eight different countries. Before 2011, the rapid economic development of Urumqi was realized at the cost of the environment, leading to a low score in ecological civilization. In 2011, Urumqi began a transformation of its economic development and gave priority support to strategic emerging industries. People’s livelihood was also given priority, and a large amount of money was spent on it, especially on NIU. It then achieved a strong leap in economic and social urbanization. At the same time, Urumqi vigorously promoted changing fuel from coal to gas (meigaiqi), which achieved remarkable results for environmental protection. Therefore, economy, society, and ecology were the three driving forces of Urumqi’s new urbanization.
For Xining, although the GDP is relatively low, the GDPGR was better. In 2008, various policies were introduced to support the development of enterprises, and all of the city’s economic indexes reached a record high. In the period of the 12th Five-Year Plan, the government of Xining implemented policies such as financial support for economic restructuring and giving priority to the development of producer services. With the rapid development of the economy, Xining’s transportation, energy, communications, and other infrastructure gradually improved. The residents’ quality of life was also significantly improved. Consequently, the new urbanization of Xining was driven by economy and society.
3.2.2 Increased Rapidly: Xi’an and Guiyang
From 2005 to 2012, Xi’an moved from a medium to a higher level. This was the fastest period of development in Xi’an. After this, in 2012–2015, the speed declined but this ushered in a new opportunity for development in 2016. Guiyang’s development rate was slow in 2005–2010, mostly at a medium level, except for 2006 and 2008, which were low. From 2011, it entered a stage of rapid development, but neither the level nor the ranking changed significantly and it only reached a high level in 2015.
Xi’an has a large number of universities and research institutes, so its NSCPTTP is the highest in the western capital cities. The population urbanization scores declined after 2012, as a result of the central government policy on stabilizing the scale of enrollment to colleges. Also in 2012, the GDPGR slowed down as a result of guidance from the 12th Five-Year Plan national economic goals. However, Xi’an was selected as the starting city of China’s Belt and Road5 initiative in 2016, which has opened up foreign markets and promoted its economy. Foreign trade has become the driving force for new urbanization in Xi’an. Therefore, in this new era, it is very important for Xi’an to seize the opportunity offered by the Belt and Road initiative and formulate policies to retain talented people.
Guiyang’s infrastructure was relatively backward before 2010. After 2011, development clearly accelerated, but the ranking and level did not change significantly. This happened because most of the western provincial capitals entered a stage of rapid development in 2011, and Guiyang’s achievements did not particularly stand out from the others. In 2013, Guiyang began to plan an industrial future based on data processing, and its capability rose to the forefront in China. Guiyang relies on this approach, promoting industrial transformation and the development of high technology. The inflow of talented people, technology, and capital injects a new vitality into urban development. The development of the economy, especially high-tech industries, has therefore become an important driving force for new urbanization in Guiyang.
3.2.3 Increased Then Decreased: Hohhot, Yinchuan and Nanning
Nanning peaked in 2018 and the other two cities peaked in 2009, but they all have been in a declining situation after short-term rising. Hohhot fell to a medium level in 2014 and then stayed at this status for all the rest years except 2015. In 2009, Yinchuan got to its only high level in the 15 years, and was at a medium level from 2010 to 2018. Nanning developed slowly at a low level almost throughout the period.
In the 15-year period, because of a strong dairy industry, the GDPPC of Hohhot was the highest in the western capitals. Hohhot mainly promoted new urbanization with material production. Higher scores in 2009 were mainly attributable to the increase in WWTR, PHTG, and PGAQDC, which were stimulated due to the opportunity of “San Cheng Tong Chuang.”6 In the 12th and 13th Five-Year Plan periods, Hohhot’s GDPGR slowed down in the face of new economic goals and a large-scale economic foundation, which was coupled with the relative lagging in the development of modern service industries.
In 2009, the economy of Yinchuan developed well because it focused on expanding investment and consumer demand. With improved landscaping and ecological development, its score for ecological civilization and land urbanization rose. In the 12th Five-Year Plan period, ecological civilization has emerged as the driving force of Yinchuan through efforts to create a business card of “Green Water, Blue Sky, Bright Yinchuan” (lvshuilantian, mingmeiyinchuan). Yinchuan’s PCAPGL and PGCBUA were in the forefront of China in 2016.
In Nanning, although the PNAE has increased, the scores of GDPPC and RPCDIRUR have always been at a low level. The GDPPC has even been at the bottom of the ranking compared with other western provincial capitals. Since 2011, construction of new campuses in many universities has provided additional capacity. Consequently, Nanning’s Colleges have entered a golden period of enrollment expansion. At the same time, the financial expenditure on technology has been greatly increased and urban construction has intensified, so the scores of social and land urbanization have increased. In 2018, Nanning reached a medium level, due to its obvious progress in transportation system building and completion of house-buying foundation. Consequently, people’s quality of lives was greatly prompted. However, there has always been a lack of innovation in science and technological development, and a concentration of endogenous power in economic development, relying solely on the government to expand construction efforts and the supply of public resources. Therefore, in 2019 Nanning has failed to achieve substantial development, and the total score again declined to a low level.
3.2.4 Decreased Sharply Then Leveled Out: Lhasa and Lanzhou
Lanzhou and Lhasa are special cases. Their scores were trending downward during 2005–2007, but after 2008 they were relatively stable. In 2006, Lanzhou fell from a medium to a low level. In 2007, Lhasa dropped from a high to a medium level and then to a low level in 2008. However, in recent years, Lanzhou has been on a positive trend and surpassed Lhasa.
With the advent of the market economy, Lanzhou, which relied on policy inclination and the state-owned enterprise model, began to suffer. Until 2005, the total score was still at a medium level, which can be attributed to Lanzhou’s relatively strong economic base. Indexes such as GDPPC and PNAE were amongst the middle and upper rankings of the western provincial capitals. However, Lanzhou, an old industrial city, has been facing serious environmental pollution for a long time. It was only in 2013 that it was withdrawn from the ranks of the country’s top 10 air pollution cities. From another perspective, long-term dependence on heavy industry has also caused secondary industry to be affected by reducing excess capacity in recent years. Lanzhou’s GDPGR has been declining since 2011. In 2017, Lanzhou’s GDPGR was only 5.7%, down 62% since 2011. Since 2016, like Xi’an, the implementation of the Belt and Road initiative has ushered in new development opportunities for Lanzhou.
Located on the Tibetan plateau, Lhasa is a typical city with a sparsely populated surrounding area, and urbanization being mainly driven by the expansion of construction land. The central government has formulated a series of special support policies in Tibet as part of the strategy for the development of the western region. Lhasa has carried out many investment and construction projects, but in the face of population scarcity and other shortcomings, the development of urbanization is still weak.
Based on these four categories, there are two prominent problems with new urbanization in the western provincial capitals. The first is large regional differences, meaning uneven development. This is mainly reflected in the southwestern and northwestern regions, such as the differences between Yinchuan, Lanzhou, and Xining, all in the northwest, and Chengdu and Kunming, which are both in the southwest. However, the geographical location is not the only factor that causes the differences. For example, Xi’an and Guiyang show similar development of new urbanization because of their similar locations. The second is that, with time, the gap between them has not been significantly narrowed by improvements of new urbanization and there is also no trend of expansion. In the process of new urbanization, developing the economy, expanding urban land, increasing financial expenditure, and infrastructure construction have become the choices of most cities. However, these choices also lead to a series of problems; for example, the supply of public services public and healthcare in urban areas fail to fully match public demand, and the gap between urban and rural areas is still large. Furthermore, government expenditure can be the main driving force in, for instance, increasing greenery coverage, expanding built-up areas, and perfecting paved roads. However, because this lacks the element of industrial innovation, it is not a perfect system of social security. In addition, it does not unlock the vitality of the economy or reduce instability factors in society, and so the development of new urbanization will be unsustainable. Therefore, in the process of new urbanization, measures should be taken to free up the energy of the economy. Meanwhile, economic and social development must still be coordinated.
3.3 Evaluation of the Factors
3.3.1 Population Urbanization
The score for population urbanization, summed from all western provincial capitals, fluctuated slightly, but was similar to the total score (Figure 6A). It declined in 2007, 2010, 2013, and 2018 to varying degrees, mainly affected by the scores of NSCPTTP. In 2007, the expansion of college enrollment had not stopped but its speed in some cities such as Urumqi, Lhasa, and Guiyang was far less than the resident population growth because of its low appeal to talented people, and therefore these cities’ NSCPTTP decreased. In 2010, the Ministry of Education requested a slowdown in the pace of university enrollment expansion. The decline then spread to other western capital cities, except for Xi’an, and the score for population urbanization also showed a significant reduction for the first time. In 2012, the Ministry of Education introduced relevant policies to stabilize the scale of enrollment. Consequently, NSCPTTP stabilized after the decline in 2013, while the other two indicators, PURP and PNAE, did not fluctuate significantly until 2017. The score for population urbanization has also fluctuated significantly around 2017. In this year, the supply-side structural reform in agriculture kept promoting and got a transitory achievement. Those people from rural areas working in cities were willing to go back to do agricultural work. However, in 2018, farmers suffered from natural disasters and an international trade war, which led the number of farmers to drop again. It can be seen that the contraction of college enrollment has increased the pressure on western provincial capitals to attract talented people. The policies and environment for agriculture also influence people’s movement, both spatially and vocationally. Under such circumstances, the implementation of the new talent policy (rencaixinzheng) and the establishment of a stable environment for agricultural development attracted people who wished to settle down, which will undoubtedly become a measure for these cities ability to retain the quality of their population.
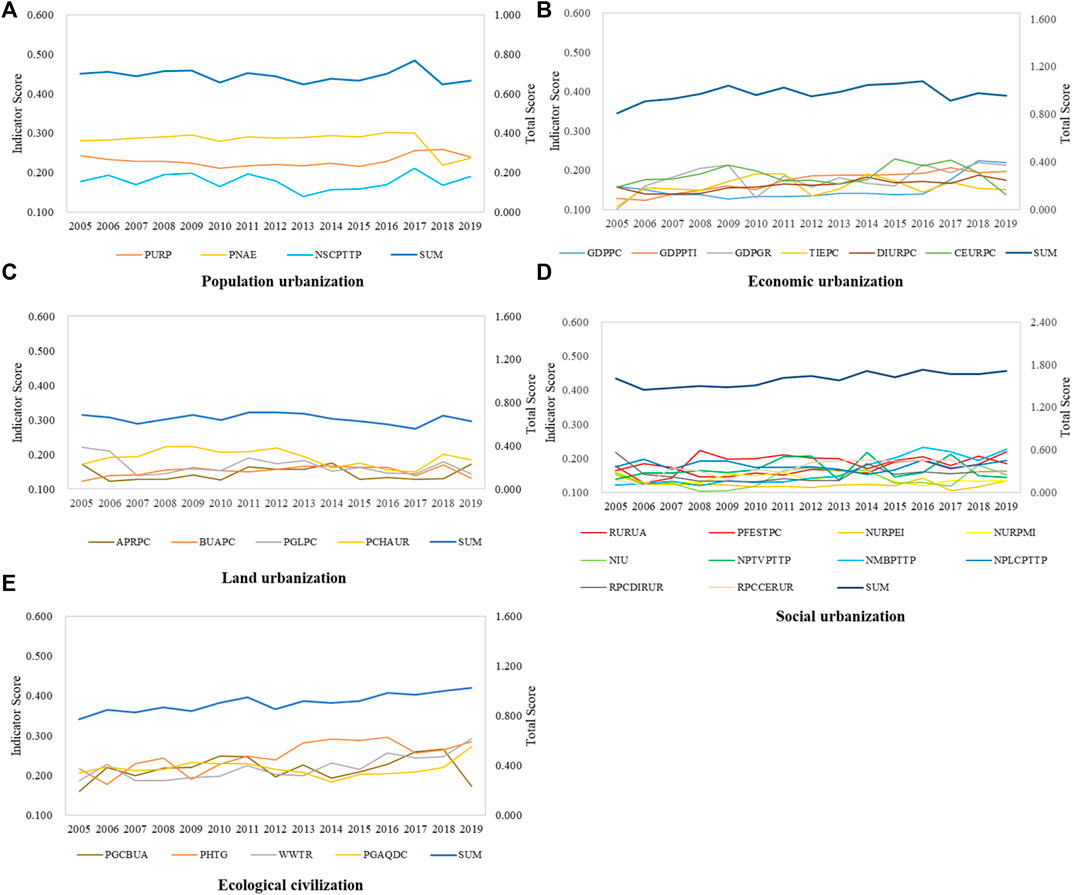
FIGURE 6. The scores of the factor layers of all cities from 2005 to 2019. (A) Population urbanization. (B) Economic urbanization. (C) Land urbanization. (D) Social urbanization. (E) Ecological civilization.
Comparing the conditions of population urbanization of each city (Figure 7A), the changes of both scores and rankings are relatively stable. Xi’an and Lanzhou have long been among the best, while Lhasa has always been at the bottom. Since 2009, Xi’an has dropped from first to second place, and Lanzhou ranks first instead. Since then, the score gap between the two cities has begun to expand. Lanzhou’s score keeps rising, while Xi’an shows a downward trend. In fact, the NSCPTTP of Lanzhou is better than other cities, due to the score line of college entrance examination (Gaokao) and the admissions policy. In addition to the high-intensity reconstruction of the old city and other urban construction in Lanzhou in recent years, the boundaries between urban and suburban are increasingly blurred. The statistics on urban population are not very accurate, and the population urbanization score also increased. Although Xi’an is one of the top science and education towns in China, and its number of colleges ranks third in China, it has long been limited by the level of local industrial development. As eastern coastal cities are becoming ever more attractive to those well-educated youngsters to dwell in, the population since 2016 has been fleeing fast from western China to eastern China. Lhasa is located in the southwestern frontier of China. The special history and poor natural resources have led to its weak economic base, sparse population, poor industrial structure, and low level of education. This is also one of the main reasons for the dilemma of urbanization development throughout Tibet.
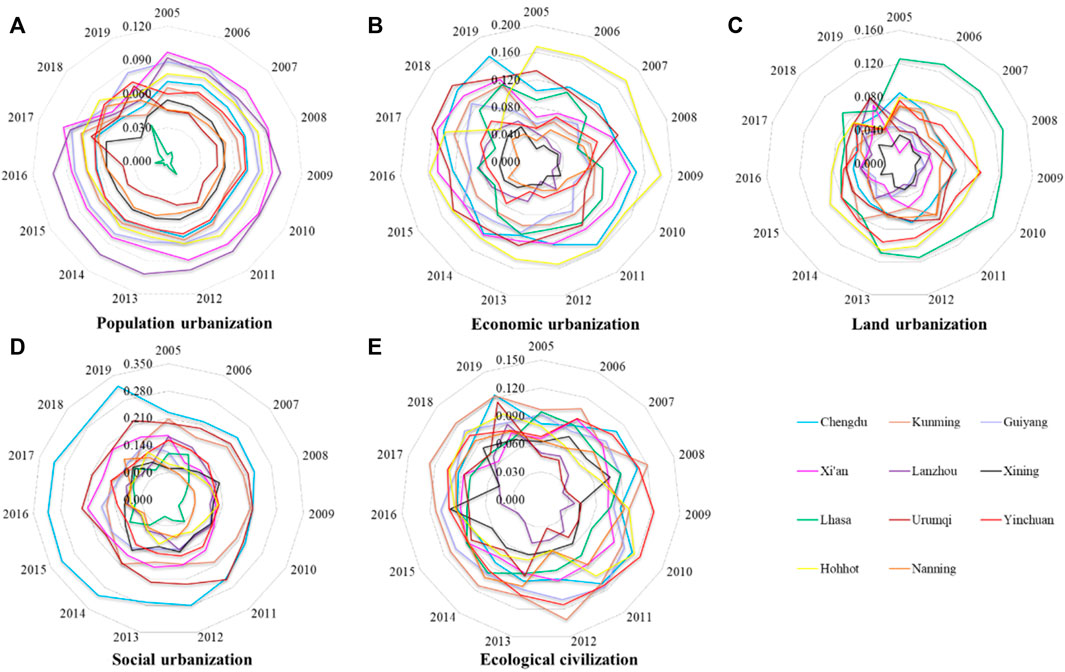
FIGURE 7. The single urbanization scores of each city from 2005 to 2019. (A) Population urbanization. (B) Economic urbanization. (C) Land urbanization. (D) Social urbanization. (E) Ecological civilization.
Judging from each index for each city (Figure 8A), in the last 15 years, the scores of PURP were fairly even except for Lhasa, Urumqi, and Nanning. Lhasa and Urumqi are located in the westernmost part of China. Compared with other western capital cities, they have shortcomings in natural resources and location, and are sparsely populated. Nanning is close to the Pearl River delta (zhusanjiao), with a large net population outflow. The increase of the resident urban population depended mainly on natural growth, college enrollment and urban expansion during the 12th Five-Year Plan period. The PNAE index increased slowly, which means that the employment in secondary and tertiary industries in each city was limited and the number of new jobs was small. The employment situation is very severe, and a change to the industrial structure needs to be implemented. The difference in the scores of NSCPTTP is relatively large, with Xining and Lhasa being the most pronounced. NSCPTTP has become an important index of the restriction to people’s development. This difference reflects the fact that the allocation of educational resources among cities is extremely uneven. Therefore, in the future, new urbanization processes need to pay more attention to the allocation of employment and educational resources.
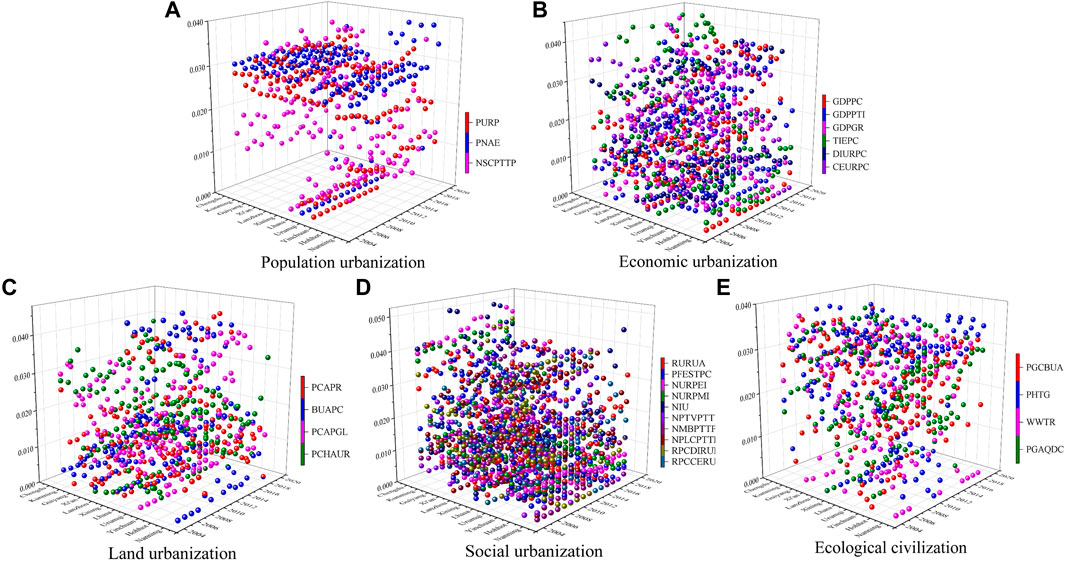
FIGURE 8. The scores of the factor layers of each city from 2005 to 2019. (A) Population urbanization. (B) Economic urbanization. (C) Land urbanization. (D) Social urbanization. (E) Ecological civilization.
3.3.2 Economic Urbanization
The score for economic urbanization, summed from all western provincial capitals, increased (Figure 6B). It rose rapidly, especially in the period of the 11th Five-Year Plan. After 2009, it fluctuated, mainly around 2010 and 2012, and then there were two declines. The trend of GDPGR in the 15 years is very similar to the total score for economic urbanization. It can be seen that GDPGR was an important factor affecting the overall score for economy, especially before 2011. From 2006 to 2010, with the national goal of doubling the GDPPC in 2010 compared with 2000, the development of the economy was rapid around the whole country, and the GDPGR of the western provincial capitals was generally over 12%. However, in 2010, the imbalance of GDPGR led to the first decline in the score for economic urbanization in the research period. In the 12th Five-Year Plan period, the focus of economic development had changed from speed to quality and the GDPGR of western provincial capitals slowed down. At the same time, the trend of TIEPC showed a strong match with the total score curve of economic urbanization in the later part of the period—this was a new stage of the economy, when expanding and opening up had become the choice of most cities. In 2012, as Lhasa vigorously promoted the construction of transport infrastructure, the total imports and exports increased by 154.7% over the previous year, while the majority of cities only grew by about 20%. This led to an imbalance of the TIEPC in 2012, and the scores of the other cities declined in succession. As a result, in 2012, the score for economic urbanization declined for the second time in the research period. There was a sharp drop of the total score in 2017, mainly because of the drop of the score of CEURPC. For instance, the typical city Hohhot in this year focused on major industry projects, thus the market for citizens to participate in was relatively ignored. Other cities were all alike, whose civilian area lagged behind a little.
Amongst the other indexes, the score for GDPPTI has increased year on year, meaning that the adjustment to the new economic structure has achieved notable results. There is no significant fluctuation in the score for GDPPC, suggesting that the quality of the economy needs to be improved. Although the score for DIURPC has increased each year, the score for CEURPC has not necessarily followed the same path. In particular, from 2009 to 2014, DIURPC rose while CEURPC declined, which has a lot to do with the Chinese emphasis on saving. The consumption potential was gradually realized with the advance of supply-side structural reform in 2015.
Comparing the scores and rankings of economic urbanization in each city (Figure 7B), it can be seen that there are large fluctuations in both. The development of the economy is not stable. Aside for Hohhot always being in the first place and Xining often in the last two places, the rankings of other cities have fluctuated to varying degrees. However, although Hohhot ranked high all the time, its score showed a marked downtrend. After reaching a peak in 2009 and 2016, the score began to decline rapidly, which was closely associated with the fact that Hohhot did not open up further to the world in the face of the new situation of declining GDPGR. The TIEPC rapidly declined. Beijing, Tianjin, and Hebei act as the open doors and carry out the trading functions. Even though Hohhot is close to a border (with Mongolia and Russia), the international market is small. Therefore, Hohhot has always focused on the development of its dairy industry, which has advantages and has promoted the rapid development of the economy. However, judging from Hohhot’s score in recent years, it is important to find new economic driving forces.
Xining is located in the northeast of Qinghai-Tibet plateau. Compared with other cities, the GDP and TIEPC are low. It seized the opportunity offered by the Belt and Road initiative during the 12th Five-Year Plan period. In the more recent years, the economic development of Xining has improved. However, it still lagged behind other cities. Consequently, despite the rising score, there was no obvious change of ranking.
Lanzhou and Nanning are also two cities with long-term low ranking and scoring. Lanzhou, an old industrial city, depends on heavy industries and has not developed lighter industries. During the 11th Five-Year Plan period, the economy became weaker, and the income gap between urban and rural residents continued to expand. In later years, through the transformation of the economy, the scores and ranking have increased. By comparison, the economy of Nanning was impacted in recent years by the phasing out of some enterprises in the process of promoting supply-side reform and the transformation of the economy. These enterprises were either excess capacity, high energy consumers, or serious polluters, such as thermal power plants and paper mills. After 2014, the GDPGR of Nanning slowed down, and was 3.5% lower than that of 2013. Hence, Nanning, whose economy was usually average amongst the western provincial capitals, has had a lower ranking in recent years, and has even been found at the bottom of list.
The annual variation of each index for each city was large (Figure 8B). The economic level between cities and the economic structure within cities were also uneven. The TIEPC and GDPPC are important causes of the economic difference of between cities. Taking Hohhot, a city in the best economic condition, and Urumqi with the highest score of TIEPC for many years as examples, Hohhot ranked first in economic status for a long time with higher scores of GDPPC, GDPPTI, DIURPC, and CEURPC, but the TIEPC was low and had a downward trend in later years. Urumqi is adjacent to eight countries and relies on its unique locational advantages, and optimizes a structure that is based on foreign trade and expanding exports. It depends on trade and tertiary industry to promote economic development. However, after 2012, the TIEPC in Urumqi also showed a downward trend, which led directly to the decline of its final score, as with Hohhot and other cities. Thus, the economic development of western provincial capitals is not stable and the quality needs to be improved, which is greatly influenced by the international market. Therefore, it is important to open up the energy of the economy by clarifying the city’s direction, optimizing the structure of trade and industry, strengthening technological innovation, and increasing the added value of its products. This will promote a change in economic growth from external demand-driven to domestic demand-driven, and reduce the dependence on the international market.
3.3.3 Land Urbanization
The score of land urbanization, summed from all western provincial capitals, fluctuated a little (Figure 6C). There were troughs in 2007, 2010, and 2017; and the score began to decline after 2011. After 2007, the construction speed of PCAPGL in most cities slowed down significantly, and the land urbanization score declined. In 2010, the first-tier cities such as Beijing, Shanghai, and Guangzhou, began to control their populations. Together with high housing prices and huge living pressure, this led to the increasing popularity of fleeing from big cities (taolibeishangguang) to second- and third-tier cities. However, the roads and houses of the western provincial capitals failed to respond to the increasing population in time, and therefore the score for land urbanization declined. In 2011, Nanning, Urumqi, and Kunming increased the development of green land. To relieve congestion, the PCAPR increased in most cities, as well as the total score. However, in 2013, urban developable land decreased and BUAPC, which had been on an upward trend, began to slowdown. The PCHAUR score also declined. Some problems typical of cities gradually appeared and the score for land urbanization began to decline.
Looking at the scores for each city for each year (Figure 7C), Lhasa scored the highest during the period of 2005–2013, and was significantly higher than the other cities before 2010. However, after two sharp declines in 2011 and 2014, the gap between Lhasa and the other cities narrowed. Lhasa eventually fell from first place in 2014–2016, and was replaced by Hohhot. Construction in Lhasa is associated with state aid. In 2005, Lhasa took advantage of the opportunity of the 40th anniversary of the establishment of the Tibet Autonomous Region to strengthen environmental governance and develop road reconstruction. After the opening of the Qinghai-Tibet Railway in 2006, a new upsurge of construction in Lhasa was initiated. However, the process of urbanization has caused green spaces to face considerable challenges. In addition, the poor natural conditions on the plateau restrict the growth of greenery. Since 2011, the score for PCAPGL has dropped sharply. During the 11th Five-Year Plan period, the state invested 1.5 billion yuan to build more than 14 thousand turnover houses (zhouzhuanfang) in Tibet. At the same time, it carried out the reform and monetization of the housing system, effectively promoting the process of housing commercialization. This alleviated the housing shortage and the PCHAUR of Lhasa was best in the western provincial capitals for a long time. However, housing construction slowed down after 2014, and the score of the corresponding index also dropped rapidly. Lhasa fell to fourth place in 2014, while Hohhot rose to first because of the rapid growth of PCAPGL after the completion of the ecological control project on the slopes of Daqing mountain, the construction of new parks, and roads renovation.
Over the 15-year period, Xi’an, Xining, Guiyang, and Lanzhou were in the last four places for a long time. What these four cities have in common is that the scores of BUAPC and PCAPR are low. In 2008, the fourth overall city plan of Xi’an was approved. A number of roads were built and opened to traffic, and the land urbanization score increased. In 2010, the Greater Xi’an Plan (daxi’anguihua) was issued, and Xi’an’s score increased in the subsequent years, but the ranking did not change significantly. In Guiyang, because of the low density of roads and over-centralized function of the main city, congestion has always been a major problem and its PCAPR came later than the other western provincial capitals. The expansion of Lanzhou and Xining is restricted by topographic conditions, and the urban form is in a line from east to west. In particular, Xining, located in the Qinghai-Tibet Plateau, has a small population and underwent late development. Consequently, the score for economic urbanization was low and there was little demand for urban expansion. However, inadequate transportation facilities also hindered the development of Xining to a certain extent. In 2012, urban planning achieved a major breakthrough. A number of construction projects were implemented, especially urban greening and optimization of the road network, so scores and rankings improved.
The scores of each index for each city (Figure 8C) show that PCAPGs are low with slight differences, but trends are widely varied. The other three factors are similar in most cities, which means that they are faced with similar problems with land, and the PCAPR and BUAPC are the main reasons for the difference in land scores. Although these capitals are expanding their city boundaries, as well as building transportation and housing facilities, they still fail to respond well to the changes in population. Moreover, as a result of expansion, green land has been occupied and the PCAPGL needs to be increased.
3.3.4 Social Urbanization
The social urbanization score, made by summing up the scores of all provincial capitals in the west, is the most volatile of all factors, but the general trend is upward (Figure 6D). In 2006, the score declined sharply, and then entered an upward phase. In 2013 and 2015, the score fell twice. In 2006, “social security” replaced “reemployment of laid-off stuff” for the first time, and became the primary social problem concerning urban residents. Faced with the new situation, Urumqi substantially increased its expenditure on social security and Chengdu launched a pilot project of medical insurance for urban residents, as well as a new endowment insurance for peasants. However, there are some cities that have not taken relevant measures. This imbalance of development has led to the first decline in scores. In 2013 and 2015, the main reason for the decline was the uneven growth of public transport vehicles in different cities.
Comparing the scores of each city for each year (Figure 7D), it can be seen that there is a distinct rule of differentiation. From 2005 to 2011, Chengdu, Kunming, and Urumqi were significantly higher than the other cities. From 2012, Chengdu continued to score higher, then went far ahead of the other cities. Chengdu has always scored higher because its NURPEI and NURPMI were not only significantly higher than the other cities but also higher than its other indexes. As early as 1986, Chengdu began reform of its social security system, and since 2009 it has taken the lead in the integration of urban and rural medical insurance. Chengdu has increased financial expenditure on public services, especially in the 12th and 13th Five-Year Plan period, whilst maintaining sustained and healthy economic growth. It has realized the equalization of employment, social security, and public services between urban and rural areas, and has built a unified urban–rural social insurance system with multi-level security standards. In recent years, the scores of RPCDIRUR and RPCCERUR in Chengdu have both increased, meaning that the gap between income and expenditure of urban and rural residents has further narrowed. This happened because the employment priority strategy had been implemented, so that urban and rural workers in the city could enjoy employment opportunities fairly and public employment services equally. According to the latest new urbanization plan of Chengdu (2015–2020), it will gradually promote the coverage of basic public services from the registered population to the resident population, and the level of public services will be further improved.
Urumqi was in the top three in social scores for the 15 years. Generally speaking, Urumqi has a higher score in NMBPTTP, which is closely related to the reform of its healthcare system and the improvement of primary healthcare services in recent years. However, the scores and rankings of Kunming are not as good as those of Chengdu and Urumqi, and the downward trend is clear after 2012. On the one hand, the RURUA in Kunming increased that year, while on the other hand the RURUA declined in Lanzhou, Lhasa, and other cities due to exporting surplus labor in urban and rural areas.
Lhasa and Nanning have been last in the ranking of social urbanization for a long time. In Lhasa, except for the relatively high scores of PFESTPC, RURUA, and public service facilities such as NPTVPTTP, NMBPTTP, and NPLCPTTP, the scores of the other indexes are very low. The development of an imbalance between urban and rural areas and the imperfection of the social security system are key problems of new urbanization in Lhasa. The population is small and the level of economy is low, both for historical reasons and due to poor natural resources. Moreover, the NURPEI, NURPMI, and NIU are lower than the other western provincial capitals. In 2006, Lhasa scored higher and ranked 6th, then fell back to 11th, and even to last in 2008–2014. In 2015, the ranking rose again to 8th but then returned to the last place in 2016. In 2006, Lhasa increased its financial expenditure on science and technology and brought in advanced technology. Subsequently, the expenditure of other cities also increased rapidly, and Lhasa’s advantage was no longer clear, so ranking fell. The large income gap between urban and rural residents means that Lhasa has always scored low. This was also an important issue facing Nanning. In addition, the supply of public service facilities, including medical beds and public transportation vehicles, was insufficient, which is also a key reason for the difficulty of urbanization of rural migrants in Nanning. Therefore, in the 15-year period, Nanning’s score barely rose.
Judging from the scores of each index for each city (Figure 8D), the NURPEI, NURPMI, NIU, NMBPTTP, NPLCPTTP, and RPCDIRUR are significantly different amongst the cities, becoming the main indicators that affect the residents’ quality of life and the integration of urban and rural areas in the process of new urbanization. Taking NURPEI and NURPMI as examples, Chengdu and Xi’an scored higher than the other cities. At the same time, these two cities ranked higher in economic urbanization. Therefore, in the western provincial capitals the regional differences of social urbanization are large and are affected by the economy. Consequently, the quality of life of most urban residents needs to be improved.
3.3.5 Ecological Civilization
The ecological civilization score, summed from all western provincial capitals, is relatively stable but rose sharply in 2010 (Figure 6E). After 2010, the score was around 0.900, and before that the score was about 0.800. In 2010, the final year of the 11th Five-Year Plan, environmental protection in China had made positive progress. The PGCBUA in Kunming, Hohhot, and Yinchuan steadily increased. The PHTG in Urumqi, Guiyang, and Yinchuan increased. The WWTR in Nanning improved and the air quality in most cities was maintained in a better state. Although the score entered a new phase after 2010, it fluctuated a lot after 2012, which showed that although the achievements during the 11th Five-Year Plan laid the foundation for ecological development, environmental protection was still facing great pressure. The problem of green space occupied by infrastructure was becoming increasingly prominent, and the pressure to maintain rapid economic growth while taking into account energy conservation and emission reduction was increasing. Therefore, environmental protection needs to be the key concern in the process of new urbanization of the western provincial capitals.
By comparing the scores of each city in the 15 years (Figure 7E), it was found that the fluctuation is far less than that of the ranking. Relatively speaking, the score of Kunming is better, ranking first in most years, but in 2007 it dropped dramatically to fifth. From 2009 to 2011, its ranking declined again. In 2007, Chengdu rose from the fifth to first, and Yinchuan and Guiyang ranked first in 2009–2010 and 2011, respectively. They then hovered in the upper and middle reaches of the rankings. Kunming has good air pollution diffusion conditions due to its special climate and geographical conditions, and the PGAQDC was significantly higher than that of other cities. In 2007, PHTG, WWTR, and total score decreased because Dongchuan district was not counted for these two indicators in the statistical yearbook of that year. At the end of 2008, the local government relocated from the main city to Chenggong county, which resulted in a sharp expansion of the county’s population. However, facilities to treat garbage were seriously insufficient and PHTG decreased significantly. Projects for garbage treatment began construction, and by 2012 a number had been completed, including Chenggong district, which was established in 2011. Therefore, the PHTG increased significantly. This is also an important reason why the ranking of Kunming declined in the period 2009–2011 but returned to the top in 2012.
As for the other three cities ranking first in a few years, Chengdu had built the largest waste incineration power plant in southwest China in 2007, the PHTG went up a lot, and the total score increased accordingly. However, since 2012, the number of motor vehicles in Chengdu has risen rapidly. There is no doubt that congestion in the central city will aggravate air pollution. Dusty weather, straw burning, and pollution control are important reasons for the fluctuations in air quality every year, and are also important factors for the fluctuations of the total score and ranking of Chengdu. Yinchuan ranked first not only in 2009–2010, but also ranked well during 2006–2013. This is closely bound up with the vigorous implementation of landscaping projects that have been carried out since 2006. In 2009, Yinchuan won the title of “model city of greening,” then “model city of environmental protection” in 2012. Since 2014, Yinchuan has carried out the project of the blue sky for creating the card of “Green Water, Blue Sky, Bright Yinchuan,” and the PGAQDC has increased. However, most cities are aware of the importance of preventing air pollution, and Yinchuan has not achieved outstanding results. Consequently, its ranking has declined in recent years. In 2011, Guiyang built a large-scale plant for sewage treatment, and their capacity increased significantly. Consequently, ranking and scoring also rose to first place. Although Guiyang was soon overtaken by other cities, it remained among the higher rankings.
Lanzhou is the least volatile of the cities, ranking in the last but one or the last one for many years. Urumqi also ranked in the last three places from 2005 to 2012. Since 2013, rankings and scores have risen. Lanzhou, a coal-based industrial city, faced serious air pollution, having made great efforts at improvement since the 1990s but achieving little. After 2012, the campaign on air pollution was launched. Through legislative means, the adjustment of energy use structure and the elimination of primitive production methods have been steadily promoted and the air quality has improved. However, due to the closure of the landfill in Lujiadagou, Fulongping, Chengguan district in 2012, the garbage problem became increasingly serious. The PHTG was then about 20%, which is far more that of other cities. Although the PGCBUA in Lanzhou has increased a lot with the development of the western region in China since 2000, landscape greening has grown only slowly, ineffectively and with a limited structure because of financial and natural resources restrictions. In recent years, to alleviate the increasingly serious congestion problem, the government has mainly concentrated on the improvement of the infrastructure, such as paved roads, causing considerable damage to green land. The combination of these reasons means that Lanzhou’s ecological civilization score has gradually declined. Similarly, the PGCBUA and PGAQDC of Urumqi were also low in its early years. Later, the city strengthened control of air pollution by promoting energy conservation and emission reduction, raising 12.1 billion yuan in 2012 to change fuel from coal to gas (meigaiqi) for all heating facilities in the central city. Improving air quality is a task with a long payback time, and the score of PGAQDC has increased but not significantly in Urumqi. Thus, Urumqi’s rise in overall score is mainly due to the increase of PGCBUA in recent years.
From the above, we can see that the large fluctuation of the cities’ ranking is caused by different policies in different time periods, and the ecological civilization score in most cities is not very different. In recent years, responding to central government’s request to build an ecological civilization, most cities chosen to build garbage facilities, sewage treatment works, and to increase the area of green land. Although importance is also attached to the control of air pollution, the scores fluctuated widely between years, meaning that environmental protection is still facing great pressure.
The index scores for each city (Figure 8E) show that WWTR and PGAQDC have the greatest difference amongst cities and became the two most influential factors of ecological civilization scores. As for the PHTG, the technology and means are now relatively mature. From 2013 to 2016, the cities’ PHTG scores (except Lanzhou) were relatively balanced. The PGCBUA increased in all cities during the 11th Five-Year Plan period, but in recent years there was a downward trend. In the process of new urbanization, each city should take the construction of green towns as a breakthrough point, improving the treatment of sewage and controlling air pollution, so as to promote sustainability.
3.4 Correlation of Each Factor
The total score for a factor layer for each year is calculated by summing up all cities, so 15 values were obtained for each factor layer. To ensure that the results are scientific and the correct correlation type is carried out, it is first necessary to carry out a normality test on the 15 data points. Because the sample size of each factor is small, the Shapiro-Wilk test was selected. When p > 0.05, the data shows normal distribution. The results (Table 2) show that the data for each factor are normally distributed. To analyze the correlation between every two factors more accurately and eliminate interference from other factors, partial correlation analysis was finally selected for this paper. When there are several control variables, the partial correlation coefficient is called a multiple order partial correlation coefficient. When the number of control variables is zero, the partial correlation coefficient is called the zero-order partial or Pearson correlation coefficient.
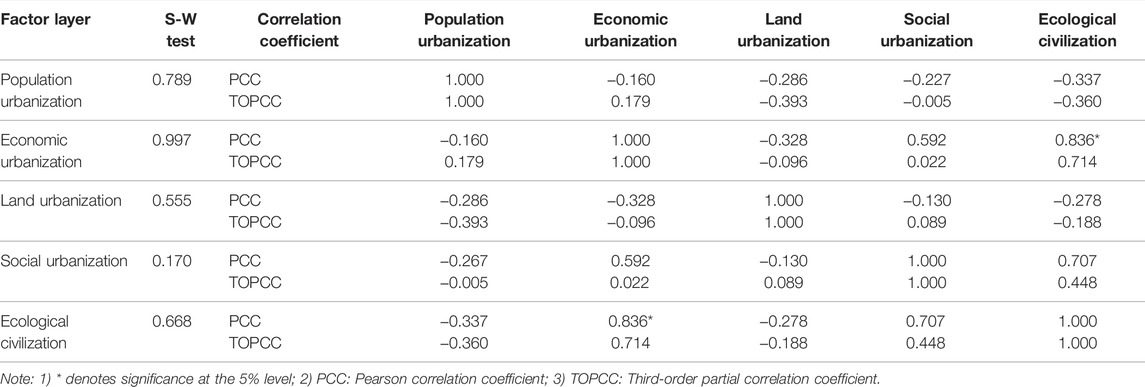
TABLE 2. Correlation coefficients of each factor layer.
The results show (Table 2) that, with or without control variables, only economic urbanization and ecological civilization have significant correlation. When there is no control variable, the correlation coefficient is 0.836, and there is a strong positive correlation between economy and ecology. When the other three factors are taken as control variables, the pure correlation coefficient is 0.714 yet non-significant, which shows that the correlation between the two will disappear due to the influence of population, land, and society. In a similar way to developed countries, China’s early economic construction has often paid the price of destroying the environment, which was not only the result of China’s own development strategy but also related to developed countries’ competition for natural resources and industrial transfer. Severe environmental problems show that the old approach of pollution followed by treatment is not sustainable—it is essential to protect the environment and develop an ecologically sound society. In 1983, China established environmental protection as its basic national policy. In 1996, sustainable development was clearly designated as an important strategy for modernization. In the twenty-first century, President Jiang Zemin stressed the harmonious development of humans and nature (2001) and President Hu Jintao emphasized resource saving and an environment-friendly society (2005). The 17th CPC National Congress took ecological development as its new goal to build an overall wealthy society. The 18th CPC National Congress made a further decision to vigorously promote the development of an ecological society and drew up a grand blueprint for it from 10 aspects. In the latest era of building Chinese socialism, President Xi pointed out in the report of 19th National Congress that we should speed up the reform of system for developing an ecological civilization and build a beautiful China. It can be seen that in recent decades, China has constantly placed ecological development in the same important position as economic construction. The practice of western provincial capital cities in the recent 15-year period shows that China has moved away from the common development of environment and economy. Lucid waters, lush mountains, and invaluable assets7 are by no means opposites. Correctly handling the relationship between the two can help promote both and achieve coordinated development. The key lies in people and ideas.
Amongst other unrelated factor layers, the fact that population urbanization is not related to land urbanization deserves special attention. It can be seen that the expansion of capital cities in western China cannot respond well to population changes. In China’s overall land use planning over the years, the supply of land is mainly determined by local demand. Many local governments, out of considerations of self-interest, have constantly tried to have the highest amount of construction land. Too much attention has been paid to the expansion of cities, while the concentration of the urban population has been ignored. Therefore, urbanization of the population is often accompanied by faster urbanization of land. Lhasa is the most obvious example. Although its population urbanization has long been ranked last in the western provincial capitals, the land urbanization has long been ranked first. At the same time, in the process of rapid land urbanization, green land in urban areas was sacrificed and the urban ecosystem was destroyed. Therefore, western provincial capitals should make more intensive and economical use of urban land in the next few years.
4 Discussion and Conclusion
Urbanization is an important driving force for the healthy development of the national economy. The massive migration brought about by urbanization will satisfy the demand for urban labor and stimulate the demand market. At the same time, it will drive the adjustment and development of urban industries and feed agriculture, so as to achieve coordinated urban and rural development and social equality. Throughout the history of China’s urbanization development, the speed of urbanization has increased rapidly. However, while the urbanization rate has increased significantly, the problems of urbanization and the ecological environment have emerged concurrently, and these problems have expanded in scope and deepened their impact, posing potential threats to people’s lives, economic health, social harmony, and ecological security. In essence, behind the increase in the speed of urbanization development is the neglect of the quality of development. The strength of big cities is weak, the transformation of small towns is difficult, and the gap between cities is expanding. Although the score of indicators has increased, the urbanization quality does not match the increasing speed. China’s urbanization process still lags behind the developed countries in the world. Even though the overall situation is relatively healthy, local problems should not be ignored. In the new era, coping with the crisis brought about by historical development and exploring a new sustainable development path in which cities and nature can coexist in harmony are inevitable choices to improve China’s international status.
Scholars have proven that new urbanization is a project that influences not only population transfer but also an area’s total environmental quality, land use, industry agglomeration, and many other aspects (Wu et al., 2022; Zhang et al., 2022; Zhao and Wang, 2022). These specific aspects are the manifestation of new urbanization. Moreover, the construction status of these aspects may promote or hinder the process of new urbanization. This research reveals that the new urbanization construction level is in a rising trend, but is not stable in the long term. The unstable status of new urbanization is often caused by uncoordinated development of different factors. An ideal status of new urbanization requires the inner parts to be in a symbiotic state (Chu, 2020; Dijkstra et al., 2021). Accordingly, focusing on realizing coordinated development of each factor would be vital to improve the quality of new urbanization. Besides, in the future, blind rapid expansion of cities would not match the aim of sustainable development. Demolition, expansion, and projects should be implemented based on the objective needs of a city instead of improving the government’s performance. Another easily overlooked problem is the tense relationship between city and rural areas. The realization of new urbanization should not mean the disappearance of rural areas (Lang et al., 2016). It is necessary to take into account the creation and improvement of rural infrastructure, living conditions, and production conditions in the process of new urbanization. Hence, farmers could have more work and life options.
Due to constraints of time and energy, the period of this study is relatively short, and the years of 10th Five-Year Plan period have not been completely analyzed. Data limitation meant that this paper only selected the western provincial capitals for study because these capitals concentrate most of the economic, cultural, and political functions of the province. There is still a big gap between other prefecture-level cities and the provincial capital within the province. Future research can consider expanding the time period and increasing urban samples, so as to more objectively reflect the dynamic development process of new urbanization in the western region.
This paper has constructed an evaluation system for new urbanization that is based on the connotation of new urbanization, existing research results, and the key goals set out in NNUP. We then objectively evaluated new urbanization in 11 western provincial capitals from 2005 to 2019. The conclusions are as follows:
(1) Economy, land, and society are the factors that have had significant influence on the new urbanization in past years. Among them, the impact of economic urbanization weakened after 2012, and the impact of land urbanization has since increased. This means that in the latest stage of the economy, land expansion has become another driving force of new urbanization, following economic development.
(2) The level of new urbanization of all the western provincial capitals is rising in waves. It has achieved “great-leap-forward” status in and after the 12th Five-Year Plan period. The focus has shifted from the contradiction between economic development and ecological protection, to the coordinated development of the economy and society. Cities are still in an exploratory phase due to the fluctuating status. The level of new urbanization in most cities is constantly improving, but the gap has not been significantly narrowed with the passage of time and regional development disparity still exists. The economy is the main driving force of most cities. However, the endogenous power of the economy in most cities is still being tapped, and social security and public services are still improving.
(3) Among the factor layers, the score of social urbanization fluctuated the most. Social development between cities and the allocation of public resources within cities are both imbalances. The scores of ecological civilization and economic urbanization showed an upward trend. However, these cities need to reduce the dependence on the international market and adopt more active policies to cope with environmental protection pressure. The scores of population urbanization and land urbanization have been relatively stable in past years. With the influx of the rural population into cities, areas of built-up land and paved roads are still increasing. However, rapid land urbanization has also damaged the urban ecosystem to a certain extent, and cities should move towards intensive and economical use of land.
(4) Through the correlation of various factors, it was found that the western provincial capitals have already embarked on a road of economic-ecological co-development. However, it is worth noting that although the score of economic urbanization rose, it is not stable and is greatly influenced by the international market. In addition, ecological development is facing greater pressure. Unfortunately, there is an imbalance between other single factors. The correlation results show that urban land expansion fails to respond well to population increase. These results indicate that development within cities is very uncoordinated and this phenomenon has also existed in cities for a long time. Therefore, approaches to coordinating development within cities are also a problem worthy of future attention.
Data Availability Statement
The original contributions presented in the study are included in the article/supplementary material, further inquiries can be directed to the corresponding author.
Author Contributions
YZ: Initiated the study concept, wrote the original draft, validated the data and supervised the whole research process. MD: Initiated the study concept, proposed the methodology, conducted data analysis and interpreted the data, writing—review and editing. QW: Proposed the methodology, conducted data analysis and interpreted the data, writing—review and editing. QZ: Writing—review and editing, visualized the manuscript. YR: Visualized the manuscript. All authors have read and agreed to the published version of the manuscript.
Funding
This research was funded by Natural Science Foundation of Inner Mongolia (No. 2020MS04016), Fuzhou University Talent Introduction Project (No. XRC-22026) and the Humanities and Social Science Research Foundation of Ministry of Education of China (No. 21YJC840028).
Conflict of Interest
The authors declare that the research was conducted in the absence of any commercial or financial relationships that could be construed as a potential conflict of interest.
Publisher’s Note
All claims expressed in this article are solely those of the authors and do not necessarily represent those of their affiliated organizations, or those of the publisher, the editors and the reviewers. Any product that may be evaluated in this article, or claim that may be made by its manufacturer, is not guaranteed or endorsed by the publisher.
Footnotes
1The division of China into three parts, namely the east, central and western regions, began in 1986 with the Seventh Five-Year Plan for National Economic and Social Development of the People’s Republic of China. The division was a function of policy, not administration or geography. So, the provinces in the eastern, central, and western regions have so far changed according to the extent of policy adjustment. As the eastern region benefited earliest from the opening-up policy, its level of economic activity is relatively high. The central region is less developed, and the western area is least developed.
2From 2014 to 2016, the state listed two provinces (Anhui and Jiangsu) and 246 cities (towns) as pilot projects in three batches, making them the pioneers in implementing the new urbanization strategy. Batch one: http://www.ndrc.gov.cn/zcfb/zcfbtz/201502/t20150204_663078.html; Batch two: http://www.ndrc.gov.cn/gzdt/201511/t20151127_759921.html; Batch three: http://www.gov.cn/xinwen/2016-12/07/content_5144553.htm#1.
3The term “megalopolis” comes from the Notice of the State Council on the classification of urban scales, and is used for cities with more than 10 million residents in an urban situation. Source: http://www.gov.cn/zhengce/content/2014-11/20/content_9225.htm.
4Chengdu is committed to build a sustainable world city in this new plan. Source: http://www.chengdu.gov.cn/chengdu/home/2017-12/12/content_ba147a549692440bb298ae661f0ffe0b.shtml.
5The Silk Road Economic Belt and the 21st-Century Maritime Silk Road, or the Belt and Road for short, was unveiled by Chinese President Xi in 2013. Source: https://www.yidaiyilu.gov.cn/.
6To participate in the selection of National Civilized City, National Health City and National Food Safety Demonstration City. Source: http://www.huhhot.gov.cn/zwgk/zfxxgkzl/zfxxgkmlx/201809/t20180918_340954.html.
7Lucid waters and lush mountains are invaluable assets was put forward by Comrade Xi Jinping in 2005, when he was the Secretary of the Zhejiang Provincial Party Committee. In October 2017, the report of the Nineteenth National Congress emphasized that China advocates harmonious coexistence between humans and nature, and sticks to the path of green and sustainable development; that is, to establish and practice this conviction. Source: http://cpc.people.com.cn/GB/67481/412700/.
References
Antrop, M. (2004). Landscape Change and the Urbanization Process in Europe. Landsc. Urban Plan. 67 (1-4), 9–26. doi:10.1016/S0169-2046(03)00026-4
Bai, Y., Deng, X., Jiang, S., Zhang, Q., and Wang, Z. (2018). Exploring the Relationship Between Urbanization and Urban Eco-Efficiency: Evidence from Prefecture-Level Cities in China. J. Clean. Prod. 195, 1487–1496. doi:10.1016/j.jclepro.2017.11.115
Chen, C., LeGates, R., Zhao, M., and Chen, H. (2018). The Changing Rural-Urban Divide in China's Megacities. Cities 81, 81–90. doi:10.1016/j.cities.2018.03.017
Chen, M., Liu, W., Lu, D., Chen, H., and Ye, C. (2018). Progress of China's New-type Urbanization Construction since 2014: A Preliminary Assessment. Cities 78, 180–193. doi:10.1016/j.cities.2018.02.012
Chen, M., Liu, W., and Lu, D. (2016). Challenges and the Way Forward in China's New-type Urbanization. Land Use Policy 55, 334–339. doi:10.1016/j.landusepol.2015.07.025
Chen, M., Gong, Y., Lu, D., Ye, C., Jin, H., and Lu, Y. (2019). Impact of Urbanization on CO2 Emissions and Energy Consumption Structure: A Panel Data Analysis for Chinese Prefecture-Level Cities. Struct. Change. Econ. Dyn. 8049, 1107–9119. doi:10.1016/j.landusepol.2018.09.031
Chu, Y. (2020). China's New Urbanization Plan: Progress and Structural Constraints. Cities 103, 102736. doi:10.1016/j.cities.2020.102736
Cui, X., Fang, C., Liu, H., and Liu, X. (2019). Assessing Sustainability of Urbanization by a Coordinated Development Index for an Urbanization-Resources-Environment Complex System: A Case Study of Jing-Jin-Ji Region, China. Ecol. Indic. 96 (1), 383–391. doi:10.1016/j.ecolind.2018.09.009
Deng, X., and Bai, X. (2014). Sustainable Urbanization in Western China. Environ. Sci. Policy Sustain. Dev. 56 (3), 12–24. doi:10.1080/00139157.2014.901836
Dijkstra, L., Florczyk, A. J., Freire, S., Kemper, T., Melchiorri, M., Pesaresi, M., et al. (2021). Applying the Degree of Urbanisation to the Globe: A New Harmonised Definition Reveals a Different Picture of Global Urbanisation. J. Urban Econ. 125, 103312. doi:10.1016/j.jue.2020.103312
Fang, C., Ma, H., and Wang, J. (2015). A Regional Categorization for “New-type Urbanization” in China. Plos One 10 (8), e0134253. doi:10.1371/journal.pone.0134253
Feng, W., Liu, Y., and Qu, L. (2019). Effect of Land-Centered Urbanization on Rural Development: A Regional Analysis in China. Land Use Policy 87, 104072. doi:10.1016/j.landusepol.2019.104072
Friedmann, J. (2006). Four Theses in the Study of China's Urbanization. Int. J. Urban Reg. Res. 30 (2), 440–451. doi:10.1111/j.1468-2427.2006.00671.x
Friedmann, J., and Wolf, G. (1982). World City Formation: An Agenda for Research and Action. Int. J. Urban Regional Res. 6 (3), 309–344. doi:10.1111/j.1468-2427.1982.tb00384.x
Griffiths, M., and Schiavone, M. (2016). China’s New Urbanisation Plan 2014–20. China Rep. 52 (2), 73–91. doi:10.1177/0009445515627034
Gu, C., Wu, L., and Cook, L. (2012). Progress in Research on Chinese Urbanization. Front. Archit. Res. 1 (2), 101–149. doi:10.1016/j.foar.2012.02.013
Guan, X., Wei, H., Lu, S., Dai, Q., and Su, H. (2018). Assessment on the Urbanization Strategy in China: Achievements, Challenges and Reflections. Habitat Int. 71, 97–109. doi:10.1016/j.habitatint.2017.11.009
Hertzler, J. O. (1956). The Crisis in World Population: A Sociological Examination, with Special Reference to the Underdeveloped Areas. Lincoln: University of Nebraska Press.
Hu, B., and Chen, C. (2015). New Urbanisation under Globalisation and the Social Implications in China. Asia Pac. Policy Stud. 2 (1), 34–43. doi:10.1002/app5.68
Kim, J. U. (2015). A Bumpy Road to Cities: Analysis of the Obstacles and Limits of China's New Urbanization. Pac. Focus 30 (3), 372–388. doi:10.1111/pafo.12057
Kuznets, S. (1971). Economic Ggrowth of Nations: Total Output and Production Structure. Cambridge, Mass: Belknap Press of Harvard University Press.
Kuznets, S. (1966). Modern Economic Growth: Rate, Structure, and Spread. New Haven: Yale University Press.
Lang, W., Chen, T., and Li, X. (2016). A New Style of Urbanization in China: Transformation of Urban Rural Communities. Habitat Int. 55, 1–9. doi:10.1016/j.habitatint.2015.10.009
Li, H., and Martin, D. J. (2017). Citizen Participation in China's Eco-City Development. Will 'New-type Urbanization' Generate a Breakthrough in Realizing it? J. Clean. Prod. 162, 1085–1094. doi:10.1016/j.jclepro.2017.06.121
Liang, W., and Yang, M. (2019). Urbanization, Economic Growth and Environmental Pollution: Evidence from China. Sustain. Comput. Inf. Syst. 21, 1–9. doi:10.1016/j.suscom.2018.11.007
Lu, S., Guan, X., He, C., and Zhang, J. (2014). Spatio-Temporal Patterns and Policy Implications of Urban Land Expansion in Metropolitan Areas: A Case Study of Wuhan Urban Agglomeration, Central China. Sustainability 6 (8), 4723–4748. doi:10.3390/su6084723
Luo, W., Bai, H., Jing, Q., Liu, T., and Xu, H. (2018). Urbanization-induced Ecological Degradation in Midwestern China: An Analysis Based on an Improved Ecological Footprint Model. Resour. Conservation Recycl. 137, 113–125. doi:10.1016/j.resconrec.2018.05.015
Ma, L., Cheng, W., and Qi, J. (2018). Coordinated Evaluation and Development Model of Oasis Urbanization from the Perspective of New Urbanization: A Case Study in Shandan County of Hexi Corridor, China. Sustain. Cities Soc. 39, 78–92. doi:10.1016/j.scs.2018.02.007
Mendras, H. (1970). The Vanishing Peasant: Innovation and Change in French Agriculture. Cambridge, Mass: MIT Press.
Shang, J., Wang, Z., Li, L., Chen, Y., and Li, P. (2018). A Study on the Correlation Between Technology Innovation and the New-type Urbanization in Shaanxi Province. Technol. Forecast. Soc. Change 135, 266–273. doi:10.1016/j.techfore.2018.04.029
Tan, M. H. (2017). Uneven Growth of Urban Clusters in Megaregions and its Policy Implications for New Urbanization in China. Land Use Policy 66, 72–79. doi:10.1016/j.landusepol.2017.04.032
Tang, G., and Song, J. (2006). Comparison of Slope Classification Methods in Slope Mapping from DEMs. J. Soil Water Conservation 20 (2), 157–160. (in Chinese).
Taylor, J. R. (2015). The China Dream Is an Urban Dream: Assessing the CPC's National New- Type Urbanization Plan. J. Chin. Polit. Sci. 20 (2), 107–120. doi:10.1007/s11366-015-9341-7
Wang, X., Hui, E. C.-M., Choguill, C., and Jia, S. (2015). The New Urbanization Policy in China: Which Way Forward? Habitat Int. 47, 279–284. doi:10.1016/j.habitatint.2015.02.001
Wei, C., Wang, Z., Lan, X., Zhang, H., and Fan, M. (2018). The Spatial-Temporal Characteristics and Dilemmas of Sustainable Urbanization in China: A New Perspective Based on the Concept of Five-In-One. Sustainability 10 (12), 4733. doi:10.3390/su10124733
Wu, X., Huang, Y., and Gao, J. (2022). Impact of Industrial Agglomeration on New-type Urbanization: Evidence from Pearl River Delta Urban Agglomeration of China. Int. Rev. Econ. Finance 77, 312–325. doi:10.1016/j.iref.2021.10.002
Wu, Y., Luo, J., Zhang, X., and Skitmore, M. (2016). Urban Growth Dilemmas and Solutions in China: Looking Forward to 2030. Habitat Int. 56, 42–51. doi:10.1016/j.habitatint.2016.04.004
Yang, J., Wu, T., and Gong, P. (2017). Implementation of China’s New Urbanization Strategy Requires New Thinking. Sci. Bull. 66 (2), 81–82. doi:10.1016/j.scib.2016.12.013
Yang, W., and Lu, X. (2016). An Assessment of China’s New Urbanization Level - Based on the Vertical and Horizontal Levels of the Grade Method. Econ. Horizons 18 (3), 199–211.
Zhan, D., Kwan, M. P., Zhang, W., Fan, J., Yu, J., Dang, Y., et al. (2018). Assessment and Determinants of Satisfaction with Urban Livability in China. Cities 79, 92–101. doi:10.1016/j.cities.2018.02.025
Zhang, M., Tan, S., Zhang, Y., He, J., and Ni, Q. (2022). Does Land Ttransfer Promote the Development of New-type Urbanization? New Evidence from Urban Agglomerations in the Middle Reaches of the Yangtze River. Ecol. Indic. 136, 108705. doi:10.1016/j.ecolind.2022.108705
Zhang, W., and Wang, M. (2018). Spatial-temporal Characteristics and Determinants of Land Urbanization Quality in China: Evidence from 285 Prefecture-Level Cities. Sustain. Cities Soc. 38, 70–79. doi:10.1016/j.scs.2017.12.011
Zhang, W., and Xu, H. (2017). Effects of Land Urbanization and Land Finance on Carbon Emissions: A Panel Data Analysis for Chinese Provinces. Land Use Policy 63, 493–500. doi:10.1016/j.landusepol.2017.02.006
Zhao, C., and Wang, B. (2022). How Does New-type Urbanization Affect Air Pollution? Empirical Evidence Based on Spatial Spillover Effect and Spatial Durbin Model. Environ. Int. 165, 107304. doi:10.1016/j.envint.2022.107304
Zhao, J., Ji, G., Tian, Y., Chen, Y., and Wang, Z. (2018). Environmental Vulnerability Assessment for Mainland China Based on Entropy Method. Ecol. Indic. 91, 410–422. doi:10.1016/j.ecolind.2018.04.016
Keywords: new urbanization, evolution characteristics, entropy method, quality evaluation, western provincial capital cities
Citation: Zou Y, Deng M, Wang Q, Zhang Q and Rong Y (2022) Evolution Characteristics of New Urbanization in the Provincial Capital Cities of Western China. Front. Environ. Sci. 10:926444. doi: 10.3389/fenvs.2022.926444
Received: 22 April 2022; Accepted: 15 June 2022;
Published: 11 August 2022.
Edited by:
Chen Zeng, Huazhong Agricultural University, ChinaReviewed by:
Tomiwa Sunday Adebayo, Cyprus International University, TurkeyQiao Yu, Chongqing Jiaotong University, China
Copyright © 2022 Zou, Deng, Wang, Zhang and Rong. This is an open-access article distributed under the terms of the Creative Commons Attribution License (CC BY). The use, distribution or reproduction in other forums is permitted, provided the original author(s) and the copyright owner(s) are credited and that the original publication in this journal is cited, in accordance with accepted academic practice. No use, distribution or reproduction is permitted which does not comply with these terms.
*Correspondence: Yafeng Zou, em91eWFmZW5nMjAwM0BzaW5hLmNvbQ==