 Min An
 Xiaokang Huang
 Limin Jia
 Jin Huang
94% of researchers rate our articles as excellent or good
Learn more about the work of our research integrity team to safeguard the quality of each article we publish.
Find out more
ORIGINAL RESEARCH article
Front. Environ. Sci., 18 October 2022
Sec. Environmental Economics and Management
Volume 10 - 2022 | https://doi.org/10.3389/fenvs.2022.925176
Water resources serve as the foundation for high-quality urban development. As water pollution has become a major impediment to high-quality urban development, solving the problem of urban water pollution is critical for attaining high-quality urban growth. This research analyzes both point and non-point sources of pollution and constructs an urban water pollution simulation system model from four subsystems: population, industry, cultivated land, and livestock and poultry. This study selects 2020 as the base year and the current year’s development situation as the base scenario and then sets the other five simulation scenarios according to the research area development plan. Using Yichang data in this model, the research simulated and predicted the total amount of urban COD pollution under different scenarios. The results show that: 1) The difference between the simulation results of the constructed urban water pollution system and the 2010–2020 historical data is within 10%, which shows that the constructed system can analyze the reality. 2) Under the benchmark scenario, from 2020–2030, the total amount of urban COD shows a downward trend. The pollution from population and livestock subsystems are reduced by 20.20 and 35.29%, respectively, the industrial subsystem is increased by 40.60%, and the cultivated land subsystem is increased by 0.56%. 3) Compared with the benchmark scenario, the urban COD pollution in five scenarios has been reduced by 8,400, 42,000, 21,700, 100, and 72,300 tons, respectively, among which water pollution control measures in scenario five have the best effect. 4) Only by comprehensively controlling all pollution sources (scenario 5) can the total amount of urban COD pollution be controlled within 450,000 tons in 2030, which will be reduced by over 20% compared with 2020. An urban water pollution system can be used to simulate the source composition and total change amount of water pollution in the process of urban development, which is of great significance for government departments to provide accurate counter-measures for urban water pollution control and management decisions.
As necessities of urban production and life, water resources will cause serious harm to urban development once polluted. With the rapid development of urbanization and industrialization in China, municipal domestic sewage and industrial wastewater are threatening the high-quality development of Chinese cities (Shi et al., 2021). In addition, a large amount of agricultural wastes and livestock manure also pose a major threat to the water environment (Ongley et al., 2010). Thus, it is of great significance to construct a scientific and reasonable urban water pollution system for high-quality urban development.
Usually, point and non-point source pollution together cause water resources pollution. Point source pollution refers to pollution sources with fixed discharge points and mostly centrally discharged urban domestic sewage and industrial wastewater (Zhang et al., 2019). Non-point source pollution refers to the large-area pollution to the ecological environment caused by the loss of chemical fertilizers, pesticides, and improperly treated livestock manure (Xiang et al., 2017). Point source and non-point source pollution constitute the urban water pollution system, which contains many influencing factors. Because of the interaction of various factors through correlation and feedback in the process of dynamic change, the urban water pollution system presents complex characteristics. Opening the black box of urban water pollution and finding the causes of water pollution from the perspective of society, economy, population, and industry is an important prerequisite for government departments to form accurate water pollution control strategies and feasible management decisions.
Urban water pollution system includes the impact of urban point source pollution on water pollution. Domestic sewage and population size have a significant positive fixed effect on point sewage discharge (Fan and Fang, 2020). Population density has an important impact on the ecological environment (An et al., 2022). The centralized control of environmental sanitation and moderate population agglomeration is conducive to the treatment of domestic sewage (Garrett et al., 2017; Zhao et al., 2018). In terms of industrial wastewater, industrial development is the main driving factor (Bu et al., 2021), while in the process of industrial development, industrial enterprise agglomeration also occurs (Ellison et al., 2010). Due to certain negative externalities, industrial agglomeration also causes environmental pollution (Liu et al., 2017). To sum up, the point source water pollution impacts by the factors related with population and industry. The current research only describes from one aspect without considering factors’ correlation.
High-quality urban development also needs to strengthen the control of non-point pollution. The substantial increase of cultivated land, which makes a significant increased use of chemical fertilizers and pesticides, together with the rapid development of livestock and poultry breeding, mainly causes agricultural non-point pollution (Michalak et al., 2013). In order to achieve the purpose of ecological environment protection, the resource utilization of livestock and poultry manure is an important way. However, the separation between planting and aquaculture in China is severe at present. Unused livestock and poultry manure, incompletely degraded chemical fertilizer, unreasonable use of lost agricultural chemicals (Li et al., 2017), and discarded or burned straw after production (Seglah et al., 2020) have caused mass pollution to cultivated land. Most of the existing non-point pollution studies are aimed at cultivated land or livestock and poultry unilaterally and do not comprehensively consider the impact of their connection on ecological environment protection. Rebuilding the relationship between planting and breeding cycle is the key to solve the problem of agricultural non-point source pollution (Perez-Gutierrez and Kumar, 2019; Zhang et al., 2019; Carrer et al., 2020).
In terms of urban water pollution research methods, the early water pollution research used principal component analysis (Tripathi and Singal, 2019), Delphi (Filyushkina et al., 2018), set pair analysis (Cui, Feng, Jin, & Liu, 2018), data envelopment analysis (Guo et al., 2022), and other methods to calculate the constructed water pollution evaluation index system. However, the abovementioned methods are static computation, which can only evaluate the pollution efficiency of water resources, but cannot predict external water pollution. The static computation of water pollution has been difficult to meet the needs of urban high-quality development for water pollution control as the research has progressed. The method of water pollution simulation and prediction has gradually become a trend. Its main research methods include random forest algorithm (Wang et al., 2021), machine learning models (Chen et al., 2020), the SWAT model (Wang et al., 2018), the dynamic optimization model (Hao et al., 2021), and system dynamics (Naderi et al., 2021). Among them, random forest algorithm and machine learning models can only predict water pollution. The SWAT model has high requirements for natural data and cannot complete the socio-economic policy theory for water pollution treatment. The dynamic optimization model can predict the maximum revenue, which cannot be simulated for different scenarios. Compared with other methods, system dynamics (SD) (Forrester, 1958) has the characteristics of high-order, nonlinear, and multivariable. It is not only dynamic but also predictable and can adjust variables at any time to observe changes in the model. This method can better grasp various feedback relationships of the urban water pollution system and also simulate different development schemes to select the optimal scheme for high-quality urban development. At present, there are many research on the prediction and simulation of urban water resources management using the system dynamics model. For example, Kotir et al. (2016) established the relationship among population, water resources, and agricultural production to optimize the allocation of water resources. However, due to the complexity of urban water pollution system, most of the existing studies only consider partial urban water pollution systems either a point or non-point source, few studies consider the regulation of point and non-point source at the same time.
From the abovementioned analysis, this study found two research gaps. 1) The subsystem for predicting urban water pollution is imperfect. 2) A suitable method for simulation and prediction has not been found. To fill these research gaps, this study first considers point and non-point pollution comprehensively, constructs the simulation model of the urban water pollution system from subsystems of population, industry, planting, and livestock and poultry . Second, this study uses SD to calculate and estimate the future trend of urban water pollution according to urban water resources conditions and development planning objectives.
The urban water pollution system model examines the relationships among urban population, industrial wastewater, livestock and poultry breeding, agricultural planting, and water pollution. Domestic sewage and industrial sewage together constitute point pollution, which is mainly affected by urban population, industrial sewage volume, and water pollution treatment capacity of the study area. Agricultural production, livestock, and poultry breeding together make up non-point pollution. The pollution generated from agricultural production includes the pollution of pesticides and fertilizers used in the planting process and straw produced by crops. Livestock and poultry breeding is mainly affected by the number of various livestock and poultry breeding. From the abovementioned analysis, the SD model is constructed to form an urban water pollution model with four subsystems, including human, industrial, livestock, and farmland subsystem. The causal loop diagram of the system is shown in Figure 1. “+” indicates a positive feedback and “-” means a negative feedback. In a complete loop, if the feedback loop contains an even number of negative causal chains, the polarity is positive; and if the feedback loop contains an odd number of negative causal chains, its polarity is negative (Sterman, 2000).
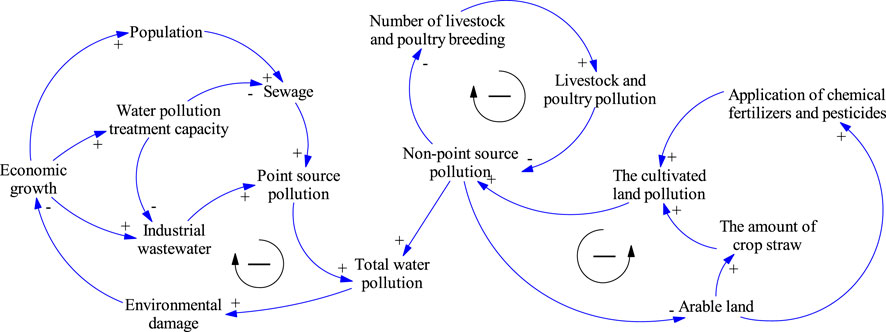
FIGURE 1. Causal loop diagram of the urban water pollution system.
The spatial boundary of the SD model is Yichang Administrative Region (including urban and rural areas). Chemical oxygen demand (COD) refers to the oxidation dose consumed when a certain strong oxidant is used to treat water samples under certain conditions. The greater the concentration of COD, the more serious the pollution of organic matter in the water. The COD concentration is widely used as an important index to quantitatively study the degree of water pollution (Hou et al., 2021). As the main statistical data of water pollution discharge, it is an important evaluation index of water pollution in China (Chen et al., 2022). Therefore, the urban water pollution system is constructed with the total generation and emission of COD as the calculation target. The model is shown in Figure 2. The relevant data in the model are described in Table 1.
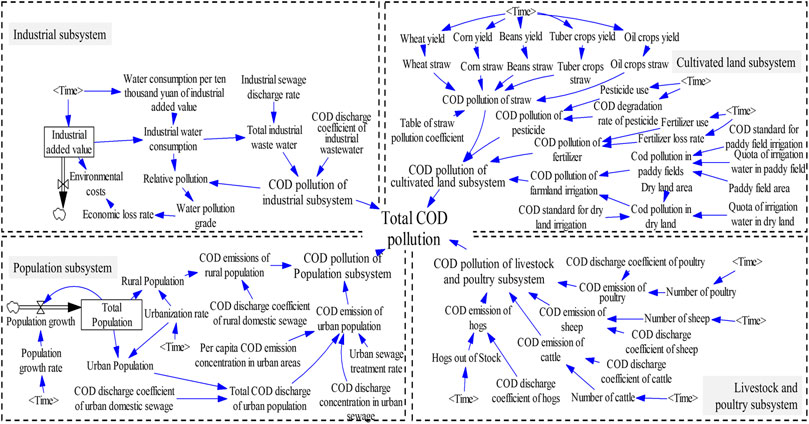
FIGURE 2. Simulation model of the urban water pollution system.
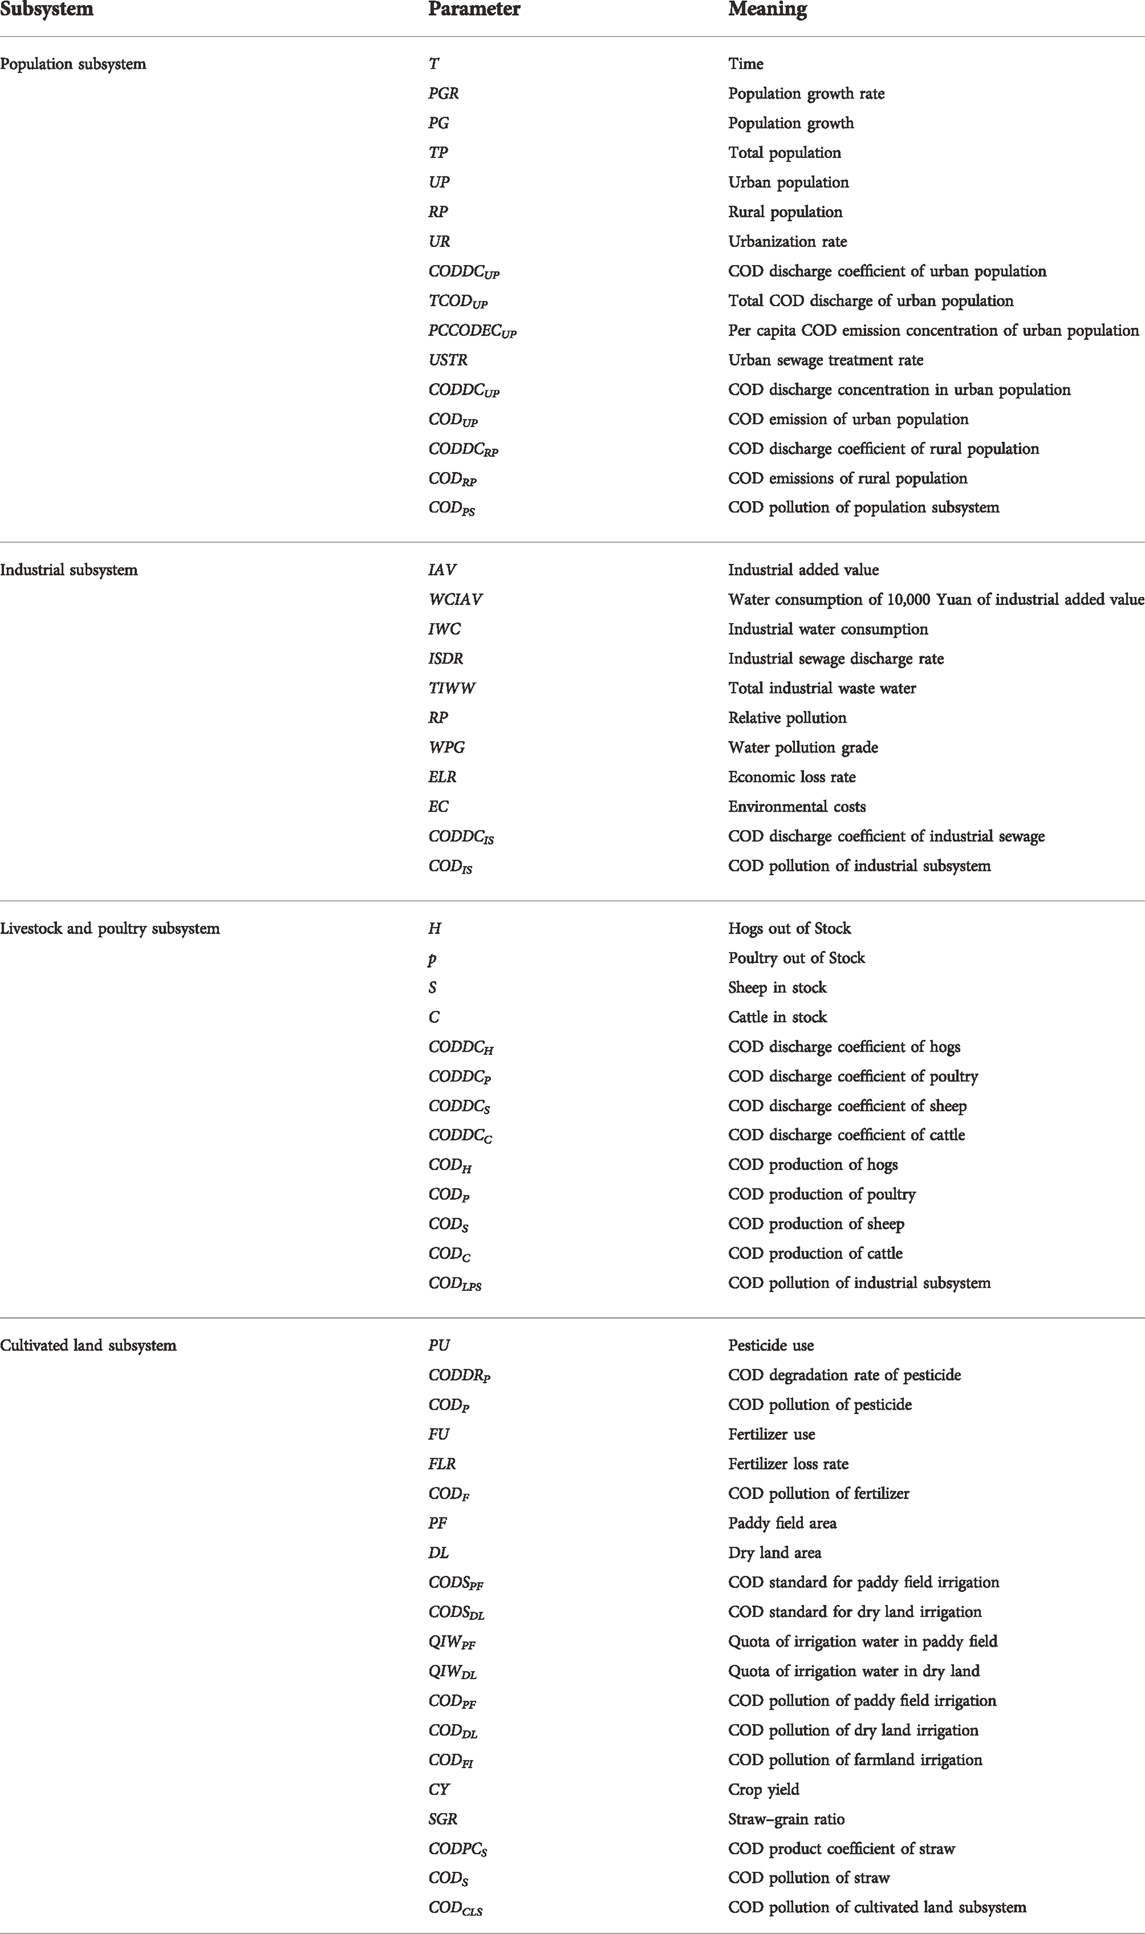
TABLE 1. Main equations.
COD pollution of the population subsystem consists of COD discharge of domestic sewage and rural domestic sewage after treatment by sewage treatment facilities. The relevant equation is as follows:
where TP (total population) is the accumulation result of initial population and PG (population growth) over time; UP (urban population) and RP (rural population) are determined according to UR (urbanization rate); UR is realized by table function; rural/urban population, the number of days a year, and rural/urban sewage discharge coefficient (COD) decided to rural/urban sewage COD emissions; TCODUP (Total COD discharge of urban population) constitutes CODUP after treatment by sewage treatment facilities; CODUP and CODRP constitute CODPS (COD pollution of population subsystem).
COD pollution of the industrial subsystem is mainly determined by the industrial output value and sewage treatment capacity of the city. At the same time, the environmental cost caused by pollution will also have a restraining effect on the industrial added value. The relevant equation is as follows:
where IWC (industrial water consumption) is jointly determined by IAV (industrial added value) and WCIAV (water consumption of 10,000 Yuan of industrial added value); IWC and ISDR (industrial sewage discharge rate) determine TIWW (total industrial waste water).
The traditional national economic accounting system does not account for the value loss of water resource pollution, and the value loss of water resource cannot be reflected in industrial production. According to the relative pollution degree, the specific water pollution grade will affect the industrial economic loss rate in reverse. Thus, the environmental cost is subtracted as the cost of the industrial process. The relevant equation is as follows:
After TIWW is treated by sewage treatment facilities and reaches CODDCIS (COD discharge coefficient of industrial sewage), CODIS (COD pollution of the industrial subsystem) is obtained.
COD pollution of the livestock and poultry subsystem is summarized by the COD pollution amount of each livestock and poultry, and the COD pollution amount of each livestock and poultry is jointly determined by the annual feeding quantity, COD product coefficient, and feeding cycle. The relevant equation is as follows:
where cattle and sheep feeding cycle is more than 1 year (record 365days), the end of the stock as the amount of feed. The feeding cycle of live hogs is 199 days and that of poultry is 210 days, and the amount of corral (cage) is defined as the amount of feed.
COD pollution of the cultivated land subsystem is summarized by the pollution amount of fertilizer, pesticide, sewage irrigation, and straw. The relevant equation is as follows:
The non-degradation of pesticides causes water pollution. The pollution of chemical fertilizer is due to the loss of effective components of chemical fertilizer. Arable land can cause water pollution during irrigation. Different crop straw also produces a certain amount of water pollution, all of which constitute the pollution source of the cultivated land subsystem.
Yichang is the dividing point of the middle and upper reaches of the Yangtze River, with abundant total water resources (20.345 billion cubic meters in 2020, ranking third in the province). In terms of economic development, Yichang has entered the city of high-quality development stage. In 2021, the GDP growth rate reached 16.8%, ranking first in China. The total economic output reached 502.269 billion Yuan, ranking 54 in China and third in the Hubei province. The economic size and development speed of Yichang has become a representative city that relies on water resources to develop to high quality. As the water security source in the middle and lower reaches of the Yangtze River and an important ecological barrier in the Three Gorges Reservoir area is met, Yichang undertakes an important task in water environment protection.
However, Yichang still faces problems such as large discharge of water pollutants and serious rural water environment pollution. As shown in Figure 3, in 2020, Yichang’s industrial wastewater discharge reached 206.12 million tons/year, ranking first in Hubei province. Yichang has a permanent population of 3.90 million, ranking sixth in Hubei province. While its domestic water consumption rate is 40.3% higher than the provincial average 38.7%. In particular, the per capita daily water consumption in rural life is as high as 148 liters, ranking first in Hubei province.
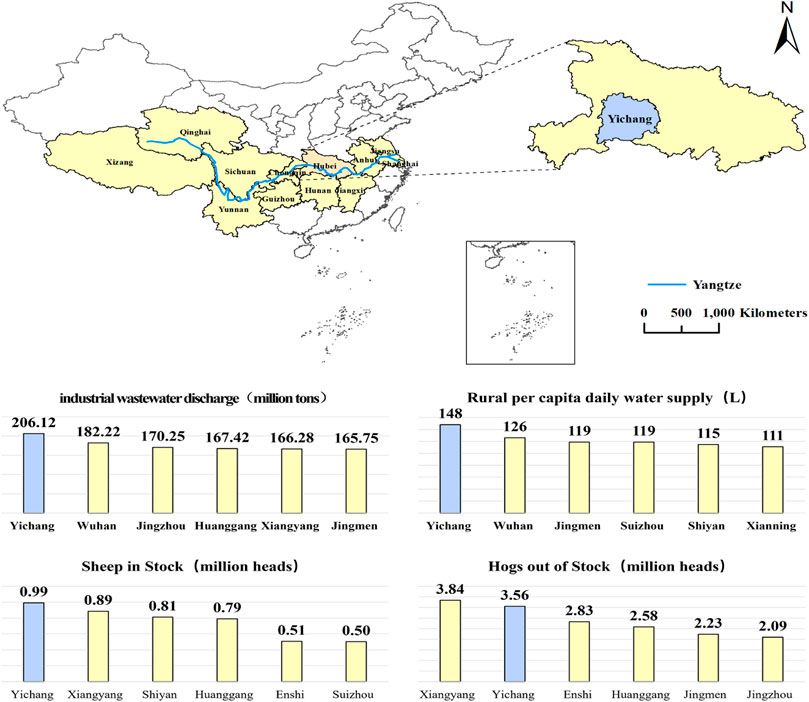
FIGURE 3. Geographical location of Yichang in Hubei province.
In addition, Yichang also had numerous livestock and poultry breeding. In 2020, 3.56 million hogs out of stock at year end was estimated to be sold, ranking second in Hubei province, and 0.99 million sheep in stock, ranking first in Hubei province (see Figure 3). Agricultural solid waste and excessive application of pesticides and fertilizers have also brought serious non-point pollution to Yichang. Taking Yichang as an example, this study constructs an urban water pollution control simulation model to provide a theoretical basis for relevant government departments to plan scientific and reasonable water pollution control policies. The data are shown in Figure 3.
Relevant data from 2011–2020 in this study are mainly from the “Yichang Statistical Yearbook,” “Urban and Rural Construction Statistical Yearbook,” “Pollutant Discharge Standard of Urban Sewage Treatment Plant,” “Agricultural Water Quota of Hubei Province Part 1: Farmland Irrigation Water Quota,” and “Farmland Irrigation Water Quality Standard.” Some data come from relevant literature and new detail (see Table 2).
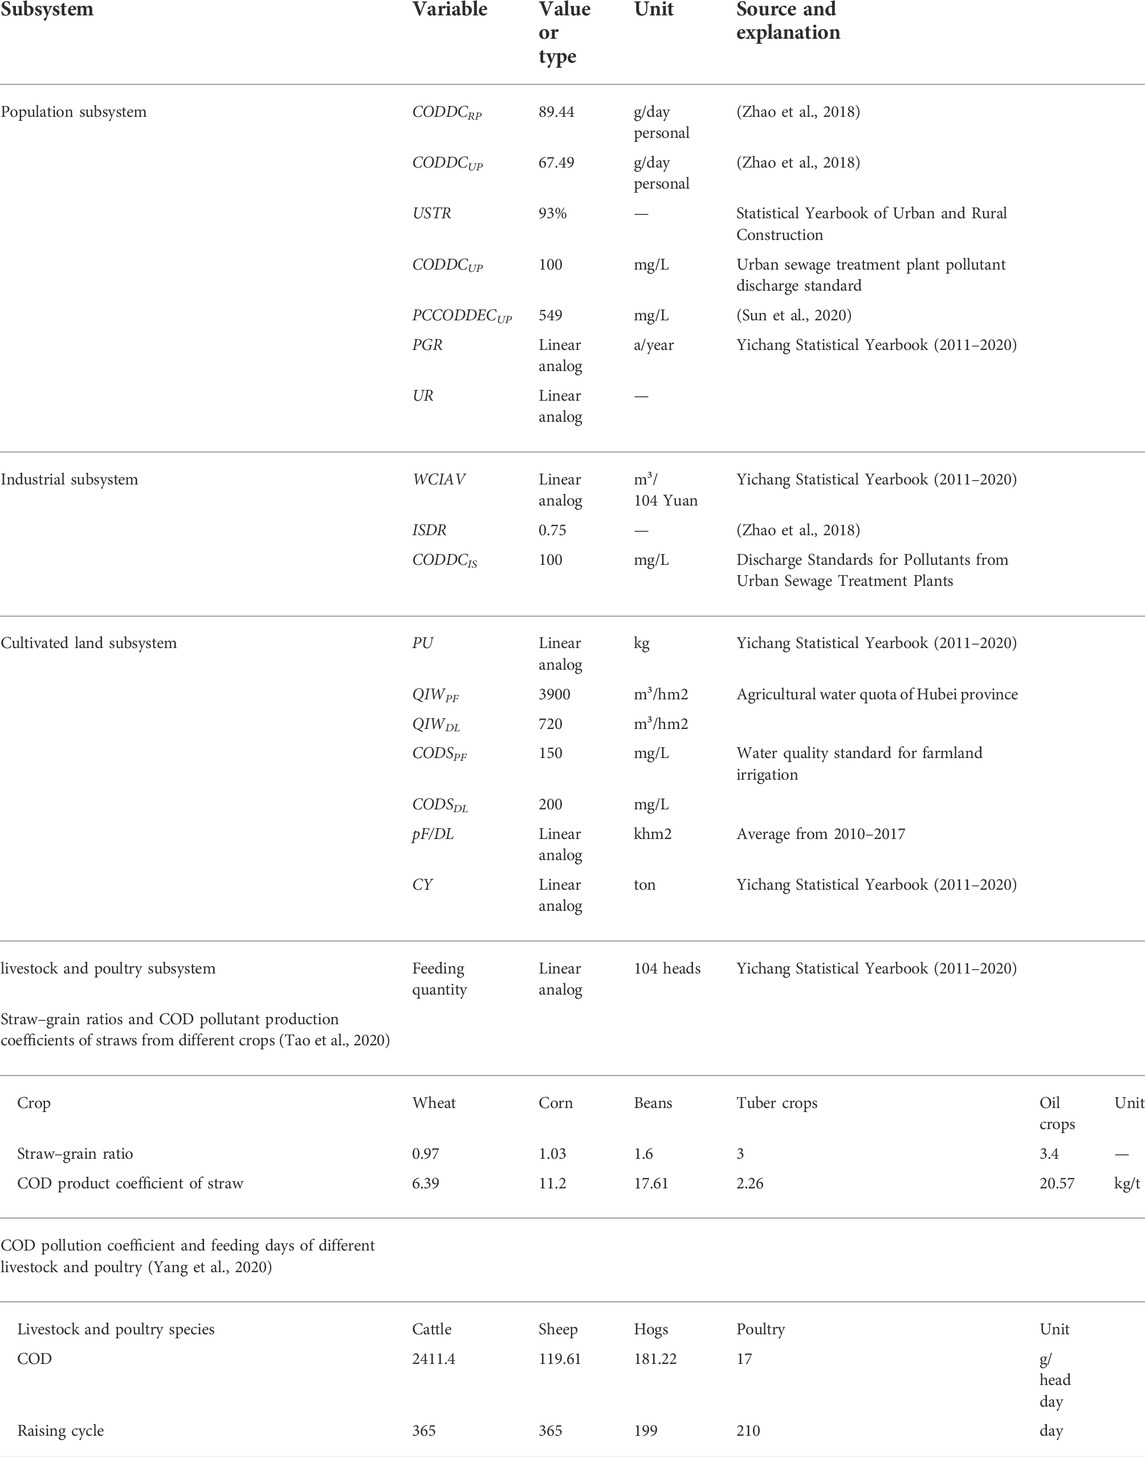
TABLE 2. Data type and source.
Based on 2010–2019 years of historical data, models are debugged and verified using VENSIM software. The time range of multiscenario simulation is set as 2010–2030, the simulation step is 1 year, and the verification period is 2010–2019. System parameter setting methods mainly include 1) average value based on historical data, such as water consumption of 10,000 Yuan industrial added value and irrigation water quota; 2) linear regression, such as industrial added value, total urban population, and urbanization rate; and 3) table function, such as livestock and poultry breeding quantity, crop yield, paddy field dry land area, and other nonlinear variables. This study performed data prediction first, and then filled as table function in the model.
Based on the current situation of Yichang’s economic and social development, the long-term goals in the Yichang’s Urban Master Plan (2011–2030), Yichang’s Environmental Master Plan (2013–2030), and Yichang’s Soil Pollution Control and Remediation Plan (2018–2030) are selected as the targets of each scenario. The year 2030 was used as the end of the simulation. The urban water pollution system model is used to simulate water pollution under different scenarios and constraints. This study selects the variables that can vary in the model to simulate the scales of urbanization progress, industrial pollution control technology, scientific agriculture production, and livestock and poultry breeding. In the model, Yichang city’s relevant historical data and the development forecast of existing policies are set as the basic scenario, which was used as the reference group of other scenarios to explore the impact of different water pollution control policies on Yichang urban water pollution. Scenario 1: increases the urbanization rate and strengthen the urban sewage treatment capacity. Scenario 2: the water consumption of 10,000 Yuan of industrial added value is reduced year by year. Scenario 3: reduce pesticide use to scientific agricultural production. Scenario 4: reduce the annual breeding quantity of all kinds of livestock and poultry. Scenario 5: overlay all changes of the four forward scenarios (see Table 3).
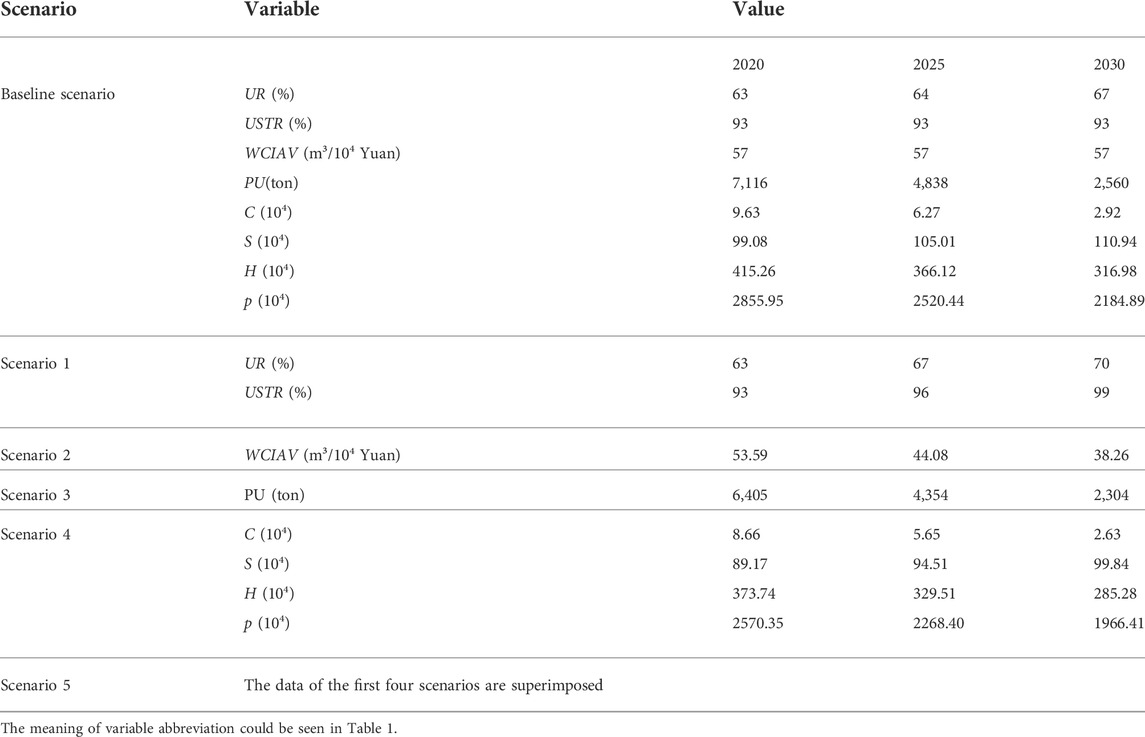
TABLE 3. Parameter of different scenarios.
In order to ensure the simulation validity of the system dynamics model, this study refer to the comparison of variables such as industrial added value, urbanization rate, and urban population from 2010– 2019 to test the simulation error of historical data (|simulated value - real value|/real value). The results are presented in Table 4.
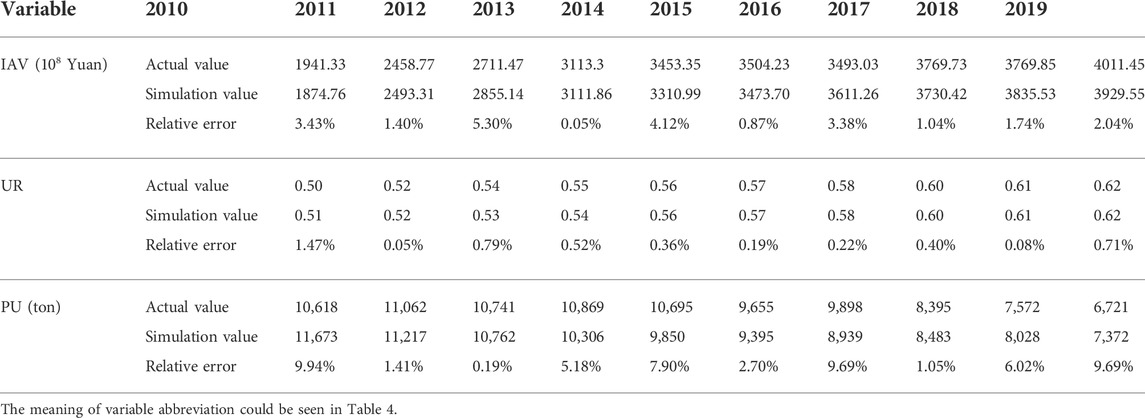
TABLE 4. Error rate of the simulation value and historical data in 2010–2019.
Table 4 shows that the errors of the simulated data are within 10%. The fitting degree between the simulated value and the actual value is good, indicating that the model can reflect changes of the real historical state.
The composition of urban COD pollution under the benchmark scenario is shown in Figure 4.
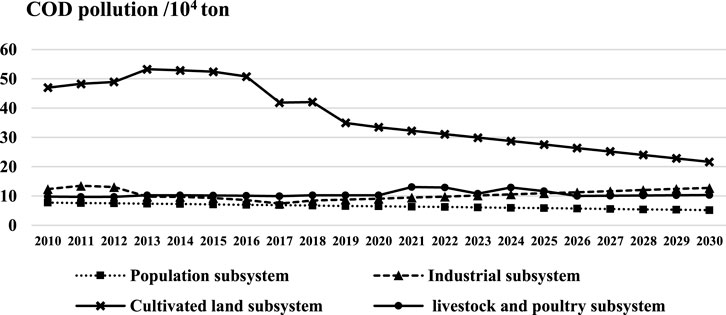
FIGURE 4. Composition of urban COD pollution under the benchmark scenario.
From Figure 4, the pollution of population, livestock, and poultry between these two subsystems decrease year by year. The industrial subsystem shows an upward trend, and the cultivated land subsystem fluctuates slightly, but changes little. Comparing the pollution data in 2030 with that in 2020, the results show that: the pollution of population and livestock subsystem decreased by 20.20 and 35.29%, respectively, the pollution of industrial subsystem increased by 40.60%, and that of cultivated land increased slightly by 0.56%. The contribution rate of urban pollution has changed from livestock and poultry (56.39%), cultivated land (17.34%), industry (15.32%), and population (10.95%) in 2020 to livestock and poultry (43.34%), industry (25.58%), cultivated land (20.71%), and population (10.38%) in 2030. In 2030, the COD pollution of the whole city decreased by 15.79%, mainly due to the rapid decline of livestock and poultry pollution. While industrial pollution has risen from the third pollution source to the second largest pollution source, livestock and poultry pollution is still the main factor in the urban water pollution system. Therefore, properly reducing livestock breeding and controlling industrial pollution can control the total amount of urban water pollution.
For a single subsystem, with the increase of urbanization rate, more and more rural people gather in cities. Although the total urban population increases, the treatment capacity of urban domestic sewage is strong, which offsets the pollution caused by the urban population growth. As the industrial added value increases year by year, the water consumption of 10,000 Yuan industrial added value remains unchanged during the prediction period, and the industrial system shows an upward trend. The cultivated land subsystem has strong self-healing ability, together with the farming mode has not changed greatly, so it is relatively stable. The pollution of livestock and poultry subsystem is gradually reduced due to the reduction in the number of livestock and poultry breeding year by year.
Under different scenarios, although the COD pollution of the urban water pollution system fluctuates slightly, it shows a downward trend, and the degree of decline is different for different scenarios. Figure 5 shows the specifics.
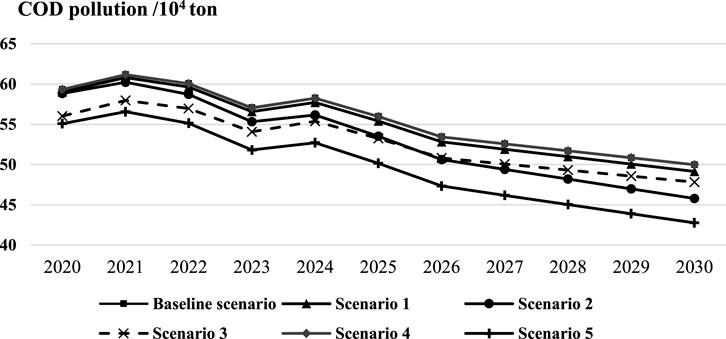
FIGURE 5. Simulation results of COD pollution amount under different scenarios.
As shown in Figure 5, under the benchmark scenario, the COD pollution in 2030 is 15.79% lower than that in 2020, with 93,800 tons. With different sewage treatment measures, the pollution is reduced to a certain extent compared with the basic scenario. In 2030, compared with the benchmark scenario, the pollution of scenario 1, 2, 3, 4, and 5 will be reduced by 8,400, 42,000, 21,700, 100, and 72,300 tons, respectively. Among them, the water pollution control measures in scenario 5 have the best effect, and can control the total amount of urban COD pollution within 450,000 tons by 2030. It is also the only treatment measure that can reduce COD emission by over 20%.
Aiming at the problem of urban water pollution and looking for ways to control water pollution, this study comprehensively considers point source and non-point source pollution, and constructs a simulation system model of urban water pollution from four subsystems: population, industry, arable land, and livestock and poultry. Compared with previous studies, there has been several research on urban water pollution, but a comprehensive urban water pollution system has not been established. Some studies only consider the point source pollution dominated by domestic sewage and industrial wastewater (Z. Shi et al., 2021). Other studies only discuss non-point source pollution from livestock and poultry manure and agricultural waste (Li et al., 2017). As the urban pollution subsystem contains main sources of urban pollution, there is not only the feedback impact of industrial development and the fluctuation caused by population change but also the comprehensive consideration of livestock and poultry breeding. This study can more accurately count and predict water pollution in the process of urban development, which is of great significance for government departments to provide accurate counter-measures for urban water pollution control and management decisions. This urban water pollution system model can also be applied to other cities.
The system dynamics have unique advantages in the field of water pollution treatment. Compared with the traditional static evaluation, it can be predicted dynamically. In contrast to dynamic prediction, such as the dynamic optimization model (Hao et al., 2021), system dynamics are derived from multi-data simulation rather than calculation, so a specific variable can be adjusted in any process to observe changes in the model. The system dynamics model can simulate different development plans, and then obtain the best policy plan and the corresponding water pollution control situation. It can not only find the optimal solution of water pollution control but also dynamically observe the control effect of each policy. As for the changes in reality life cause uncertainty, the system dynamics model could decrease its influence for the following reasons. First, all the values of the system dynamics are derived from historical data, and the prediction is made according to a certain fitting relation, which means that this model could consider the uncertainty caused by endogenous influence. Second, the model is built by considering the large amount of impact factors and this method could analyze sensitiveness of each factor, the factor with small sensitive has little influence, while large weight has great fluctuations on the results of the model. Last, for uncertainty brought by exogenous shocks, which is inevitably reflected in the reality as a major emergency, there were no good ways to predict or avoid.
Compared with the provincial scale analysis (Chen and Chen 2020), selecting cities as the research boundary has smaller error and the data are easier to obtain. Some studies choose urban areas (Tan et al., 2018) or river basins (Nazari-Sharabian et al., 2019) as system boundaries. However, the systems that select cities as boundaries ignore non-point source pollution, resulting in inaccurate source collection. While choosing the river basin, a system boundary will fail to carry out accurate economic policy through administrative subject. Choosing administrative region (including urban and rural areas) as the main body of policy implementation can control the pollution of all subsystems in the region through administrative means, to meet the rapid economic development and effectively protect the environment.
To address the problem of urban water pollution control in the context of high-quality development, this study explored the impact of different environmental governance policies on urban water pollution. Accordingly, the following recommendations to the relevant departments of urban water pollution control have been made:
(1) This study suggests governmental departments to make policies for sewage treatment and strengthen urban sewage management. First, the government shall plan to optimize the allocation of water resources, and implement the over-quota and progressive pricing mechanism for residential water consumption. Second, the government shall push forward the construction of sewage treatment facilities in urban areas and accelerate the construction of facilities for centralized sewage treatment. Third, efforts should be made to develop water-saving agriculture and strengthen water-saving irrigation and transformation.
(2) The urban factory should improve the sewage treatment level. First, they should strengthen research on improving technologies for industrial sewage treatment. Second, enterprises should be encouraged to speed up transforming traditional industries with high pollution and new high technologies and achieve the purpose of sewage treatment by reducing the treatment costs.
(3) Farmers also need to launch scientific animal husbandry and livestock feeding, and promote the recovery of resources from livestock manure. Through the recycling development of agriculture and animal husbandry by combining planting and feeding, they can increase the restoration of livestock manure to be used in fields and improve its utilization rate. In addition, they shall use fertilizers and pesticides of high effectiveness to reduce their overall use.
(4) Urban residents are advised to save water. On one hand, residents shall strengthen their awareness and habit of saving water and make full use of water resources. On the other hand, they should also implement garbage sorting to avoid discarding hazardous waste into the water body.
Overall, implementing water pollution control policies for one pollution source can reduce pollutant emissions to a certain extent, but the effect of pollution control is limited. In comparison, comprehensive treatment policies for each pollution source can bring the greatest benefits of water pollution reduction. Therefore, water pollution control in the process of high-quality urban development needs the coordinated promotion of various policies and measures.
Although the system dynamics method can be used to link point source pollution and non-point source pollution and can be accurately calculated and predicted, there are still several limitations that need to be further studied.
(1) COD concentration varies from individual to individual, and the existing data are all from previous studies or industry standards. It is necessary to accurately measure the COD concentration in different channels.
(2) Different subsystems do not exist independently and will be affected by changes in other subsystems. The model fails to correlate the variables between subsystems, which is an existing deficiency of the model, and needs to be further adjusted.
(3) The accuracy of data sources and data prediction is strongly related to the accuracy of system dynamics simulation results. Thus, results can be further improved by further data mining. In addition, system dynamics cannot predict the impact of emergencies caused by exogenous shock.
First, this research first constructed a simulation model of urban water pollution using the system dynamics method to address the problem of controlling urban water pollution in the context of high-quality development. Second, this research studied the internal operation mechanism of the urban water pollution system and explored the impact of different environmental governance policies on urban water pollution. The findings are as follows: 1) Considering point source pollution and non-point source pollution comprehensively, this study constructs a complete simulation model of urban water pollution system from four subsystems: population, industry, planting, and livestock and poultry breeding. 2) In the process of high-quality development of the city, the main source of water pollution is the livestock and poultry subsystem, but it will gradually decrease with the reduction of the number of breeding and the improvement of scientific breeding technology, while the industrial subsystem will gradually rise and become an important part of urban water pollution. 3) Comprehensive treatment of all pollution sources, focusing on major pollution sources (such as livestock and poultry and industry) is of great significance for the improvement of urban water environment.
These findings can be used to open the black box of urban water pollution and find the causes of water pollution from the perspective of society, economy, population, and industry, which are necessary for government departments to form accurate water pollution control strategies and feasible management decisions. In addition, SD can be used to accurately calculate and estimate the future trend of urban water pollution according to the status of urban water resources and development planning objectives.
The original contributions presented in the study are included in the article/supplementary files, further inquiries can be directed to the corresponding author.
MA contributed to the conception and design of the research. XH organized and contributed to the database. JH and XH wrote the first draft of the manuscript. RK translated and polished the manuscript. MA, XH, LJ, and YZ contributed to manuscript revision and read and approved the submitted version.
This research was funded by the National Science Foundation of China (Grant Nos. 72004116, 71874101, and 72104127), 2021 Hubei Provincial Department of Education Science Research Program Funded Project for Young and Middle-aged Talents (Grant No. Q20211211), and Hubei Province Humanities and Social Sciences Key Research Base Project (Grant No. 2021-SDSG-05).
The authors thank all reviewers who have contributed considerably for comments on the manuscript.
The authors declare that the research was conducted in the absence of any commercial or financial relationships that could be construed as a potential conflict of interest.
All claims expressed in this article are solely those of the authors and do not necessarily represent those of their affiliated organizations, or those of the publisher, the editors, and the reviewers. Any product that may be evaluated in this article, or claim that may be made by its manufacturer, is not guaranteed or endorsed by the publisher.
An, M., Xie, P., He, W., Wang, B., Huang, J., Khanal, R., et al. (2022). Spatiotemporal change of ecologic environment quality and human interaction factors in three gorges ecologic economic corridor. Ecol. Indic. 141, 109090. doi:10.1016/j.ecolind.2022.109090
Bu, Y., Wang, E. D., and Jiang, Z. Y. (2021). Evaluating spatial characteristics and influential factors of industrial wastewater discharge in China: A spatial econometric approach. Ecol. Indic. 121, 107219. doi:10.1016/j.ecolind.2020.107219
Carrer, M. J., Maia, A. G., Vinholis, M. d. M. B., and de Souza Filho, H. M. (2020). Assessing the effectiveness of rural credit policy on the adoption of integrated crop-livestock systems in Brazil. Land use policy 92, 104468. doi:10.1016/j.landusepol.2020.104468
Chen, J., Shi, W., and Jin, X. (2022). Pollutant flux estimation of the Lijiang river based on an improved prediction-Correction method. Front. Environ. Sci. 10. doi:10.3389/fenvs.2022.868404
Chen, K., Chen, H., Zhou, C., Huang, Y., Qi, X., Shen, R., et al. (2020). Comparative analysis of surface water quality prediction performance and identification of key water parameters using different machine learning models based on big data. Water Res. 171, 115454. doi:10.1016/j.watres.2019.115454
Chen, Y., and Chen, W. J. W. (2020). Simulation study on the different policies of Jiangsu Province for a dynamic balance of water resources under the water–energy–food nexus. Water 12 (6), 1666. doi:10.3390/w12061666
Cui, Y., Feng, P., Jin, J., and Liu, L. (2018). Water resources carrying capacity evaluation and Diagnosis based on set pair analysis and improved the Entropy weight method. Entropy 20 (5), 359. doi:10.3390/e20050359
Ellison, G., Glaeser, E. L., and Kerr, W. R. (2010). What causes industry agglomeration? Evidence from coagglomeration patterns. Am. Econ. Rev. 100 (3), 1195–1213. doi:10.1257/aer.100.3.1195
Fan, Y., and Fang, C. (2020). A comprehensive insight into water pollution and driving forces in Western China-case study of Qinghai. J. Clean. Prod. 274, 123950. doi:10.1016/j.jclepro.2020.123950
Filyushkina, A., Strange, N., Lof, M., Ezebilo, E. E., and Boman, M. (2018). Applying the Delphi method to assess impacts of forest management on biodiversity and habitat preservation. For. Ecol. Manag. 409, 179–189. doi:10.1016/j.foreco.2017.10.022
Forrester, J. W. (1958). Industrial dynamics: A major Breakthrough for decision Makers. Harv. Bus. Rev. 36 (4).
Garrett, R. D., Niles, M. T., Gil, J. D. B., Gaudin, A., Chaplin-Kramer, R., Assmann, A., et al. (2017). Social and ecological analysis of commercial integrated crop livestock systems: Current knowledge and remaining uncertainty. Agric. Syst. 155, 136–146. doi:10.1016/j.agsy.2017.05.003
Guo, K., Cao, Y., Wang, Z., and Li, Z. (2022). Urban and industrial environmental pollution control in China: An analysis of capital input, efficiency and influencing factors. J. Environ. Manag. 316, 115198. doi:10.1016/j.jenvman.2022.115198
Hao, X., Yan, J., Sha, J., Ke, W., He, G., Song, C., et al. (2021). Exploring the synthetic optimal policies for solving problems of agricultural water use with a dynamic optimization simulation model. J. Clean. Prod. 287, 125062. doi:10.1016/j.jclepro.2020.125062
Hou, F., Zhang, T., Peng, Y., Cao, X., Pang, H., and Shao, Y. (2021). Partial anammox achieved in full scale biofilm process for typical domestic wastewater treatment. Front. Environ. Sci. Eng. 16 (3), 33. doi:10.1007/s11783-021-1467-6
Kotir, J. H., Smith, C., Brown, G., Marshall, N., and Johnstone, R. (2016). A system dynamics simulation model for sustainable water resources management and agricultural development in the Volta River Basin, Ghana. Sci. Total Environ. 573, 444–457. doi:10.1016/j.scitotenv.2016.08.081
Li, Z., Sui, P., Wang, X., Yang, X., Long, P., Cui, J, et al. (2017). Comparison of net GHG emissions between separated system and crop-swine integrated system in the North China Plain. J. Clean. Prod. 149, 653–664. doi:10.1016/j.jclepro.2017.02.113
Liu, S., Zhu, Y., and Du, K. (2017). The impact of industrial agglomeration on industrial pollutant emission: Evidence from China under new Normal. Clean. Technol. Environ. Policy 19 (9), 2327–2334. doi:10.1007/s10098-017-1407-0
Michalak, A. M., Anderson, E. J., Beletsky, D., Boland, S., Bosch, N. S., Bridgeman, T. B., et al. (2013). Record-setting algal bloom in Lake Erie caused by agricultural and meteorological trends consistent with expected future conditions. Proc. Natl. Acad. Sci. U. S. A. 110 (16), 6448–6452. doi:10.1073/pnas.1216006110
Naderi, M. M., Mirchi, A., Bavani, A. R. M., Goharian, E., and Madani, K. (2021). System dynamics simulation of regional water supply and demand using a food-energy-water nexus approach: Application to Qazvin Plain, Iran. J. Environ. Manag. 280, 111843. doi:10.1016/j.jenvman.2020.111843
Nazari-Sharabian, M., Taheriyoun, M., Ahmad, S., Karakouzian, M., and Ahmadi, A. J. W. (2019). Water quality modeling of Mahabad Dam watershed–reservoir system under climate change conditions, using SWAT and system dynamics. Water 11 (2), 394. doi:10.3390/w11020394
Ongley, E. D., Zhang, X., and Yu, T. (2010). Current status of agricultural and rural non-point source Pollution assessment in China. Environ. Pollut. 158 (5), 1159–1168. doi:10.1016/j.envpol.2009.10.047
Perez-Gutierrez, J. D., and Kumar, S. (2019). Simulating the influence of integrated crop-livestock systems on water yield at watershed scale. J. Environ. Manag. 239, 385–394. doi:10.1016/j.jenvman.2019.03.068
Seglah, P. A., Wang, Y., Wang, H., Bi, Y., Zhou, K., and Wang, Y. (2020). Crop straw utilization and field burning in Northern region of Ghana. J. Clean. Prod. 261, 121191. doi:10.1016/j.jclepro.2020.121191
Shi, Z., She, Z., Chiu, Y.-h., Qin, S., and Zhang, L. (2021). Assessment and improvement analysis of economic production, water pollution, and sewage treatment efficiency in China. Socio-Economic Plan. Sci. 74, 100956. doi:10.1016/j.seps.2020.100956
Sterman, J. D. (2000). Business dynamics: Systems Thinking and modeling for a complex World. Boston, MA: Irwin McGraw-Hill.
Sun, Y., Zhang, W., Zheng, X., Gao, C., Zhu, L., Wang, Y., et al. (2020). Emission regularity of daily domestic sewage pollutant production of urban residents per Capita. China Water & Wastewater 36 (6), 1–6.
Tan, Y., Jiao, L., Shuai, C., and Shen, L. (2018). A system dynamics model for simulating urban sustainability performance: A China case study. J. Clean. Prod. 199, 1107–1115. doi:10.1016/j.jclepro.2018.07.154
Tao, Y., Liu, J., Guan, X., Chen, H., Ren, X., Wang, S, et al. (2020). Estimation of potential agricultural non-point source pollution for Baiyangdian Basin, China, under different environment protection policies. Plos one 15 (9), e0239006. doi:10.1371/journal.pone.0239006
Tripathi, M., and Singal, S. K. (2019). Use of principal component analysis for parameter selection for development of a novel water quality index: A case study of river Ganga India. Ecol. Indic. 96, 430–436. doi:10.1016/j.ecolind.2018.09.025
Wang, F., Wang, Y., Zhang, K., Hu, M., Weng, Q., and Zhang, H. (2021). Spatial heterogeneity modeling of water quality based on random forest regression and model interpretation. Environ. Res. 202, 111660. doi:10.1016/j.envres.2021.111660
Wang, Q., Liu, R., Men, C., and Guo, L. (2018). Application of genetic algorithm to land use optimization for non-point source pollution control based on CLUE-S and SWAT. J. Hydrology 560, 86–96. doi:10.1016/j.jhydrol.2018.03.022
Xiang, C., Wang, Y., and Liu, H. (2017). A scientometrics review on nonpoint source pollution research. Ecol. Eng. 99, 400–408. doi:10.1016/j.ecoleng.2016.11.028
Yang, J., Wang, Y., Fang, S., Qiang, Y., Liang, J., Yang, G, et al. (2020). Evaluation of livestock pollution and its effects on a water source protection area in China. Environ. Sci. Pollut. Res. 27 (15), 18632–18639. doi:10.1007/s11356-019-06485-0
Zhang, C., Liu, S., Wu, S., Jin, S., Reis, S., Liu, H., et al. (2019). Rebuilding the linkage between livestock and cropland to mitigate agricultural pollution in China. Resour. Conservation Recycl. 144, 65–73. doi:10.1016/j.resconrec.2019.01.011
Zhang, Z., He, W., Shen, J., An, M., Gao, X., Degefu, D. M., et al. (2019). The driving forces of point source wastewater emission: Case study of COD and NH4-N discharges in Mainland China. Int. J. Environ. Res. Public Health 16 (14), 2556. doi:10.3390/ijerph16142556
Keywords: urban water pollution, point source pollution, non-point source pollution, system dynamics, simulation scenario
Citation: An M, Huang X, Jia L, Zhang Y, Huang J and Khanal R (2022) Simulation study of the multi-driver regulation strategy for an urban water pollution system. Front. Environ. Sci. 10:925176. doi: 10.3389/fenvs.2022.925176
Received: 21 April 2022; Accepted: 28 September 2022;
Published: 18 October 2022.
Edited by:
Guo Wei, University of North Carolina at Pembroke, United StatesCopyright © 2022 An, Huang, Jia, Zhang, Huang and Khanal. This is an open-access article distributed under the terms of the Creative Commons Attribution License (CC BY). The use, distribution or reproduction in other forums is permitted, provided the original author(s) and the copyright owner(s) are credited and that the original publication in this journal is cited, in accordance with accepted academic practice. No use, distribution or reproduction is permitted which does not comply with these terms.
*Correspondence: Jin Huang, aHVhbmdqaW5AY3RndS5lZHUuY24=
Disclaimer: All claims expressed in this article are solely those of the authors and do not necessarily represent those of their affiliated organizations, or those of the publisher, the editors and the reviewers. Any product that may be evaluated in this article or claim that may be made by its manufacturer is not guaranteed or endorsed by the publisher.
Research integrity at Frontiers
Learn more about the work of our research integrity team to safeguard the quality of each article we publish.