 Renhua Tan
 Ruiqi Wang
 Yu Wang
 Disheng Yi
 Yan Chen
 Wenting Cai
 Xiangchun Wang1*
94% of researchers rate our articles as excellent or good
Learn more about the work of our research integrity team to safeguard the quality of each article we publish.
Find out more
METHODS article
Front. Environ. Sci., 14 September 2022
Sec. Environmental Citizen Science
Volume 10 - 2022 | https://doi.org/10.3389/fenvs.2022.924996
This article is part of the Research TopicImpacts of Urban Green Spaces on Environmental Perceptions and Social LifeView all 8 articles
With social media platforms becoming popular in recent years, Big Data has become an effective way to explore human-oriented service capability of parks. In this research, the spatial accessibility of urban parks under four different travel modes (driving, transiting, biking, and walking) and multiple modes was analyzed by integrating the actual experiences of visitors and real travel time. We took the built-up area of Chengdu, Sichuan Province, China as the research area and drew conclusions as follows: 1) park accessibility of Chengdu still has a large space for promotion. 2) Residents living in the east region of Qingyang District and Wuhou District, north area of Jinniu District, and Chenghua District are more convenient to visit parks, as well as the population center of Longquanyi District, Shuangliu District, and Pidu District. In addition, riders and walkers are more likely to go to the nearest park. 3) Accessibility of parks would be affected significantly during peak hours and weekends by driving and multiple modes, while the other travel modes had little influence. 4) Spatial aggregation was more obvious during the peak hours of weekdays under driving modes, while there were obvious cold spot areas distributed continuously for riders. 5) Park desert was found in Yongquan Subdistrict, Jitouqiao Subdistrict, and Chenglonglu Subdistrict, which were near the downtown. Overall, Chengdu must make rational use of small and micro spaces in the city to add greenery to the corners of the city and integrate parks with other surrounding industries to inspire the entertainment, economy, and tourism function of parks. Through the modified 2SFCA method, this study provide a more realistic and human-oriented way to demonstrate the accessibility. Also, the results can guide cities to understand what reasonable and appropriate parks they need to build to achieve the equalization of park recreation services.
Since urban space is one of the most over-populated living environments, urban green spaces, especially parks, play a vital role in the relationship between humans and natural environment. They also bring various benefits to the ecosystem and urban development (Wright Wendel et al., 2012; Hartig et al., 2014; Bertram and Rehdanz, 2015; Wu et al., 2017). Numerous studies have illustrated that establishment of urban parks contribute to decreased physical and psychological illnesses (Zhang et al., 2018) and improved air quality (Kroeger et al., 2014; Zhang et al., 2014). In addition, economic and social return could also be provided through strengthening social connection (Moulay et al., 2017) and economic vitality of the surrounding areas by parks (Wu et al., 2017; Aram et al., 2019). In China, there is an imbalanced relationship between the spatial distribution of parks and people’s needs in the urban space because of rapid development of urbanization (Li et al., 2019a; Xiao et al., 2019). Therefore, the Chinese government initially proposed the concept of “Park City” in 2018, which advocates balanced allocation, harmony, and sharing in urban planning and construction. Within this context, exploring whether the current urban parks can meet the recreational needs of residents all over the city has become the precursor task to build the Park City. Accessibility is a common measure to indicate convenience for city residents to parks. So, it is necessary to analyze park accessibility and how it differs under different conditions. Also, these results could be a key for urban planners to understand what reasonable and appropriate parks they need to build in the goal of Park City.
The concept of accessibility was initially used to describe “population potential” in the population gravity model by Stewart (Stewart, 1948). After that, accessibility to facilities or services was defined as the potential of opportunities for interaction (Hansen, 1959). Then, two categories were developed to evaluate the accessibility, which are individual-based accessibility and location-based (place-based) accessibility (Geurs and Van Wee, 2004; Wang et al., 2018; Gong et al., 2021; Li et al., 2021). Individual-based accessibility defines attraction for each individual movement between locations. Also, it prefers to reflect the freedom of individuals to reach different activities and benefit from them (Berechman, 2010). In contrast, location-based accessibility has been applied to reveal the relationships between locations, which measures the ability to visit specific facilities or services according to travel distance and population from residential areas or workplaces (Dalvi and Martin, 1976; Wang et al., 2018). Thus, the measurements of accessibility have emerged with plenty of ideas. The most common of them include 1) population-to-provider ratios (Ngui and Vanasse, 2012; McGrail and Humphreys, 2014), which can also be seen as the supply capacity of facilities or services, while it is hard to reveal the spatial heterogeneity and spatial interactions between the geographic units; 2) spatial proximity (Onega et al., 2008), which means the travel distance to nearest facilities or services represents accessibility. However, there are various choices when people decide to visit them, not only the nearest one; 3) the gravity-based methods (Hansen, 1959; Joseph and Bantock, 1982; Geurs and Van Wee, 2004), which considered both supply capacity and distance decay effect. However, the impedance parameter β of this method requires prior knowledge and has no clear geographical meaning. In order to overcome these shortages, Radke and Mu (2000) proposed the two-step floating catchment area (2SFCA) method, which was then improved by Luo and Wang (2003). The method used a floating catchment area searching the starting points (the potential demand) and the destinations (the possible supply). Afterward, this method and its improvements have become the most typical model to measure accessibility.
There is a problem in the classic 2SFCA model that is how to depict the distance decay effect in an exact way. At the beginning, Luo and Qi (2009) proposed an enhanced two-step floating catchment area (E2SFCA) using weights to different travel costs to account for distance decay. After that, a continuous function was employed to describe distance decay instead of a discrete one. Some studies used a kernel density function (Guagliardo, 2004; Xia et al., 2019), a power function (Luo, 2014; Dony et al., 2015; Tao et al., 2018), or a Gaussian-based function (Dai, 2011; Cheng et al., 2016; Li et al., 2019b; Bryant and Delamater, 2019; Hu et al., 2020) to simulate travel cost. In particular, Gong et al. (2021) improved the distance decay function with the actual travel behavior from trajectories to reflect the real travel distance impedance (Li et al., 2021). Another solution is changing the catchment area wherein different people would accept different travel costs in terms of different conditions (McGrail and Humphreys, 2009). As a result, the idea of variable catchment area was involved in the 2SFCA model called V2SFCA, which was applied to fit the travel distance (McGrail and Humphreys, 2009; Luo and Whippo, 2012; McGrail and Humphreys, 2014; Dony et al., 2015; Bauer and Groneber, 2016).
Moreover, individuals might choose different travel modes when they visit facilities or services due to urban development, while the classic 2SFCA method failed to consider the situation. Therefore, scholars have taken multiple travel modes into account on accessibility. For example, Liang and Nekorchuk supposed that different transport modes could provide more realistic accessibility estimations and integrated travel time by car and bus in the 2SFCA method (Mao and Nekorchuk, 2013). Dony et al. (2015) compared park accessibility under four travel modes (car, public transportation, bike, and walk). Xing et al. (2018) also believed that there is a better explanation through separately exploring the access to urban parks by car, bike, and walk. Another study calculated the accessibility influenced by driving, riding, and walking, and the results showed that the patterns of spatial accessibility under different travel modes were apparently variant (Li et al., 2019a). At the same time, Qin et al. (2020) combined the driving and transiting ways to evaluate the accessibility of parks with a comparison between any single mode. Similarly, there is a study that integrated the multi-type travels into the traditional 2SFCA method and provided a more accurate result of accessibility (Hu et al., 2020).
Although research has found that travel distance was one of the most important factors associated with the likelihood when people visit places, especially public parks (Giles-Corti et al., 2005), non-spatial factors often influence spatial accessibility to urban facilities, such as the size and amenities of them, the distribution of population, and the other metrics of access (Li et al., 2019a; Li et al., 2019b). For instance, some research illustrated that there were numerous impacts that influence park accessibility, including the size of the park, the number of amenities, landscape quality, points of interest (POIs) around the parks, and functions and public’s psychological perceptions (Dony et al., 2015; Xing et al., 2018; Hu et al., 2020; Li et al., 2019; Wang et al., 2015a). As a result, they mixed these factors for significance into the traditional 2SFCA method. According to Zhang et al. (2020a),inconspicuous places in the city might be more popular for local visitors rather than those big and remarkable places because they may prefer a peaceful and lively space for relaxation or social interactions Zhang et al., 2020). Meanwhile, some studies indicated that perceived or psychological accessibility is as essential as geographic distance in determining attitudes to public facilities (Wang et al., 2015b; Cw et al., 2020). Wan et al. adopted emotions and memories to evaluate the psychological impact toward urban parks (Cw et al., 2020). However, there are few studies that considered the comments and emotions from visitors when they analyzed spatial accessibility. It is necessary for researchers to improve the 2SFCA method with those contributors.
Due to rapid development of information and communication technologies (ICTs), daily activities of city dwellers have become easy to capture and collect (Liu et al., 2015). These huge amounts of data with spatio-temporal characteristics could help understand deeply the travel patterns and emotions of various places. They also bring a new opportunity to the study field of accessibility in recent years. For example, there are numerous studies that replace travel distance as actual travel time rather than the Euclidean distance or network distance in those conventional analyses of accessibility (Cheng et al., 2016; Xu et al., 2017; Li et al., 2019a; Qin et al., 2020). At the same time, social media data could record the actual feelings when people visit and interact with natural environment and measure their preferences (Wood et al., 2013; Zhang and Zhou, 2018), which is also feasible and time-saving than traditional surveys. Therefore, evaluating emotions of visitors from social media data has already become a common way in previous studies.
To sum up, the purpose of this study is to analyze the spatial accessibility of urban parks which integrated actual experiences of visitors and real travel time under four different travel modes to explore the convenience of residents to parks and reveal the unbalanced supply–demand problem between parks and residential areas. This study can be described as follows: 1) we chose Chengdu, China, Park City Demonstration Area, as the study case; 2) we added experience scores from actual comment data of social media as the park attractiveness into the Huff Model and took the actual travel cost between parks and population points by driving, transiting, riding, and walking as distance decay to improve the 2SFCA method to calculate the accessibility of residents; 3) we further compared the park accessibility for visitors in different periods (peak periods and non-peak periods and weekdays and weekends); and 4) we finally explored the spatial autocorrelation of park accessibility and how other factors (population and house price) are associated with accessibility.
Chengdu is one of the biggest city in the southwest region of China with 1,421.6 square kilometers of built-up area until 2021, which is a well-known place to live. The subtropical monsoon climate leads to rich flora and fauna resources in Chengdu and provides a great natural background as a solid foundation for city park establishment. In recent years, enormous green spaces and parks have also boomingly developed or planned for urban dwellers in Chengdu. By the end of 2018, the per capita green area and parks has already reached 14.58 square meters, and 43.36% of the built-up area has been covered by the green space. At the same time, the idea of “Park City,” that represents the cooperation with humans, urban space, and parks, has been originally introduced by President Xi of China in 2018. It means that human–environment relationship has a high priority rating in urban planning and development. Also, Chengdu has become a “Park City Demonstration Area” in China due to its favorable natural conditions. However, the crowded population brings a huge number of problems to this city. How to balance the green needs of residents and the social fairness of this service has become an essential question for planners and administrators. Therefore, we select the built-up area of Chengdu as our study area. It could provide a case study to analyze the spatio-temporal characteristic of accessing the park. Figure 1 shows the study area.
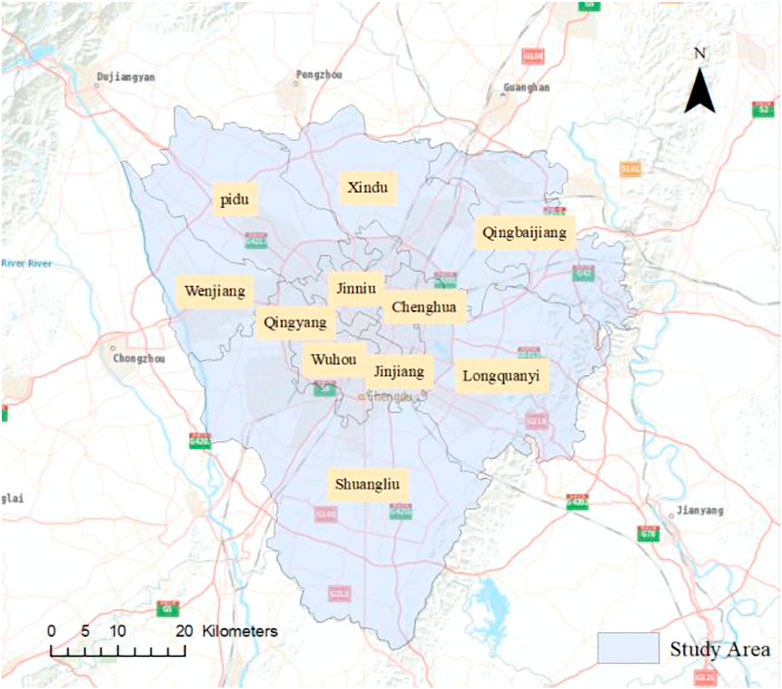
FIGURE 1. Study area in Chengdu.
The information about the 55 parks used in this study is obtained from Chengdu Government website (http://www.cddata.gov.cn/). All the parks here are recorded in the “Chengdu Urban Park Directory,” so they have a high local reputation. The data of each park contain names, types, and areas. According to the related guidelines of China, these parks are divided into three types: comprehensive parks, specialized parks, and community parks (CJJ/T85-2017, 2017). Furthermore, through the POI (Point of Interest) dataset from BaiduMap, we obtained the geographic coordinate information of these parks and abstracted the park center into points for spatial representation. The spatial distribution of parks is shown in Figure 2.
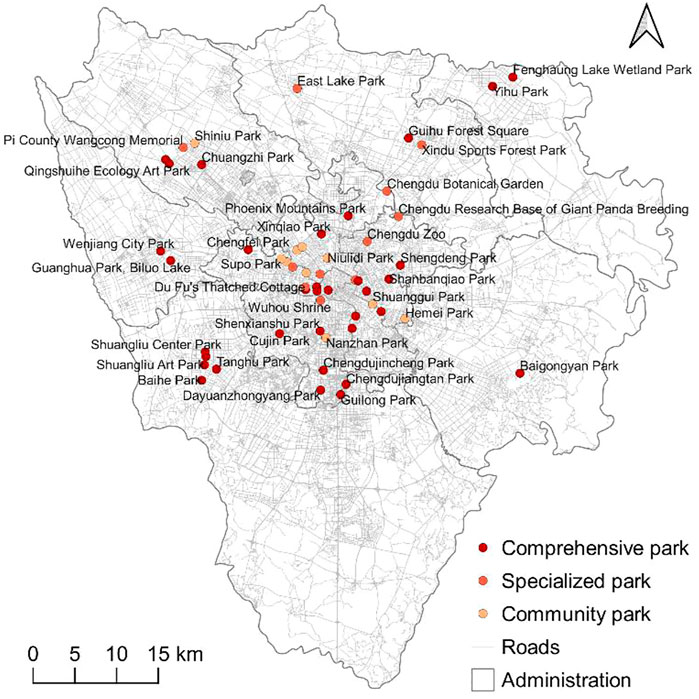
FIGURE 2. Spatial distribution of parks in Chengdu.
Population is normally used in accessibility assessment to characterize the actual demand of the assessment object. To maximize the spatial distribution of the population, we used the POI data of apartment complex from the website (https://cd.ke.com/) [(Xia et al., 2019), (Wong, 2004), (Larsen and Gilliland, 2008)], and each record of data includes attributes such as names, coordinates, house price, and number of apartments in one complex. In addition, as the basic statistics unit of population in spatial distribution, the difference in the shape and size of the spatial statistics unit causes various results (Rankin, 1964). There is a research which indicated that a hexagon could balance the sampling bias caused by the boundary effect to make the final sampling value of each spatial statistics unit more accurate Wong (2004). Thus, we chose hexagons as basic spatial statistics units and divided the study area into 16,523 hexagons with 500 lengths per side. By integrating the POI data of apartment complex and eliminating the hexagon without population, there are 3,041 population hexagons as a result. The geographic distribution of those population hexagons is shown in Figure 3. However, only one specific coordinate point would be the origin or destination in the accessibility model, while there are many coordinate points of the apartment complex in one hexagon. Therefore, the weighted mean of coordinates of the apartment complex in each population hexagon were used to represent the population center, as well as the origin of travel, in this study. Figure 3 illustrates the conception of weighted mean coordinates in one hexagon, and the specific calculation is shown as Eqs 1, 2.
where
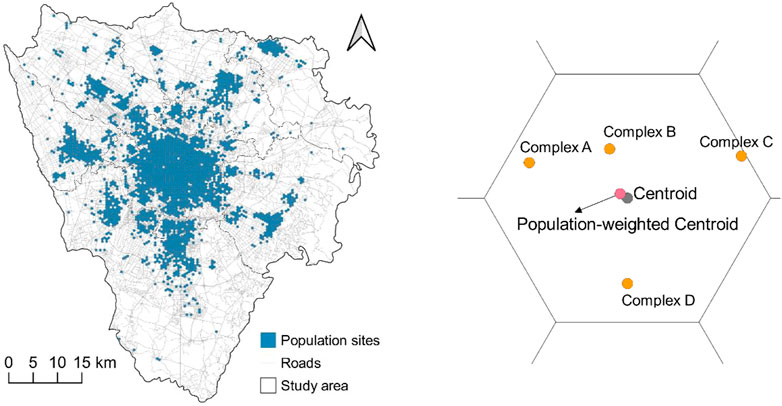
FIGURE 3. Geographic distribution of those population hexagons in Chengdu.
Ctrip.com is one of the most popular trip information websites in China, which has a large number of users. People prefer to comment their experience after they visit somewhere. As a result, a great collection of actual comment data could be borrowed to reflect the emotions and feedback of visitors. We obtained 16,084 comments from Ctrip.com, and each comment data record the user’s ID, the content of comment, and the number of likes. Each raw data must be preprocessed before evaluating their emotions and experiences, which contains cleaning, segmentation, and removing stop words. After that, the quantitative analysis for those comments was applied to observe the experiences of park visitors. In recent years, natural language processing (NLP) has become the widely used text-analyzed method due to development of machine learning. BosonNLP is one of the most well-known platforms in the field of Chinese-based sentiment analysis. In this study, we adopted this semi-supervised artificial neural network method through the Boson platform and quantified those comments as an experience score. The truth is that there are both positive comments and negative comments on each park, and they would equally influence the judgement of visitors. Therefore, the experience scores of parks are calculated as Eq. 3.
where
The acquisition of travel time plays a significant role in accessibility. The travel cost is usually defined as the traditional geographic distance such as Euclidean distance, even some network distance or hypothetical speed based on network roads. In fact, it is extremely complex for traffic conditions on the road in different time periods. Those conventional travel costs cannot depict the travel behavior of park visitors. In this study, the actual travel time from population hexagons to parks was used instead of the traditional ones. At the same time, BaiduMap, as the data provider, brings dynamic traffic information by four travel modes that are driving, public transiting, riding, and walking. Some research also claimed that there is spatio-temporal characteristics of accessing to urban facilities (Yu and Shaw, 2007; Li et al., 2019b; Li et al., 2021). Thus, many research studies used different time periods to study tourists’ recreational activities. For example, four periods, weekday morning (9:00 a.m. to 1:00 p.m.), weekday afternoon (1:00 p.m. to 7:00 p.m.), weekend morning (9:00 a.m. to 1:00 p.m.), and weekend afternoon (1:00 p.m. to 7:00 p.m.), were mentioned by Vidal to highlight the differences of visitors’ behavior in public urban green spaces with different times (Guedes Vidal et al., 2022). Pham administered the questionnaires during three busiest periods of park usage to conduct surveys for visitors in Hanoi: weekday morning (5:30–8:30 a.m.), weekday afternoon (5:30–8:30 p.m.), and weekend afternoon (4–7 p.m.) (Thanh-Hien Pham et al., 2019). Comprehensively considering the current standard of China and the actual situation of Chengdu (GA/T 115-2020, 2020), three time periods are selected in this study, peak periods (7:00–9:00), non-peak periods (9:00–11:00 and 13:00–16:00), and normal periods (10:00–11:00 and 14:00–16:00) to reveal the temporal characteristics of park accessibility. There are a total of 152,132 routes from population hexagons to parks in each period used in this research. Figure 4 shows the distribution of travel time by four travel modes in different periods.
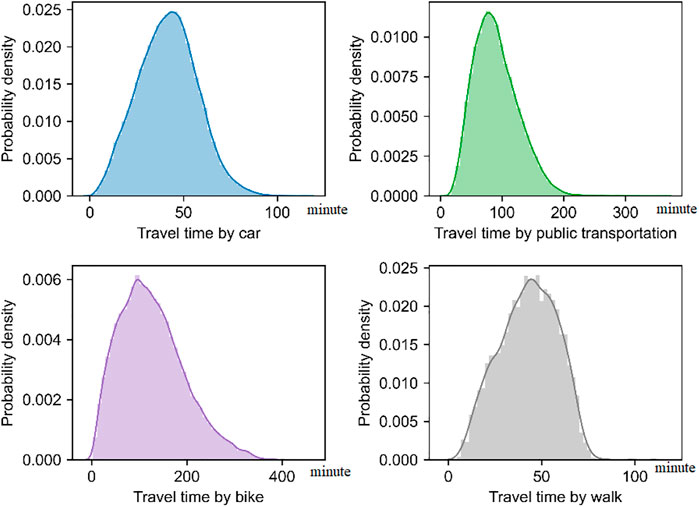
FIGURE 4. Distribution of travel time by four travel modes in different periods.
The 2SFCA method measures the accessibility from the perspective of spatial interaction between supply and demand. In this study, the accessibility is evaluated in two steps considering the parks as the supplier and population centers as the demander. The first step calculates the supply–demand ratio between parks and population centers. A catchment is established for each park as the center and the farthest distance within a given travel time as the radius. All population sites within the catchment are considered the demand of parks. Eq. 4 shows the calculation of this step.
where
The second step aims to measure the accessibility of the population site. All the supply–demand ratios of parks within the same catchment as step 1 of each population center are summarized, which denotes the number of services for the park which the population center received. The specific calculation is illustrated as Eq. 5.
where
However, it has been pointed out that the assumption of equal access of all population locations within the catchment is problematic (Luo, 2014). Various research studies proposed that an appropriate function
where
As mentioned in Section 2.1.1, there is a distance decay function [f (d)] in the 2SFCA. In this study, the f(d) is mainly related to the following factors: 1) the attraction of the parks and 2) geographical distance between parks and population centers. Compared with previous research, we improved the 2SFCA method with the following aspects.
To measure the attraction of the parks, visitors’ experiences need to be integrated in the accessibility model. People would be recommended by others’ comments when they select a particular park. Also, the mentioned experience scores could be seen as a measure of attractiveness of parks. Therefore, we take the Huff model as the function of the f (d). The Huff model is a famous quantification based on the gravity model and involves the attractors of facilities and distance decay effects between spatial entities (Luo, 2014) (Huff, 1963). Although there were many improvements of the Huff model after it was proposed, the simplest Huff model was an easy and common form. Wang employed it to measure the facility crowdedness with the 2SFCA method (Huff, 1963). Luo and Subal et al. also quantified the probabilities of visiting healthcare influenced by their attractiveness with the classic Huff model (Luo, 2014), (Wang, 2018). In general, it is suitable for our research to understand the trend of attractiveness and chosen probabilities on visitors. The original Huff model was defined as Eq. 7.
where
In addition, some research illustrated that the willingness of visitors would only decrease out of a certain threshold (Li et al., 2019a; Li et al., 2021). We would draw this characteristic with a hybrid Gaussian function. Assuming that there is no travel cost in a certain distance, this means that the probabilities of visitors’ selections are equal to 1, and the travel cost would increase with the Gaussian function to a limited threshold (catchment size) where the probabilities are 0. Eq. 8 illustrated the hybrid Gaussian function
where
There are different distance decay effects when people travel on different modes. For instance, people could bear driving 30 min to a park or other facilities while mostly confuse a 30-min walk to the park, even the geographical distance by walking is five times shorter than it is by driving. As a result, distance impedance coefficient
where
In addition, research shows that there is distinct accessibility for one population site between travel selection as a single way and multiple ways (Xing et al., 2018; Hu et al., 2020; Qin et al., 2020). In this article, we further integrate the four travel modes as a multi-mode model based on the modified 2SFCA method with the Huff model for single mode. The formula for multi-mode is as follows:
where
There are several parameters in the modified 2SFCA model with the Huff model discussed in detail, including the travel cost range without distance decay (the non-decay threshold), the travel cost range without visiting chance (the catchment size), and the distance impedance coefficient
First, the non-decay threshold should be determined, which can be considered the start of the accessibility discount. Governments and urban planners prefer to enclose an appropriate area to meet the convenient demands of residents in daily life. Residents avoid worrying about their time cost in this area. Recently, it has become popular for metropolitans to plan a 15-min community-life circle, which means urban dwellers could access any basic service for their lives with a 15-min walk. Given the related policy of Chinese metropolitans, this circle is a success to arrive at a consensus in the modern society. Also, the standards from acts and regulations pertaining to urban parks are indicative references for researchers (Li et al., 2019a; Subal et al., 2021; Lee and Hong, 2013). Assuming that people who visited a park located in their own 15-min community-life circle take no account of the effects of distance decay, we utilized the actual travel time from the population site to the edge of the circle by other three travel modes (driving, transiting, and riding) as the non-decay threshold. When the travel time was less than this threshold, people would visit these parks with the same chance.
Then, the catchment size (the unreachable threshold) should be defined as the visiting chance, which would vanish out of a particular travel cost. The choice of the unreachable threshold normally varies among authors. For the catchment size, some borrowed the rules from related policies as the informed determination (Li et al., 2019a; Hu et al., 2020) and some confirmed the experience-based threshold in accordance with the actual travel patterns (Li et al., 2021). However, most research studies used the average travel time from the population sites to parks due to their easy acquisition (Qin et al., 2020). To begin with, we calculated the average travel time of all population sites by different travel modes in different periods. Importantly, the average travel time by driving and transiting slightly fluctuated in different periods, while a steady cost was discovered by riding and walking in the same periods. It means that travelling to parks by car or bus would also be influenced by traffic congestion. Compared with that, the eco-friendly travel modes such as riding are unaffected by traffic conditions. More interestingly, a 126-min riding and a 42-min walk to visiting parks are usually outside residents’ time cost range. As a result, we need to find another catchment size for these two travel types. The truth is that more riders and walkers would choose the nearest attractive park as the routine in daily life. In this study, we made further effects on calculating the mean of the minimal travel cost from each population site. Table 1 illustrates the average travel cost and minimal travel cost by four travel modes. Then, the average travel time from the population sites to parks was chosen to detail the catchment size by driving and transiting, and this threshold under the bike mode and walk mode was matched with the average minimal travel time.
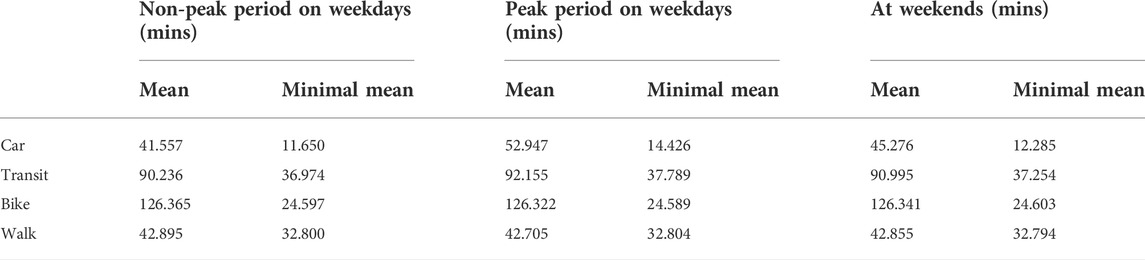
TABLE 1. Average travel cost and minimal travel cost by four travel modes.
More importantly, the distance impedance coefficient
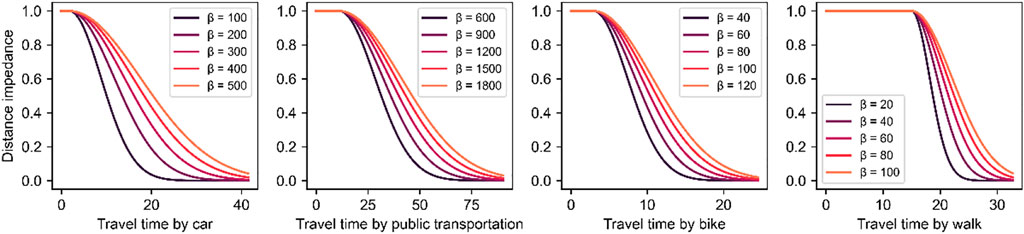
FIGURE 5. Patterns of distance decay of travel cost.
There are various spatial distribution of park accessibility when people travelled by different modes. First of all, we divided the degree of accessibility into six classes for each mode (shown in Figure 6). Also, the results can be described as follows: 1) Chengdu has many population sites with low park accessibility, and park accessibility gradually decreased from downtown to suburb under the four travel modes. 2) Specifically, residents living in these regions are more convenient to visit parks because of high park accessibility, which are Qingyang district and Wuhou district, north area of Jinniu district and Chenghua district, and local area of Longquanyi District, Shuangliu District, and Pidu District in each travel mode, while the population centers in the west area of Longquanyi District, the south area of Shuangliu District, Wenjiang District, and the east area of Shuangliu District have low park accessibility. 3) For each travel mode, park accessibility by riding has a more unbalanced spatial distribution in the whole urban area [shown in Figure 6-(3)], while accessibility of driving mode and public transportation mode have a similar distribution in most regions of Chengdu [shown in Figure 6-(1) and Figure 6-(2)]. Compared with the results of spatial access to parks by car and public transportation, the number of residents with high park accessibility was less for riders, especially for those living in the center of Longquanyi District and Pidu District. It is interesting that the east region of the boundary area linked to Wuhou District and Shuangliu District accessed to parks with more opportunities for riders rather than drivers and travelers by transiting. 4) In terms of walking, the accessibility of parks in the study area was generally low [shown in Figure 6-(4)]. The spatial distribution of high-access zones was similar with those by riding but significantly reduced, which means that the high-accessibility centers by bike also easily acquired the park services through walking. 5) The spatial pattern of accessibility of multiple modes was followed by the characteristics of each of the four travel modes [shown in Figure 6-(5)]. For instance, population sites with high park accessibility by driving and public transportation distributed in the suburb area were also discovered as high-access zones by multiple modes, such as the center of west Shuangliu District and Longquanyi District. Overall, park accessibility of Chengdu still has a large space for promotion. In addition, instead of private car and public transportation, the park accessibility geographically tended to an uneven distribution for riders and walkers. Meanwhile, the number of high-access hotspots with green travel modes was greater than that of others.
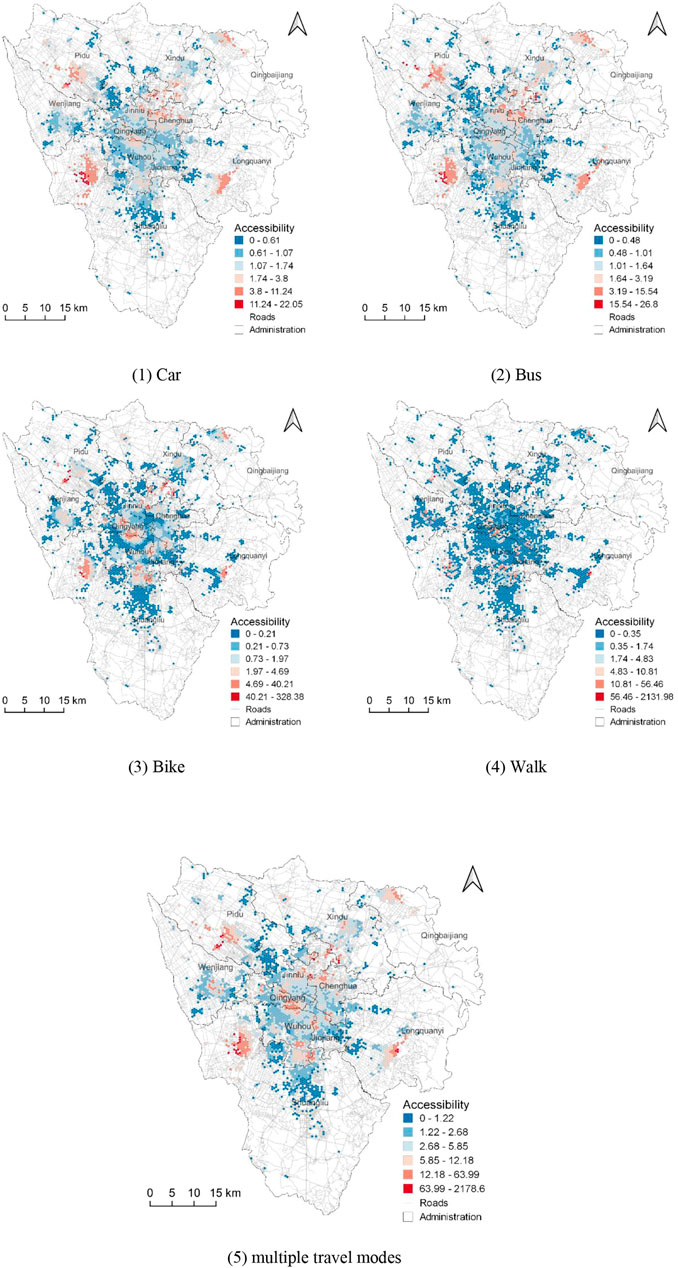
FIGURE 6. Park accessibility of four travel modes.
In order to explore the impact of travel periods on parks’ accessibility of the Chengdu urban area, the research selected 7:00–9:00 as the peak period for daily travel. As shown in Figure 7, the research found that accessibility of drive and multiple travel modes is more susceptible to peak periods: park accessibility of drive and multiple modes was significantly reduced in the peak period especially in Jinniu District and Jinjiang District, while accessibility of bike, public transportation, and walk mode is almost constant at all. As for multiple travel modes, except for several areas with increased park accessibility, during the peak period, they are scattered sporadically within urban area, and almost all regions showed a decreasing trend of park accessibility in Chengdu. In addition, compared with the private car, the park accessibility by public transportation was unaffected by traffic conditions.
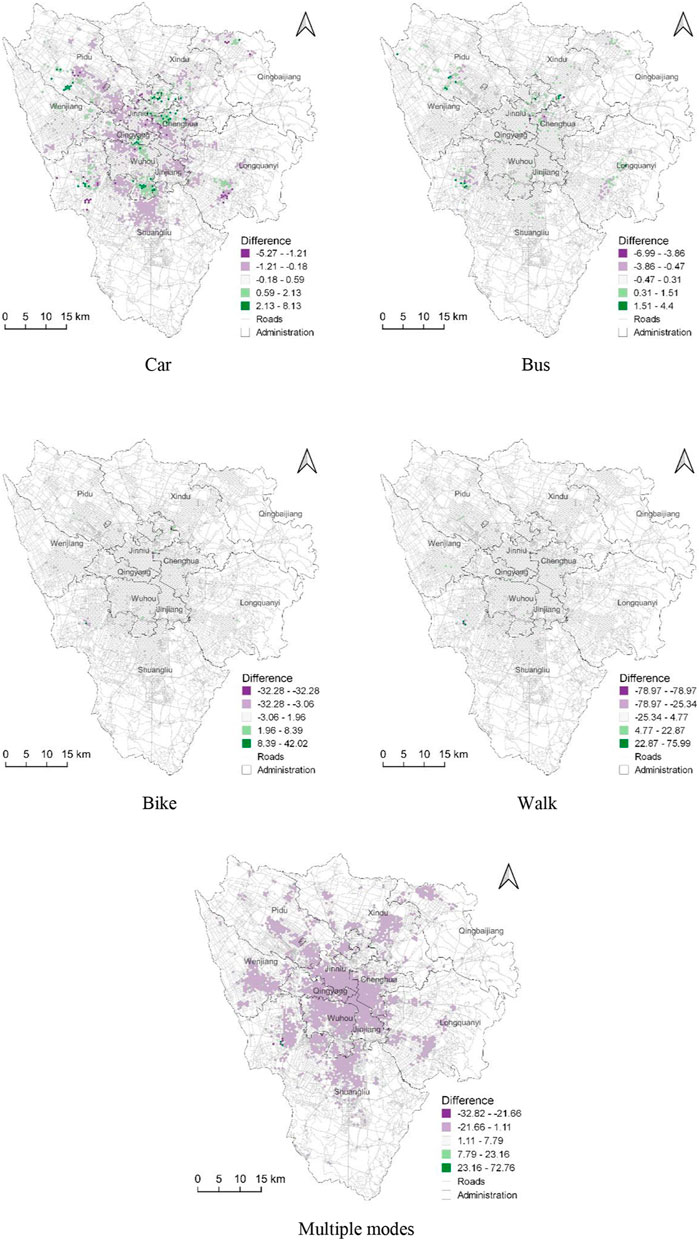
FIGURE 7. Difference of park accessibility by four travel modes between the peak period and non-peak period.
Meanwhile, by revealing the difference of parks’ accessibility between weekdays and weekends, the research found accessibility of driving and multiple modes was reduced, which is similar with the results of travel periods. As shown in Figure 8, park accessibility of most areas in the Chengdu urban area was decreased except for the north of Jinniu District, west of Chenghua District, and northeast of Shuangliu District in driving mode. Almost all spots of Chengdu urban areas were reduced with varying degrees in multiple travel modes. The most obvious decrease of accessibility is the northwest of Shuangliu District and the population gathering area of Longquanyi District. The same conclusion can be drawn that the park accessibility by public transportation hardly varied with the change of weekdays and weekends.
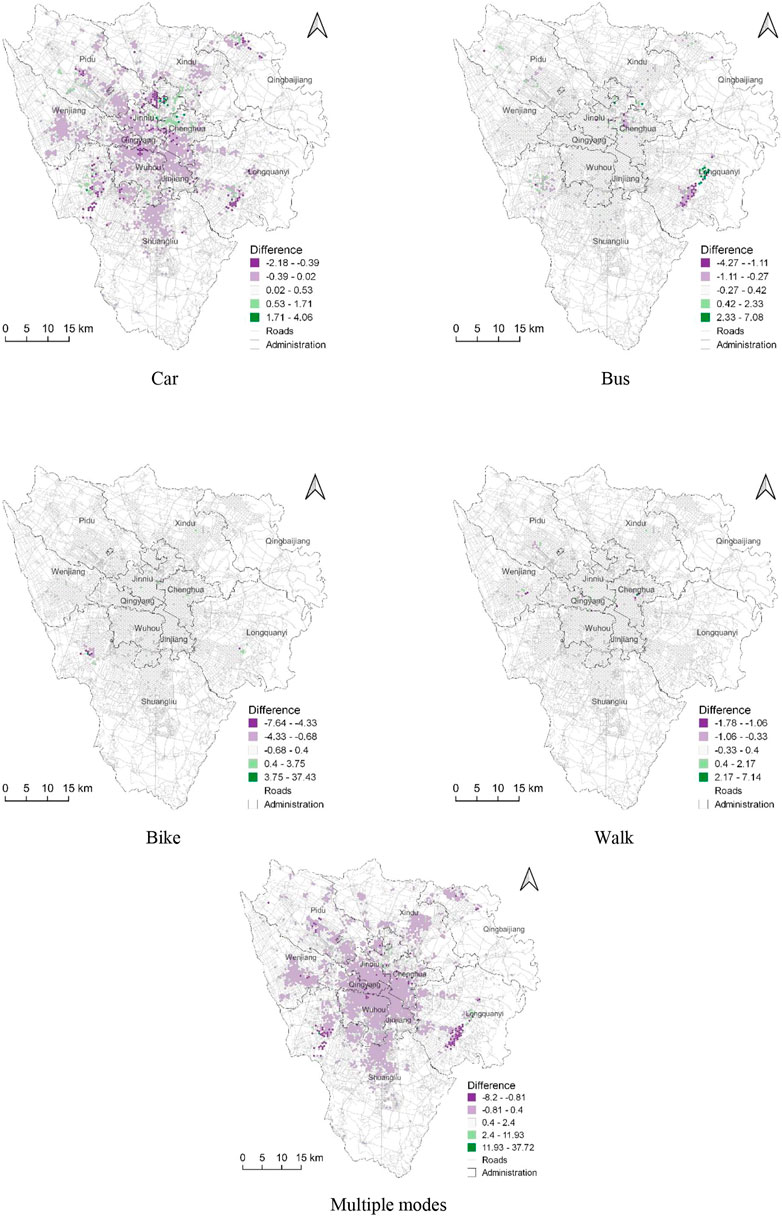
FIGURE 8. Difference of park accessibility by four travel modes between weekdays and weekends.
In order to identify the spatial clustering patterns of spatial access to urban parks, the spatial autocorrelation analysis for park accessibility was applied in this section. Local Moran’s I (local indicator of spatial association or LISA) is an improvement of Global Moran’s I (a spatial autocorrelation statistic), developed by Anselin (1995). There are four types in the LISA, namely, high–high clusters, high–low clusters, low–high clusters, and low–low clusters. High–high clusters and low–low clusters represent clusters with high values and low values in the geographical space, respectively. In other words, these two clusters reveal the hot spots and cold spots for one attribute in the study area. We used Local Moran’s I in GeoDa software and generated LISA cluster maps. Section 3.3 indicated that the accessibility would be generally influenced when people traveled to park by car or multiple modes, while there is little influence for park accessibility by the other three modes. As a result, we further analyzed the spatial aggregation under different periods by driving and multiple modes and under single periods (weekdays) by the other three modes. Figure 9 and Figure 10 illustrated spatial clustering by driving and multiple modes, respectively. The spatial distribution of clusters with high accessibility and low accessibility by other three eco-friendly types is shown in Figure 11.
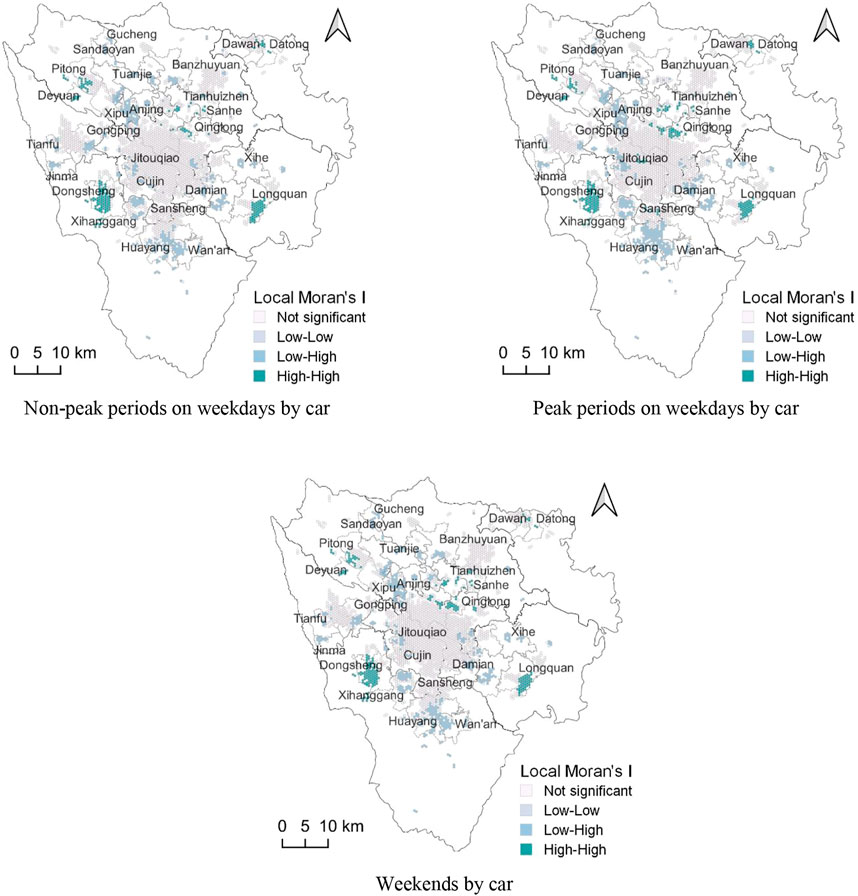
FIGURE 9. Partial clustering of park accessibility by driving in three periods.
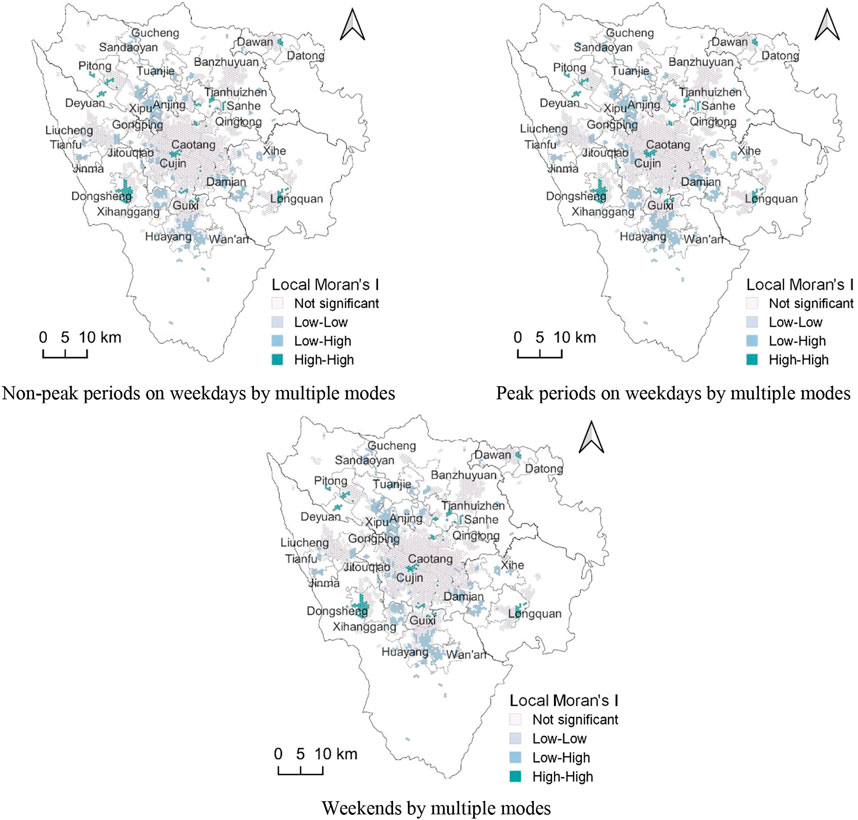
FIGURE 10. Partial clustering of park accessibility by multiple modes in three periods.
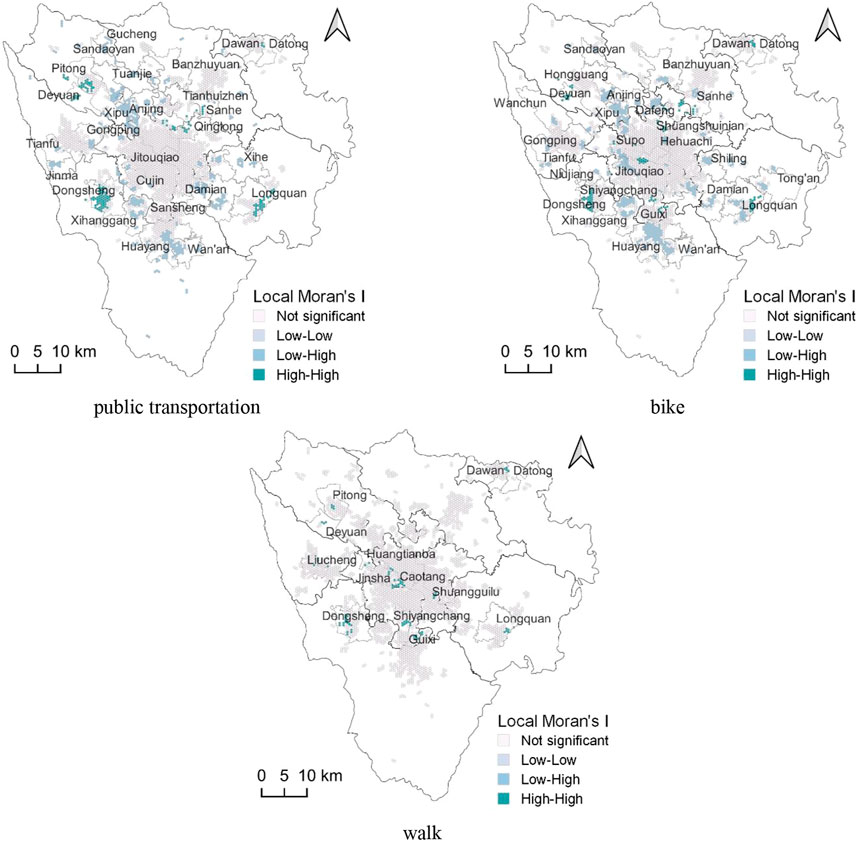
FIGURE 11. Partial clustering of park accessibility by public transportation, bike, and walk.
At the beginning, we explored the spatial patterns of accessibility by a private car in the different time periods. As shown in Figure 9, although the difference of park accessibility between three periods was great, the trend of them was similarly changed. On the one hand, traffic condition might have a negative influence on spatial access when people drive to parks, while the population sites are clustered at the similar regions. For example, hotspots with “high–high clustering” such as Qingtong Subdistrict narrowed on peak periods during weekdays and weekends. On the other hand, some residents are superior to the traffic condition due to the short distance between homes and parks, and the population sites increased insignificantly during the peak periods on weekdays and weekends such as those surrounding at Longquan Subdistrict. In addition, there are cold spots gathering in Huayang, Damian, and Xipu subdistricts. Park accessibility in these areas is inherently low, so it did not show a downward trend on peak periods of weekdays and weekends. It means that residents living in these places found it inconvenient to access the parks for each of the three periods.
The study measured Local Moran’s I of multiple travel mode accessibility at different time periods, and the results in Figure 10 showed that there was no significant difference in the distribution of hot spots and cold spots in the three periods. Compared with the other two travel periods, Guixi Subdistrict, Huayang Subdistrict, and Wanan Subdistrict have more high–low clustering spots during the peak of weekdays. The reason may be that this area is located in the high-tech development region of Chengdu, and traffic jam is greater than that of other areas in the peak period, which leads to more obvious differences in local accessibility.
There are three green travel modes in the modern society: public transportation, bike, and walk. As a result, the pressure of accessibility to parks by them would not meet the threat in terms of traffic condition. However, it is different for these three types to shape the spatial distribution of park accessibility (shown in Figure 11). For public transportation, hot spots were mainly clustered in Dongsheng Subdistrict and Longquan Subdistrict like driving mode, while cold spots expanded at the west region such as Anjing Subdistrict. Comparing with driving and public transporting, residents are more willing to walk and ride to parks near their home. However, in cycling and walking mode, there are only few scattered hotspots with high–high park accessibility. This also reflects the uneven distribution of parks in Chengdu. There is a new region considered high-access spots located at downtown (Caotang subdistrict) by riding and walking. This region was also detected for walkers as one of the few hotspots by this travel mode, such as Dongsheng and Dawan.
The results of Section 3.2 showed that the spatial access to parks in the suburb area was similar to some sites in downtown, even higher by driving and transiting. However, the population sites near the junction of downtown and suburb experienced low accessibility by any of the four modes. The reasons might be the unbalanced supply–demand problems and unreasonable distribution of parks. It means that the high-density population living in the downtown area allocated limited public parks, and the suburb population sites with low density near the public parks could enjoy the parks both in downtown and suburb. To further understand the inequality in park accessibility due to unbalanced distribution, which could bring a better opportunity for residents to balance the life quality of them, “park deserts” was proposed by this study.
There are some studies that discussed about food deserts (Walker et al., 2010) and healthcare deserts (Li et al., 2021). The public services are not enough for people who lived in these desert areas. Similarly, we proposed the “park deserts” to describe an area devoid of a park or access to park services is limited. Many socioeconomic factors could be involved in the inequality measurement of park accessibility. In this study, we evaluated the influence from population and house price to park accessibility. On the one hand, high-density population sites should receive appropriate park accessibility. At the same time, population sites with high house prices should also be full of a range of public services, including public parks. Comparing the spatial access to parks with these two factors, we attempt to identify park deserts with a simple spatial statistic method, Bivariate Local Moran’s I, for different populations. The non-peak park accessibility on weekdays would be employed to discover the relationship. There are two reasons: 1) the result in this period could describe the normal phenomenon and 2) the tendency of park accessibility in the study area follows a set pattern in different periods, which means that the population sites with high accessibility at the non-peak weekday period would share the same accessibility but with different values.
Because of different travelling results, we identified the park deserts determined by population under four travel types and multiple modes at the beginning. Figure 12 shows the number of population sites which are tagged as park deserts under different travel modes. The blue line indicated a slight fluctuation between those modes. As a result, we chose these park deserts caused by population under multiple travel modes, as illustrated in Figure 12. The population sites distributed in the city center such as Yongquan Subdistrict, Jitouqiao Subdistrict, and Chenglonglu Subdistrict are mainly identified as park deserts. Also, some population sites near downtown are high-density population yet with low-level accessibility. In the study area, park accessibility affected by house price was similar under different modes (Figure 12). Residents living at the city center, the middle region in Jinniu District, and the north region in Jinjiang District experienced an inadequate park service while they still need to pay more on their houses (as shown in Figure 12). However, the high house price might be influenced by educational resources and convenient transportation systems. It is interesting and crucial for the researcher to focus on the impact of park accessibility on house price in the future. In addition, increasing the density of the road network, adding pedestrian bridges, adding park entrances and exits, and adding small and micro public green spaces along the roads can effectively improve park deserts.
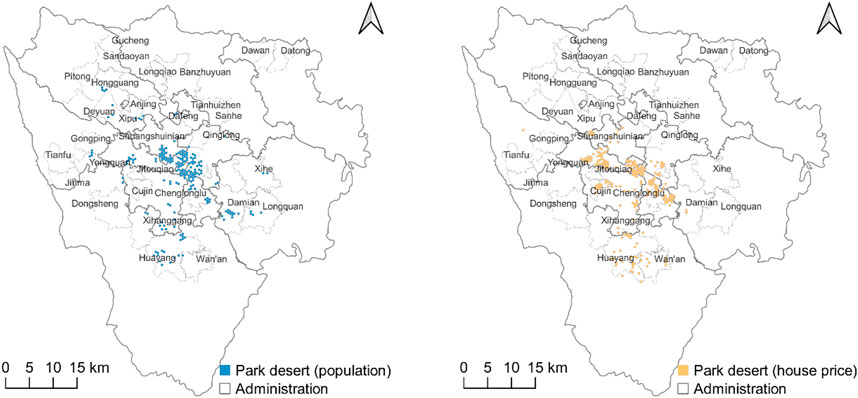
FIGURE 12. Park deserts determined by house price and population in Chengdu.
Although our study was carefully executed, there is still room for improvement in future research. The first challenge is a typical limitation of the big-data-based research, the data bias problem. For instance, it is a key issue on how to eliminate the difference between the number of positive comments and negative comments despite applying normalization before calculating the experience score. Also, most comments are generated by young adults or teenagers, and we hardly understand the experiences of elders who visited a park. Second, the experience score using BosonNLP could be seen as a new shot to reflect the intuitive attractiveness of parks. However, some machine learning methods (Wang et al., 2021) and extractions from geo-tagged images (Zhang et al., 2020b) could evaluate the satisfaction of city dwellers to parks from multidimensional indicators. Further research needs to pay more attention to fine evaluation of the attractors influencing the emotions of residents. More importantly, this study focused on the famous parks with a relatively large area, while the trend is that road-side parks and micro public green space play a vital role in fitting the needs of leisure in urban construction. In the equation of 2SFCA, the area of parks is the predominated parameter. It means that parks with large area could supply more populations rather than those with small area. The small parks might give people more potential psychological support in reality. As a result, how to measure the correct supplements of the small landscape in the 2SFCA method would be an interesting question to solve in the future.
Unbalanced supply–demand problem between urban parks and residential areas is common in many cities of China. By taking “Park City” construction of Chengdu as an opportunity, we choose accessibility to reveal the unbalanced distribution of urban parks, guiding Chengdu to planning and constructing parks scientifically and rationally. With social media platforms becoming popular in recent years, people would be categorized as sensors to freely express their feelings. In this research, the spatial accessibility of urban parks under four different travel modes (driving, transiting, biking, and walking) and multiple modes was analyzed by integrating the actual experiences of visitors and real travel time. It offers a more realistic and human-oriented way to understand the accessibility and opportunities that residents acquired in the urban area.
At the beginning, this research abstracted the comments of visitors from social media data as the experience scores with BosonNLP and the Huff model, which attracts parks to those visitors. Then, it was introduced into the 2SFCA method as a parameter to reflect the park accessibility. We selected the built-up area of Chengdu as the study area. After comparing and analyzing park accessibility under different travel modes and periods, the conclusions were drawn as follows: 1) park accessibility of Chengdu still has a large space for promotion. 2) Residents living in these regions are more convenient to visit parks because of high park accessibility, which are Qingyang District and Wuhou District, north area of Jinniu District and Chenghua district, and local area of Longquanyi District, Shuangliu District, and Pidu District. In addition, riders and walkers are more likely to go to the nearest park. 3) The spatial access to parks would be affected significantly during the peak hours and weekends by driving and multiple travel modes, while the accessibility of other travel modes had little influence. 4) The spatial aggregation was more obvious during the peak hours of weekdays under the driving modes, while there are obvious cold spot areas distributed continuously for riders. 5) Park deserts were found in Yongquan Subdistrict, Jitouqiao Subdistrict, and Chenglonglu Subdistrict which are near downtown. The results of this study can be the reference for rational distribution of urban parks and provided scientific support for Chengdu to build a park city and realize the equalization of park recreation services in the build-up area. Overall, the accessibility of parks within the central urban area of Chengdu needs to be improved. In the downtown, due to the contradiction between the huge population base and the limited use of space, the service capacity of the park is unable to bear the strong demand of the public. On the one hand, Chengdu must make rational use of small and micro spaces in the city to add greenery to the corners of the city, and on the other hand, as a pilot project for the construction of park city in China, Chengdu needs to integrate parks with other surrounding industries to inspire the entertainment, economy, and tourism function of parks and achieve the goal of city–park integration.
The original contributions presented in the study are included in the article/Supplementary Material. Further inquiries can be directed to the corresponding author.
All authors contributed to the conception and design of the study. RT, RW, and DY established the methodology and models. YW, YC, and WC contributed to the investigation. RT and DY collected the research data. RT and RW wrote the first draft of the manuscript. RT, RW, YR, and YC contributed to manuscript revision, read, and approved the submitted version. WC and XW quested for the funding support. All authors have read and agreed to the published version of the manuscript.
This study received funding from “Comprehensive Service Evaluation of Urban Green-way” and “Research and Practice Exploration of Park City Construction”. These funders was not involved in the study design, collection, analysis, interpretation of data, the writing of this article, or the decision to submit it for publication.
The authors kindly thank the China Urban Construction Design & Research Institute CO., LTD. for the financial support.
RT, YW, YC, WC, and XW were employed by China Urban Construction Design & Research Institute Co. Ltd.
The remaining authors declare that the research was conducted in the absence of any commercial or financial relationships that could be construed as a potential conflict of interest.
All claims expressed in this article are solely those of the authors and do not necessarily represent those of their affiliated organizations, or those of the publisher, the editors, and the reviewers. Any product that may be evaluated in this article, or claim that may be made by its manufacturer, is not guaranteed or endorsed by the publisher.
Anselin, L. (1995). Local indicators of spatial association-LISA. Geogr. Anal. 27 (2), 93–115. doi:10.1111/j.1538-4632.1995.tb00338.x
Aram, F., Solgi, E., and Holden, G. (2019). The role of green spaces in increasing social interactions in neighborhoods with periodic markets. Habitat Int. 84, 24–32. doi:10.1016/j.habitatint.2018.12.004
Bauer, J., and Groneberg, D. A. (2016). Measuring spatial accessibility of health care providers – introduction of a variable distance decay function within the floating catchment area (FCA) method. PloS one 11 (7), e0159148. doi:10.1371/journal.pone.0159148
Berechman, J. (2010). Transportation, Temporal, and Spatial Components of Accessibility, by Lawrence D. Burns[J]. Geographical Analysis 13 (2), 185–187. doi:10.1111/j.1538-4632.1981.tb00726.x
Bertram, C., and Rehdanz, K. (2015). The role of urban green space for human well-being. Ecol. Econ. 120, 139–152. doi:10.1016/j.ecolecon.2015.10.013
Bryant, J., and Delamater, P. L. (2019). Examination of spatial accessibility at micro- and macro-levels using the enhanced two-step floating catchment area (E2SFCA) method. Ann. GIS 25 (3), 219–229. doi:10.1080/19475683.2019.1641553
Cheng, G., Zeng, X., Duan, L., Lu, X., Sun, H., Jiang, T., et al. (2016). Spatial difference analysis for accessibility to high level hospitals based on travel time in Shenzhen, China. Habitat Int. 53, 485–494. doi:10.1016/j.habitatint.2015.12.023
Cjj/T85-2017, (2017). Standard for classification of urban green space[S]. Beijing: Ministry of Housing and Urban-Rural Development of the People's Republic of China.
Cw, A., Gqs, B., and Sc, A. (2020). Effects of physical and psychological factors on users’ attitudes, use patterns, and perceived benefits toward urban parks. Urban Forestry & Urban Greening 51. doi:10.1016/j.ufug.2020.126691
Dai, D. (2011). Racial/ethnic and socioeconomic disparities in urban green space accessibility: Where to intervene?[J]. Landsc. Urban Plan. 102 (4), 234–244. doi:10.1016/j.landurbplan.2011.05.002
Dalvi, M. Q., and Martin, K. M. (1976). The measurement of accessibility: Some preliminary results. Transportation 5 (1), 17–42. doi:10.1007/bf00165245
Dony, C. C., Delmelle, E. M., and Delmelle, E. C. (2015). Re-Conceptualizing accessibility to parks in multi-modal cities: A variable-width floating catchment area (vfca) method. Landsc. Urban Plan. 143, 90–99. doi:10.1016/j.landurbplan.2015.06.011
Ga/T 115-2020, (2020). Evaluation method of road traffic congestion degree[S]. Beijing: The Ministry of Public Security of the People's Republic of China.
Geurs, K. T., and Van Wee, B. (2004). Accessibility evaluation of land-use and transport strategies: Review and research directions. J. Transp. Geogr. 12 (2), 127–140. doi:10.1016/j.jtrangeo.2003.10.005
Giles-Corti, B., Broomhall, M. H., Knuiman, M., Collins, C., Douglas, K., Ng, K., et al. (2005). Increasing walking: How important is distance to, attractiveness, and size of public open space? Am. J. Prev. Med. 28 (2), 169–176. doi:10.1016/j.amepre.2004.10.018
Gong, S., Gao, Y., and Zhang, F., (2021). Evaluating healthcare resource inequality in Beijing, China based on an improved spatial accessibility measurement[J]. Trans. GIS.
Guagliardo, M. F. (2004). Spatial accessibility of primary care: Concepts, methods and challenges[J]. Int. J. health Geogr. 3 (1), 1. doi:10.1186/1476-072X-3-3
Guedes Vidal, D., Teixeira, C., Oliveira Fernandes, C., Olszewska-guizzo, A., Dias, R. C., Vilaca, H., et al. (2022). Patterns of human behaviour in public urban green spaces: On the influence of users' profiles, surrounding environment, and space design. Urban For. Urban Green. 74, 127668. doi:10.1016/j.ufug.2022.127668
Hansen, W. G. (1959). How accessibility shapes land use. J. Am. Inst. planners 25 (2), 73–76. doi:10.1080/01944365908978307
Hartig, T., Mitchell, R., De Vries, S., and Frumkin, H. (2014). Nature and health. Annu. Rev. Public Health 35, 207–228. doi:10.1146/annurev-publhealth-032013-182443
Hu, S., Song, W., Li, C., and Lu, J. (2020). A multi-mode Gaussian-based two-step floating catchment area method for measuring accessibility of urban parks. Cities 105, 102815. doi:10.1016/j.cities.2020.102815
Huff, D. L. (1963). A probabilistic analysis of shopping center trade areas. Land Econ. 39 (1), 81–90. doi:10.2307/3144521
Joseph, A. E., and Bantock, P. R. (1982). Measuring potential physical accessibility to general practitioners in rural areas: A method and case study. Soc. Sci. Med. 16 (1), 85–90. doi:10.1016/0277-9536(82)90428-2
Kroeger, T., Escobedo, F. J., Hernandez, J. L., Varela, S., Delphin, S., Fisher, J. R. B., et al. (2014). Reforestation as a novel abatement and compliance measure for ground-level ozone. Proc. Natl. Acad. Sci. U. S. A. 111 (40), E4204–E4213. doi:10.1073/pnas.1409785111
Larsen, K., and Gilliland, J. (2008). Mapping the evolution of 'food deserts' in a Canadian city: Supermarket accessibility in London, Ontario, 1961–2005. Int. J. health Geogr. 7 (1), 16. doi:10.1186/1476-072x-7-16
Lee, G., and Hong, I. (2013). Measuring spatial accessibility in the context of spatial disparity between demand and supply of urban park service. Landsc. Urban Plan. 119, 85–90. doi:10.1016/j.landurbplan.2013.07.001
Li, F., Li, F., Li, S., and Long, Y. (2019). Deciphering the recreational use of urban parks: Experiments using multi-source big data for all Chinese cities[J]. Sci. Total Environ. 701, 134896. doi:10.1016/j.scitotenv.2019.134896
Li, F., Yao, N., Liu, D., Liu, W., Sun, Y., Cheng, W., et al. (2021). Explore the recreational service of large urban parks and its influential factors in city clusters – experiments from 11 cities in the Beijing-Tianjin-Hebei region. J. Clean. Prod. 314, 128261. doi:10.1016/j.jclepro.2021.128261
Li, L., Du, Q., Ren, F., and Ma, X. (2019). Assessing spatial accessibility to hierarchical urban parks by multi-types of travel distance in shenzhen, China. Int. J. Environ. Res. Public Health 16 (6), 1038. doi:10.3390/ijerph16061038
Li, Z., Wei, H., Wu, Y., Su, S., Wang, W., and Qu, C. (2019). Impact of community deprivation on urban park access over time: Understanding the relative role of contributors for urban planning. Habitat Int. 92, 102031. doi:10.1016/j.habitatint.2019.102031
Liu, Y., Liu, X., Gao, S., Gong, L., Kang, C., Zhi, Y., et al. (2015). Social sensing: A new approach to understanding our socioeconomic environments. Ann. Assoc. Am. Geogr. 105 (3), 512–530. doi:10.1080/00045608.2015.1018773
Luo, J. (2014). Integrating the huff model and floating catchment area methods to analyze spatial access to healthcare services. Trans. GIS 18 (3), 436–448. doi:10.1111/tgis.12096
Luo, W., and Qi, Y. (2009). An enhanced two-step floating catchment area (E2SFCA) method for measuring spatial accessibility to primary care physicians. Health & place 15 (4), 1100–1107. doi:10.1016/j.healthplace.2009.06.002
Luo, W., and Wang, F. (2003). Measures of spatial accessibility to health care in a GIS environment: Synthesis and a case study in the chicago region. Environ. Plann. B. Plann. Des. 30 (6), 865–884. doi:10.1068/b29120
Luo, W., and Whippo, T. (2012). Variable catchment sizes for the two-step floating catchment area (2SFCA) method. Health & place 18 (4), 789–795. doi:10.1016/j.healthplace.2012.04.002
Mao, L., and Nekorchuk, D. (2013). Measuring spatial accessibility to healthcare for populations with multiple transportation modes. Health & place 24, 115–122. doi:10.1016/j.healthplace.2013.08.008
McGrail, M. R., and Humphreys, J. S. (2009). Measuring spatial accessibility to primary care in rural areas: Improving the effectiveness of the two-step floating catchment area method. Appl. Geogr. 29 (4), 533–541. doi:10.1016/j.apgeog.2008.12.003
McGrail, M. R., and Humphreys, J. S. (2014). Measuring spatial accessibility to primary health care services: Utilising dynamic catchment sizes. Appl. Geogr. 54, 182–188. doi:10.1016/j.apgeog.2014.08.005
Moulay, A., Ujang, N., and Said, I. (2017). Legibility of neighborhood parks as a predicator for enhanced social interaction towards social sustainability. Cities 61, 58–64. doi:10.1016/j.cities.2016.11.007
Ngui, A. N., and Vanasse, A. (2012). Assessing spatial accessibility to mental health facilities in an urban environment[J]. Spatial spatio-temporal Epidemiol. 3 (3), 195–203. doi:10.1016/j.sste.2011.11.001
Onega, T., Duell, E. J., Shi, X., Wang, D., Demidenko, E., and Goodman, D. (2008). Geographic access to cancer care in the U.S. Cancer 112 (4), 909–918. doi:10.1002/cncr.23229
Qin, J., Liu, Y., Yi, D., Sun, S., and Zhang, J. (2020). Spatial accessibility analysis of parks with multiple entrances based on real-time travel: The case study in beijing. Sustainability 12 (18), 7618. doi:10.3390/su12187618
Radke, J., and Mu, L. (2000). Spatial decompositions, modeling and mapping service regions to predict access to social programs. Ann. GIS 6 (2), 105–112. doi:10.1080/10824000009480538
Rankin, R. A. (1964). CA rogers, packing and covering,” in Proceedings of the Edinburgh Mathematical Society, No. 5414. Cambridge Tracts in Mathematics and Mathematical Physics Cambridge University Press, 247.
Stewart, J. Q. (1948). Demographic gravitation: Evidence and applications. Sociometry 11 (1/2), 31–58. doi:10.2307/2785468
Subal, J., Paal, P., and Krisp, J. M. (2021). Quantifying spatial accessibility of general practitioners by applying a modified huff three-step floating catchment area (MH3SFCA) method[J]. Int. J. Health Geogr. 20 (1). doi:10.1186/s12942-021-00263-3
Tao, Z., Cheng, Y., Zheng, Q., and Li, G. (2018). Measuring spatial accessibility to healthcare services with constraint of administrative boundary: A case study of yanqing district, Beijing, China[J]. Int. J. Equity Health 17 (1). doi:10.1186/s12939-018-0720-5
Thanh-Hien Pham, T., Labbé, D., Lachapelle, Ugo, and al, st (2019). Perception of park access and park use amongst youth in Hanoi: How cultural and local context matters. Landsc. Urban Plan. 189, 189156–189165. doi:10.1016/j.landurbplan.2019.04.021
Walker, R. E., Keane, C. R., and Burke, J. G. (2010). Disparities and access to healthy food in the United States: A review of food deserts literature. Health. place 16 (5), 876–884. doi:10.1016/j.healthplace.2010.04.013
Wan, N., Zou, B., and Sternberg, T. (2012). A three-step floating catchment area method for analyzing spatial access to health services. Int. J. Geogr. Inf. Sci. 26 (6), 1073–1089. doi:10.1080/13658816.2011.624987
Wang, D., Brown, G., Liu, Y., and Mateo-Babiano, I. (2015). A comparison of perceived and geographic access to predict urban park use. Cities 42, 85–96. doi:10.1016/j.cities.2014.10.003
Wang, D., Brown, G., and Liu, Y. (2015). The physical and non-physical factors that influence perceived access to urban parks. Landsc. urban Plan. 133, 53–66. doi:10.1016/j.landurbplan.2014.09.007
Wang, F. (2018). Inverted two-step floating catchment area method for measuring facility crowdedness. Prof. Geogr. 70 (2), 251–260. doi:10.1080/00330124.2017.1365308
Wang, Y., Chen, B. Y., Yuan, H., Wang, D., Lam, W. H., and Li, Q. (2018). Measuring temporal variation of location-based accessibility using space-time utility perspective. J. Transp. Geogr. 73, 13–24. doi:10.1016/j.jtrangeo.2018.10.002
Wang, Z., Miao, Y., and Xu, M. (2021). Revealing the differences of urban parks’ services to human wellbeing based upon social media data[J]. Urban Forestry & Urban Greening, 127233.
Wright Wendel, H. E., Zarger, R. K., and Mihelcic, J. R. (2012). Accessibility and usability: Green space preferences, perceptions, and barriers in a rapidly urbanizing city in Latin America[J]. Landsc. Urban Plan. 107 (3), 272–282. doi:10.1016/j.landurbplan.2012.06.003
Wong, D. W. S. (2004). “The modifiable areal unit problem (MAUP)[M],” in WorldMinds: Geographical perspectives on 100 problems (Dordrecht: Springer), 571
Wood, S. A., Guerry, A. D., Silver, J. M., and Lacayo, M. (2013). Using social media to quantify nature-based tourism and recreation[J]. Sci. Rep. 3 (1), 1. doi:10.1038/srep02976
Wu, C., Ye, X., Du, Q., and Luo, P. (2017). Spatial effects of accessibility to parks on housing prices in Shenzhen, China. Habitat Int. 63, 45–54. doi:10.1016/j.habitatint.2017.03.010
Xia, Z., Li, H., Chen, Y., and Yu, W. (2019). Integrating spatial and non-spatial dimensions to measure urban fire service access. ISPRS Int. J. Geoinf. 8 (3), 138. doi:10.3390/ijgi8030138
Xiao, Y., Wang, D., and Fang, J. (2019). Exploring the disparities in park access through mobile phone data: evidence from Shanghai, China. Landsc. urban Plan. 181, 80–91. doi:10.1016/j.landurbplan.2018.09.013
Xing, L., Liu, Y., and Liu, X. (2018). Measuring spatial disparity in accessibility with a multi-mode method based on park green spaces classification in Wuhan, China. Appl. Geogr. 94, 251–261. doi:10.1016/j.apgeog.2018.03.014
Xu, M., Xin, J., Su, S., Weng, M., and Cai, Z. (2017). Social inequalities of park accessibility in Shenzhen, China: The role of park quality, transport modes, and hierarchical socioeconomic characteristics. J. Transp. Geogr. 62, 38–50. doi:10.1016/j.jtrangeo.2017.05.010
Yu, H., and Shaw, S. L. (2007). “Revisiting Hägerstrand’s time-geographic framework for individual activities in the age of instant access[M],” in Societies and cities in the age of instant access (Dordrecht: Springer), 103
Zhang, B., Gao, J., and Yang, Y. (2014). The cooling effect of urban green spaces as a contribution to energy-saving and emission-reduction: A case study in beijing, China. Build. Environ. 76, 37–43. doi:10.1016/j.buildenv.2014.03.003
Zhang, F., Zu, J., Hu, M., Zhu, D., Kang, Y., Gao, S., et al. (2020). Uncovering inconspicuous places using social media check-ins and street view images. Comput. Environ. Urban Syst. 81, 101478. doi:10.1016/j.compenvurbsys.2020.101478
Zhang, L., Zhou, S., Kwan, M. P., Chen, F., and Lin, R. (2018). Impacts of individual daily greenspace exposure on health based on individual activity space and structural equation modeling. Int. J. Environ. Res. Public Health 15 (10), 2323. doi:10.3390/ijerph15102323
Keywords: accessibility, travel modes, big data, city parks, spatial analysis
Citation: Tan R, Wang R, Wang Y, Yi D, Chen Y, Cai W and Wang X (2022) The Park city perspective study: Revealing the park accessibility influenced by experiences of visitors under different travel modes. Front. Environ. Sci. 10:924996. doi: 10.3389/fenvs.2022.924996
Received: 21 April 2022; Accepted: 19 August 2022;
Published: 14 September 2022.
Edited by:
Farshid Aram, Polytechnic University of Madrid, SpainReviewed by:
Paloma Cariñanos, University of Granada, SpainCopyright © 2022 Tan, Wang, Wang, Yi, Chen, Cai and Wang. This is an open-access article distributed under the terms of the Creative Commons Attribution License (CC BY). The use, distribution or reproduction in other forums is permitted, provided the original author(s) and the copyright owner(s) are credited and that the original publication in this journal is cited, in accordance with accepted academic practice. No use, distribution or reproduction is permitted which does not comply with these terms.
*Correspondence: Xiangchun Wang, d2FuZ3hpYW5nY2h1bkBjdWNkLmNu
†These authors have contributed equally to this work and share first authorship
Disclaimer: All claims expressed in this article are solely those of the authors and do not necessarily represent those of their affiliated organizations, or those of the publisher, the editors and the reviewers. Any product that may be evaluated in this article or claim that may be made by its manufacturer is not guaranteed or endorsed by the publisher.
Research integrity at Frontiers
Learn more about the work of our research integrity team to safeguard the quality of each article we publish.