
94% of researchers rate our articles as excellent or good
Learn more about the work of our research integrity team to safeguard the quality of each article we publish.
Find out more
ORIGINAL RESEARCH article
Front. Environ. Sci., 19 August 2022
Sec. Environmental Informatics and Remote Sensing
Volume 10 - 2022 | https://doi.org/10.3389/fenvs.2022.924440
 Cristina Covătaru1,2*
 Cornelis Stal3
 Mihai Florea1,4
 Ionela Opriș1Corina Simion5
 Ileana Rădulescu5Romeo Călin5Theodor Ignat1,6
 Cristina Ghiță1
 Cătălin Lazăr1*
Through time, both natural and cultural heritage have unfortunately been under threat due to multiple environmental and human-induced factors, which are likely to trigger various hazards such as soil erosion, landslides, or land collapse. The analysis of old cartographic material, aerial imagery, and satellite imagery has been used in multiple studies to observe and understand the changes that archaeological sites have undergone over the last centuries. These efforts are intended, among other things, to raise awareness of the threats affecting cultural heritage and prevent damages and preserve tangible evidence of the distant past. In this study, historical maps and satellite imagery were analyzed to observe how the landscape in the Mostiștea Valley (Romania) has been used over the last 230 years and how the land use has affected the cultural heritage. Land cover and land use (LCLU) changes in the Mostiștea Valley have occurred due to numerous natural and anthropic forces. These changes have resulted in the damage of tangible heritage in the area with varying degrees of intensity. The results of this study allow the quantification of the magnitude of these changes and their impact on different sites in the region.
Cultural heritage is an important legacy of the past that must be preserved for the next generation (Kutut, Lepkova and Źróbek, 2021), and it is divided by UNESCO Operational Guidelines UNESCO World Heritage (2021) into cultural heritage, natural heritage, mixed heritage, and cultural landscapes. Furthermore, cultural heritage can be divided into tangible heritage, such as movable, immovable, and underwater categories, and intangible heritage (Orr, Richards and Fatorić, 2021; Centre, 2022).
When speaking about archeological sites, human-related processes including technological advances, population growth, pollution, or planned landscape development have massively affected this type of heritage, resulting in partial damage or total loss of the cultural heritage. A second array of factors that act directly on on-site degradation is caused by a variety of natural hazards such as climate changes, hydrological risks, geomorphological, or biophysical hazards, leading to increased erosion, flooding, changes in humidity, etc. (Colette, 2007; Micle, 2014; Fatorić and Seekamp, 2017; Agapiou, Lysandrou and Hadjimitsis, 2020). Finally, archeological sites are sometimes affected by management problems, such as lack of financial resources and knowledge and inadequate or absence of site management.
The presented research aims to track the human impact on the preservation of the archeological sites from Mostiștea Valley (Romania) by analyzing cartographic sources and old satellite imagery. For this study, we focus on land cover and land use (LCLU) changes that occurred in the Mostiștea Valley within a 10 km radius from the mainstream over the last 230 years. In addition, this analysis aims to understand the relation between LCLU modification and several archeological site deterioration, destruction, or disappearance.
The Mostiștea Valley is an exciting micro-region in terms of archeological discoveries and exploration of cultural heritage. As a result, many archeological sites have been identified since the second decade of the last century. However, many of these sites are endangered by various landscape changes, triggered by human intervention. Notably, massive agricultural development (e.g., enormous irrigation systems, river damming, and swamp-draining) took place over the last 50 years, which inevitably led to gradual degradation and destruction of the original landscape and cultural heritage.
Previous studies performed in the targeted area had managed to analyze the landscape modification addressing various issues published in several articles and Ph.D. theses (Ghită, 2008a; Oberländer-Târnoveanu and Bem, 2009; Oberländer-Târnoveanu, 2010; Dolocan, 2011; Dolocan, 2012; Grecu et al., 2013; Crăciunescu, 2017). The first series of studies focuses firmly on flora evolution over the last 200 years (Dolocan, 2011; Dolocan, 2012) and on the geomorphological alterations of the area, without considering the local cultural heritage (Ghiţă, 2008a; Ghiţă, 2008b; Grecu et al., 2014). The second series of studies is based on remote sensing methods and techniques to map and monitor continuously degraded landscape features with archeological potential (Oberländer-Târnoveanu and Bem, 2009; Oberländer-Târnoveanu, 2010). The third series of research sought to combine these data to detect the modification of the archeological landscape over the last 200 years and how these changes have affected the loss and degradation of cultural heritage (Crăciunescu, 2017).
Our analysis contributes to the previous research by extending the research area and by tracking the degradation of some archeological sites in relation to LCLU changes. A more detailed understanding of the link between heritage degradation and LCLU change is sought. From a practical perspective, this study allows the identification of regions and sites that are under severe threat. This analysis may assist stakeholders to develop protective measures, using site prioritizing lists.
This study focuses on the Mostiștea Valley, located in southeastern Romania, extending over the boundaries of several counties including Ilfov, Călărași, and Ialomița (Figure 1). The hydrographic network consists in the main course of the Mostiștea river and its tributaries (Corâta on the right side and Argova, Ciorani, Colceag, Ghiula, and Milotina on the left side), which in turn have their own tributaries (e.g., Cucuveanu, Suliman, Church Valley, and Vânăta) (Mihăilescu, 1925; Ghiţă, 2008b; Serbănescu and Sandric, 2012). The Mostiștea river itself measures a total length of 92 km and drains the plain over an area of 1734 km2, along with its tributaries (Ghită, 2008a).
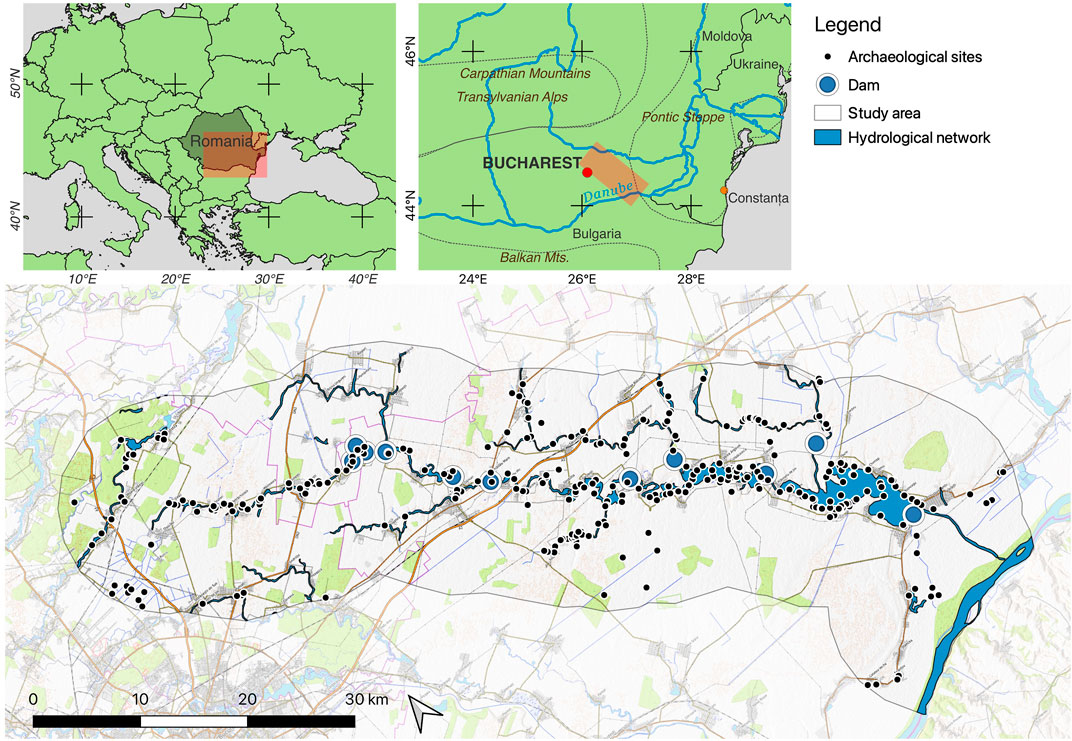
FIGURE 1. Study area and site distribution on Mostiștea Valley, SE Romania.
Given the 10 km radius of our study, only a part of this catchment area has been considered for analysis. Additionally, portions of the Vlăsiei Plain and the Danube Lowland were included in the northern and southern extremities, respectively.
Since the mid-'70s of the 20th century and the implementation of the so-called “systematization,” this area has been subjected to hydrological modifications when the old political regime settled an extensive irrigation system in the southeastern part of Romania (Caraiani, 1971). These works have led to creation of a series of dams and four large artificial lakes which functioned as water storage reservoirs. The construction works caused the flooding of the lower terrace of the river and of some small islands, leading to their sinking, as well as a continuous process of erosion of the surrounding landscape (Ghită, 2008a).
Archeological surveys have been carried out on the lower basin of the Mostiștea river since the beginning of the 20th century (Comsa, 2001), leading to intermittent systematic and rescue archaeological excavations. However, the results of that archeological research have either remained unpublished or have been published incompletely (Ignat, 2018).
A total of 333 sites have been identified and assigned to the entire Mostiștea catchment area, attesting to intense human activities spanning from the Neolithic to the present day (Serbănescu and Sandric, 2012; Ignat, 2018). Since the study area is defined by a 10-km buffer around the Mostiștea river, a smaller number of 319 sites will be considered in this study. These sites vary in size and include scattered archaeological material, settlements, necropolises, tumuli, constructions of different categories, etc. The archeological sites within the study area are shown in Figure 2. Each archeological site has a unique identification number and contains information about the site’s toponym, geographical location (administrative location and geographic location coordinates), as well as information related to site type, chronological framework, and settlement surface. Furthermore, descriptive information about local terrain morphology is provided for each site. These data are used as the analytical basis for our study (Oberländer-Târnoveanu, 2010; Oberländer-Târnoveanu and Musteaţă, 2015).
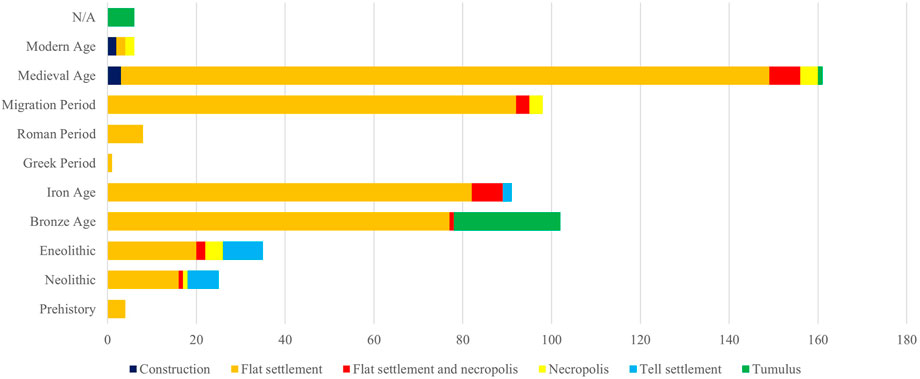
FIGURE 2. Site distribution on a chronological scale from the study area.
To achieve the objectives of this research, several cartographic sources, LCLU inventories, and satellite imagery have been used. The targeted area was chosen, given the rich evidence of human occupation over time and the existence of cartographic sources usable for our analysis, starting from the end of the 18th century. All sources have been acquired through open-source platforms as described below (Charta României meridionale - 1864, 2021; Specht Map, 2021; CORINE Land Cover, 2022; CORONA, 2022) or by accessing data provided by museum archives Table 1. The primary used cartographic materials are the Specht map (1791, 1:50.000), the Szathmári map (1864, 1:50.000), Artillery Firing Plans (1915–1959, 1:20.000), and the national topographic map of Romania (1974–1987, 1:25.000), combined with CORONA satellite imagery (1966–1968) (CORONA, 2022) and CORINE LCLU inventories (1990–2018).

TABLE 1. Data acquisition and data proprieties.
Based on the online national databank (National Archaeological Record of Romania, NAR) (Institutul Naţional al Patrimoniului, 2022), the creation of a georeferenced database and relevant bibliographical information, the association between archeological site locations and LCLU characteristics was identified. The online database NAR, hosted by the Ministry of Culture of Romania since 2000, is a significant cultural heritage resource and is continuously being updated by the National Heritage Institute (Oberländer-Târnoveanu, 2010; Oberländer-Târnoveanu and Musteaţă, 2015). Although the user interface of the database does not contain direct download functionality, all entries can be viewed online. A search engine facilitates the process of selecting sites based on specific parameters, such as keywords or chronological constraints. The data accuracy depends mainly on how the information was introduced, but the system is constantly improving.
There are several reasons for choosing open data sources. First, the NAR is the official database of heritage in Romania, and we use it as an authentic open dataset for our study (Institutul Naţional al Patrimoniului, 2022). The data are processed by experts in the field, giving them increased quality and performance. Second, it saved us the time of processing these data so that we could focus on other aspects of the study, such as data digitization and land-use analysis. Finally, they were acquired cost-free.
The selected area for assessing the landscape modification is situated within a 10 km buffer along the main course of the Mostiștea river, covering a total area of 1888 km2 (Figure 1). There are two main reasons for this definition of the study area. First, over the last 230 years, the most significant alterations to the area have taken place around the main course of the river. Therefore, it is assumed that the worst affected sites were those associated with the mainstream. Second, previous studies have shown that early communities are found near the water source, whether they are in low foothills, fertile lowlands, or floodplains (Bailey, 2000, p. 20; Davison et al., 2006). Moreover, different terrain analysis, such as least-cost path, visibility analysis, and catchment analysis (Madry and Rakos, 1996; Leussen, 1999), have illustrated that cost-distance strategies influence site location. Based on these studies, a potential range between 4/5 and 10 km (equivalent to a 1-hour or 2-hour walk) is considered.
Our methodology can be divided into several phases (Figure 3). The first phase of the research consisted of accessing, studying, and processing eight cartographic series and other related materials: six sheets of the Specht map, seven sheets of the Szathmári map, 23 sheets of Artillery Firing Plans, 34 sheets of the topographic map of Romania, and ten CORONA satellite imagery.
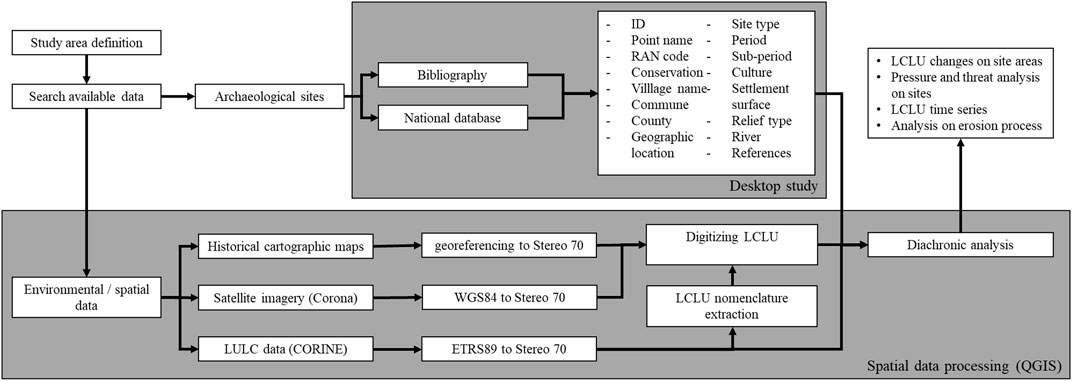
FIGURE 3. Schematic representation of the methodology used in the present study.
The Specht map (1791) (Crăciunescu, 2017), the Szathmári map (1864) (Bartos-Elekes et al., 2011), and the Artillery Firing Plans (1915–1959) (Crăciunescu et al., 2011) were already geo-referenced in the Romanian official coordinate reference system, namely, the Stereo 70 projection on the Dealul Piscului datum of 1970 (EPSG:31700). Stereo 70 is a conformal projection, inherently resulting in small distortions of the calculated (ellipsoidal) areas. To a large extent, these distortions are a function of the distance between consecutive vertices within a polygon (Frančula et al., 2021). However, given the large scale of the cartographic material, these distortions are limited (<1%) and are therefore negligible (Yildirim and Kadi, 2021).
A geometric quality assessment is based on the evaluation of random point samples in the GIS. Based on this evaluation, the Specht map has an error ranging from 150–200 m in the southern part of the Mostiștea Valley and more than 1 km in the north of the area (Crăciunescu, 2017). These errors are caused by error accumulation introduced by the cartographers of this map and the lack of a geodetic background. The Szathmári map contains systematic errors of around 130 m per sheet (Bartos-Elekes et al., 2011), while the errors for the Artillery Firing Plans range from 30 m in the south area up to 200 m in the north of the study area.
The Romanian topographic maps (1974–1987) were scanned using an A0 flatbed scanner (PUZ, ozalid SupraScan Quartz) and georeferenced using the index grid, which is available online (Hărți topografice militare 25.000 - Stereo 70, 2021). A similarity transformation (also known as the Helmert transformation) was used for georeferencing these maps, resulting in a mean error of 0.06 m in relation to the grid corners. For the second set of georeferenced data, CORONA satellite imagery were downloaded from the CAST website (CORONA, 2022), which are provided in WGS′84 (EPSG:4326).
As for the CORINE LCLU inventories, data were downloaded as a series of ESRI shapefiles from the Copernicus website (CORINE Land Cover, 2022). CORINE is the European reference dataset for land monitoring service (CLMS). The dataset is updated every 6 years and has a minimum mapping unit of 25 ha and a 100-m minimum mapping width. Compared to old cartographic maps, CORINE offers standardized and detailed datasets for the last 30 years, using the same technical parameters (nomenclature and geometric details) since its inception, with an accuracy of more than 85% (Büttner, 2021).
These data are provided in the Lambert azimuthal equal area projection (EPSG:3035), based on ETRS′89. Both the CORONA satellite imagery and the CORINE LCLU data were transformed from the original CRS to the Romanian Stereo 70 CRS (EGPS: 31700).
The next step consisted of vectorizing relevant features, such as agriculture plots, forests, rivers, lakes, or villages, as outlined in the georeferenced source data. Since all data sources are projected in the Romanian Stereo 70 CRS, and therefore spatially coherent, overlaying the digitized features allows direct insight into both large-scale landscape modification and the observation of the spatial relationship between the archeological sites and the deterioration of the environment.
For consistency, the nomenclature of vectorization was implemented in accordance with the CORINE LCLU classification (Kosztra and Büttner, 2019). Depending on the minimum mapping units, old cartographic sources might contain only a selection of features symbolized by a particular nomenclature. This limitation is specific to the time and scale at which the map was made (Jenny and Hurni, 2011). However, due to the varying level of detail and semantic accuracy, not all classes in the CORINE dataset will have some correspondence with the historical cartographic resources. Hence, the original classification in the CORINE datasets has been simplified as a function of the highest semantic accuracy of the historical data. This procedure resulted in a series of primary land cover classes for the time series, in correspondence with the CORINE Level 1 nomenclature. Subsequent to the thematic consistency between the different time series, this process also solves many challenges related to the minimum mapping units (i.e., vineyards that were considered nonsignificant by the 1791 cartographer). These features are merged into larger classes (i.e., artificial surfaces, agricultural areas, wetlands, water bodies, forest, and seminatural areas). More information about the issue of minimum mapping units is provided by Saura (2002).
For the georeferencing process, the vectorization, and the spatial analysis itself, the open-source QGIS 3.24 was used (QGIS Development Team, 2022). As with open data, the use of open source such as QGIS has multiple advantages, such as free-of-cost acquirement, ease of use, and user support from a community. The use of both available data sources and open source offers the chance of replicability.
The digitization of relevant landscape features offers both qualitative and quantitative insight into LCLU changes over the past 230 years. Furthermore, this process will help assess and understand the potential disappearance or immediate threat of archeological sites in the region.
As mentioned above, the geometrical quality, mapping scale (i.e., minimum mapping unit), and categorization of the mapped features differ between the various cartographic sources. As a result, each map comes with its own level of detail in terms of both geometry and definition of features. For example, the fact that some categories are present in one period but are lacking in another does not mean that they are necessarily absent in the area. When this is the case, those features might have a size that does not allow their appearance. Data reliability depends on the quality of the raw materials used and a certain degree of human error ability to extract them properly.
LCLU classes are represented by five major categories listed as agricultural areas (AA), artificial surfaces (ASs), forest and seminatural areas (FSA), wetlands (WLs), and water bodies (WBs) (Supplementary Table S1) (Kosztra and Büttner, 2019). According to the CORINE LCLU guidelines (Kosztra and Büttner, 2019), the category containing artificial surfaces includes all areas occupied by human activities, such as towns, villages, industrial or commercial areas, transport facilities, and construction sites. The remaining classes are also very well-defined: agricultural land refers to any arable land, permanent fodder areas or mixed parcels of agricultural and other natural lands; forests and seminatural areas are classified into different classes for coniferous, broad-leaved forests, and natural grasslands; any kind of flooded areas or areas that are likely to be flooded during the year, as well as coastal area submerged by high tides, falls into the wetlands category; as for the lakes, rivers, natural or artificial watercourses, or any other marine channels, they are integrated into the water body category (Kosztra and Büttner, 2019).
After digitizing, all LCLU classes for the various time series within the study area are presented in Figures 4–6 (Supplementary Table S1) that display how the surrounding landscape has changed. Within the selected buffer size of 10 km around the Mostiștea river, the analysis also covers parts of the Vlăsiei Plain in the north and details of the Danube Meadow in the southern section.
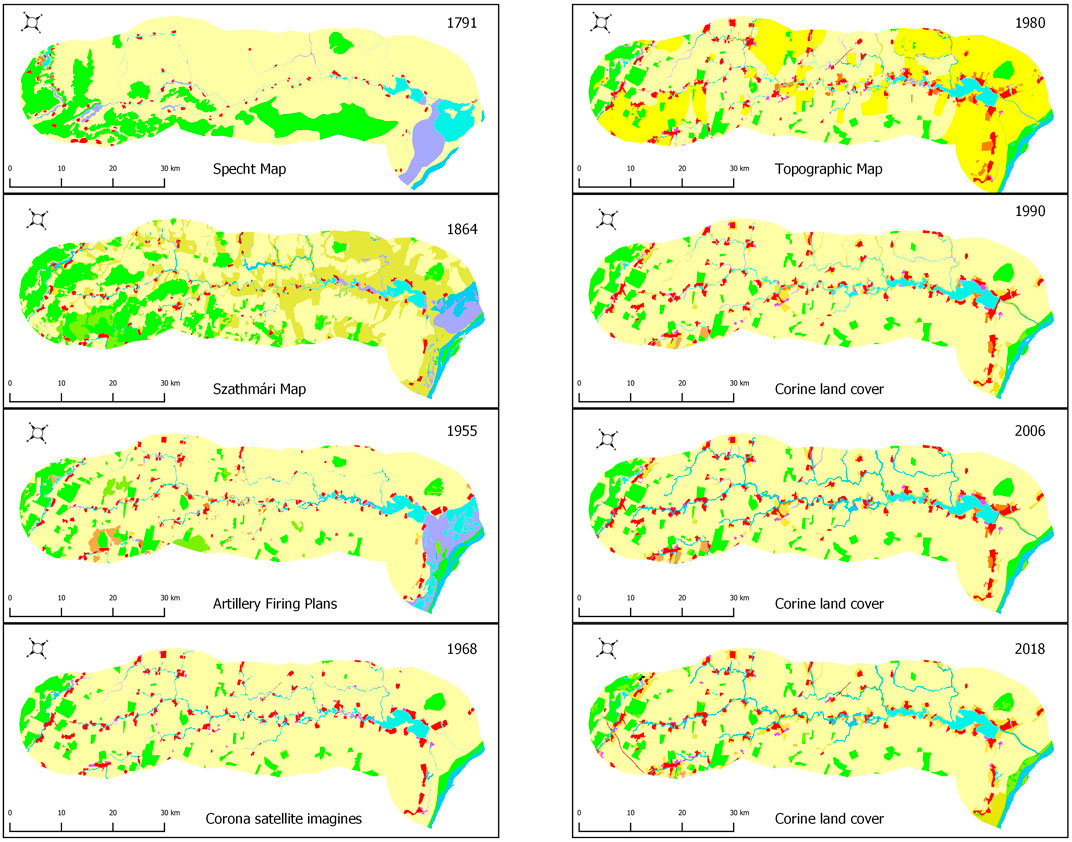
FIGURE 4. Landscape changes in 200 years’ time span from Mostiștea Basin (1791–2018). Corine LCLU nomenclature.
Figure 4 shows the evolution of land use over the last 230 years, as described below, while Figure 5 graphically shows the dynamics of land cover area by representing absolute values expressed in hectares.
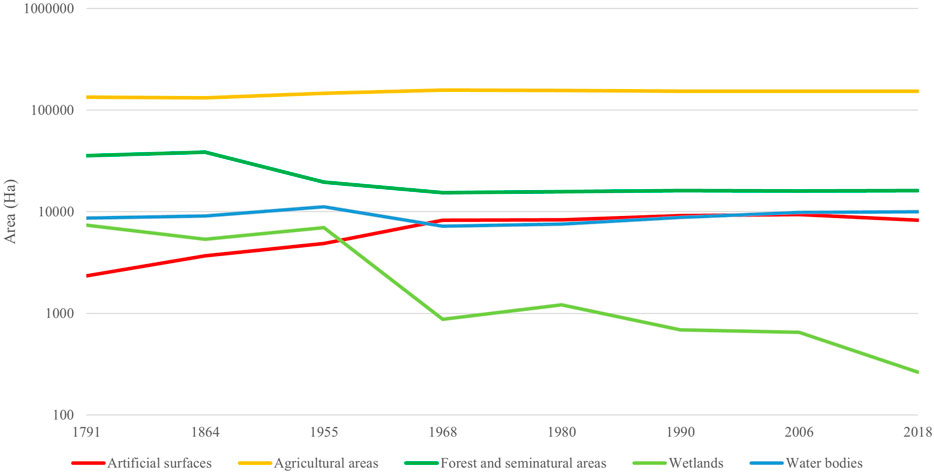
FIGURE 5. Landscape changes in study area from Mostiștea Basin (1791–2018). Landscape changes within a ten-km radius.
In Figure 6A, the surface area of each class is compared to the total surface area per year. Having the year 1791 as a reference in Figure 6B, the analysis of the individual classes allowed us to make the following observations: the fastest and continuous growth in terms of the surface area seems to be, as expected, the growth of artificial surfaces such as villages, industrial buildings, roads, or railways (up to 351%).
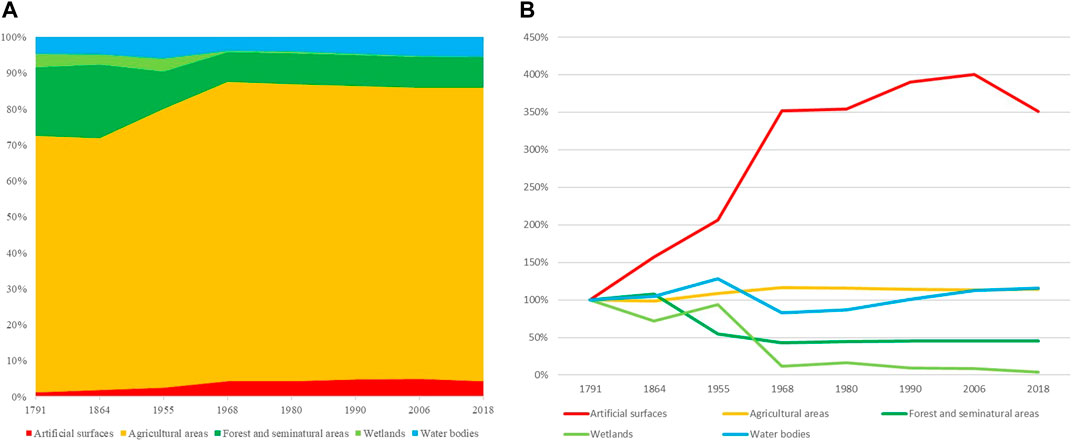
FIGURE 6. Landscape changes in study area from Mostiștea Basin (1791–2018). (A) Percentage of increased areas compared to the total surface area. (B) Percentage of increased areas compared to 1791.
The most extensive land cover from the study area is occupied by agricultural areas, growing from 133,806 ha in 1791 to 153,998 ha in 2018 (Figures 5, 6). Compared to the measurements in the 1791 maps, the surface has a slight increase of 9% in 1955, rising up to 17% in 1968, followed by slight decreases between 1980 and 2018.
Regarding the evolution of classes containing forest and seminatural areas, a total area of 35,444 ha is observed in 1791, increasing 8% in 1864, followed by a significant decrease in the following periods, and ending up with a 55% loss of forested area in 2018, corresponding to only 16,163 ha of remaining forest. Consequently, massive deforestation has favored the considerable expansion of agricultural and other artificial areas, as seen above in the expansion of agricultural land.
Another LCLU class that suffered a negative change was the wetland, going down from 7390 ha in 1791 to only 261 ha in 2018, resulting in a loss of 96% of the total wetland areas. Most of the area was either converted to agricultural land or succumbed to rising water levels.
Focusing exclusively on the Mostiștea main lake, the area occupied has increased significantly from 1,437 ha in 1791 to 2,969 ha in 2018, as visualized in Figure 7. Two other water bodies that have gone through significant changes are Frăsinet Lake (north of Mostiștea Lake) and the lakes in the Danube meadows (e.g., Boian Lake, Sticlinu, … south of Mostiștea Lake). In the first case, the surface of the lake increased from 155 to 956 ha (517%). In contrast, the lakes in the Danube Meadow, apart from a small lake (96 ha) near Chiselet village, and the channel that connects Mostiștea with the Danube River (190 ha), all the water bodies and wetlands are lost in favor of agricultural land.
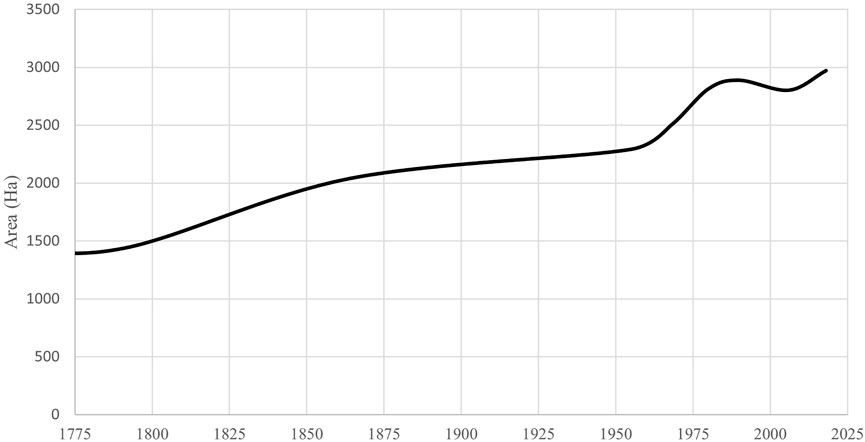
FIGURE 7. Total area of Lake Mostiștea (south area).
Regarding the correlation between site location and LCLU changing over the years, certain observations can be made in a broader sense. Based on the five Level LCLU classes, we obtained a crosswise comparison, indicating the absolute and relative number of sites per class, as illustrated in Figures 8, 9 (Supplementary Table S1), respectively.
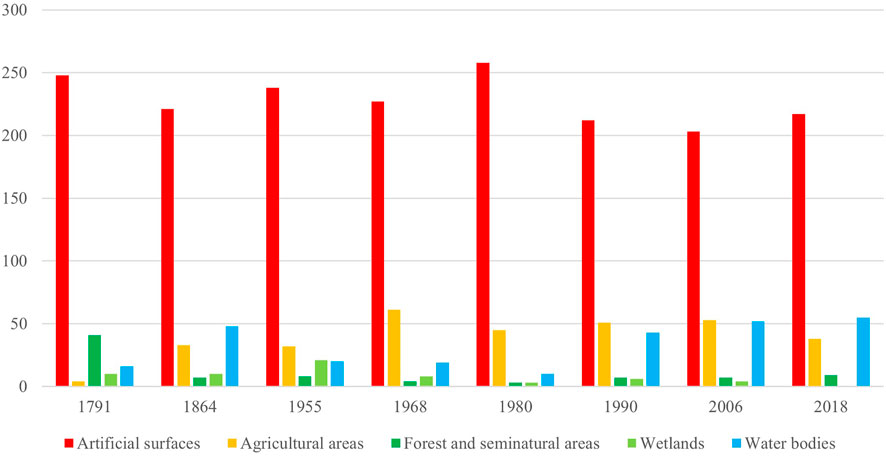
FIGURE 8. Distribution of sites based on land use classification (1791–2018).
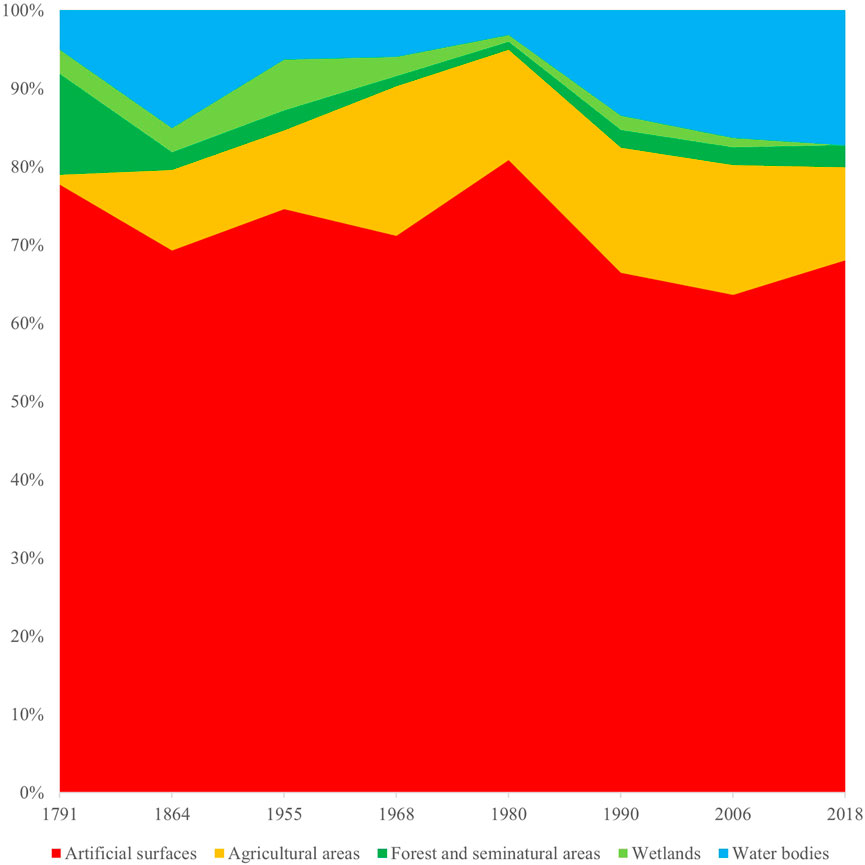
FIGURE 9. Distribution percentage sites according to land use (1791–2018).
With the 1791 map as a reference, it can be concluded that the highest number of sites are situated in artificial areas (248 sites), decreasing by 13% until 2018 (217 sites). In contrast, most of the sites located in areas with changed LCLU correspond to the agricultural areas, where there is an increase from four to 38 sites, thus representing an increase of 950%. These sites are (potentially) affected by human intervention over the entire study period.
Compared to the previous scenario, a proportional decline occurs for sites within forest areas. Only 22% of the 41 sites listed in woodland areas in 1791 are still in forested areas in 2018 (i.e., only nine archeological sites). The other 78% of the sites initially located in forested areas are now located in agricultural areas, probably affecting parts of the archeological sites. Similar extensive LCLU changes around the sites also occurred in the marsh and floodplain areas. The number of sites assigned to the water zone has increased by 344% compared to 1791 (i.e., from 16 sites in 1791 to 55 sites in 2018).
Considering the literature’s information (Figure 10), 220 sites do not have any data related to their conservation status, 68 sites are considered to have a poor condition or are partially destroyed, while 23 sites are classified as destroyed. Finally, only eight sites are stable and have good conservation status. The relationship between conservation status and the landform unit that sites occupy is presented in Figure 11 (Supplementary Table S1).
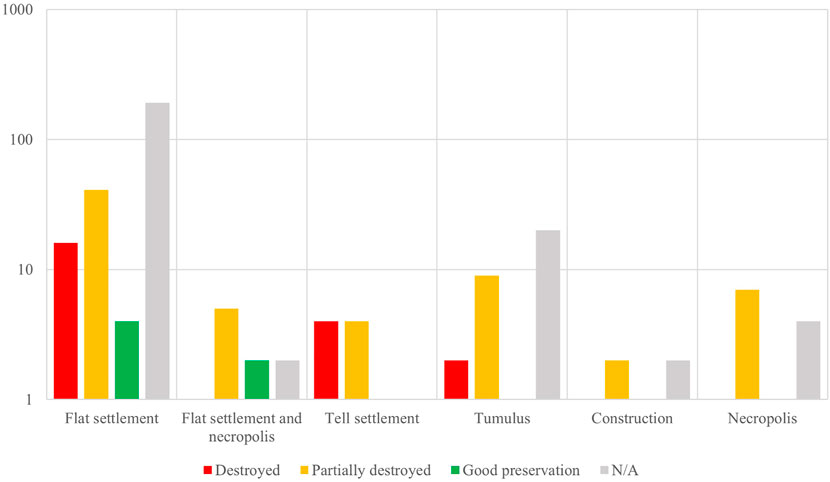
FIGURE 10. Conservation status distribution of sites by site type.
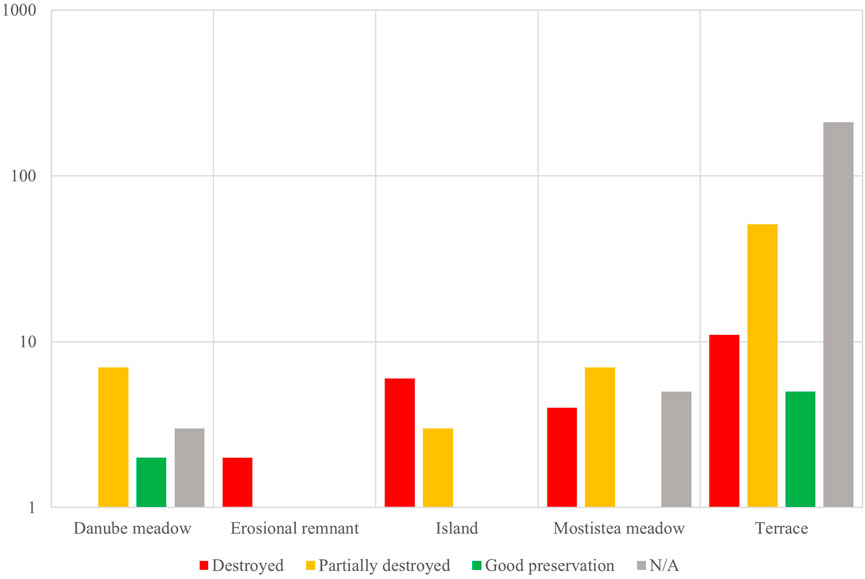
FIGURE 11. Conservation status distribution of sites by landform units (literature data)
A reconstruction of the surrounding environment in the Mostiștea Valley, dating back to the Neo-Eneolithic settlements in the area, can only be inferred from detailed geomorphology studies, combined with the use of drilling cores conducted at various points of interest. However, the carpology analyses made at Sultana-Malu Roșu tell settlement (Golea et al., 2014) and at Vlădiceasca (Cârciumaru, 1996) show that these sites were located in the area delimited by forest-steppe and steppe environment. These sites are also characterized by a marshy environment due to the Mostiștea River and the Danube proximity, a fact that is also confirmed by the zooarchaeological analysis carried out at Măriuța, Vlădiceasca, Sultana, and Șeinoiu tell settlements (Bălăşescu et al., 2005). Moreover, the same faunal data indicated farming activities near the tell settlements and also potentially pasture-dedicated areas, like around the Măriuța tell settlement (Bréhard and Bălăşescu, 2012).
The analysis of old cartographic material and satellite imagery indicates the evolution of the landscape closely linked to land use patterns. A small part of the forest system of the Vlăsiei Plain is captured in the northern part of the region, which has been, like the whole region, deforested for agricultural land use or artificial surfaces such as villages, commercial or transport units, etc. Significant anthropogenic changes have also occurred in the southern study area, mainly due to lakes (the largest being Lake Boian) and marsh drainage works. These changes were implemented during the expansion of the irrigation systems, carried out to enlarge areas dedicated to the agricultural system of the 20th century.
The anthropogenic changes have had several reasons, such as surface leveling favoring agricultural techniques (Ghită, 2008b) and climate characteristics (i.e., aridity).
Artificial surfaces appear to be steadily increasing throughout the years, with significant increases in the 1950s, 1968s, and 1990s followed by stagnation or slower growth in the last 20 years. This growth was triggered by various factors such as population growth, technological developments, and planned landscape development (Serbănescu and Trohani, 1978).
One major factor that led to massive deforestation and the expansion of agricultural areas could have been the two World Wars. Overcutting forests for timber and the increasing agricultural areas, natural grassland areas, vineyards, and orchards during this period mark the beginning of a destructive process of the natural environment and determined how the land was used (Ghită, 2008b; Crăciunescu, 2017). The significant increase observed in 1864 can arguably be related to omitting certain features on the 1791 maps, as mentioned above and stated by Dolocan (2012).
Because of climatic, economic, technological, political, and systematization reasons, various land changes occurred in the second half of the last century. Among those is the draining of marshes and lakes, especially in the southern area (Danube Meadow), the improvement and development of the dam system on the Mostiștea Lakes, as well as an increase in the number of irrigation systems throughout the Mostiștea Valley. While marshes are losing territory, agricultural areas and the breadth of the water shores are increasing compared to previous periods. The whole dynamics of the relief and morphology, especially around Frăsinet and Mostiștea Lakes, are modified.
Previous studies on the land morphology and hydro-geomorphological vulnerability of the Mostiștea mainstream provide data on relief dynamics, the changing trend of hydro-geomorphological systems, and on the evolution of human–environment relationships (Ghită, 2008a; Grecu et al., 2013). These studies revealed that geomorphological processes specific to this area are sagging and tunnel erosion, sometimes accelerated by a human impact like the implementation of irrigation systems. Regarding the fluvial processes, less than 4% of the land in Mostiștea catchment area is vulnerable to processes such as landslides, collapses, and lateral erosion. These processes mainly occur in areas near Săruleşti, Gurbăneşti, the Argovei Valley, and around Mostiștea Lake (Grecu et al., 2013).
One intensive phenomenon triggered by the anthropic factor and sustained by natural factors is the intensified degree of shoreline erosion. On the mainstream of the Mostiștea river, one immediate effect was the withdrawal of the lakeshore and the increasing area of the water surfaces. Especially at the western shore of Mostiștea Lake, the land has retreated by more than 200 m next to Sultana village since the damming of the river started in 1970.
Consequently, modern-day villages, agricultural land, and archeological sites along the middle and lower reaches of the river are predisposed to degradation, attested via shoreline retreat. The lake abrasion process caused permanent damage to archaeological sites located either on islands or on low, hidden, or swampy areas of the river, and even those at the edge of high terraces.
Unfortunately, numerous sites from our study area now show various stages of degradation, or even worse, and they have already been destroyed.
When comparing data obtained from LCLU analysis from Figure 8 with the literature collected data from Figure 11 (Supplementary Table S1), the following aspects can be noted (with particular emphasis on those well-known sites in the literature). Starting with less complex information about sites within forested and seminatural areas, one can assume that these sites are intrinsically protected, given their remoteness and coverage by vegetation. Although most of the sites with artificial LCLU have no recorded information regarding their conservation status, most of them are probably severely damaged or even entirely destroyed. This is mainly due to contemporary construction and land development, which obviously results in the disturbance of the land on which the construction was built. For example, during a field survey in 2018, it could be observed that the tell settlement from Ulmeni “Valea lui Soare” has been affected by a garbage area (Supplementary Figure S1).
Most of the sites are found in agricultural land, orchards, natural grassland, and vineyards. Conditions seem better if we assume that land cultivation only results in the disturbance of the upper part of the soil surface. As a result, the level of conservation for settlements or necropolises may be better than for the burial mounds. The latter are sometimes flattened to make cultivation easier. For example, the tell settlement from Spanțov-`Malu Bulioaica’ (Supplementary Figure S2) has been destroyed by shore erosion combined with the leveling of the area for agricultural use.
Sites that now belong to the water area are shown in Figure 8 (2018) and correspond in fact to the former riverbed, islands, or marsh area of the Mostiștea basin, and some of them have been completely flooded by water. The best-known cases are the settlements at Vlădiceasca I and II (Supplementary Figure S3), Lunca-Grădinile, Vlădiceasca-Ostrovul Mare, followed by the cemeteries at Curăteşti and Sultana-Școala Veche. In addition, there are other sites whose surface has been largely eroded but are still visible in the field (Sultana-Malu Roșu or Șeinoiu) Supplementary Figures S4, S5).
As mentioned earlier, one intensive phenomenon triggered by other anthropic factors and sustained by the natural ones (climate feature-aridity or wind blow) is the degree of shoreline erosion. At Sultana tell settlement, the erosion process had led to significant changes in the shape of the settlement’s promontory. Comparing the data between 1791 and 2018 allows the depiction of the current position of the bottom and top of the terrace. It can be noticed that the northwest part of the terrace has heavily suffered from erosion, and the land has retreated by 200 m in the last 230 years. In 1923, the east–west and the north–south long axes of the settlement were measured by I. Andrieșescu at 71 m (Andrieşescu, 1926), while in 2012, the settlement measured approximately 35–40 m on the long axis (Andreescu and Moldoveanu, 2012) and less than 34 m in 2019.
Regarding the prehistoric cemeteries that were discovered in the Sultana-Curăteşti region, such as Sultana-Malu Roșu, Sultana-Școala Veche, Sultana-Valea Orbului, and Curăteşti, the land had, respectively, retreated by 230 m, 340 m, 300 m, and 350 in the last 230 years.
Major human factors, such as economic and technological development or political decisions, which have coupled with natural hazards, have severely damaged the landscape and the archeological sites within it. The analysis of cartographic maps, LCLU data, and satellite imagery allows the observation of the consequences of anthropogenic changes on the configuration of the Mostiștea Lake and how these changes have affected the archeological sites located in this area.
Our investigations highlight how natural and anthropogenic interventions from the last 230 years in the Mostiștea Valley have modified the landscape and how these processes have affected the cultural heritage. The differences between the data derived from the 1791 map and the 2018 map involve a massive extension of the Mostiștea waterbodies, agricultural lands, and artificial areas at the expense of shrinking forested areas and wetlands (Figure 5). During this process, the greatest threat to archeological sites was the enlargement of the water surface and the transformation of marshy or forested areas into agricultural land.
Unfortunately, some archeological sites that had been preserved for almost 6,000 years were damaged or destroyed in less than two centuries (e.g., Vlădiceasca I-II and Sultana-Școala Veche), and their data may never be recovered.
Nonetheless, proactive measures can still be engaged to save the remaining areas in various stages of decay, and studies such as this one can be a good start in detecting and prioritizing regions susceptible to ongoing risk. In the future, more detailed studies on smaller areas may represent a significant step in preserving such sites at risk of being affected by erosion and saving them from their disappearance.
The original contributions presented in the study are included in the article/Supplementary Material; further inquiries can be directed to the corresponding authors.
All authors listed have made a substantial, direct, and intellectual contribution to the work and approved it for publication. CL supervised the study. CC, MF, and IO performed the field/lab data acquisition and processing under the supervision of CSt. CC, CSt, and CL wrote the manuscript with input from all co-authors. All authors read and approved the final manuscript.
This work was supported by a grant from the Ministry of Research, Innovation, and Digitization, contract number 41PFE/30.12.2021, within PNCDI III.
The authors declare that the research was conducted in the absence of any commercial or financial relationships that could be construed as a potential conflict of interest.
All claims expressed in this article are solely those of the authors and do not necessarily represent those of their affiliated organizations, or those of the publisher, the editors, and the reviewers. Any product that may be evaluated in this article, or claim that may be made by its manufacturer, is not guaranteed or endorsed by the publisher.
CC thanks the “Simion Mehedinți - Nature and Sustainable Development” Postgraduate Program, Faculty of Geography, University of Bucharest, Romania, for the academic and financial support for her Ph.D.
The Supplementary Material for this article can be found online at: https://www.frontiersin.org/articles/10.3389/fenvs.2022.924440/full#supplementary-material
Agapiou, A., Lysandrou, V., and Hadjimitsis, D. G. (2020). Earth Observation Contribution to Cultural Heritage Disaster Risk Management: Case Study of Eastern Mediterranean Open Air Archaeological Monuments and Sites. Remote Sens. 12 (8), 1330. doi:10.3390/rs12081330
Andreescu, R.-R., and Moldoveanu, K. (2012). Sites under Threat. Tell Settlements from South-East Romania. Stud. Preistorie 9, 123–139.
Andrieşescu, I. (1926). Sultana. Descoperirile Arheologice Din Vara Anului 1923. Bul. Com. Monum. Istor. XIX (50), 170–185.
Bailey, D. W. (2000). Balkan Prehistory: Exclusion, Incorporation and Identity. London ; New York: Routledge.
Bălăşescu, A., Moise, D., and Radu, V. (2005). The Palaeoeconomy of Gumelniţa Communities on the Territory of Romania. Cult. și Civilizație Dunărea Jos 22, 167–206.
Bartos-Elekes, Z., Timár, H. G., Imecs, Z., and Magyari-Sáska, Z. S. (20111864). ‘Fligely’s Topographic Mapping of Walachia (1855–1859), Szathmári’s Map of Southern Romania. its Geo-referencing and Publishing on Web (2011–2014)’. Charta1864. Available at: http://charta1864.gis-it.ro/essay.html.
Bréhard, S., and Bălăşescu, A. (2012). What's behind the Tell Phenomenon? an Archaeozoological Approach of Eneolithic Sites in Romania. J. Archaeol. Sci. 39 (10), 3167–3183. doi:10.1016/j.jas.2012.04.054
Büttner, G. (2021). CLC Product User Manual. Copenhagen: European Environment Agency. Available at: https://land.copernicus.eu/pan-european/corine-land-cover.
Centre, U. W. H. (2022). Definition of the Cultural Heritage. Available at: http://www.unesco.org/new/en/culture/themes/illicit-trafficking-of-cultural-property/unesco-database-of-national-cultural-heritage-laws/frequently-asked-questions/definition-of-the-cultural-heritage/ (Accessed: March 27, 2022).
Charta României meridionale - 1864 (2021). Charta României Meridionale - 1864. Available at: http://charta1864.gis-it.ro/charta.html (Accessed: December 10, 2021).
Colette, A. (2007). Climate Change And World Heritage. 22. UNESCO - World Heritage Centre. Available at: https://whc.unesco.org/en/series/22/.
CORINE Land Cover (2022). Copernicus Land Monitoring Service. Available at: https://land.copernicus.eu/pan-european/corine-land-cover (Accessed: March 8, 2022).
CORONA (2022). Corona Atlas & Referencing System. Available at: https://corona.cast.uark.edu/atlas#zoom=7¢er=2737057 (Accessed: March 8, 2022). 5542602.
Crăciunescu, I. (2017). Modelare Predictivă În Arheologie Folosind Soluții GIS. Valea Mostiștei În Preistorie. Bucharest: Institutul de Arheologie „Vasile Pârvan”.
Crăciunescu, V., Rus, I., Constantinescu, S., Ovejanu, I., and Bartos-Elekes, Z. (2011). Planurile Directoare de Tragere. Available at: http://geo-spatial.org/vechi/download/planurile-directoare-de-tragere (Accessed: February 21, 2019).
Davison, K., Dolukhanov, P., Sarson, G. R., and Shukurov, A. (2006). The Role of Waterways in the Spread of the Neolithic. J. Archaeol. Sci. 33 (5), 641–652. doi:10.1016/j.jas.2005.09.017
Dolocan, C. (2011). Starea actuală şi structura pădurilor din bazinul Mostiştei. Revista de Silvicultură şi Cinegetică (29), 83–87.
Dolocan, C. (2012). Declinul pădurilor din Bazinul Mostiștea și măsuri de redresare. Rev. Pădurilor 5, 26–30.
Fatorić, S., and Seekamp, E. (2017). Are Cultural Heritage and Resources Threatened by Climate Change? A Systematic Literature Review. Clim. Change 142 (1–2), 227–254. doi:10.1007/s10584-017-1929-9
Frančula, N., Lapaine, M., Župan, R., and Kljajić, I. (2021). Determining Areas from Maps. Geod. List. 75 (98), 365–379.
Ghită, C. (2008a). The Microrelief as Result of Morphohydroclimatic Conditions in Mostistea River Basin. Rev. Geomorfol. 10, 103–111.
Golea, M., Stavrescu-Bedivan, M., and Lazăr, C. (2014). Macroresturile Vegetale Descoperite În Situl Arheologic Sultana-Malu Roşu, Judeţul Călăraşi: Studiu Preliminar. Stud. Preistorie 11, 163–172.
Grecu, F., Ghiţă, C., and Budinealu, M. (2013). Vulnerability Map to Hydro-Geomorphological Processes (Romanian Plain). Rev. Geomorfol. 15, 5–12.
Harti topografice militare 25.000 - Stereo 70 (2021) Agenția de Informații Geospațiale a Apărării General de Divizie „Constantin Barozzi. Available at: https://www.geomil.ro/Produse/HartiTopografice25ST (Accessed: March 12, 2022).
Institutul Naţional al Patrimoniului (2022). Repertoriul Arheologic Naţional, Repertoriul Arheologic Naţional. Available at: http://ran.cimec.ro/sel.asp?Lang=EN (Accessed: February 15, 2022).
Jenny, B., and Hurni, L. (2011). Studying Cartographic Heritage: Analysis and Visualization of Geometric Distortions. Comput. Graph. 35 (2), 402–411. doi:10.1016/j.cag.2011.01.005
Kosztra, B., and Büttner, G. (2019). Updated CLC Illustrated Nomenclature Guidelines. Vienna: European Environment Agency. Available at: https://land.copernicus.eu/user-corner/technical-library/corine-land-cover-nomenclature-guidelines/docs/pdf/CLC2018_Nomenclature_illustrated_guide_20190510.pdf.
Kutut, V., Lepkova, N., and Źróbek, S. (2021). Immovable Cultural Heritage Usage Modes: Theoretical Approach. Eur. Res. Stud. J. 21 (1), 1136–1151. doi:10.35808/ersj/2092
Leussen, M. v. (1999). “Viewshed and Cost Surface Analysis Using GIS (Cartographic Modelling in a Cell-Based GIS II),” in New Techniques For Old Times. Oxford: Archaeopress (Computer Applications and Quantitative Methods in Archaeology. Proceedings of the 26th Conference (Barcelona, 215–224. March 1998.
Madry, S. L., and Rakos, L. (1996). ‘Line-of-sight and Cost-Surface Techniques for Regional Research in the Arroux River Valley’, in New Methods, Old Problems: Geographic Information Systems in Modern Archaeological Research, 104–126.
Micle, D. (2014). Archaeological Heritage between Natural Hazard and Anthropic Destruction: The Negative Impact of Social Non-involvement in the Protection of Archaeological Sites. Procedia - Soc. Behav. Sci. 163, 269–278. doi:10.1016/j.sbspro.2014.12.316
Mihăilescu, V. (1925). “Vlăsia Şi Mostiştea,” in Evoluția Geografică a Două Regiuni Din Câmpia Română’, XLIII, 1–200.
Oberländer-Târnoveanu, I., and Bem, C. (2009). “România: Un Viitor Pentru Trecut Fotografiile Aeriene În Repertorierea Siturilor Arheologice,” in Arheologie Aeriană. În România Şi În Europa (Bucharest: cIMEC), 62–88.
Oberländer-Târnoveanu, I., and Musteaţă, S. (2015). Open Access und Open Data in der rumänischen Archäologie. doi:10.11588/AI.2015.1.26147
Oberländer-Târnoveanu, I. (2010). Proiecte de arheologie aeriană în România. Angvstia (14), 389–412.
Orr, S. A., Richards, J., and Fatorić, S. (2021). Climate Change and Cultural Heritage: A Systematic Literature Review (2016-2020). Hist. Environ. Policy & Pract. 12 (3–4), 434–477. doi:10.1080/17567505.2021.1957264
QGIS Development Team (2022). QGIS Geographic Information System, Open Source Geospatial Foundation Project. Available at: https://qgis.org/en/site/(Accessed: January 20, 2022).
Saura, S. (2002). Effects of Minimum Mapping Unit on Land Cover Data Spatial Configuration and Composition. Int. J. Remote Sens. 23 (22), 4853–4880. doi:10.1080/01431160110114493
Serbănescu, D., and Sandric, B. (2012). Tell-uri Eneolitice În Regiunea Valea Mostiștei. O Privire Generală. Archaeol. Debates 2, 103–150.
Serbănescu, D., and Trohani, G. (1978). Cercetări Arheologice Pe Valea Mostiştei. Bucharest: Ilfov-File de Istorie, 17–42.
Specht Map (2021). Limes Transalutanus. Available at: http://www.limes-transalutanus.ro/materiale.html (Accessed: March 8, 2022).
UNESCO World Heritage (2021). The Operational Guidelines for the Implementation of the World Heritage Convention, UNESCO World Heritage Centre. Available at: http://whc.unesco.org/en/guidelines/ (Accessed: March 27, 2022).
Keywords: Mostiștea Valley, landscape changes, GIS, cultural heritage modification, geomorphological evolution, anthropic impact
Citation: Covătaru C, Stal C, Florea M, Opriș I, Simion C, Rădulescu I, Călin R, Ignat T, Ghiță C and Lazăr C (2022) Human Impact Scale on the Preservation of Archaeological Sites from Mostiştea Valley (Romania). Front. Environ. Sci. 10:924440. doi: 10.3389/fenvs.2022.924440
Received: 20 April 2022; Accepted: 20 June 2022;
Published: 19 August 2022.
Edited by:
Ionut Cristi Nicu, Norwegian Institute for Cultural Heritage Research, NorwayReviewed by:
Bulat Usmanov, Kazan Federal University, RussiaCopyright © 2022 Covătaru, Stal, Florea, Opriș, Simion, Rădulescu, Călin, Ignat, Ghiță and Lazăr. This is an open-access article distributed under the terms of the Creative Commons Attribution License (CC BY). The use, distribution or reproduction in other forums is permitted, provided the original author(s) and the copyright owner(s) are credited and that the original publication in this journal is cited, in accordance with accepted academic practice. No use, distribution or reproduction is permitted which does not comply with these terms.
*Correspondence: Cristina Covătaru, Y3Jpc3RpbmEuY292YXRhcnVAaWN1Yi51bmlidWMucm8=; Cătălin Lazăr, Y2F0YWxpbi5sYXphckBpY3ViLnVuaWJ1Yy5ybw==
Disclaimer: All claims expressed in this article are solely those of the authors and do not necessarily represent those of their affiliated organizations, or those of the publisher, the editors and the reviewers. Any product that may be evaluated in this article or claim that may be made by its manufacturer is not guaranteed or endorsed by the publisher.
Research integrity at Frontiers
Learn more about the work of our research integrity team to safeguard the quality of each article we publish.