
95% of researchers rate our articles as excellent or good
Learn more about the work of our research integrity team to safeguard the quality of each article we publish.
Find out more
ORIGINAL RESEARCH article
Front. Environ. Sci. , 22 July 2022
Sec. Environmental Economics and Management
Volume 10 - 2022 | https://doi.org/10.3389/fenvs.2022.924250
This article is part of the Research Topic Green Innovation and Industrial Ecosystem Reconstruction in Achieving Environmental Sustainability View all 34 articles
 Lanxiang Xu1,2*
Government policy is an effective strategy to encourage green innovation, but the effect of industrial policy on enterprise green innovation remains under-explored. Using China’s listed manufacturing enterprises data from 2010 to 2020, this study employs Made in China 2025 as a quasi-natural experiment as well as the DID method to explore the effect and mechanism of industrial policies on GI. The following key insights are obtained. 1) The Made in China 2025 has the potential to substantially improve the green innovation of manufacturing enterprises. This result shows that industrial policy can promote green innovation to boost the green transformation and upgrading of China’s manufacturing industry. 2) The policy effect is largely dependent on enterprise governance and regions. 3) Further mechanism considerations find that Made in China 2025 promotes green innovation through tax, environmental subsidies, and corporate social responsibility. In addition to enriching the literature on industrial policy and green innovation, this study offers valuable implications for government green governance and enterprise’s green transformation. Several suggestions for the implementation of Made in China 2025 are proposed.
During the past few years, the Chinese government has strengthened environmental governance and has produced impressive achievements. By 2020, the overall ecological and environmental quality has improved notably, pollutant emissions have been decreased considerably, and green production has been promoted substantially1. However, China’s manufacturing industry continues to struggle with serious environmental pollution. As the 42 industrial sectors are surveyed in 2020, manufacturing ranks as the most polluting industry in terms of air pollution, water pollution, and solid waste pollution2. To maintain economic and environmental prosperity, the country and enterprises are committed to promoting green production and green upgrading of manufacturing. Green innovation (GI) contributes to both environmental and economic performance and is, therefore, imperative for achieving green development of manufacturing industry. GI may involve upgrading the production process with high pollution and high energy consumption (Sun et al., 2019; Sun et al., 2021), or developing green product. Hence, it can effectively enhance enterprise environmental performance (Singh et al., 2020; Rehman et al., 2021), as well as promoting enterprises to develop unique competitive advantages in the product, resources, and technology for the purpose of achieving green transformation and upgrading (Tu and Wu, 2021) and improving economic performance (Chen et al., 2006). Nowadays, GI assumes greater prominence in light of the global pressure to reduce carbon emissions. With high costs, high uncertainty, long transition period, market failures and other risks (Song et al., 2018), and dual externalities (Berrone et al., 2013), enterprises often lack the resources and motivation for GI. As the responsible subject of win-win goals (Wittmayer, 2021), the government serves as the primary catalyst for the promotion of enterprises’ GI.
The Chinese government has realized the strategic importance of GI in manufacturing industry and has introduced several policies to encourage green development. Until now, the government stimulates GI by employing both market policy tools such as carbon emission trading mechanism and financial instruments including green loans, green equity, green bonds, green insurance and green funds, and non-market measures such as improving the renewable energy standard system and constructing a legal system conducive to green and low-carbon development. A special industrial policy, Made in China 2025, has been launched in 2015 by the Chinese government to address high pollution and high energy consumption in manufacturing. Different from the above-mentioned environmental regulation policies directly affecting GI, this policy is concerned with green transformation and development of manufacturing industry. This policy has been implemented for 5 years, but no empirical evidence has been found to support its impact on GI. Several studies have demonstrated the effectiveness of single or mixed environmental policies on enterprise GI (Herva et al., 2011). Yet, there is a lack of theoretical insight into the impact of industrial policy with multiple objectives on GI (Shen et al., 2020). To evaluate the incentive effect of Made in China 2025 on GI and provide a conceptual framework for the effect of industrial policy, this study employs difference in differences (DID) method to assess the effect by analyzing China’s listed manufacturing company data from 2010 to 2020.
This study contributes to the current framework of industrial policy and GI in three areas. Firstly, despite Made in China 2025, aiming in tackling industrial pollution and energy inefficiency by Chinese manufacturing industries, would potentially promote GI. Limited studies have been conducted on the effect and mechanism of industrial policy on GI using quasi-natural experiments in China. This study fille this gap by examining the industrial policy effect of Made in China 2025 on GI in manufacturing industry and its mechanism. Second, previous literature has primarily focused on the effect of policy on GI in terms of resource allocation, while taking into account this mechanism, the study also sheds light on the mechanism of corporate social responsibility (CSR) that extends the market mechanism to non-market mechanism. Third and finally, this study considers the influence of corporate governance differences and regional disparities on policy effect and verifies the filtering effect of corporate attributes on policy effect. Its significance lies in that when studying the effect of institutions on firm behavior, firm’s response to the institution should be fully considered.
Manufacturing serves as a pillar in China’s economic development. In 2020, the added value of China’s manufacturing industry (26.6 trillion yuan) accounted for 26.6% of gross domestic product (GDP), nearly 30% of the global manufacturing industry. Nevertheless, the manufacturing industry accounted for 54.8% of energy consumption in 2018, resulting in subpar environmental performance in China3. According to the 2020 global Environmental Performance Index (EPI) report jointly released by Yale University and other research institutions, China’s EPI score was only 37.3, ranking 120th among the 180 countries4. Additionally, according to the global Air Quality Report 2020, produced by IQAir, 42 of the world’s 100 most polluted cities are in East Asia, while the 15 most polluted cities in East Asia are all in China5.
In the past decade, China has continued to increase fixed asset investments in the manufacturing industry, registering an average growth rate of about 10% from 2010 to 2015 and over 5% from 2015 to 2019. Only in 2020 did the growth rate decrease by 2.2%. High investment has spurred a rapid development track. From 2012 to 2020, the added value of the manufacturing industry increased from 16.98 to 26.6 trillion yuan, roughly equaling 22.5% of the global share to nearly 30%6. China is until recently known as the “factory of the world”. However, compared with the advanced level of the world, China’s manufacturing industry is still large but not high efficiency. Furthermore, energy and resources are inefficiently utilized, resulting in environmental pollution. To realize the transformation, upgrading, and green development of China’s manufacturing industry, the Chinese central government presented Made in China 2025, a national plan, in 2015. Different from other environmental regulation policies, Made in China 2025 emphasizes five basic principles, including green development, innovation-driven, quality-first, structural optimization, and talent training. Most importantly, GI is woven into all five principles.
Made in China 2025 attempts to address low energy efficiency and environmental pollution in the manufacturing industry. Specifically, the manufacturing industry adheres to the principle of sustainable development, promoting energy-saving and environmental-friendly technologies, establishing a circular economy, creating green manufacturing systems, and striving toward ecological development. Further, it sets phased targets for reducing energy consumption, material consumption, and pollutant emissions in specific industries by 2020, as well as achieving world advanced levels by 2025.
Toward achieving green development, Made in China 2025 places green manufacturing as a priority area and establishes specific GI requirements for energy use, production process, and product life cycle of traditional manufacturing industry. With regard to energy use, it requires a reduction of energy consumption, material consumption, as well as water consumption, through technological innovation and management. For the production process, it contributes to the development of green technology and equipment, accelerating the application of effective and efficient processing technologies. In terms of green products, it involves promoting lightweight, low power consumption, and easy recycling technologies as well as increasing R&D in green products. Furthermore, it supports enterprises to develop green products, promotes ecological design, substantially raises energy conservation, environmental protection and low-carbon products, and guides green production and consumption. Moreover, it proposes initiatives to promote the green development of emerging industries, such as reducing energy and chemical consumption in the production and consumption of electronic information products, creating green data centers and green base stations, and vigorously promoting the green and low-carbon development of high-end equipment and biological industries of new materials, chemicals and energies.
GI is derived from the conventional understanding of technological innovations in general as defined in the Oslo-Manual of the OECD and Eurostat. The definition considers three aspects of technological innovation: it has to be based on new technology knowledge, it has been already implemented (i.e., new products must have been introduced on the market or new processes must have been introduced in the firm), and it has to be new for the firm itself, not necessarily for the market (Ziegler and Nogareda, 2009). GI refers to the innovation of processes, technologies, practices, systems and products to minimize the energy use per unit of output, minimize the emission of pollutants, better meet the living needs of human beings and increase standards of living (Bai et al., 2021).
GI is vital to enhance environmental performance (Úbeda García et al., 2022) and boost economic performance (Chen et al., 2006). To achieve win-win outcomes for sustainable environmental management and economic development, it is imperative to examine the determinants of GI. In the last 2 decades, considerable research effort has been devoted to identifying the underlying causes of GI (Ghisetti and Pontoni, 2015) from both the internal and external perspectives of the enterprise.
From an internal perspective, researchers have mostly investigated whether enterprises possess the capabilities and motivation to promote GI. The former focuses on whether enterprises have enough green human resources (Singh et al., 2020; Song et al., 2021), firm slack (Huang and Chen, 2022), absorptive capacity (Gluch et al., 2009; Song et al., 2019), knowledge (Song et al., 2019; Shahzad et al., 2021) to promote GI. The latter mainly studies green strategy (Song and Yu, 2018), organizational identity (Chang and Chen, 2013; Song and Yu, 2018), CEO personal Traits (Arena et al., 2018) and compensation (Stanwick and Stanwick, 2001) on the effect of enterprises’ willingness to implement GI.
The studies from an external perspective mainly investigate the driving effect of market and non-market factors on enterprise GI. Market factors include customers (Du et al., 2018), suppliers (Chiou et al., 2011), networks (Bai et al., 2021; Zhao et al., 2021), and stakeholder (Huang et al., 2009; Kawai et al., 2018; Zhang and Zhu, 2019). When environmental externalities are not internalized effectively, the benefits of GI are insufficient to counterbalance the internal risks, which inhibits the initiative of GI (Rodrik et al., 2004). Therefore, for the promotion of GI, non-market forces are essential for encouraging and guiding innovation and providing resources and market information (Harrison et al., 2017). The non-market factors include different policies, such as environmental regulations (Zhang et al., 2019), financial policy (Yu et al., 2021; Zhang et al., 2022), and policy mix (Rogge and Reichardt, 2016; Rogge and Schleich, 2018).
Previous studies on the relationship between environmental policy and GI provided mixed evidences. Some studies argue that environmental policies may depress GI because enterprises will increase the cost of policy compliance, which will crowd out the resources for the development of GI products in financially constrained enterprises with limited internal resources and low access to external finance (Acemoglu et al., 2012). In contrast, some studies use the Porter hypothesis to show that environmental regulation increases firm creativity and performance (Porter and van der Linde, 1995; Zhang et al., 2019).
One of the main reasons for the inconsistent conclusions of the existing research on environmental policies is that the research object is a single or a combination of policies but not policy mixes. The policy mix involves not only just a combination of policy instruments but also includes the process by which these tools appear and interact (Rogge and Reichardt, 2016). This study conducts on the effect and mechanism of policy mix on GI using quasi-natural experiments in China. Following the study of Rogge and Schleich (2018), the consistency of different policies facilitates the achievement of GI. Made in China 2025 integrates the green transformation and the intelligent transformation policy of manufacturing industry. The former directly affects GI through the requirements of green development, and the latter indirectly improves GI through digital technology. This discussion led to formulation of the following hypothesis.
Hypothesis 1. Made in China 2025 positively affect GI.GI is characterized by high investment. Based on the resource dependence theory, enterprises are more willing to implement GI when they can obtain sufficient resources from outside. Industrial policies can help enterprises address resource challenges. Therefore, this study examines the two mechanisms of tax and government subsidies.Green product innovation can enhance the economic and environmental performance of enterprises, as evidenced by the success of China’s new energy vehicles. Nevertheless, given the high risk involved with GI, enterprises may be reluctant to invest in GI because of the substantial upfront investment. Tax may improve enterprises’ GI from the following two aspects. On the one hand, tax reduction is beneficial to solve the market failure caused by GI externalities and uncertainties of enterprises, thus promoting the innovation investment of enterprises. On the other hand, tax burden reduction provides favorable conditions for GI financing by increasing free cash flow and available earnings of enterprises. This discussion led to formulation of the following hypothesis.
Hypothesis 2. Made in China 2025 positively affect GI through tax mechanism.Made in China 2025 affects GI by enhancing environmental subsidies. An important peculiarity of GI is that it produces positive spillovers in both the innovation and diffusion phase (so-called double externality) which reduces the incentives for firms to invest. Government subsidies can cut the costs of GI and internalize the social benefits of GI (Rennings, 2000). In addition, due to the high cost of GI, government environmental subsidies can attract more market investment into GI. From a quasi-experimental study by Howell (2017) (Howell, 2017), an early-stage investment almost doubles the probability of receiving later venture capital, resulting in substantial patenting and revenue benefits. This discussion led to formulation of the following hypothesis.
Hypothesis 3. Made in China 2025 positively affect GI through a subsidy mechanism.Based on organizational identity theory, enterprises would improve their willingness to strengthen GI by improving their green identity. In light of this, this study believes that Made in China 2025 will enhance GI through CSR. CSR was defined as the notion that corporations have an obligation to constituent groups in society other than stockholders and beyond that prescribed by law or union contract (Jones, 1980). CSR studies believe “firms can ‘do well by doing good’“. Besides, CSR for stakeholders and non-stakeholder can lead to long-term competitiveness by creating sustainable resource positions and relationships (Bansal, 2005). To achieve financial performance, manufacturers may invest GI. Moreover, based on signal theory, a firm’s socially responsible actions signal as positive toward stakeholders and positively influence corporate reputation (Javed et al., 2020). GI pertains to corporate reputation. To establish a good reputation, enterprises tend to increase investment in technological innovation. This discussion led to formulation of the following hypothesis.
Hypothesis 4. Made in China 2025 positively affect GI through CSR mechanism.
To evaluate the impact of Made in China 2025 on GI, the following DID model is constructed in this study.
To test the influence of policies on GI through tax mechanism, Eq. 2 is constructed in this study.
To test the influence of policies on GI through the government subsidies mechanism, Eq. 3 is constructed in this study.
To test the influence of policies on GI through the CSR mechanism, Eq. 4 is constructed in this study.
In Eqs 1–4, i represents the enterprise and t indicates the year. The dependent variable
GI is measured by the number of green patent applications which is an extensively employed measurement of GI. Compared with using the proportion of the number of green patents, using the number of green patents can verify the GI effect of the policy more directly (Du et al., 2021). In addition, using the amount of green patent applications rather than the amount of authorized green patents is more conducive to reflecting the policy incentive effect. To further examine the robustness of Eq. 1, the amount of authorized green patents is employed as the dependent variable. ETR is equal to enterprise income tax payable divided by enterprise profit. SUB is equal to government subsidies divided by enterprise revenue. Besides, CSR is the comprehensive score of corporate social responsibility.
Since enterprises’ resource status, social responsibility attitude, and media supervision have an impact on GI, the control variables are financial leverage, sustainable growth rate, sales expense growth rate, profit, environmental management certification, environmental protection information disclosure, media attention.
China’s manufacturing industry has transitioned from extensive development to intensive development with an emphasis on sustainable development and green technologies. Therefore, this study employs enterprises in listed manufacturing industries in China as samples. This study employs the following steps to determine the study sample. As a first step, a sample of manufacturing enterprises should be obtained. According to the Chinese Securities Regulatory Commission’s industry classification regulations for 2012 along with the revised Three Industry Division Regulations (2012) in 2018, we identify a sample of manufacturing enterprises listed in the China Stock Market & Accounting Research Database (CSMAR). Second, we will remove listed enterprises with special treatment (ST) and *ST, as well as enterprises that have not publicly disclosed their CSR.
The dependent variables are derived mainly from annual reports of listed companies and the China Patent Database launched by the China National Intellectual Property Administration. The authors manually match listed company patents with the Green List of International Patent Classification launched by the World Intellectual Property Organization (WIPO).
The control variables of enterprises in this study are derived mainly from the CSMAR. The environmental management certification and environmental protection information disclosure are derived from annual reports and CSR reports of listed companies. Media attention is the sum number of corporate news stories in the financial press and on the Internet.
Above all, Table 1 provides statistical descriptions of the variables in this study.
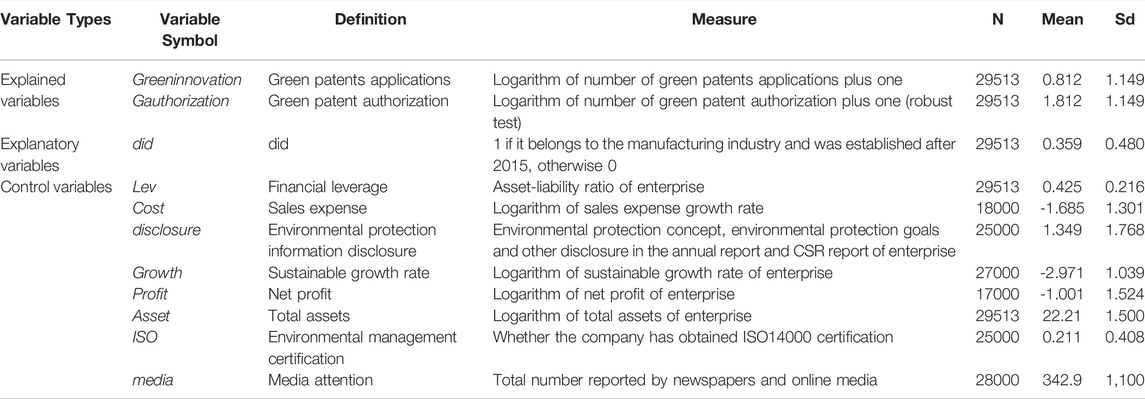
TABLE 1. Descriptive statistics of main variables.
Table 2 reports the empirical regression results of model 1). Column 1 does not contain any control variables, whereas column 2 does include control variables. Moreover, columns 1 and 2 both control the fixed effects of firm, city, and year. After adding the control variables, the coefficient of the did is still significantly positive at the 1% confidence level, indicating that made in China 2025 can considerably promote GI. Hypothesis 1 is supported.
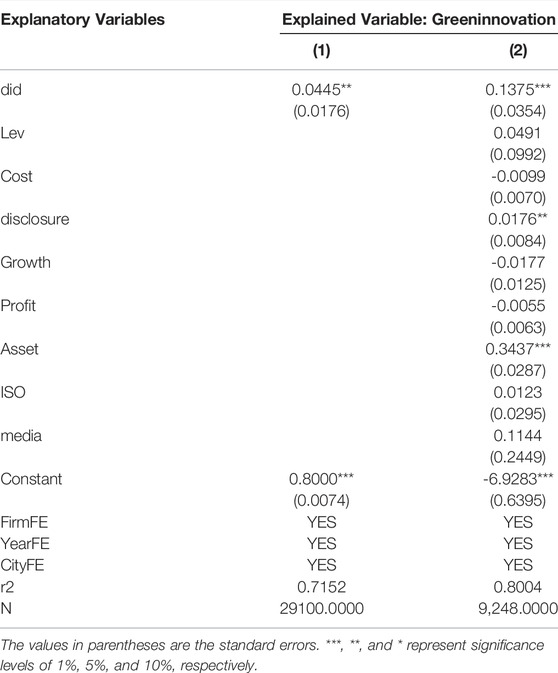
TABLE 2. Benchmark regression.
The coefficient of Asset is significantly positive, and the Lev is positive but insignificant, because resource redundancy provides power for enterprise green process innovation. The coefficients of Profit, Growth, and Cost are all negative but insignificant, because of the high investment and risk of GI, enterprises with high profitability and fast development are more reluctant to take risks. The coefficient of disclosure is significantly positive, while the coefficient of ISO is positive but insignificant because enterprises with strong social responsibility are conductive to GI. The coefficient of media is positive but insignificant, because media supervision is the external pressure of GI.
To examine the effectiveness of the DID model, this study conducts parallel trend test on GI in the treatment group and the control group (Kahn-Lang and Lang, 2020). This study draws an estimated coefficient graph (see Figure 1) to visually show the parallel trend of GI. The abscissa represents the time point. The year 2015 is the policy occurrence period and normalized to 0. Before the implementation of the policy, the coefficient was not significant, indicating insignificant difference between the treatment group and the control group.
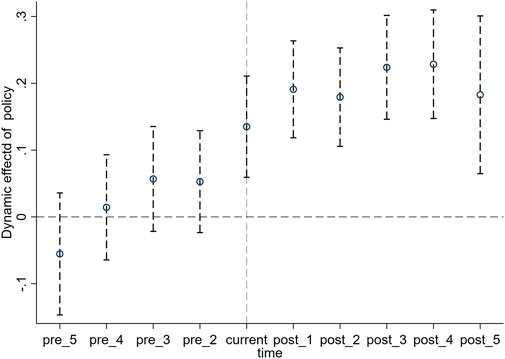
FIGURE 1. Parallel trend test.
Low Carbon City Pilot Policy (Du et al., 2022) and the Carbon Emission permit trade mechanism (Du et al., 2021) can induce GI. Therefore, this study supports the effectiveness of the DID model using the sample after removing the two policy pilot cities. Columns 1 and 2 of Table 3 show the regression results respectively after excluding low carbon pilot city and carbon emission trading pilot city. The coefficient of DID is all significantly positive, indicating that the policy effect is still robust.
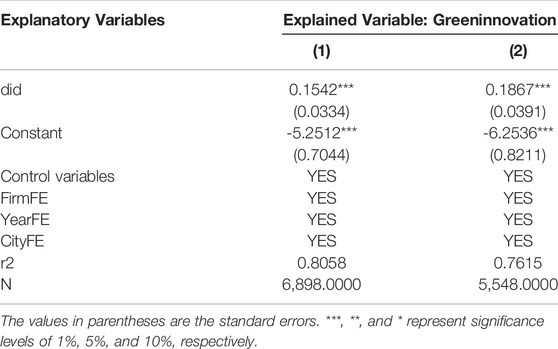
TABLE 3. Regression results after excluding other policy interference.
The empirical result after replacing green patent application with green patent authorization is shown in column 1 of Table 4. The coefficient of did is significantly positive, indicating that the policy does have a significant effect on GI. The green patent authorization reflects the achievements of GI, so the result indicates that the made in China 2025 plays a substantial role in GI. Enterprises do not just pay attention to symbolic GI to obtain subsidies and ignore the achievements of GI.
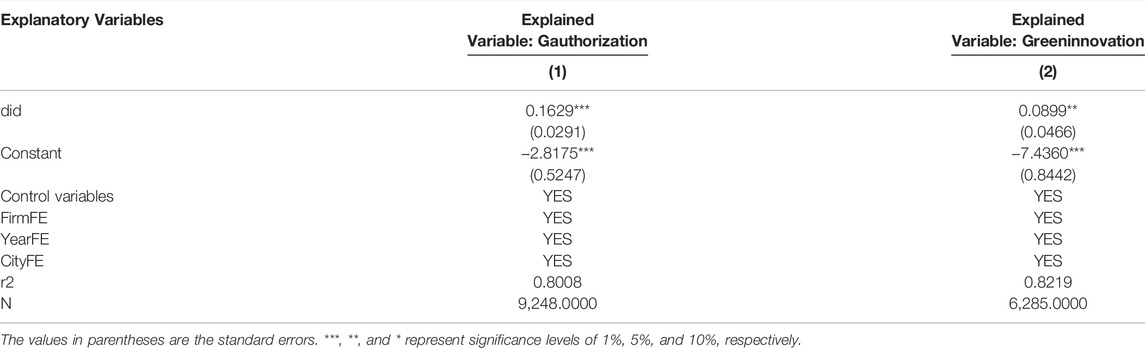
TABLE 4. Regression results after replacing the dependent variable.
Considering the impact of special events on GI, the robustness of the model was supported after deleting the observations of the year 2010, 2014, and 2016, because Expo 2010 Shanghai China was held in Shanghai, the APEC Summit was held in Beijing in 2014 and the G20 Summit was held in Hangzhou in 2016. The empirical results after deleting these observations are shown in column 2 of Table 4, indicating that the model is still robust.
Since the treatment group and the control group are from different industries, which may lead to the bias of DID regression results, this study further adopts the PSM-DID model for empirical analysis. Logit regression is conducted on the treatment group and the control group using firm characteristics variables, such as asset, cost, growth, media attention, ISO, and so on. Then, this study employs the predicted value of logit regression as the score and applies the nearest neighbor matching, radius matching, and kernel matching methods to match the sample. Regression results are shown in columns 1, 2, and 3 of Table 5. The results are consistent with the baseline regression results, which further verifies the robustness of the model.
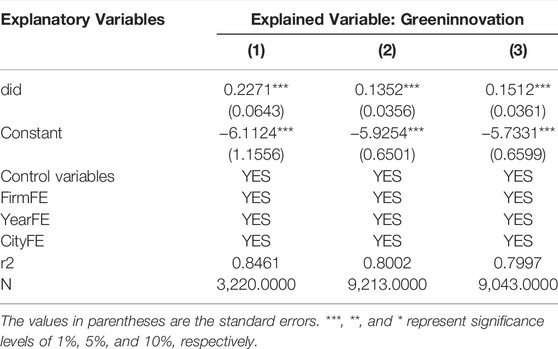
TABLE 5. Regression results of PSM-DID.
Referring to Lu et al. (Lu et al., 2017), a non-parametric replacement test is employed to test both randomized events and randomly grouped placebo. To ensure the randomness of counterfactuals and the reliability of analysis results, 500 random samples were carried out in this study. Figure 2 plots the probability density distribution, where the abscissa is the estimated coefficient value and the ordinate is the kernel density of the coefficient distribution. The coefficients obtained by random sampling are mainly distributed around 0. The real coefficient value in the baseline model is 0.1375. Counterfactual tests have once again demonstrated that made in China 2025 does promote GI.
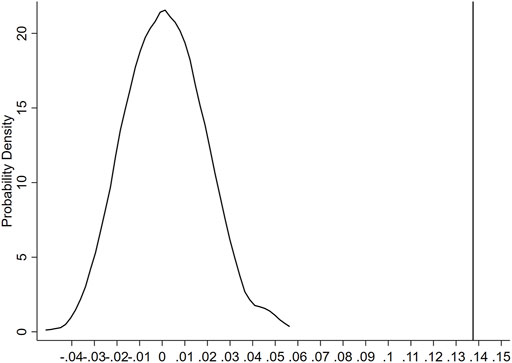
FIGURE 2. Placebo test.
As shown in column 1 of Table 6,
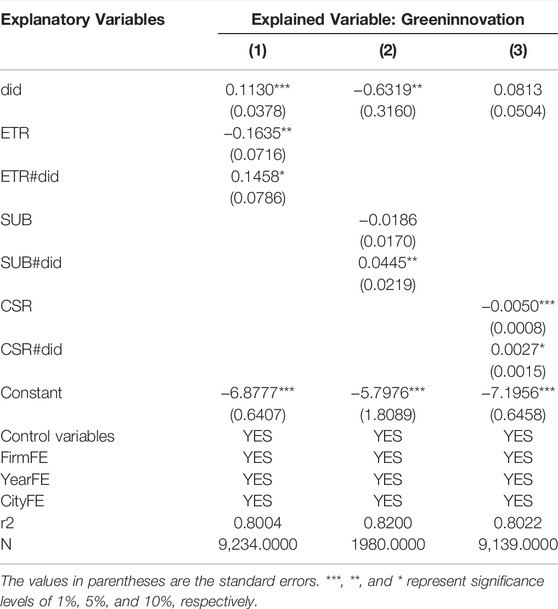
TABLE 6. The results of mechanism tests.
As shown in column 2 of Table 6,
As shown in column 3 of Table 6,
Due to the filtering effect of corporate nature on policy effect, this study considers the influence of corporate governance differences and regional disparities on policy effect.
Independent directors can achieve win-win solutions between enterprises and shareholders. The higher the proportion of independent directors, the higher the degree of supervision, and the higher the degree of responsibility sharing. Column 1 of Table 7 shows the impact of the difference in the proportion of independent directors on the policy effect. The interaction coefficient is considerably negative, indicating that the higher the proportion of independent directors, the weaker the policy effect. Based on social identity theory, the more independent directors there are, the less risk they will lose their reputation for not being green enough.
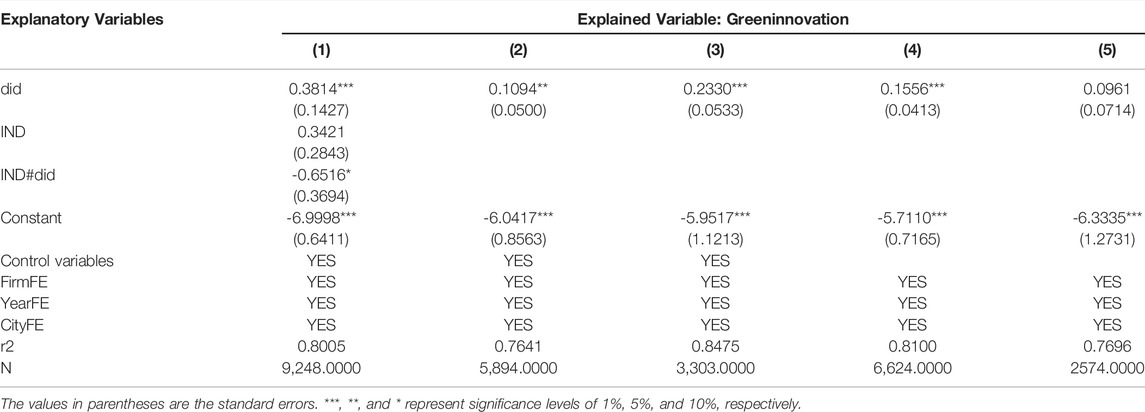
TABLE 7. Heterogeneity analysis.
As the state has ownership or control power over state-owned enterprises, the government’s will and interests will determine the behavior of state-owned enterprises. Compared with non-state-owned enterprises, state-owned enterprises carry out national policies more vigorously. In addition, state-owned enterprises can obtain more policy support, and generally have more resources to carry out GI. Therefore, this study analyzes the policy effect of share heterogeneity. Columns 2 and 3 of Table 7 show the regression results of non-state-owned enterprise and state-owned enterprise samples respectively. Although the did coefficient in the samples of state-owned enterprises and non-state-owned enterprises is markedly positive, the former is more significant than the latter.
Due to the innovation capacity and technological development level and the investment of knowledge capital (Li, 2009) of eastern China being higher than the central and western China, the central and western China has a better foundation for policy implementation and responds more actively to national policies. The last two columns of Table 7 show the regression results of samples from eastern China and central and western China. The did coefficients in eastern China are significantly positive, but the DID coefficients in central and western China are not significant.
In addition to improving economic performance, GI can also improve environmental performance. As a consequence, it is imperative for enterprises to undergo a transformation and upgrade. Theoretically, good policies may achieve a win-win situation between economic development and environmental protection. Nonetheless, in light of the conflict between economic development and environmental protection, as well as the uncertainty of policy implementation, there is no theoretical basis for whether policies can definitely stimulate GI. To address this gap, this study employs Made in China 2025 as a quasi-natural experiment as well as the DID method to explore the effect and mechanism of industrial policies on GI. The conclusions are as follows: first, through the model’s fundamental regression and various robustness tests, this study shows that Made in China 2025 can significantly improve the GI of manufacturing enterprises. Made in China 2025 is a mixed industry policy, its sub-policies can promote GI; Second, Made in China 2025 promotes GI through resource allocation and corporate social responsibility. This policy not only affects enterprises’ resources for GI in the form of taxes or subsidies but also affects enterprises’ motivation for GI through corporate identity represented by CSR. Third, the policy has different effects with respect to share, the proportion of independent directors, and regions. Enterprises located in the eastern region, state-owned and with a high proportion of independent directors are more willing to carry out GI.
This study provides several implications for government green governance and green transformation of enterprises. There are two suggestions for the government's green governance. On the one hand, Made in China 2025 contributes significantly to improving GI in the manufacturing industry and realizing green development. Therefore, the implementation should be promoted continuously. On the other hand, when exerting policy tools, the government should not only make full use of tax and subsidies in resource allocation but also consider the role of CSR in enterprises’ response to policies. Suggestions on green transformation of enterprises include as follows. First of all, manufacturing enterprises in green transformation should actively respond to Made in China 2025 and make full use of policy bonuses to improve GI performance. Second, enterprises should take full advantage of the government’s tax exemption and environmental subsidy funds to achieve the GI strategy. Finally, enterprises should pay attention to CSR and make it an endorsement for policy support.
The original contributions presented in the study are included in the article/supplementary material, further inquiries can be directed to the corresponding author.
The author confirms being the sole contributor of this work and has approved it for publication.
This study was supported by Anhui Science and Technology University (No. FZ220136 and No. AKZDXK2015B06).
The author declares that the research was conducted in the absence of any commercial or financial relationships that could be construed as a potential conflict of interest.
All claims expressed in this article are solely those of the authors and do not necessarily represent those of their affiliated organizations, or those of the publisher, the editors, and the reviewers. Any product that may be evaluated in this article, or claim that may be made by its manufacturer, is not guaranteed or endorsed by the publisher.
Author gratitude is extended to the prospective editor(s) and reviewers that will/have spared time to guide toward a successful publication.
1http://www.mee.gov.cn/hjzl/sthjzk/sthjtjnb/202202/W020220218339925977248.pdf, 2020 (accessed 20 April 2022).
2https://www.mee.gov.cn/hjzl/sthjzk/zghjzkgb/202105/P020210526572756184785.pdf, 2020 (accessed 20 April 2022).
3http://olap.epsnet.com.cn/auth/platform.html?sid=20F0C1DE91151720AF67B2724936A499_ipv442983543&cubeId=1371, 2020 (accessed 20 April 2022).
4https://epi.yale.edu/downloads/epi2020report20210112.pdf, 2020 (accessed 20 April 2022).
5https://www.iqair.cn/world-most-polluted-cities/worldair-quality-report-2020-en.pdf, 2020 (accessed 20 April 2022).
6https://www.miit.gov.cn/gzcy/zbft/art/2021/art_2c3a8ad0b43640e598ae646f809c6ab2.html, 2021 (accessed 20 April 2022).
7The standard of Industrial Classification of National Economy (2017 edition).
Acemoglu, D., Aghion, P., Bursztyn, L., and Hemous, D. (2012). The Environment and Directed Technical Change. Am. Econ. Rev. 102 (1), 131–166. doi:10.1257/aer.102.1.131
Arena, C., Michelon, G., and Trojanowski, G. (2018). Big Egos Can Be Green: A Study of CEO Hubris and Environmental Innovation. Brit J. Manage 29 (2), 316–336. doi:10.1111/1467-8551.12250
Bai, Y., Wang, J., and Jiao, J. (2021). A Framework for Determining the Impacts of a Multiple Relationship Network on Green Innovation. Sustain. Prod. Consum., 27471–27484. doi:10.1016/j.spc.2021.01.014
Bansal, P. (2005). Evolving Sustainably: A Longitudinal Study of Corporate Sustainable Development. Strat. Mgmt. J. 26 (3), 197–218. doi:10.1002/smj.441
Berrone, P., Fosfuri, A., Gelabert, L., and Gomez-Mejia, L. R. (2013). Necessity as the Mother of 'green' Inventions: Institutional Pressures and Environmental Innovations. Strat. Mgmt. J. 34 (8), 891–909. doi:10.1002/smj.2041
Chang, C. H., and Chen, Y. S. (2013). Green Organizational Identity and Green Innovation. Manag. Decis. 51 (5), 1056–1070. doi:10.1108/md-09-2011-0314
Chen, Y.-S., Lai, S.-B., and Wen, C.-T. (2006). The Influence of Green Innovation Performance on Corporate Advantage in Taiwan. J. Bus. Ethics 67 (4), 331–339. doi:10.1007/s10551-006-9025-5
Chiou, T.-Y., Chan, H. K., Lettice, F., and Chung, S. H. (2011). The Influence of Greening the Suppliers and Green Innovation on Environmental Performance and Competitive Advantage in Taiwan. Transp. Res. Part E Logist. Transp. Rev. 47 (6), 822–836. doi:10.1016/j.tre.2011.05.016
Du, G., Yu, M., Sun, C., and Han, Z. (2021). Green Innovation Effect of Emission Trading Policy on Pilot Areas and Neighboring Areas: An Analysis Based on the Spatial Econometric Model. Energy Policy 156, 112431. doi:10.1016/j.enpol.2021.112431
Du, L., Zhang, Z., and Feng, T. (2018). Linking Green Customer and Supplier Integration with Green Innovation Performance: The Role of Internal Integration. Bus. Strat. Env. 27 (8), 1583–1595. doi:10.1002/bse.2223
Du, M., Antunes, J., Wanke, P., and Chen, Z. (2022). Ecological Efficiency Assessment under the Construction of Low-Carbon City: a Perspective of Green Technology Innovation. J. Environ. Plan. Manag. 65 (9), 1–26. doi:10.1080/09640568.2021.1945552
Ghisetti, C., and Pontoni, F. (2015). Investigating Policy and R&D Effects on Environmental Innovation: A Meta-Analysis. Ecol. Econ. 118, 57–66. doi:10.1016/j.ecolecon.2015.07.009
Gluch, P., Gustafsson, M., and Thuvander, L. (2009). An Absorptive Capacity Model for Green Innovation and Performance in the Construction Industry. Constr. Manag. Econ. 27 (5), 451–464. doi:10.1080/01446190902896645
Harrison, A., Martin, L. A., and Nataraj, S. (2017). Green Industrial Policy in Emerging Markets. Annu. Rev. Resour. Econ. 9 (1), 253–274. doi:10.1146/annurev-resource-100516-053445
Herva, M., Franco, A., Carrasco, E. F., and Roca, E. (2011). Review of Corporate Environmental Indicators. J. Clean. Prod. 19 (15), 1687–1699. doi:10.1016/j.jclepro.2011.05.019
Howell, S. T. (2017). Financing Innovation: Evidence from R&D Grants. American Economic Review 107 (4), 1136–1164. doi:10.1257/aer.20150808
Huang, Y. C., Ding, H. B., and Kao, M. R. (2009). Salient Stakeholder Voices: Family Business and Green Innovation Adoption. J. Manag. Organ. 15 (3), 309–326. doi:10.1017/s1833367200002649
Huang, Y., and Chen, C. T. (2022). Exploring Institutional Pressures, Firm Green Slack, Green Product Innovation and Green New Product Success: Evidence from Taiwan's High-Tech Industries. Technol. Forecast. Soc. Change 17, 121196. doi:10.1016/j.techfore.2021.121196
Javed, M., Rashid, M. A., Hussain, G., and Ali, H. Y. (2020). The Effects of Corporate Social Responsibility on Corporate Reputation and Firm Financial Performance: Moderating Role of Responsible Leadership. Corp. Soc. Responsib. Env. 27 (3), 1395–1409. doi:10.1002/csr.1892
Jones, T. M. (1980). Corporate Social Responsibility Revisited, Redefined. Calif. Manag. Rev. 22 (3), 59–67. doi:10.2307/41164877
Kahn-Lang, A., and Lang, K. (2020). The Promise and Pitfalls of Differences-In-Differences: Reflections on 16 and Pregnant and Other Applications. J. Bus. Econ. statistics 38 (3), 613–620. doi:10.1080/07350015.2018.1546591
Kawai, N., Strange, R., and Zucchella, A. (2018). Stakeholder Pressures, EMS Implementation, and Green Innovation in MNC Overseas Subsidiaries. Int. Bus. Rev. 27 (5), 933–946. doi:10.1016/j.ibusrev.2018.02.004
Li, X. (2009). China's Regional Innovation Capacity in Transition: An Empirical Approach. Res. Policy 38 (2), 338–357. doi:10.1016/j.respol.2008.12.002
Lu, Y., Tao, Z., and Zhu, L. (2017). Identifying FDI Spillovers. J. Int. Econ. 107, 75–90. doi:10.1016/j.jinteco.2017.01.006
Porter, M. E., and Linde, C. v. d. (1995). Toward a New Conception of the Environment-Competitiveness Relationship. J. Econ. Perspect. 9 (4), 97–118. doi:10.1257/jep.9.4.97
Rehman, S. U., Kraus, S., Shah, S. A., Khanin, D., and Mahto, R. V. (2021). Analyzing the Relationship between Green Innovation and Environmental Performance in Large Manufacturing Firms. Technological Forecasting and Social Change 163, 120481. doi:10.1016/j.techfore.2020.120481
Rennings, K. (2000). Redefining Innovation - Eco-Innovation Research and the Contribution from Ecological Economics. Ecol. Econ. 32 (2), 319–332. doi:10.1016/s0921-8009(99)00112-3
Rodrik, D., Subramanian, A., and Trebbi, F. (2004). Institutions Rule: The Primacy of Institutions over Geography and Integration in Economic Development. J. Econ. Growth 9 (2), 131–165. doi:10.1023/b:joeg.0000031425.72248.85
Rogge, K. S., and Reichardt, K. (2016). Policy Mixes for Sustainability Transitions: An Extended Concept and Framework for Analysis. Res. policy 45 (8), 1620–1635. doi:10.1016/j.respol.2016.04.004
Rogge, K. S., and Schleich, J. (2018). Do policy Mix Characteristics Matter for Low-Carbon Innovation? A Survey-Based Exploration of Renewable Power Generation Technologies in Germany. Res. Policy 47 (9), 1639–1654. doi:10.1016/j.respol.2018.05.011
Shahzad, M., Qu, Y., Zafar, A. U., and Appolloni, A. (2021). Does the Interaction between the Knowledge Management Process and Sustainable Development Practices Boost Corporate Green Innovation? Bus. Strat. Env. 30 (8), 4206–4222. doi:10.1002/bse.2865
Shen, C., Li, S., Wang, X., and Liao, Z. (2020). The Effect of Environmental Policy Tools on Regional Green Innovation: Evidence from China. J. Clean. Prod. 254, 120122. doi:10.1016/j.jclepro.2020.120122
Singh, S. K., Giudice, M. D., Chierici, R., and Graziano, D. (2020). Green Innovation and Environmental Performance: The Role of Green Transformational Leadership and Green Human Resource Management. Technological Forecasting and Social Change, 150119762.
Song, M., Wang, S., and Sun, J. (2018). Environmental Regulations, Staff Quality, Green Technology, R&D Efficiency, and Profit in Manufacturing. Technol. Forecast. Soc. Change 133, 1–14. doi:10.1016/j.techfore.2018.04.020
Song, M., Yang, M. X., Zeng, K. J., and Feng, W. (2019). Green Knowledge Sharing, Stakeholder Pressure, Absorptive Capacity, and Green Innovation: Evidence from Chinese Manufacturing Firms. Bus. Strategy Environ. 29 (3), 1517–1531. doi:10.1002/bse.2450
Song, W., and Yu, H. (2018). Green Innovation Strategy and Green Innovation: The Roles of Green Creativity and Green Organizational Identity. Corp. Soc. Responsib. Environ. Mgmt. 25 (2), 135–150. doi:10.1002/csr.1445
Song, W., Yu, H., and Xu, H. (2021). Effects of Green Human Resource Management and Managerial Environmental Concern on Green Innovation. Ejim 24 (3), 951–967. doi:10.1108/ejim-11-2019-0315
Stanwick, P. A., and Stanwick, S. D. (2001). CEO Compensation: Does it Pay to Be Green? Bus. Strat. Env. 10 (3), 176–182. doi:10.1002/bse.284
Sun, H., Edziah, B. K., Kporsu, A. K., Sarkodie, S. A., and Taghizadeh-Hesary, F. (2021). Energy Efficiency: The Role of Technological Innovation and Knowledge Spillover. Technological Forecasting and Social Change. 167, 120659. doi:10.1016/j.techfore.2021.120659
Sun, H., Edziah, B. K., Sun, C., and Kporsu, A. K. (2019). “Nstitutional Quality, Green Innovation and Energy Efficiency,” in Energy Policy 135, 111002. doi:10.1016/j.enpol.2019.111002
Tu, Y., and Wu, W. K. (2021). How Does Green Innovation Improve Enterprises’ Competitive? The Role of Organizational Learning. Sustain. Prod. Consum. 26, 504–516. doi:10.1016/j.spc.2020.12.031
Úbeda García, M., Marco Lajara, B., Zaragoza Sáez, P. C., Manresa Marhuenda, E., and Poveda Pareja, E. (2022). Green Ambidexterity and Environmental Performance: The Role of Green Human Resources. Corp. Soc. Responsib. Environ. Manag. 29 (1), 32–45. doi:10.1002/csr.2171
Wittmayer, J. M. A. F. (2021). Contributing to Sustainable and Just Energy Systems the Mainstreaming of Renewable Energy Prosumerism within and across Institutional Logics. Energy Policy 149, 112053. doi:10.1016/j.enpol.2020.112053
Yu, C., Wu, X., Zhang, D., Chen, S., and Zhao, J. (2021). Demand for Green Finance: Resolving Financing Constraints on Green Innovation in China. Energy Policy 153, 112255. doi:10.1016/j.enpol.2021.112255
Zhang, F., and Zhu, L. (2019). Enhancing Corporate Sustainable Development: Stakeholder Pressures, Organizational Learning, and Green Innovation. Bus. Strat. Env. 28 (6), 1012–1026. doi:10.1002/bse.2298
Zhang, J., Liang, G., Feng, T., Yuan, C., and Jiang, W. (2019). Green Innovation to Respond to Environmental Regulation: How External Knowledge Adoption and Green Absorptive Capacity Matter? Bus. Strat. Env. 29 (1), 39–53. doi:10.1002/bse.2349
Zhang, Y., Li, X., and Xing, C. (2022). How Does China's Green Credit Policy Affect the Green Innovation of High Polluting Enterprises? the Perspective of Radical and Incremental Innovations. J. Clean. Prod. 336, 130387. doi:10.1016/j.jclepro.2022.130387
Zhao, Y., Zhang, X., Jiang, W., and Feng, T. (2021). Does Second-Order Social Capital Matter to Green Innovation? the Moderating Role of Governance Ambidexterity. Sustain. Prod. Consum. 25, 271–284. doi:10.1016/j.spc.2020.09.003
Keywords: green innovation, industrial policy, corporate social responsibility, manufacturing industry, made in China 2025
Citation: Xu L (2022) Towards Green Innovation by China’s Industrial Policy: Evidence From Made in China 2025. Front. Environ. Sci. 10:924250. doi: 10.3389/fenvs.2022.924250
Received: 20 April 2022; Accepted: 17 June 2022;
Published: 22 July 2022.
Edited by:
Huaping Sun, Jiangsu University, ChinaReviewed by:
Amin Karimu, University of Cape Town, South AfricaCopyright © 2022 Xu. This is an open-access article distributed under the terms of the Creative Commons Attribution License (CC BY). The use, distribution or reproduction in other forums is permitted, provided the original author(s) and the copyright owner(s) are credited and that the original publication in this journal is cited, in accordance with accepted academic practice. No use, distribution or reproduction is permitted which does not comply with these terms.
*Correspondence: Lanxiang Xu, eHVseDgyOEAxNjMuY29t
Disclaimer: All claims expressed in this article are solely those of the authors and do not necessarily represent those of their affiliated organizations, or those of the publisher, the editors and the reviewers. Any product that may be evaluated in this article or claim that may be made by its manufacturer is not guaranteed or endorsed by the publisher.
Research integrity at Frontiers
Learn more about the work of our research integrity team to safeguard the quality of each article we publish.