 Wei Dong
 Liang Zhao
 Wei Cheng
 Chunyan Guo5*
 Xinyong Shen
 Haoxin Yao
95% of researchers rate our articles as excellent or good
Learn more about the work of our research integrity team to safeguard the quality of each article we publish.
Find out more
ORIGINAL RESEARCH article
Front. Environ. Sci. , 10 August 2022
Sec. Atmosphere and Climate
Volume 10 - 2022 | https://doi.org/10.3389/fenvs.2022.923228
This article is part of the Research Topic Extreme Events and Their Spatiotemporal Variability over Polar Regions View all 9 articles
Understanding intra-seasonal variation in extreme cold events (ECEs) has important implications for climate prediction and climate adaptation. However, the ECEs difference between early (from December 1 to January 15) and late (from January 16 to February 28) winters is a lack of sufficient understanding. Herein, we investigated the trends of ECEs over eastern China in early and late winters. Results showed that the number of days with ECEs had a faster and uniformly decreasing trend in late winter over eastern China, whereas the decreasing trend in early winter was not significant because of the dipole pattern with an increase of ECEs in northeast China and a decrease of ECEs in southeast China during the time period 1980–2021. This denoted that China was presenting a pattern of “cold early winter–warm late winter”. The feature of cold early winter was related to a significant increase in high-latitude blocking highs extending poleward and reaching the Arctic Circle in early winter during the last 20 years. In particular, there was a large-scale tilted high ridge from the Ural Mountains to northern Asia, which favored the negative phase of the Arctic oscillation. This, in turn, led to a strong Siberian high and East Asian winter monsoon. Strong cold advection related to the circulation anomalies caused an ECEs increase in northeast China and dominated the change in temperature over eastern China in early winter. By contrast, the decrease in ECEs in late winter in the last 20 years was more related to the interdecadal enhancement of the anticyclonic anomaly over the north Pacific (NPAC). The strong NPAC extended to East Asia in a zonal direction, causing strong warm anomalies in eastern China through warm advection and diabatic heating, which weakened the northerly and prevented the East Asian trough from moving south, resulting in a warmer East Asia and a uniform decrease in late winter.
The eastern China adjacent to the western Pacific has a well-developed economy, is densely populated and is sensitive to climate change. The number of extreme cold events (ECEs) in East Asia has increased over the last 20 years (Johnson et al., 2018; Fu and Ding, 2021) and there have been several rare ECEs in eastern China. For example, a super-strong cold wave erupted in China in winter 2016, leading to record low-temperature rain and snow in many regions (Si et al., 2021). Followed just 2 years later by another rare cold wave (Dong et al., 2020). These ECEs often cause serious threats to agriculture, transportation, the power infrastructure and human health. Intra-seasonal reversals of ECEs, which means that there is a big difference in ECEs on different days of the winter, have become frequent in East Asia under the current global warming. There was a “cold early winter–warm late winter” mode over eastern China in winter 2015 (Xu et al., 2018). Many ECEs broke out over eastern China in early winter 2021, which have strong extremes and a wide influence; however, the temperature in this region increased sharply in late winter, exceeding historical hot extremes at many monitoring stations (Han et al., 2021; Zhang et al., 2021).
These inconsistent changes in ECEs in early and late winters (Qi and Pan, 2021) affect the balance of human adaptation to extreme events and will aggravate the impact of extreme events on normal production and lifestyles. In spite of this, there have been few studies on the inconsistent changes in ECEs between early and late winters over eastern China. It is therefore urgent to understand the differences in ECEs over eastern China in early and late winters and their possible driving mechanisms.
The variation in ECEs over eastern China is usually influenced by large-scale atmospheric systems at mid-to high latitudes in winter. The East Asian winter monsoon (EAWM) is the main climate system over East Asia in winter and is directly related to ECEs in this region (Zhang et al., 1997; Jhun and Lee, 2004). The intensity of the EAWM is often consistent with that of the Siberian high (SH): when the SH is strong, then the EAWM is also strong and East Asia is cold (Ding and Ma, 2007; Yun et al., 2018). Previous studies have shown that the Arctic Oscillation (AO) indirectly affects the EAWM by affecting SH (Wu and Wang 2002), on the other hand, the AO also directly impacts the EAWM (Gong et al., 2001; He et al., 2017). In addition, the Arctic sea ice loss in autumn after the 1980s may strengthen relationship between the EAWM and the AO through generating the East Asian jet stream upstream extension (Li et al., 2014). Sea ice loss in different areas has different effects, the variability of sea ice in the preceding November over the Davis Strait–Baffin Bay may influence temperature anomalies over Northeast China in December by adjusting the North Atlantic Oscillation-like geopotential height anomalies, whereas the sea ice over the Barents–Kara Sea affects temperature anomalies over Northeast China in January–February by adjusting the AO phase (Dai et al., 2019). The AO therefore has a significant impact on changes in temperature over eastern China in winter.
Different types of blocking high have an important role in the effect of the Arctic oscillation on the weather and climate of East Asia (Park et al., 2011). The increased quasi stationarity and persistence of Ural blocking caused more widespread midlatitude Eurasian cold anomalies (Yao et al., 2017; Chen et al., 2018). The omega blocking high in winter had a strong increase from 1990 to 2019 (Detring et al., 2021), which caused longer lasting and stronger cold events (Dong et al., 2020). More high-latitude blocking highs over the North Pacific during negative AO favor more cold surges (Park et al., 2011). In addition, the cooling at mid-latitudes can be partially explained by the AO (He et al., 2017). The cooling at Siberia, although influenced by the loss of Arctic sea ice, depends more on the full range of external forcing and coupled feedbacks on the Arctic tropospheric temperatures (Labe et al., 2020). By contrast, a strong Ural blocking high with a long lifetime not only explains the emergence of the “warm Arctic–cold Eurasia” mode (Luo et al., 2016), but was also used to explain the formation of the “warm early winter–cold late winter” mode in northern China in the winter of 2020–2021 (Yu et al., 2022). High-latitude blocking highs (HLBs) have increased significantly in recent decades (Woollings et al., 2018), which may accelerate the phase transition of the AO (Dong et al., 2020) and warm the Arctic further (Yao et al., 2017). On the contrary, Arctic warming, especially deep Arctic warming, weakens the mid-latitude jet stream and increases the frequency of blockings at high latitudes (He et al., 2020), further affecting low-temperature rain and snow at mid-latitudes (Cohen et al., 2020). Moreover, excessive Siberian snow may strengthen the Alaska and Ural high pressure ridges, which in turn contribute to sudden stratospheric warming and mid-latitude cold events (Lü et al., 2020). The study of ECEs in China should not be limited to the role of the Arctic, but the role of the low-middle latitude oceans should not be ignored (Li et al., 2021). Such as the winter of 2014/15, in which the “cold early winter–warm late winter” mode existed on the East Asian. On the one hand, sea-ice anomalies over the Davis Strait–Baffin Bay and the Barents–Kara Sea in November 2014 may be the essential factor for the intra-seasonal reversal of winter temperature (Dai and Fan, 2022). On the other hand, the positive Pacific Decadal Oscillation phase and the warm Niño4 phase in winter could modulate temperature over East Asia (Xu et al., 2018). However, it is not clear what is the synergistic effect of these atmospheric circulation factors in mid-high latitudes and low-latitude oceans on the intra-seasonal transitions of ECEs over eastern China?
The purpose of this study was to detect any differences in ECEs between early and late winters over eastern China and to explore the physical mechanism of the intra-seasonal transitions. Section 2 describes our data and methods. Section 3 shows the temporal and spatial variations of ECEs over eastern China in winter. Section 4 describes the possible physical mechanisms based on atmospheric circulation anomalies. Section 5 verifies the phenomena and mechanisms using a numerical model. Section 6 provides our summary and discussion.
We used the geopotential height, temperature, meridional wind (vwnd), zonal wind (uwnd), vertical velocity, sea level pressure (SLP), 10 m u-component/v-component of neutral wind, sea surface temperature and minimum 2 m temperature from the European Centre for Medium-Range Weather Forecasts reanalysis dataset (ERA5, https://www.ecmwf.int/en/forecasts/datasets/reanalysis-datasets/era5) from 1979 to 2021 at a horizontal resolution of (0.5° × 0.5°) (Hersbach and Dee 2016), temporal resolution is four times a day (00:00, 06:00, 12:00, 18:00), and post-processed to daily average. We also used daily data for the time period 1979–2014 from the FGOALS-f3-L model including the geopotential height, temperature, meridional wind, zonal wind and surface minimum temperature. Longitude was divided into 384 grid points and latitude into 192 grid points to give a horizontal resolution of about (1° × 1°). In this paper, we use three amip-type experiments. For the GMMIP Tier-1 experiments, three amip-type experiments were performed: “r1i1p1f1”, “r2i1p1f1” and “r3i1p1f1”. The experiment “r1i1p1f1” starts from 1 January 1861, the other two simulations “r2i1p1f1” and “r3i1p1f1” are the same as “r1i1p1f1” but with different initial times. Further details are given in He et al. (2020). The latest version of the FGOALS-F3-L model from Institute of Atmospheric Physics, Chinese Academy of Sciences is not only good at capturing large-scale climate mean precipitation and surface temperature, but also good at presenting the characteristics of intra-seasonal events such as MJO and typhoons (He et al., 2019). And our research question is intra-seasonal fluctuation of ECEs, so we want to make a simple assessment of the intra-seasonal fluctuation of ECEs by the FGOALS-F3-L model and verify the observational results.
The area of China to the east of 105°E is referred to as eastern China. The definition of early and late winters was taken from previous research using January 15 as the boundary (Wei et al., 2020); we selected December 1 to January 15 as early winter and January 16 to February 28 as late winter. In particular, we verified the intra-seasonal difference of ECEs for different classification criteria and found that all conclusions are roughly consistent. The Mann–Kendall test and Sen’s slope trend estimates were used to detect trends and significance. The correlation coefficient was determined using a two-sided t-test.
The ECEs were defined using a relative threshold to determine the cold events. For each day from December to February during the time period 1979–2020, the surface minimum temperature on a particular day and 7 days before and after (e.g., January 20, then January 13–January 27 in all 42 years) was selected for ascending order sorting. The 5% quantile was then taken as the ECE threshold of the day [which is similar to the definitions of Expert Team on Climate Change Detection and Indices in Zhang et al. (2011)]. When the surface minimum temperature was lower than the ECE threshold of the day for three or more consecutive days, then it was defined as an ECE. The surface minimum temperature anomaly of the ECE days was used as the intensity of ECE days.
Temperature tendency equations were used to diagnose each contribution to changes in temperature over eastern China in winter (Kim et al., 2021):
where t is time, T is temperature, v is the horizontal velocity vector,
The EAWM is defined here as the regional average 850 hPa meridional wind over (20–40° N, 100–140° E) (Yang et al., 2002). A negative EAWM refers to a northerly wind anomaly over East Asia and corresponds to a strong EAWM. The SH index is the regional average of the SLP in Siberia (40–60°N, 70–120°E). The blocking high index uses the improved detection method of Tyrlis et al. (2021), which is more suitable for high-latitude blocking. The HLB index used here refers to blocking highs entering the Arctic (65–75°N), because previous studies have shown that HLB is closely related to the phase transition of the AO (Dong et al., 2020) and the “warm Arctic–cold Eurasia” mode (Luo et al., 2016). The AO index (Zhou et al., 2001. The data download website is https://www.cpc.ncep.noaa.gov/products/precip/CWlink/daily_ao_index/ao.shtml) and the tripole index for the interdecadal Pacific oscillation (TPI, the data download website is https://psl.noaa.gov/data/timeseries/IPOTPI/) are derived from the Climate Prediction Center of the National Oceanic and Atmospheric Administration.
Under the background of global warming, the number of days with ECEs has decreased significantly throughout winter, but this reduction is significantly different between early and late winters. Figure 1A shows the daily trend of ECE days over eastern China in winter. The number of days with ECEs in early winter showed an insignificant decrease in December, but increased in the first 10 days of January, which resulted in insignificant changes in ECEs in early winter. In late winter, ECEs showed a significant decreasing trend, reaching −0.03 days/decade on individual days in February. In general, the days with ECEs in early winter decreased with an insignificant trend of −0.27 days/decade (p < 0.12) (Figure 1C, purple line). This insignificant change is related to the regional differences in cold events in eastern China in early winter, especially the days with ECEs in northeast China (NEC, 42–55°N, 110–125°E) significantly increased by 0.01 days/decade (p < 0.03) (Figure 1C, black line). In late winter, the decreasing trend of days with ECEs (−0.65 days/decade, p < 0.01) was 2.4 times (Figure 1C, red line) that in early winter. We also found that the intensity of ECEs in winter changed consistently with the number of days and that the intensity of ECEs in early winter changed with an insignificant trend (0.05°C/decade, p < 0.58). The intensity of ECEs in late winter (0.16°C/decade, p < 0.01) was significantly weakened at a rate 3.2 times than that in early winter (Figure 1D). This distinct trend of ECEs in early and late winter is consistent with the temperature field, where the minimum 2 m temperature in eastern China also shows a weak warming in early winter and a fast warming in late winter (Figure 1B). The result shows that the trends of temperature and ECEs were basically opposite in late winter, which means ECEs may be caused by temperature. However, there was an incomplete opposite between ECEs and temperature in early winter, which suggested that ECEs may not all be caused by temperature.

FIGURE 1. Trend in (A) the number of days with ECEs (units: days/decade) and (B) the minimum 2 m temperature (units: °C/decade) during ECE days over eastern China in winter from 1980 to 2021. The lower column diagram represents the significant test, where purple represents p < 0.05, orange p < 0.1 and white p ≥ 0.1. Time series of (C) ECE days (units: day/year) and (D) intensity (units: °C/day) during ECE days over eastern China in winter from 1980 to 2021, where the purple solid line represents early winter, the orange solid line represents late winter, the histogram represents the whole winter, and the purple and orange dashed lines are the linear trends of early winter and late winter, respectively. (C) The black solid line is early winter in northeast China (NEC, 42–55°N, 110–125°E) and the black dashed line is the linear trend in northeast China. (E–G) Anomalous fields of the number of days with ECEs (units: day/year) during the P1 (1980–2000), P2 (2001–2021) and (P2 − P1) stages over eastern China in early winter, respectively. (H–J) Anomalous fields of the P1, P2 and (P2 − P1) stages over eastern China in late winter, respectively. The black dots are p < 0.1 (units: day/year). Anomalies were computed relative to the 30-years climatology from 1981 to 2010.
Figures 1D–I show the anomaly fields of the P1 (1980–2000) and P2 (2001–2021) stages of winter over eastern China. In the P2 stage, the decrease in ECEs was mainly concentrated in central and southern China, although there was a slight increase in northeast China, which presented a dipole pattern. This difference between north and south China meant that the trend of ECEs over eastern China in early winter was not significant. The number of ECE days over eastern China uniformly and significantly decreased in late winter, especially in the central region (the Yangtze River Basin). These results show that the number of ECEs over eastern China is decreasing at a faster rate in late winter than in early winter.
To detect the reasons for the inconsistent changes in ECEs over eastern China in early and late winters, we calculated the changes in four atmospheric circulation factors (the EAWM, the SH, the AO and the HLB) related to ECEs. We first calculated the lead–lag correlations between the trends in the four circulation indices in winter and the trend in the number of days with ECEs over eastern China (Figure 2A). The results showed that the EAWM had the best relationship with ECEs during this period, followed by the SH, which led the ECEs by 2 days. This means that the EAWM and SH are circulation factors directly linked to ECEs over eastern China. The correlation coefficient between the AO and ECEs peaked at 4 days ahead and was significantly negatively correlated from zero to 9 days ahead. The HLB peaked at 7 days ahead and there was a significant positive correlation from one to 12 days ahead, indicating that the HLB and AO were significant early signals of ECEs over eastern China.
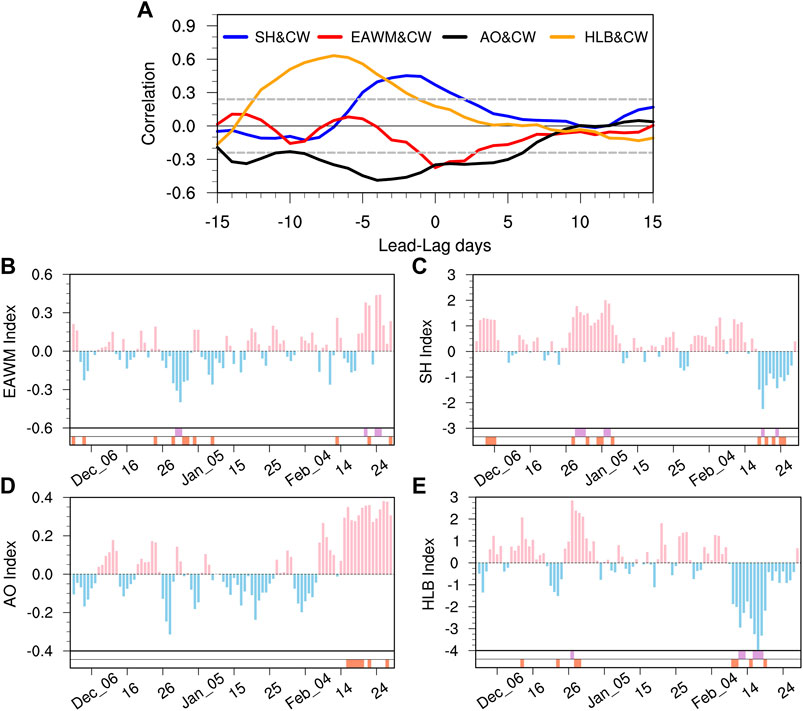
FIGURE 2. (A) Correlation coefficient between the trend of different atmospheric circulation indices and ECEs over eastern China in winter. The gray dotted lines are p < 0.05 and −5 days represents the daily trend of the circulation index leading the daily trend of ECEs by 5 days. Daily trends of atmospheric circulation indices in winter: (B) EAWM, (C) SH, (D) AO and (E) HLBs. The lower row of small histograms represents significance tests, as in Figure 1A.
Table 1 presents the correlation coefficients between these atmospheric circulation indexes. These circulation factors not only have significant effects on ECEs, but also interact with each other. The correlation coefficient between the HLB and AO in winter can reach −0.823 (p < 0.01) and this high correlation is stable throughout winter. In addition, the influence of the HLB on ECEs in winter is about 4 days ahead of the influence of the AO on ECEs, which means that the HLB and AO are the leading signals of ECEs, and that both of them influence each other. The increase of HLB may correspond to the negative phase of AO, and in turn, the negative phase of AO may correspond to the increase of HLB. What can be confirmed here is that there is only a correlation between HLB and AO, and the causal relationship is still unclear (Hassanzadeh and Kuang, 2015). Both the HLB and AO in winter were well related with the SH and EAWM, consistent with previous studies (Gong et al., 2001), which means that the anomalies in the HLB and AO can affect subsequent changes in the SH and EAWM. The four factors have a good correlation with ECEs, which indicates that their effects on ECEs over eastern China are sequential and interconnected.
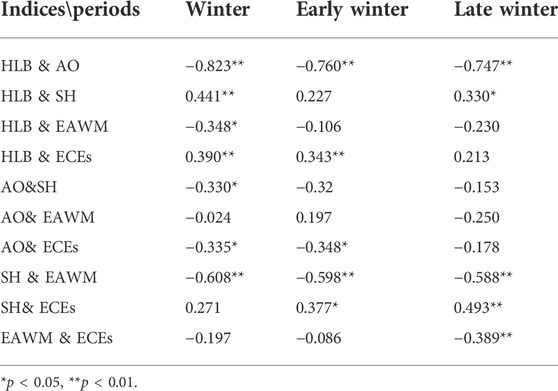
TABLE 1. Correlation coefficients between different indices in winter.
Figures 2B–E show the daily trends in the four atmospheric circulation factors in winter. The HLB mostly increased in early winter, but had a strong and significant decreasing trend in late winter (especially in February). The AO index was mostly negative in December and January and began a strong and significant positive trend in February. Similarly, the SH and EAWM mainly increased in early winter and decreased significantly in late winter (especially in February).
Overall, the trend for the SH in early winter was 0.645 hPa/decade (p < 0.10), whereas the trend in late winter was −0.067 hPa/decade (p < 0.25). The trend of the EAWM in early winter was −0.073 m s−1/decade (p < 0.11) and the trend of the EAWM in the late winter was 0.064 m s−1/decade (p < 0.18). The trends in the SH and EAWM were reversed in early and late winters. These statistical results show that the changes in the four atmospheric circulation factors were consistent with the changes in the ECEs over eastern China. The differences in these atmospheric circulations in early and late winters may therefore be the reason for the inconsistent changes in ECEs in early and late winters over eastern China.
We also found that the AO had a good relationship with ECEs in early winter, reaching −0.348 (p < 0.05), whereas the correlation coefficient between the AO and the ECEs in late winter was significantly lower at −0.178. The effect of HLBs on ECEs also appeared to be stronger in early winter and weaker in late winter (Table 1). This indicates that although mid-to high-latitude atmospheric circulations have a strong connection with ECEs in eastern China in early and late winters, there may be other factors that cooperate with the HLBs and AO to influence ECEs in late winter. In addition, the high-latitude systems (HLB, AO) are closely related to the ECEs of eastern China in early winter, while the mid-latitude systems (SH, EAWM) are closely related to the ECEs of eastern China in late winter (Table 1). This may be that the relationship between SH and ECEs was strengthened by other factors in late winter, and other factors may weaken the influence of HLB and AO on ECEs in late winter. We also calculated correlation coefficients of different indices between in early winter and late winter to explore the relationship between ECEs in early winter and ECEs in late winter (Table 2). The correlation coefficient of the ECEs between early winter and late winter was 0.205, which indicated that there was no direct connection. And the atmospheric circulation anomalies in early winter were also not significantly associated with the ECEs in late winter. However, ECEs in early winter and related atmospheric circulation anomalies have a significant correlation with the HLB and AO in late winter, but have no significant correlation on the SH and ECEs in late winter. This result means that the connection of ECEs and related atmospheric circulation anomalies in early winter are mainly limited to the high latitudes of the northern hemisphere in late winter, and it has less connection on the low-middle latitude atmospheric circulation anomalies. This again shows that the temperature change in East Asia in late winter may be related to other factors.
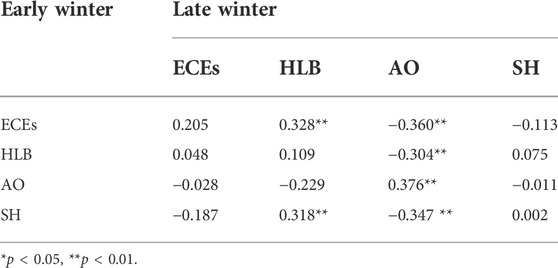
TABLE 2. Correlation coefficients of different indices between in early winter and late winter.
To explore how these four atmospheric circulations affect ECEs over eastern China in early and late winters, and whether there are other factors in this process, we plotted the anomalous field of the atmospheric circulation in the northern hemisphere in early and late winters. In order to study the changes in atmospheric circulation associated with ECEs, we calculated the anomaly fields of the blocking high in early and late winters (Figure 3). The HLBs in northern Eurasia and Alaska increased significantly in early winter of P2, which favored the negative phase of the AO. Although global warming is still intensifying, a more negative AO caused by the blocking anomaly will offset some of the warming effect, which effectively slows down the decrease in ECEs over eastern China in early winter and increases the number of ECEs in northeast China during P2. This is consistent with a previous study showing that ECEs in China have decreased in the long term, but increased after 2000 (Fu and Ding, 2021). ECE anomalies in Eurasia under global warming are closely related to anomalies in HLBs (Luo et al., 2017). Figures 3C,D show that HLBs in northern Asia and Alaska in late winter significantly reduced after 2000. Although Ural blocking in late winter of P2 increased compared with blocking in P1, the increase was much smaller than that in early winter. The AO anomaly caused by the HLB anomaly may therefore be an early signal of inconsistent changes in ECEs in early and late winters over eastern China.
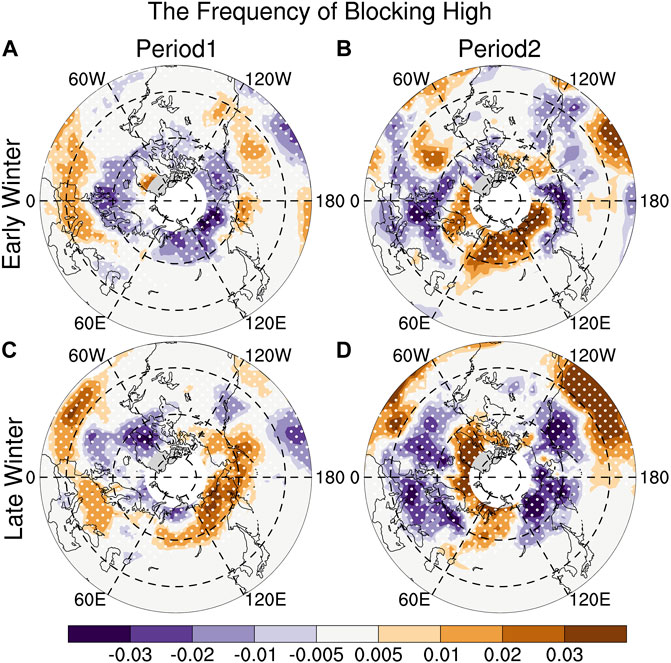
FIGURE 3. Anomalies in the blocking high at 500 hPa in early and late winters. (A) Early winter in the P1 stage, (B) early winter in the P2 stage, (C) late winter in the P1 stage and (D) late winter in the P2 stage (units: days). The white dots represent p < 0.05; units are days. Anomalies is relative to climatic states (1981–2010).
Figure 4 shows the atmospheric circulation anomalies at 500 hPa in winter. There was a stable East Asian trough (EAT) in early winter of P2 (Figure 4A) and the contours of geopotential height were more curved in early than in late winter, which means that the EAT was stronger in early than in late winter of P2. There was also a significant negative anomaly in the geopotential height in the EAT, which means that the EAT strengthened in early winter of P2. In addition, Ural blocking continued to develop towards its east, which appeared as large-scale tilted ridges that were exaggerated in northern Eurasia. This type of blocking is more conducive to pushing cold air to the south and favors ECEs over eastern China (Lin et al., 2018).
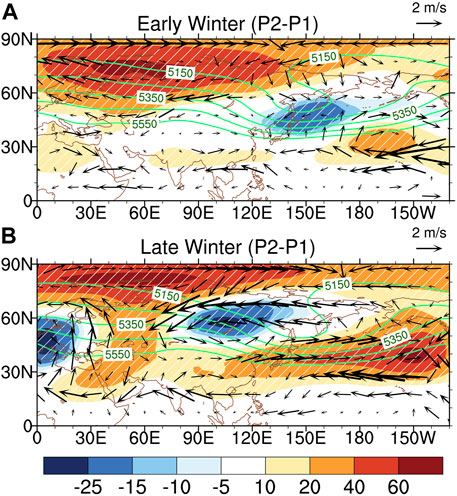
FIGURE 4. Difference in the geopotential height (shading; units: gpm) and wind field (vectors; units: m/s) at 500 hPa between P2 and P1 (P2 − P1) in (A) early and (B) late winter. The green lines represent the average geopotential height in early and late winters of P2, which are 5150, 5250, 5350, 5450 and 5550 gpm, respectively. The white slanted lines represent p < 0.05.
However, in late winter of P2 (Figure 4B), on the one hand, the Ural blocking develops in a north-south direction and does not develop in the east of the Ural Mountains. On the other hand, the enhanced NPAC moved westward to the Central Pacific and there was a significant high-pressure anomaly belt extending from the Central Pacific to East Asia, weakening the EAT. The south side of this high-pressure belt was accompanied by strong easterly anomalies, which directly transported warm, moist air to East Asia. Because East Asia is located on the west side of the anticyclone, southerly winds prevailed in East Asia and the warm air strongly resisted the southward movement of cold air at high latitudes, which warmed eastern China in late winter. Furthermore, NPAC and blocking high over northern Eurasia are key to the shift from the dipole pattern of ECEs (an increase of ECEs in northeast China and a decrease of ECEs in southeast China) in early winter to the uniform decrease pattern in late winter over eastern China.
Figure 5 shows the atmospheric circulation anomalies at 850 hPa in winter. The whole Arctic was warming in early winter of P2 (Figure 5A) and the range and intensity of warming were greater than in late winter. Siberia and East Asia showed significant cold anomalies, which meant that the SH was strong and East Asia had a northerly wind anomaly corresponding to a strong EAWM. However, in late winter of P2 (Figure 5B), although northern Siberia had a strong cold anomaly, it was difficult for this high-latitude cold air to be transported to mid- and low latitudes because the HLB did not exist in northern Asia and East Asia had a southerly wind anomaly. Importantly, the NPAC was very strong in late winter, which was consistent with the conditions at 500 hPa. The NPAC transported warm and moist air to East Asia, causing a warm center in this region. At the same time, it provided a southerly wind anomaly for East Asia and weakened meridional heat exchange at mid-to high latitudes, meaning that East Asia showed a “cold early winter–warm late winter” mode.
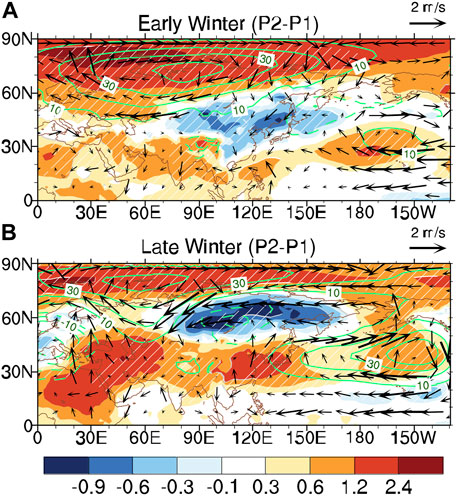
FIGURE 5. Difference in temperature (shading; units: K), geopotential height (contours; units: gpm) and wind field (vectors; units: m/s) at 850 hPa between P2 and P1 in (A) early and (B) late winter. The white slanted lines represent p < 0.05.
The spatial distribution of temperature and atmospheric circulation at the surface was consistent with that in the troposphere. Figure 6 shows the difference of the surface minimum temperature, SLP and wind for (P2 − P1). The whole Arctic was warming in early winter of P2 (Figure 6A), which favored the negative phase of the AO, especially in the northern Ural Mountains. The positive SLP anomaly in Eurasia reached to 20°N and was matched by the corresponding surface minimum temperature field. The whole of the mid-latitudes of Eurasia were cold, with the cold center near 50°N. The southernmost cold anomaly reached southern China. There was a weak anticyclone anomaly and a negative SLP anomaly in the north Pacific in early winter. However, in late winter of P2 (Figure 6B), the NPAC was strong and the north Pacific mid-to high latitudes were occupied by a positive SLP anomaly that favored a positive phase of the AO. The positive SLP anomaly extended from the Central Pacific to East Asia with a strong easterly wind, which directly transported warm and moist air to East Asia.
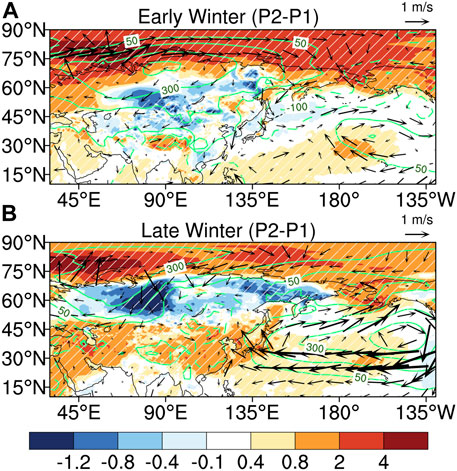
FIGURE 6. Difference in the surface minimum temperature (shading; , SLP (contours; hPa) and wind field at 10 m (vectors; m/s) between P2 and P1 in (A) early winter and (B) late winter. The white slanted lines represent p < 0.05.
In summary, the faster decreasing trend of ECE days in late winter over eastern China was mainly the result of the synergistic effect of the atmospheric circulation at mid-to high latitudes and the NPAC. The variation in the mid-to high-latitude systems (the HLB, AO, SH and EAWM) in early and late winters is inconsistent, as is the difference in the intensity and position of the NPAC. Specifically, the NPAC located near Alaska in early winter directly aggravated Arctic warming, which, in turn, favored the negative phase of the AO. Combined with a large-scale tilted ridge spanning northern Eurasia, this enhanced the SH and squeezed cold air south.
From the perspective of energy propagation, the northerly and southerly wave trains propagating downstream from the Atlantic were stronger in early winter of P2 than during P1. In particular, the northerly wave activity flux was transported to northern Eurasia, which, in turn, strengthened the Ural blocking high and SH in early winter of P2, causing the Ural blocking high to stretch to northern Asia and develop into a large-scale tilted ridge. Wave activity flux anomalies in the western Pacific were transported to East Asia (Figure 7A), which further deepened the EAT in early winter (corresponding to a strong EAWM). The northerly wind anomalies behind the EAT led the cold air southward, which made eastern China cold in early winter.
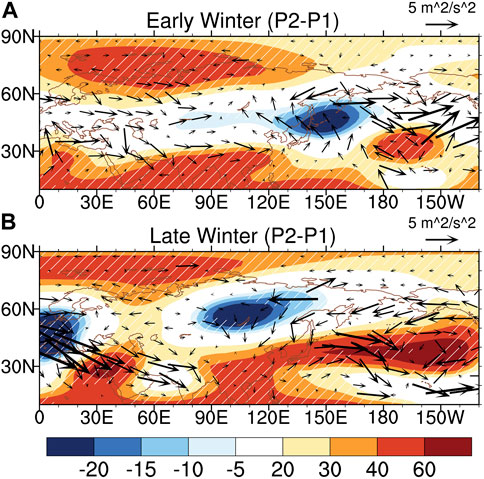
FIGURE 7. Difference in the wave activity flux (vectors; m2 s−2) and stream function anomaly (shading; 105 m2 s) between P2 and P1 in (A) early winter and (B) late winter at 300 hPa. The white slanted lines represent p < 0.05.
The NPAC is stronger in the troposphere and its high-pressure anomaly belt extends from the mid-Pacific to Asia, transporting large amounts of warm and moist air to the western Pacific–East Asia, resulting in a warm center over eastern China. In addition, East Asia is located on the western side of the NPAC, which leads to a southerly wind anomaly in East Asia and hinders the southward movement of high-latitude cold air.
The results for the wave activity flux (Figure 7B) show that the northern branch of the wave activity flux train traveling from the Atlantic to Eurasia weakened, which, in turn, weakened the HLBs over northern Asia and the SH in late winter of P2 compared with early winter. An intensified southern branch of the wave active flux was transported along lower latitudes to the west of the NPAC, causing the NPAC to strengthen and develop westward. The NPAC then stimulated the wave activity flux anomalies and propagated westward, which strengthened a low-pressure anomaly over northern Asia, causing a reduction in the blocking high in northern Asia and the north Pacific, favoring the positive phase of the AO. Therefore, not only was there a lack of high-latitude atmospheric circulation to transport cold air to East Asia, but the NPAC also continued to send warm and moist air to East Asia, which eventually led to a warmer East Asia in late winter.
To detect the vertical transport of cold and warm air masses, we calculated the latitude–height vertical cross-section across East Asia for the temperature and atmospheric circulation (Figures 8A,B). East Asia has cold anomalies from the surface to the upper troposphere in early winter of P2 (Figure 8A). The cold air tilted toward the Arctic from the surface to the upper troposphere and in combination with the downward wind in the mid-latitude troposphere, this favored the transport of cold air from the upper troposphere to the surface. In addition, the strong northerly wind anomaly always reached around 25°N, which meant that high-latitude cold air was directly transported to southern China. The cold anomaly was located in the lower troposphere in the region 60–70°N in late winter of P2 (Figure 8B). The upper troposphere was occupied by strong positive temperature anomalies and there was insufficient cold air here to supplement the cold anomalies in the lower troposphere. There was a southerly wind anomaly from the surface to the upper troposphere at mid-latitudes, with the southerly winds reaching 65°N, which made it difficult for the cold air at high latitudes to be transported south. The climatological state of the meridional wind of P2 (Figures 8A,B, green line) shows that there was a 2 m/s southerly wind in the lower troposphere (850–700 hPa) near 25°N in late winter, but no southerly wind in early winter. This indicates that the southerly wind in East Asia was stronger in late winter than in early winter. This means that there was less meridional heat exchange in late winter than in early winter of P2.
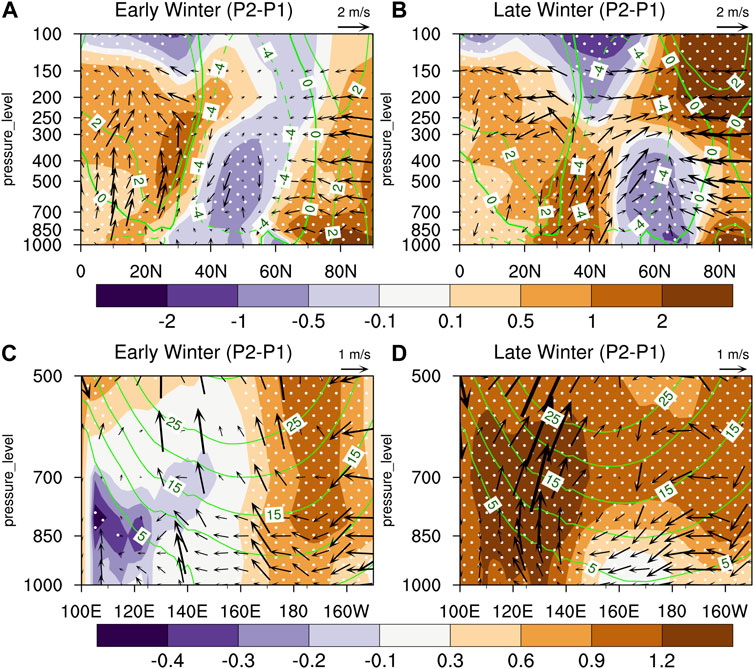
FIGURE 8. Vertical profiles of the differences in temperature (shading; units: K) and circulation field (arrows; units: m/s) between P1 and P2 in early and late winters. (A,B) Latitude–height vertical cross-section for East Asia (115–120°E average), the solid green lines represent the multi-year average of meridional winds during the P1 and P2. (C,D) Longitude–height vertical cross-section for East Asia (30–37.5°N average), the solid green lines represent the multi-year average of latitudinal winds during the P1 and P2. The white slanted dots represent p < 0.05.
Figures 8C,D show the longitude–height vertical cross-sections of temperature and the atmospheric circulation for East Asia. There was a weak cold anomaly from East Asia to the western Pacific in early winter of P2 (Figure 8C) and a warm anomaly in the central Pacific. However, because the weak NPAC was to the west, the weak easterly anomaly in the Pacific was unable to transport warm and moist air to East Asia. However, there was a high-temperature anomaly belt from the eastern Pacific to Asia and a strong easterly wind anomaly in late winter of P2 (Figure 8D). The climatological state of the zonal wind (Figures 8C,D, green line) showed that the contours in late winter were more westward than in early winter, which meant that the east wind was stronger in late winter. The NPAC first transported warm and moist air to the East Asia–western Pacific region through the east wind and then formed a warm center in East Asia. The strong thermal effect heated East Asia, leading to air to expand and rise vertically. Figure 8B also shows that the southerly wind anomaly in the mid- and lower troposphere over East Asia was stronger in late winter than in early winter. This further blocked the invasion of high-level cold air at high latitudes to lower levels at mid-latitudes, which made East Asia warmer in late winter of P2.
We calculated the contribution of the temperature tendency equation at 850 hPa to determine the specific cause of the temperature anomalies in East Asia. From the term for the change in temperature over time (
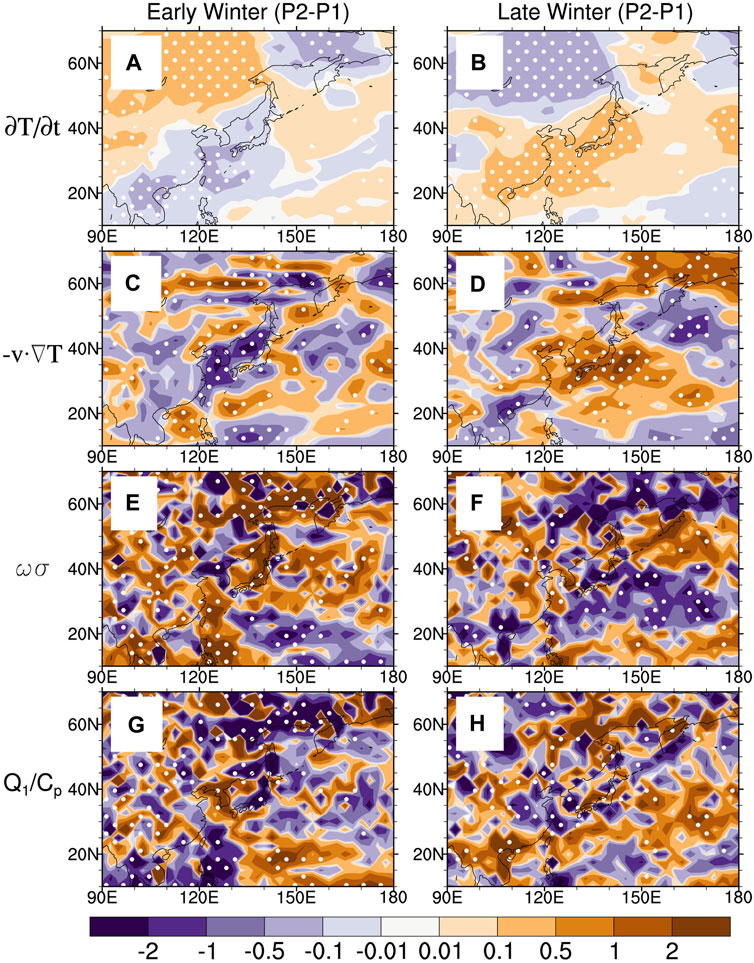
FIGURE 9. Difference in each contribution of the temperature tendency equations (shading; units: 10-4 Ks-1) between P2 and P1 in early and late winters at 850 hPa. (A,B), (C,D), (E,F), (G,H) represent the change in temperature over time, the temperature advection term, the adiabatic term and the diabatic heating term, respectively. The white dots represent p < 0.05.
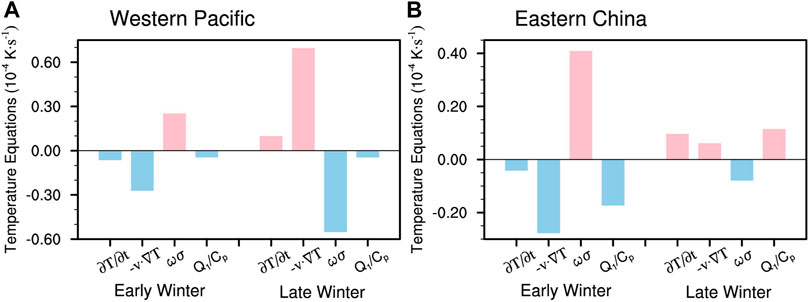
FIGURE 10. Regional averages of vertical integral difference in each contribution of the temperature tendency equations (shading; units: 10−4 K s−1) between P2 and P1 in early and late winters at 1000–850 hPa over (A) western Pacific (20–40°N, 120–150°E) and (B) east China.
The adiabatic term (
We used the FGOALS-F3-L model to verify the differences in the ECEs over eastern China in early and late winters and their mechanisms. Figure 11 shows the daily anomaly sequence of ECEs over eastern China in winter from 1980 to 2014 based on the FGOALS-F3-L model. First we compared the results of the ensemble mean of the three amip-hist simulations with the r1i1p1f1 ensemble member. We found that both can show the characteristics of a faster decrease of ECEs over eastern China in late winter than in early winter. Among them, the results of the ensemble mean of the three amip-hist simulations can better simulate the changes of ECEs in late winter, but aggravate the reduction in early late, thus narrowing the difference of ECEs between early winter and late winter (Figure 11A). In the results of the ensemble mean of the three amip-hist simulations, the reduction rate of ECEs in late winter (−0.08 days/decade, p < 0.12) was 1.33 times that of early winter (−0.06 days/decade, p < 0.17). In the results of the r1i1p1f1 ensemble member, the reduction rate of ECEs in late winter (−0.14 days/decade, p < 0.05) was 1.75 times that of early winter (−0.08 days/decade, p < 0.38) (Figure 11B). The results showed that the r1i1p1f1 ensemble member can better present the difference of ECEs over East Asia between early winter and late winter, and it is closer to the observational results (Figure 1B, the reduction rate of ECEs in late winter was 2.41 times that of early winter). In addition, Long et al. (2021) also indicated that the FGOALS_F3_L model of r1i1p1f1 can better simulate global temperature in the historical period, and is consistent with the multi-model ensemble mean of CMIP6. Therefore, we only give the results of atmospheric circulation for the r1i1p1f1 ensemble member.
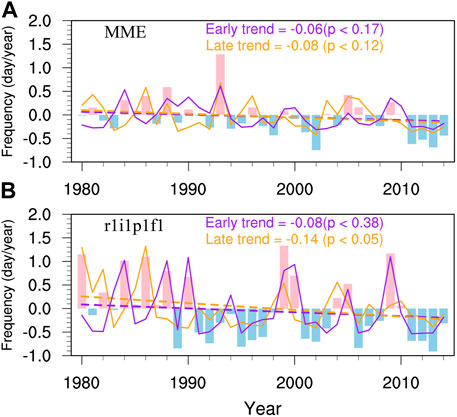
FIGURE 11. Time series of the number of days with ECEs (units: days/year) over eastern China in winter from 1980 to 2014 based on the FGOALS-F3-L data. (A) The ensemble mean of the three amip-hist simulations (MME), (B) the r1i1p1f1 ensemble member. The purple solid line represents early winter, the orange solid line represents late winter, the histogram shows the whole winter period, and the purple and orange dashed lines are the linear trends of early and late winters, respectively.
Figure 11 shows the atmospheric circulation anomalies during (P2 − P1) based on the FGOALS-F3-L model. At 500 hPa (Figures 12A,C), the northern hemisphere presented the negative phase of the AO. There were the positive geopotential height anomalies in the Arctic, there were negative geopotential height anomalies at 500hpa and 850hpa over East Asia, the EAT was stable and a northerly wind anomaly prevailed in East Asia in early winter. There was a cold cyclone in the north Pacific based on the FGOALS-F3-L model in early winter compared with the observations. This led to the NPAC being pushed south to the central Pacific, although the warm and moist air in the Pacific in early winter was still not transported to East Asia (Figure 12C). In late winter, the positive geopotential height anomalies in the Arctic based on the FGOALS-F3-L model were stronger than based on the observations (Figures 12B,D). However, the FGOALS-F3-L model can still present the observational results, which further confirms our previous conclusion that there may be other factors that cooperate with the HLBs and AO to affect ECEs in late winter. The NPAC was strong and westward and was accompanied by a high-pressure anomaly belt extending from the central Pacific to East Asia (Figure 12B). The circulation configuration at 850 hPa (Figure 12D) was similar to that at 500 hPa. These results show that the numerical model captured the inconsistent changes in ECEs over eastern China and the associated changes in the atmospheric circulations between early and late winters, especially the NPAC.

FIGURE 12. Difference in geopotential height (contours; units: gpm) and wind field (vectors; units: m/s) between P2 and P1 in (A,C) early winter and (B,D) late winter at 500 hPa and 850 hPa based on the r1i1p1f1 ensemble member in FGOALS-F3-L model. The white slanted lines represent p < 0.05.
This study showed significant differences in ECEs over eastern China between early and late winters, which may be a result of the synergy between the mid-to high-latitude atmospheric circulations (the HLB and AO) and the NPAC. The number of ECEs over eastern China decreased slightly in early winter over the last 20 years. Specifically, there has a dipole pattern that ECEs have increased in northeast China and slightly decreased in south and central China, leading to insignificant changes in early winter over eastern China. However, the number of ECEs over eastern China in late winter has uniformly and significantly reduced, with the greatest decrease in the Yangtze River Basin. China now presents a pattern of “cold early winter–warm late winter”. One thing needs attention that there are small differences between this study and previous studies (Johnson et al., 2018; Fu and Ding, 2021) on the changes of ECEs after 2000. Chinese ECEs increased significantly after 2000 in previous literature, but only weakly increased in this study, this may be caused by the differences in the data used and selected regions. As previous studies (Johnson et al., 2018; Fu and Ding, 2021) showed that the phased increase of extreme cold events in China after 2000 is mainly in north of China, which corresponds to the significant increasing trend of ECEs in northeast China (Figure 1B). In addition, the FGOALS model verified this characteristic that ECEs in eastern China increased after 2000 (Figure 11B).
The HLB and AO are the dominant factors affecting interdecadal variations in ECEs in East Asia in early winter (Figure 13A). The northern branch of the wave activity flux, which transports air masses from the Atlantic to northern Eurasia, was strengthened. This, in turn, strengthened the Ural blocking high, leading to a large-scale tilted ridge from the Ural Mountains to northern Asia. At the same time, the HLB increased and the weak NPAC transported warm air to the Arctic through Alaska, which squeezed cold air to the south, favoring the negative phase of the AO in early winter. Under this atmospheric circulation configuration, the SH was enhanced and moved to the south in early winter. The EAWM was also enhanced, the EAT was deeper and strong northerly winds guided the delivery of cold air from Siberia to China. This favored a dipole pattern with an increase of ECEs in northeast China and a decrease of ECEs in southeast China.
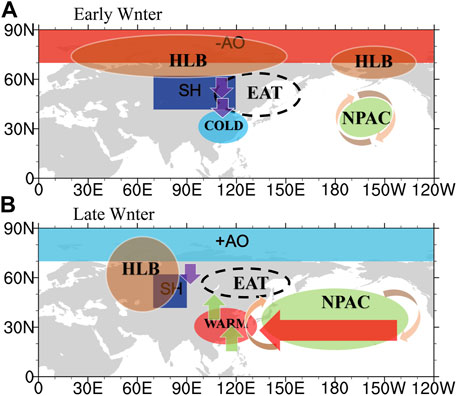
FIGURE 13. Schematic diagram of ECEs over eastern China in (A) early and (B) late winter. EAT, East Asian trough; NPAC, the anticyclonic anomaly over the north Pacific; COLD, cold east Asia; WARM, warm east Asia.
By contrast, in late winter (Figure 13B), the northern branch of the wave activity flux from the Atlantic to northern Eurasia weakened, followed by a decrease in the blocking high in northern Asia, which favored the positive phase of the AO. And the southern branch of the wave active flux intensified and was transported to the west of the NPAC, leading to a strong, more westward NPAC accompanied by a belt of high-pressure, high-temperature anomalies from the Central Pacific to East Asia. On the one hand, the belt of high-pressure anomalies prevented the southward movement of the EAT. On the other hand, the easterly wind anomaly on the southern side of the NPAC transported a large amount of warm and moist air to the western Pacific–East Asia through warm advection, which made East Asia a warm center and caused a uniform reduction in ECEs. The diabatic heating then intensified the East Asian warm anomaly, leading to a “warmer and warmer” pattern in East Asia in late winter during the last 20 years. In summer, NPAC and blocking high over northern Eurasia are key to the shift from the dipole pattern of ECEs (an increase of ECEs in northeast China and a decrease of ECEs in southeast China) in early winter to the uniform decrease pattern in late winter over eastern China.
Further analysis verified the main results based on the FGOALS-F3-L model. The numerical model not only can capture the inconsistent characteristics of ECEs in East Asia before and after winter, but also can reproduce the negative AO characteristics with the southward and deeper EAT in early winter and the positive AO characteristics with the stronger and wider NPAC.
Previous studies of ECEs at mid-latitudes have mainly focused on the high-latitude atmospheric circulations, such as the polar vortex, the Ural blocking high and the AO (Cohen et al., 2020), with less attention on the anomalous circulations over the Pacific. This study shows that significant differences in the NPAC are one of the main factors driving the inconsistent changes in ECEs between early and late winters. Although this mechanism has been verified using a preliminary numerical simulation, there are still some problems, including the trigger for the NPAC. Because the area affected by the NPAC coincides with the location of the Aleutian low, the Aleutian low was weak when the NPAC was strong. We therefore used the strength of the Aleutian low—that is, the regional average of the SLP in the north Pacific (27.5–72.5°N, 147.5°E–122.5°W) (Trenberth, 1990)—to represent the strength of the NPAC.
We found that the NPAC index has a good relationship with the previous sea surface temperature mode, especially the tripole index for the interdecadal Pacific oscillation (TPI). The negative TPI from the summer of the previous year continues to affect the NPAC and is enhanced in the winter of the current year (Supplementary Table S1). By comparing the correlation coefficient between the TPI index and the NPAC, we found that, the TPI likely has a relatively weak impact on the NPAC in early winter (correlation coefficient = 0.361; p < 0.05), and has a stronger impact on the NPAC in late winter (correlation coefficient = 0.643; p < 0.001). The TPI in pre-summer has no significant relationship with the NPAC in early winter, but has a significantly high correlation with the NPAC in late winter. This high correlation is stable from pre-summer to late winter. We suggest that this previous TPI may be related to the difference in the NPAC between early and late winters. However, why a negative TPI has a weak impact in early winter, but a more significant impact in late winter, and whether there is a key factor that strengthens this significant impact require further research.
The original contributions presented in the study are included in the article/supplementary material, further inquiries can be directed to the corresponding authors.
WD: Methodology, data curation, writing-original draft preparation; LZ: Conceptualization and editing; WC, CG, and XS: Conceptualization and writing-reviewing; HY: Data curation.
This research was funded by the National Natural Science Foundation of China (41790471, 42075040, 41975054), the Strategic Priority Research Program of the Chinese Academy of Sciences (XDA20100304), and the National Key Research and Development Program of China (2018YFA0606203, 2019YFC1510400).
We thank the reviewers and editor for insightful remarks. The authors thank ECMWF for providing ERA5 reanalysis and the Institute of Atmospheric Physics, Chinese Academy of Sciences for providing the FGOALS-F3-L model data. We acknowledge the High Performance Computing Center of Nanjing University of Information Science and Technology for their support of this work.
The authors declare that the research was conducted in the absence of any commercial or financial relationships that could be construed as a potential conflict of interest.
The reviewer ZY declared a shared affiliation with the authors WD, XS, and HY to the handling editor at the time of review.
All claims expressed in this article are solely those of the authors and do not necessarily represent those of their affiliated organizations, or those of the publisher, the editors and the reviewers. Any product that may be evaluated in this article, or claim that may be made by its manufacturer, is not guaranteed or endorsed by the publisher.
The Supplementary Material for this article can be found online at: https://www.frontiersin.org/articles/10.3389/fenvs.2022.923228/full#supplementary-material
Chen, X., Luo, D., Feldstein, S. B., and Lee, S. (2018). Impact of winter ural blocking on Arctic sea ice: Short-time variability. J. Clim. 31 (6), 2267–2282. doi:10.1175/JCLI-D-17-0194.1
Cohen, J., Zhang, X., Francis, J., Jung, T., Yoon, J., Overland, J., et al. (2020). Divergent consensuses on arctic amplification influence on mid-latitude severe winter weather. Nat. Clim. Chang. 10, 20–29. doi:10.1038/s41558-019-0662-y
Dai, H., Fan, K., and Liu, J. (2019). Month-to-month variability of winter temperature over Northeast China linked to sea ice over the Davis Strait–baffin Bay and the Barents–Kara Sea. J. Clim. 32, 6365–6384. doi:10.1175/JCLI-D-18-0804.1
Dai, H., and Fan, K. (2022). Subseasonal reversal of winter temperature over Northeast China in 2014/2015: Role of Arctic sea ice. Front. Environ. Sci. 10. doi:10.3389/fenvs.2022.852673
Detring, C., Müller, A., Schielicke, L., Névir, P., and Rust, H. W. (2021). Occurrence and transition probabilities of omega and high-over-low blocking in the Euro-Atlantic region. Weather Clim. Dynam. 2, 927–952. doi:10.5194/wcd-2-927-2021
Ding, Y. H., and Ma, X. Q. (2007). Analysis of isentropic potential vorticity for a strong cold wave in 2004/2005 winter. Acta Meteor Sin. (in Chin. 65, 695–707. doi:10.1029/2007JD008874
Dong, W., Zhao, L., Zhou, S. W., and Shen, X. Y. (2020). A synergistic effect of blockings on a persistent strong cold surge in east asia in january 2018. Atmosphere 11 (2), 215. doi:10.3390/atmos11020215
Fu, D., and Ding, Y. (2021). The study of changing characteristics of the winter temperature and extreme cold events in China over the past six decades. Int. J. Climatol. 41, 2480–2494. doi:10.1002/joc.6970
Gong, D. Y., Wang, S. W., and Zhu, J. H. (2001). East Asian winter monsoon and arctic oscillation. Geophys. Res. Lett. 28 (10), 2073–2076. doi:10.1029/2000GL012311
Guan, W., Jiang, X., Ren, X., Chen, G., and Ding, Q. (2020). Role of atmospheric variability in driving the “warm‐arctic, cold‐continent” pattern over the north America sector and sea ice variability over the chukchi‐bering sea. Geophys. Res. Lett. 47 (13). doi:10.1029/2020gl088599
Han, R. Q., Shi, L., and Yuan, Y. (2021). Analysis on the causes of cold and warm transition in China during the winter of 2020/2021. Acta Meteor Sin. (in Chin. 47 (07), 880–892. doi:10.7519/j.issn.1000-0526.2021.07.011
Hassanzadeh, P., and Kuang, Z. (2015). Blocking variability: Arctic amplification versus arctic oscillation. Geophys. Res. Lett. 42, 8586–8595. doi:10.1002/2015GL065923
He B, B., Liu, Y., Wu, G., Bao, Q., Zhou, T., Wu, X., et al. (2020). CAS FGOALS-f3-L model datasets for CMIP6 GMMIP Tier-1 and Tier-3 experiments. Adv. Atmos. Sci. 37 (1), 18–28. doi:10.1007/s00376-019-9085-y
He, B., Bao, Q., Wang, X., Zhou, L., Wu, X., Liu, Y., et al. (2019). CAS FGOALS-f3-L model datasets for CMIP6 historical atmospheric model intercomparison project simulation. Adv. Atmos. Sci. 36, 771–778. doi:10.1007/s00376-019-9027-8
He S, S., Xu, X., Furevik, T., and Gao, Y. (2020). Eurasian cooling linked to the vertical distribution of Arctic warming. Geophys. Res. Lett. 47, e2020GL087212. doi:10.1029/2020gl087212
He, S., Gao, Y., Li, F., Wang, H., and He, Y. (2017). Impact of arctic oscillation on the east asian climate: A review. Earth-Science Rev. 164, 48–62. doi:10.1016/j.earscirev.2016.10.014
Huang, Y. J., and Hu, Y. Y. (2006). Trends of winter temperatures in China. Acta Meteor Sin. (in Chin. 05, 614–621. doi:10.3321/j.issn:0577-6619.2006.05.008
Jhun, J.-G., and Lee, E.-J. (2004). A new East Asian winter monsoon index and associated characteristics of the winter monsoon. J. Clim. 17, 711–726. doi:10.1175/1520-0442(2004)017<0711:ANEAWM>2.0.CO;2
Johnson, N. C., Xie, S. P., Kosaka, Y., and Li, X. (2018). Increasing occurrence of cold and warm extremes during the recent global warming slowdown. Nat. Commun. 9, 1724. doi:10.1038/s41467-018-04040-y
Kim, H. J., Son, S. W., Moon, W., Kug, J. S., and Hwang, J. (2021). Subseasonal relationship between Arctic and Eurasian surface air temperature. Sci. Rep. 11, 4081. doi:10.1038/s41598-021-83486-5
Labe, Z. M., Peings, Y., and Magnusdottir, G. (2020). Warm Arctic, cold Siberia pattern: Role of full Arctic amplification versus sea ice loss alone. Geophys. Res. Lett. 47, e2020GL088583–545. doi:10.1029/2020gl088583
Li, F., Wang, H., and Gao, Y. (2014). On the strengthened relationship between the east asian winter monsoon and arctic oscillation: A comparison of 1950–70 and 1983–2012. J. Clim. 27 (13), 5075–5091. doi:10.1175/jcli-d-13-00335.1
Li, H., Fan, K., He, S., Liu, Y., Yuan, X., Wang, H., et al. (2021). Intensified impacts of central pacific ENSO on the reversal of december and january surface air temperature anomaly over China since 1997. J. Clim. 34 (5), 1601–1618. doi:10.1175/JCLI-D-20-0048.1
Lin, D. W., Bueh, C., and Xie, Z. W. (2018). Classification of wintertime large-scale tilted ridges over the eurasian continent and their influences on surface air temperature. Atmos. Ocean. Sci. Lett. 11 (5), 404–411. doi:10.1080/16742834.2018.1505405
Long, S.-M., Hu, K.-M., Li, G., Huang, G., and Qu, X. (2021). Surface temperature changes projected by FGOALS models under low warming scenarios in CMIP5 and CMIP6. Adv. Atmos. Sci. 38 (2), 203–220. doi:10.1007/s00376-020-0177-5
Lü, Z., Li, F., Orsolini, Y. J., Gao, Y., and He, S. (2020). Understanding of European cold extremes, sudden stratospheric warming, and siberian snow accumulation in the winter of 2017/18. J. Clim. 33 (2), 527–545. doi:10.1175/jcli-d-18-0861.1
Luo, D., Xiao, Y., Yao Y, Y., Franzke, C. L. E., Dai A., , and Simmonds, I. (2016). Impact of ural blocking on winter warm arctic-cold eurasian anomalies. Part I: Blocking-induced amplification. J. Clim. 29 (11), 3925–3947. doi:10.1175/JCLI-D-15-0611.1
Luo, D., Yao, Y., Dai, A., Simmonds, I., and Zhong, L. (2017). Increased quasi stationarity and persistence of winter ural blocking and eurasian extreme cold events in Response to arctic warming. Part II: A theoretical explanation. J. Clim. 30 (10), 3569–3587. doi:10.1175/JCLI-D-16-0262.1
Park, T. W., Ho, C. H., and Song, Y. (2011). Relationship between the arctic oscillation and cold surges over East Asia. J. Clim. 24 (1), 68–83. doi:10.1175/2010JCLI3529.1
Qi, L., and Pan, W. (2021). Variability of the phase reversal of the east asia temperature from early to late winter and the possible influencing factors. Chin. J. Atmos. Sci. (in Chinese) 45 (5), 1039–1056. doi:10.3878/j.issn.1006-9895.2011.20181
Si, D., Jiang, D., Lang, X., and Fu, S. (2021). Unprecedented north American snowstorm and east asian cold wave in january 2016: Critical role of the arctic atmospheric circulation. Atmos. Sci. Lett. 22 (11). doi:10.1002/asl.1056
Trenberth, K. E. (1990). Recent observed interdecadal climate changes in the northern hemisphere. Bull. Am. Meteorol. Soc. 71 (7), 988–993. doi:10.1175/1520-0477(1990)071<0988:ROICCI>2.0.CO;2
Tyrlis, E., Bader, J., Manzini, E., and Matei, D. (2021). Reconciling different methods of high-latitude blocking detection. Q. J. R. Meteorol. Soc. 147, 1070–1096. doi:10.1002/qj.3960
Wei, W., Wang, L., Chen, Q., Liu, M., and Li, Z. (2020). Definition of early and late winter and associated interannual variations of surface air temperature in China. Chinese Journal of Atmospheric Sciences (in Chinese) 44 (1), 122–137. doi:10.3878/j.issn.1006-9895.1904.18238
Woollings, T., Barriopedro, D., Methven, J., Son, S. W., Martius, O., Harvey, B., et al. (2018). Blocking and its Response to climate change. Curr. Clim. Change Rep. 4, 287–300. doi:10.1007/s40641-018-0108-z
Wu, B., and Wang, J. (2002). Winter arctic oscillation, siberian high and east asian winter monsoon. Geophys. Res. Lett. 29 (19), 3-1–3-4. doi:10.1029/2002GL015373
Xu, X., Li, F., He, S., and Wang, H. (2018). Subseasonal reversal of east asian surface temperature variability in winter 2014/15. Adv. Atmos. Sci. 35, 737–752. doi:10.1007/s00376-017-7059-5
Yang, S., Lau, K-M., and Kim, K-M. (2002). Variations of the East Asian jet stream and Asian-Pacific-American winter climate anomalies. J Clim 15, 306–325. doi:10.1175/1520-0442(2002)015<0306:VOTEAJ>2.0.CO;2
Yu, M., Ma, S., and Zhu, C. (2022). The alternating change of cold and warm extremes over North Asia during winter 2020/21: Effect of the annual cycle anomaly. Geophysical Research Letters 49, e2021GL097233. doi:10.1029/2021GL097233
Yun, J., Ha, K. J., and Jo, Y. H. (2018). Interdecadal changes in winter surface air temperature over East Asia and their possible causes. Clim. Dyn. 51, 1375–1390. doi:10.1007/s00382-017-3960-y
Zhang, X., Alexander, L., Hegerl, G. C., Jones, P., Klein Tank, A., Peterson, T. C., et al. (2011). Indices for monitoring changes in extremes based on daily temperature and precipitation data. WIREs Clim. Change 2, 851–870. doi:10.1002/wcc.147
Zhang, Y., Sperber, K. R., and Boyle, J. S. (1997). Climatology and interannual variation of the east asian winter monsoon: Results from the 1979–95 NCEP/NCAR reanalysis. Mon Weather Rev 125, 2605–2619. doi:10.1175/1520-0493(1997)125<2605:CAIVOT>2.0.CO;2
Zhang, Y. J., Yin, Z. C., Wang, H. J., and He, S. P. (2021). 2020/21 record-breaking cold waves in east of China enhanced by the ‘Warm Arctic-Cold Siberia’ pattern. Environ. Res. Lett. 16, 094040. doi:10.1088/1748-9326/ac1f46
Keywords: early and late winters, extreme cold events, high-latitude blocking, Arctic Oscillation, anticyclonic anomaly over the North Pacific
Citation: Dong W, Zhao L, Cheng W, Guo C, Shen X and Yao H (2022) Inconsistent trends between early and late winters in extreme cold events in China from 1980 to 2021. Front. Environ. Sci. 10:923228. doi: 10.3389/fenvs.2022.923228
Received: 19 April 2022; Accepted: 14 July 2022;
Published: 10 August 2022.
Edited by:
Lejiang Yu, Polar Research Institute of China, ChinaReviewed by:
Shengping He, University of Bergen, NorwayCopyright © 2022 Dong, Zhao, Cheng, Guo, Shen and Yao. This is an open-access article distributed under the terms of the Creative Commons Attribution License (CC BY). The use, distribution or reproduction in other forums is permitted, provided the original author(s) and the copyright owner(s) are credited and that the original publication in this journal is cited, in accordance with accepted academic practice. No use, distribution or reproduction is permitted which does not comply with these terms.
*Correspondence: Liang Zhao, emhhb2xAbGFzZy5pYXAuYWMuY24=; Wei Cheng, Y2hlbmd3QG1haWwuaWFwLmFjLmNu; Chunyan Guo, Z3VvY3kxMjY2QDEyNi5jb20=; Xinyong Shen, c2hlbnh5QG51aXN0LmVkdS5jbg==
Disclaimer: All claims expressed in this article are solely those of the authors and do not necessarily represent those of their affiliated organizations, or those of the publisher, the editors and the reviewers. Any product that may be evaluated in this article or claim that may be made by its manufacturer is not guaranteed or endorsed by the publisher.
Research integrity at Frontiers
Learn more about the work of our research integrity team to safeguard the quality of each article we publish.