 Wanling Xu1,2Xiangyong Lei1,2Shiting Chen1,2Tingting Yu2Zengyun Hu3Meng Zhang1,2Lizhi Jiang4Ruijuan Bao4Xiaojun Guan4Miaomiao Ma5Jianhui Wei6Lu Gao1,2,7,8*Aixia Feng9*
- 1Institute of Geography, Fujian Normal University, Fuzhou, China
- 2College of Geographical Science, Fujian Normal University, Fuzhou, China
- 3State Key Laboratory of Desert and Oasis Ecology, Xinjiang Institute of Ecology and Geography, Chinese Academy of Sciences, Urumqi, China
- 4Fujian Key Laboratory of Severe Weather, Fuzhou, China
- 5China Institute of Water Resources and Hydropower Research, Beijing, China
- 6Institute of Meteorology and Climate Research, Karlsruhe Institute of Technology, Karlsruhe, Germany
- 7Fujian Provincial Engineering Research Center for Monitoring and Accessing Terrestrial Disasters, Fujian Normal University, Fuzhou, China
- 8Key Laboratory for Humid Subtropical Eco-geographical Processes of the Ministry of Education, Fujian Normal University, Fuzhou, China
- 9Data Service Office, National Meteorological Information Center, Beijing, China
The fifth-generation atmospheric reanalysis of the European Center for Medium-Range Weather Forecasts (ERA5) is the latest reanalysis product. However, the reliability of ERA5 to capture extreme temperatures is still unclear over China. Hence, based on conventional meteorological station data, a new criterion (DISO) was used to validate the ERA5 capturing extreme temperature indices derived from the Expert Team on Climate Change Detection and Indices (ETCCDI) across the six subregions of China on different timescales. The conclusions are as follows: the original daily temperatures (mean temperature, maximum temperature, and minimum temperature) can be well reproduced by ERA5 reanalysis over China. ERA5 tends to exhibit more misdetection for the duration of extreme temperature events than extreme temperature intensity and frequency. In addition, ERA5 performed best in the summer and worst in the winter, respectively. The trend of absolute indices (e.g., TXx and TNx), percentile-based indices (e.g., TX90p, TX10p, TN90p, and TN10p), and duration indices (e.g., WSDI, CSDI, and GSL) can be captured by ERA5, but ERA5 failed to capture the tendency of the diurnal temperature range (DTR) over China. Spatially, ERA5 performs well in southeastern China. However, it remains challenging to accurately recreate the extreme temperature events in the Tibetan Plateau. The elevation difference between the station and ERA5 grid point contributes to the main bias of reanalysis temperatures. The accuracy of ERA5 decreases with the increase in elevation discrepancy.
1 Introduction
Global warming is unequivocal. Global surface temperature data show that the temperature in 2011–2020 was 1.09 (0.95–1.20)°C warmer than in 1850–1900 (IPCC, 2021). Climate change has resulted in the strengthening of extreme weather and climate events in every region worldwide. Many scholars have observed significant changes in extreme cold and warm weather at global or regional scales (Zhang et al., 2019; Sheridan et al., 2020; Lei et al., 2021a). Extreme high-temperature events can cause heatwaves and droughts, which directly affect human survival, health, and crop growth (Alexander et al., 2006; Donat et al., 2014; Jiang et al., 2019; Zhan et al., 2020; Watts et al., 2021). A recent report by the World Meteorological Organization (WMO) has shown that the high-temperature heatwaves in Russia killed approximately 55,736 people in 2010, which is described as one of the top ten disasters causing the most casualties in 1979–2019 (World Meteorological Organization, 2021).
It is well established that three main types of data sources have been used in extreme weather and climate event research: conventional observation data, atmospheric reanalysis datasets, and satellite-based datasets (Best et al., 2004; Gao C. et al., 2012, 2018; Diamond et al., 2013; He and Zhao, 2018). Atmospheric reanalysis dataset is a global data resource, which has the advantages of comprehensive spatial coverage, a continuous long-term timescale, and a higher spatial and temporal resolution. It can compensate for the disadvantages of the limited and uneven station data (Kistler et al., 2001; Uppala et al., 2005; Gao C. et al., 2012; Gao L. et al., 2012, 2014, 2016b, 2018; Turner et al., 2021). Hence, reanalysis datasets have gradually become an indispensable foundation and reference for climate impact and variability assessment research (IPCC, 2021).
With the rapid development of reanalysis data, the current extensively used reanalysis data include reanalysis products released by the National Centers for Environmental Prediction (NCEP) and the National Center for Atmospheric Research (NCAR) (Kalnay et al., 1995), the CFSR and CFSv2 produced by the NCEP and Department of Energy (Kanamitsu et al., 2002; Saha et al., 2010), Japan reanalysis JRA-25 (Onogi et al., 2007) and JRA-55 (Onogi et al., 2015), the European Centre for Medium-Range Weather Forecasts (ECMWF) FGGE (Boer, 1986), ERA-15 (Sprenger and Wernli, 2003), ERA40 (Uppala et al., 2005), ERA-Interim (Berrisford et al., 2011), and ERA5 (Hersbach et al., 2020). Among them, ERA5 is the latest generation of reanalysis data, which has wider assimilation data sources, greater spatial-temporal resolution, and more advanced four-dimensional variational analysis (4DVAR) than other reanalysis datasets (Hersbach et al., 2020). Many studies have demonstrated that the ability of the ERA5 dataset in describing the real atmospheric condition is better than that of the other reanalysis datasets (Albergel et al., 2018; Olauson, 2018; Urraca et al., 2018; Tarek et al., 2020a). However, reanalysis data are a non-independent dataset, which has errors due to observing systematic errors, the changing of the numerical prediction model, and different assimilation systems. Therefore, the objective evaluation for the credibility and accuracy of reanalysis datasets before the application of reanalysis products plays a crucial role in climate change research (Gao L. et al., 2012; Pappenberger et al., 2015).
Numerous studies have focused on the applicability of reanalysis data in the temperature field. On the global scale, Poli et al. (2016) compared the temperature data on the ERA-20C with the observation and demonstrated that the reanalysis data was 1K colder than the night observational data within 65° north-south latitude. Kozubek et al. (2020) indicated that the trend of temperature from ERA5 data has good consistency with observations data. Liu et al. (2021) confirmed that the land surface temperature data on ERA5 products are highly consistent with the trend derived from satellite data in 2003–2017. On the regional scale, the research of evaluating the credibility of reanalysis data over China has received extensive attention. You et al. (2013) evaluated the ability of NCEP/NCAR and ECMWF reanalysis data to simulate extreme temperature events and found that two reanalysis products have substantial differences in reproducing the long-term trend of the extreme temperature indices. Gao L. et al. (2012), Gao et al. (2014), and Gao et al. (2016a) demonstrated that reanalysis datasets can reproduce China’s temperature fields well and deduced that the altitude difference can cause significant temperature deviation. Zou et al. (2022) investigated the performance of ERA5-Land in southeast coastal China and concluded that ERA5-Land can capture daily and monthly temperature variations well. Huang et al. (2021) found that ERA5-Land temperature performed better than the Global Land Data Assimilation System (GLDAS) but worse than the China Meteorological Administration Land Data Assimilation System (CLDAS) over China.
Overall, most of the current reanalysis data applicability research focuses on the performance of original data and hardly emphasizes the accuracy of identifying extreme weather events (Sheridan et al., 2020). Regarding evaluation methods, the research usually applied single indicator such as the root mean square error (RMSE), correlation coefficient (CC), absolute error (AE), relative bias (RB), and the standard deviation (STD) (Gleixner et al., 2020; Jiang et al., 2020; Zheng 2020). However, it probably happens that individual indicators perform well, while others perform relatively poor, making it impossible to judge directly. Accordingly, the distance between indices of simulation and observation (DISO) combined with the CC, NRMSE, NMAE, and RB was used to evaluate the applicability of ERA5. The best advantage of DISO is that it can represent the performance of simulation at different stations after normalizing the reanalysis data and observational data (Hu et al., 2019; Deng et al., 2021). In addition, further research is required to determine the credibility of the latest ERA5 reanalysis dataset in capturing extreme temperature events at different timescales over various Chinese regions, which is not limited to the analysis of heatwave event trends or spatial distribution characteristics (Albergel et al., 2018; Kozubek et al., 2020; Awasthi 2021). China is one of the most climate-sensitive and ecologically fragile areas worldwide because of its sophisticated geographic environment and unique multi-climate conditions (Cheng et al., 2019). Extreme weather events such as heatwaves and drought disasters are frequent under the joint influence of summer monsoon circulation and mid-high latitude circulation. Therefore, clarifying the deviation and correlation between the ERA5 data and the observational data in recognizing extreme temperature events is influential to developing global atmospheric reanalysis products and regional climate change analysis.
The structure of this article is as follows: Section 2 introduces the data and methods applied in this study. The validation of ERA5 original data is presented in Section 3.1. The applicability of ERA5 data in capturing extreme temperature events in six subregions of China at different timescales is shown in Sections 3.2 and 3.3. The comparison of the trend of extreme temperatures computed from ERA5 and meteorological station data is described in Section 3.4, and the analysis of possible bias is discussed in Section 3.5. The conclusions are summarized in Section 4.
2 Data and Methods
2.1 Study Area
The terrain of China is high in the west and low in the east and includes mountains, plateaus, hills, basins, and plains. Mountains and plateaus are the main components of China’s topography. The undulations and differences in landforms and various complex climate characteristics substantially affect the spatial distribution of the surface temperature. Consequently, the country is classified into six major regions, according to the latest geomorphologic division to evaluate the applicability of ERA5 temperature data in different regions of China (Cheng et al., 2019). Table 1 shows the information on six subregions of China.
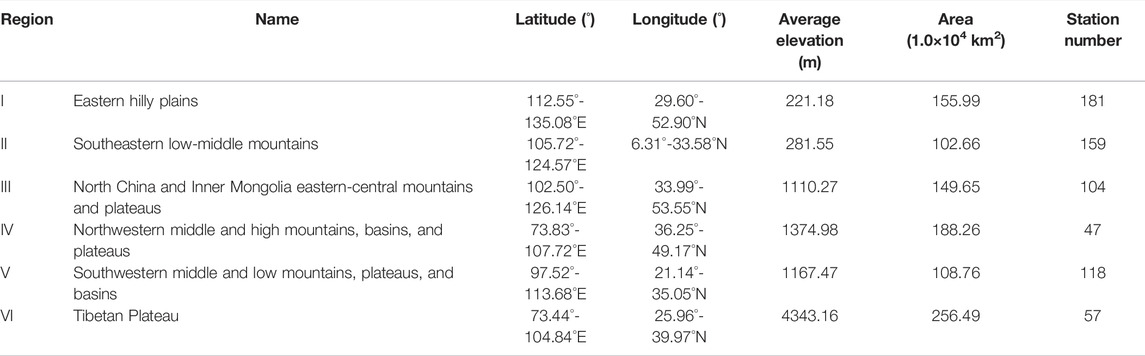
TABLE 1. Geomorphological regionalization information.
Figure 1 shows the ground meteorological stations and annual mean temperature distribution over China. There are numerous, evenly distributed observations in eastern China (regions I, II, III, IV, and V) and few observations in western China (regions IV, and VI). The annual mean temperature gradually decreases from the southeast coast to the inland. The annual mean temperature of regions II and V is approximately 15.00°C, and the annual mean temperature in the north of regions I, III, and VI is approximately 0.00°C.
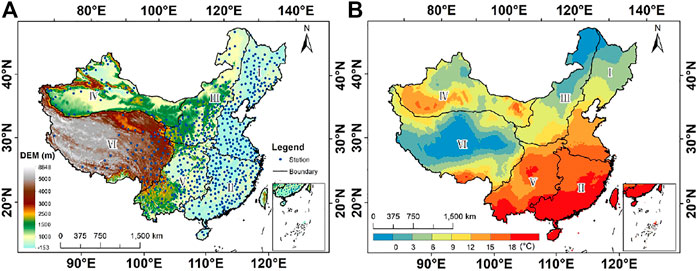
FIGURE 1. Study area information. (A) Meteorological stations and topography. (B) Mean annual temperature.
2.2 Observations and ERA5
The meteorological stations are from the China Meteorological Data Network (http://data.cma.cn/); an amount of 666 meteorological observational data in China were selected in a common time series with ERA5 in the period of 1979–2020. The observational data (daily mean temperature, the daily maximum temperature, and the daily minimum temperature data) were subject to rigorous quality inspection. Moreover, the missing daily data from the observations are ignored in the calculation of extreme temperature indices.
ERA5 is the latest reanalysis product from the ECMWF (Hersbach et al., 2020). The complete ERA5 data released so far start in 1979 and extend forward in near real-time, with a three-month lag. ERA5 provides hourly estimates of many atmospheric, land, and oceanic climate variables. The data cover the Earth on a 31-km grid and resolve the atmosphere using 137 levels from the surface up to a height of 80 km (https://confluence.ecmwf.int/display/CKB/ERA5). ERA5 has a more advanced 4DVAR assimilation system and higher spatial and temporal resolution than other reanalysis products (Hersbach et al., 2020). ERA5 has also been enhanced in terms of data selection, quality control, bias correction, and performance monitoring techniques (Albergel et al., 2018; Gleixner et al., 2020). The Euclidean distance is used to calculate the nearest ERA5 grid to the Obs stations to obtain the ERA5 temperature data corresponding to the Obs stations. The coordinated universal time of ERA5 is converted to a daily scale to remain consistent with the Obs stations in this study.
2.3 Methods
2.3.1 Extreme Temperature Indices
The WMO and the World Climate Research Program (WCRP) jointly defined representative climate change detection indices to create consistency of extreme event indicators and thresholds in all countries (Alexander et al., 2006; Donat et al., 2014; You et al., 2013). The indices include extreme temperature indices and extreme precipitation indices, which are currently widely used in extreme climate research. The extreme temperature indices can represent extreme event changes in intensity, frequency, and duration, which are divided into 5 categories: 1) absolute indices (TXx, TXn, TNn, and TNx), 2) threshold indices (ID0, FD0, TR20, and SU25), 3) percentile-based indices (TX10p, TX90p, TN10p, and TN90p), 4) duration indices (CSDI, WSDI, and GSL), and 5) other indices (DTR) (Table 2) (Alexander et al., 2006). In addition, TXx and TNx have also been calculated on monthly timescales to evaluate the performance of ERA5 for capturing the extreme temperature indices at monthly and seasonal scales.
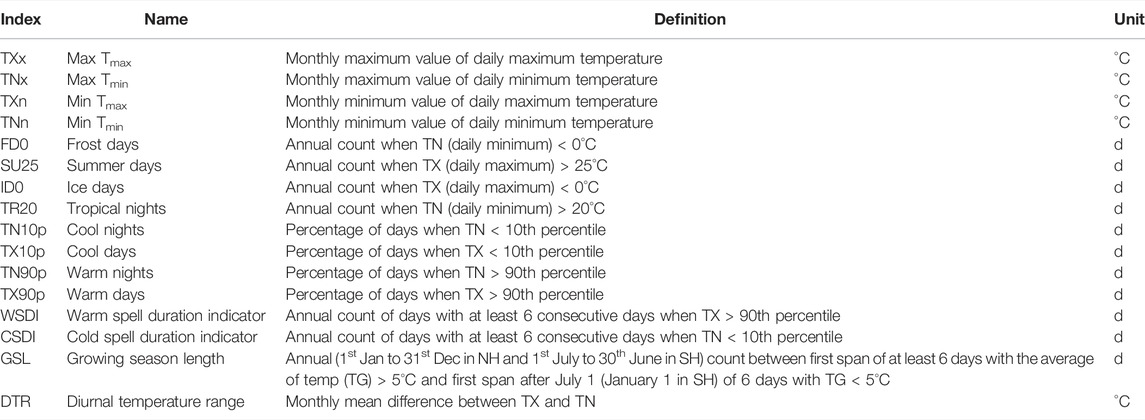
TABLE 2. Definition of extreme temperature indices.
Notably, climate characteristics among regions in China are substantially different. Individual indices do not apply to all regions. For instance, the Tibetan Plateau has a high altitude and low annual temperature, which rarely has a daily minimum temperature of >20°C. Thus, the TR20 index (annual count when the daily minimum is >20°C) is not applicable for region VI to evaluate the reliability of ERA5. Similarly, the daily maximum temperature is always greater than 0.00°C in southern China, and the ID0 index (annual count when the daily maximum is <0°C) is also not appropriate. Therefore, regional indices are selected based on the regional-specific climate feature to conduct a greater accuracy analysis of the extreme indices for each region (Table 3).
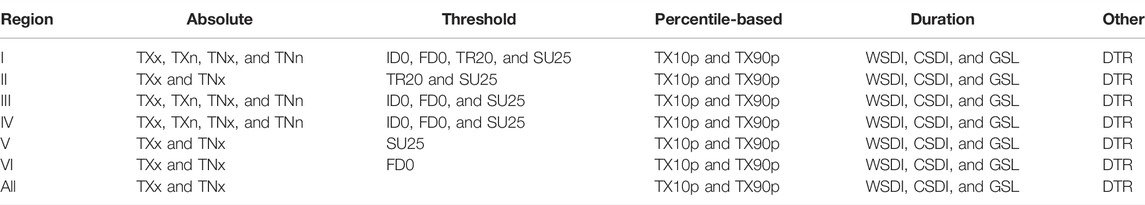
TABLE 3. Extreme temperature indices for six regions over China.
2.3.2 Trend Analysis
The Mann–Kendall (MK) test is a nonparametric statistical test method used extensively in meteorological statistical research (Machiwal et al., 2019; Lei et al., 2021b). Yue and Wang (2002) proposed “prewhitening” before the MK test to eliminate the effect of the serial correlation in trend detection so that the trend of series has improved credibility. Many scholars (Burn and Hag Elnur, 2002; Mirdashtvan and Mohseni Saravi, 2020; Lei et al., 2021a; Shin et al., 2021) have used the prewhitening Mann–Kendall (PWMK) trend test method to describe the trend variation of relative humidity, surface temperature, and other hydrological and meteorological variables in various climatic zones and argued that the trend of prewhitening correction has greater accuracy than the MK. This study used the PWMK to calculate the trend of extreme temperature indices in ERA5 data and station data.
2.3.3 Evaluation Criteria
Table 4 demonstrates the evaluation criteria used to quantitatively assess the applicability of ERA5, comprising the NRMSE, NMAE, RB, and CC. In addition, this study adopted a new comprehensive indicator DISO, with the advantage of evaluating the simulation accuracy of data more comprehensively than other indicators, instead of a single indicator limited to describing unilateral performance (Hu et al., 2019; Deng et al., 2021). The DISO had been confirmed more flexible to express the quality of models or datasets than the Taylor diagram (Xu and Han, 2020; Zhou et al., 2021).
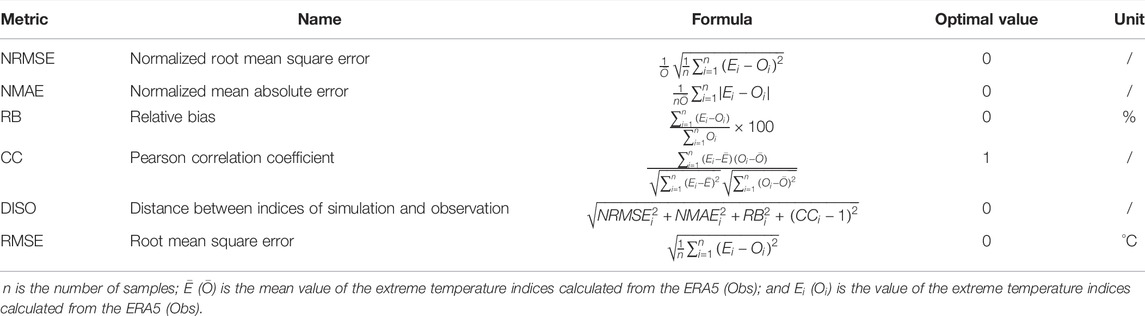
TABLE 4. Evaluation criteria used in this study.
The main distribution range of the DISO is between 0.0 and 1.0 in this study. Generally accepted is that the smaller the value of DISO, the more accurate are the data (Xu and Han, 2020). Therefore, the value of DISO is divided into two groups: 0.0–0.5 and above 0.5 to investigate the capabilities of ERA5 for each region. It is implied that ERA5 can capture extreme temperature events well when DISO is less than 0.5 (Hu et al., 2019). Moreover, RB was divided into two groups: less than 0.0 and greater than 0.0. The RB less than 0.0 or above 0.0 was considered to mean that ERA5 relatively underestimates or overestimates the observational data, respectively.
3 Results and Discussion
3.1 Validation of ERA5 Temperatures
Figure 2 demonstrates the DISO distribution of original temperature data (mean temperature, maximum temperature, and minimum temperature) at daily timescales based on ERA5 and observations in 1979–2020. Three types of temperature data all have above 50% stations with the DISO value less than 0.5, indicating that the original temperature data of ERA5 have a good agreement with observational data.
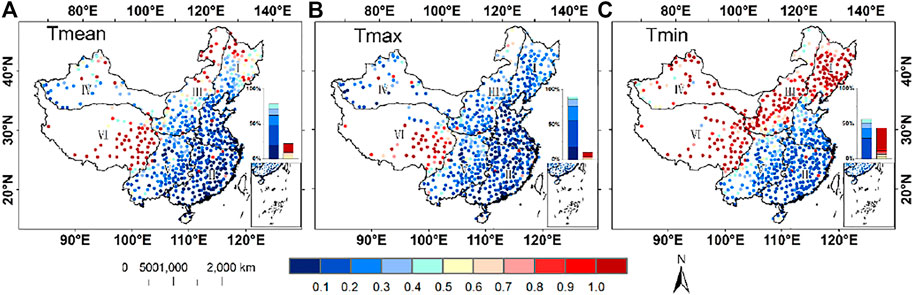
FIGURE 2. DISO performance over China from 1979 to 2020 for Tmean (A), Tmax (B), and Tmin (C).
The average DISO of Tmean is 0.74. There are 562 stations with a DISO value smaller than 0.5, accounting for 84.38% of total stations in China. It can be seen that Region VI, the northern part of Region I, and Region III show higher DISO than the other regions. In other words, the mean temperature data from ERA5 have large deviations in these regions. The DISO values of Tmax are very small, with an average of 0.28. There are approximately 90.00% of stations with a DISO less than 0.5. More than half of the stations even have lower DISO values (less than 0.2). Only 28 stations have a DISO value above 1.0, which are located in Region VI. The performance of Tmin is worse than that of other data types. There are more than 20% of stations with a DISO greater than 1.0 over China, which are mainly distributed in Regions III, IV, VI and the northern part of Region I. DISO presents a “southeast-northwest” distribution, increasing from the southeast coastal area to the northwest inland area.
Generally, the performances of ERA5 for mean temperature and maximum temperature data are more ideal than those for the minimum temperature. ERA5 tends to misdetect the minimum temperature. From the respective spatial distribution, the reliability of ERA5 original temperature data in southeast China is higher than in other regions. ERA5 performs poorly in the Tibetan Plateau, which is common for other reanalysis products in previous studies (Gao C. et al., 2012; Gao et al., 2016a; Huang et al., 2021; Jiang et al., 2021).
3.2 Validation of ERA5 Extreme Temperatures
3.2.1 Overall China
To further quantitatively evaluate the ability of ERA5 data to reproduce extreme temperature events, DISO was calculated by ERA5 and observations of extreme temperature indices. Table 5 summarizes the specific performance of ERA5 data for extreme temperature indices in each subregion. DISO ranges from 0.16 to 1.21 with an average of 0.48 for all stations. Figure 3 demonstrates the spatial distribution of DISO for extreme temperature indices over China. There are discrepancies in various regions for ERA5 to capture different extreme temperature indices.
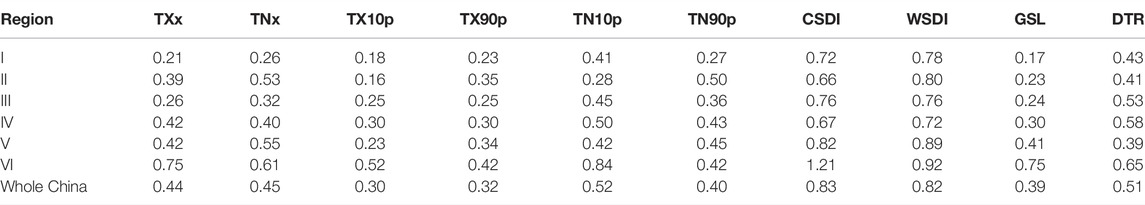
TABLE 5. DISO for extreme temperature indices over China.
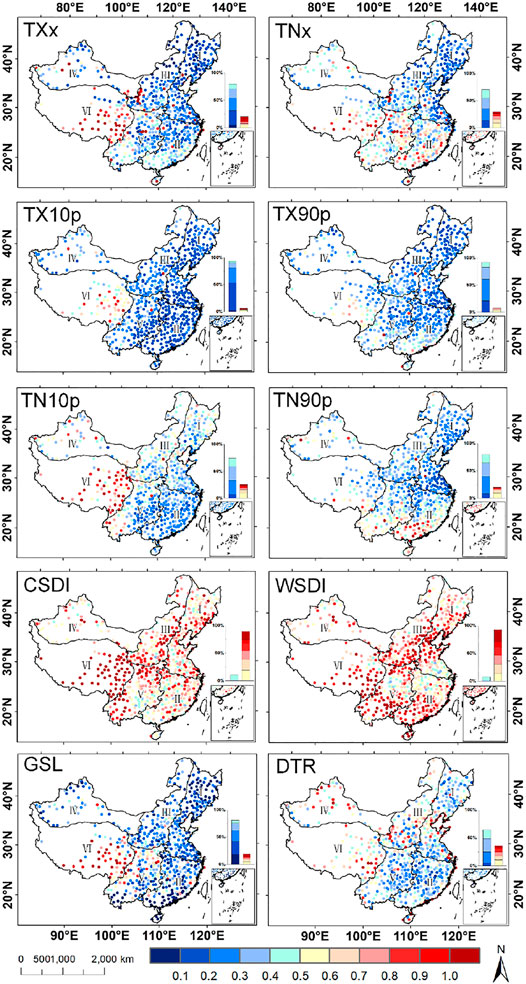
FIGURE 3. Spatial distribution of DISO for extreme temperature indices of ERA5 over China.
The results showed that ERA5 has an ideal simulation for maximum and minimum temperatures within a year. The average values of DISO in the whole of China for TXx and TNx are 0.44 and 0.45, respectively. The cumulative percentage of stations with the lower DISO value (less than 0.5) is above 70.00%. According to specific spatial distribution, ERA5 shows the best performance in Regions I and III, with a correlation of 0.77 and 0.68, respectively. The higher DISO stations are concentrated in Regions II, V, and VI, especially for TNx. There are approximately half of the stations that had the DISO greater than 0.5 for TNx index in Regions II, V, and VI. It indicates that the ability of ERA5 in northern China is better than that in southern China for reproducing the intensity of extreme temperature events.
Another interesting finding is that the mean DISO of TX10p (cool days) and TX90p (warm days) in China is 0.30 and 0.32, respectively. Yet, the average of DISO for TN10p (cool nights) and TN90p (warm nights) is higher than TX10p and TX90p, which are 0.53 and 0.40, respectively. It is distinct that ERA5 simulates diurnal temperature better than nocturnal temperature. Spatially, TX10p and TN10p demonstrate analogous spatial distribution characteristics. DISO gradually increases from the southeast coast to the northwest inland regions. However, the spatial distribution of TX90p and TN90p shows a different north-south distribution; higher DISO stations are concentrated in the southern part of Regions II, V, and VI. This difference illustrates that the credibility of the southeast coast is higher than in other regions in China when ERA5 simulates cool nights (TN10p) and cool days (TX10p), whereas ERA5 is more precise in the north than in the south when retrieving warm nights (TN90p) and warm days (TX90p).
ERA5 shows a good performance in capturing the GSL index. Stations with a DISO of less than 0.5 account for more than 80.00% of the total stations in China, of which more than 40.00% of stations have a correlation coefficient (CC) that exceeds 0.9. However, the performances of CSDI and WSDI are both disappointed. The average values of DISO for CSDI and WSDI are 0.83 and 0.82, respectively. There are approximately 90.00% of stations that have a DISO greater than 0.5. Among them, 102 and 144 stations show a higher DISO (above 1.0) in CSDI and WSDI, respectively. The conclusion showed that ERA5-simulating CSDI and WSDI indices are worse than other indices. Concerning to diurnal temperature range (DTR), the DISO value is mainly concentrated in the range of 0.3–0.6. Stations with a DISO of less than 0.5 account for 64.11% of total stations. Regarding spatial distribution, ERA5 performs better in Regions II and V than in other regions for DTR. The cumulative percentages of stations with the DISO less than 0.5 in Regions II and V reach 76.10% and 83.90%, respectively. The higher DISO (greater than 0.5) stations are mainly distributed in Regions I, III, IV, and VI, which show a weak performance.
Generally, ERA5 performs well in capturing absolute indices (TXx and TNx) and percentile-based indices (TX10p, TX90p, TN10p, and TN90p) but performs poorly in capturing duration indices (CSDI and WSDI) except for GSL. In other words, the reliability of ERA5 to reproduce extreme temperature intensity and frequency is higher than that for extreme temperature duration. For the subregions, Region I performs best and Region VI performs worst.
To further confirm the specific deviations between ERA5 and the observational data concerning extreme temperature indices, Figure 4 shows the spatial distribution of RB for extreme temperature indices over China. For the absolute indices, ERA5 underestimates the warmest day (TXx) and warmest night (TNx) in the southern part of Region VI. In addition, RB values are mostly concentrated near 0, and only five stations are remarkably overvalued. It also demonstrates that ERA5 can capture the intensity of extreme temperature events well, coinciding with the conclusions obtained in the DISO indicator.
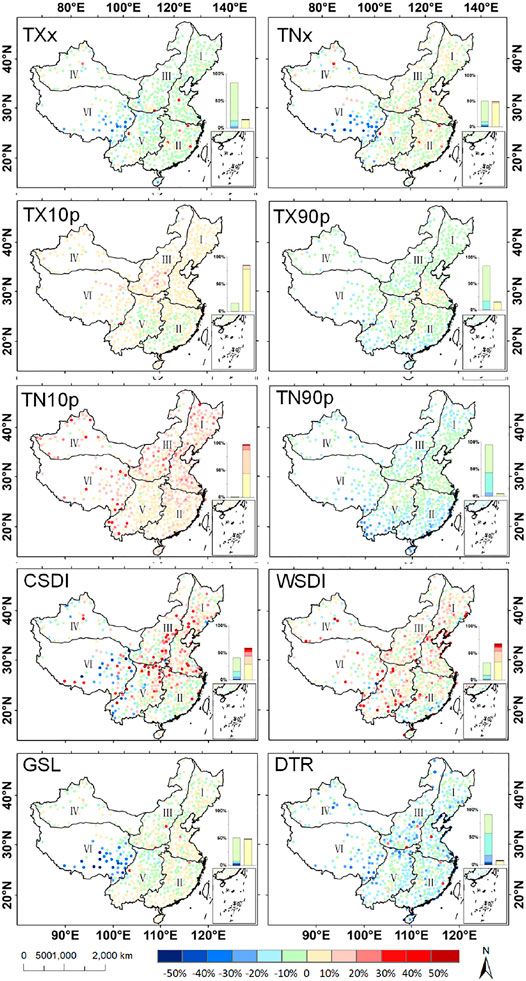
FIGURE 4. Spatial distribution of RB for extreme temperature indices of ERA5 over China.
It also should be noted that TN10p and TX10p have 97.60% and 84.68% of the stations with RB above 0, respectively. The results indicated that ERA5 overestimated the 10th percentile indices (TN10p and TX10p). However, the performance of ERA5 in capturing TN90p and TX90p is the opposite. There are 95.20 and 84.23% of the total stations with RB smaller than 0 for TN90p and TX90p, respectively. It illustrates that ERA5 has misdetected more cool nights (TN10p) and cool days (TX10p) but fewer warm days (TX90p) and warm nights (TN90p) in comparison to the observations.
About the duration indices, stations with RB greater than 0 account for approximately 60.00% of CSDI and WSDI, which are mainly located in Regions I, II, III, and V. It is distinct that ERA5 tends to overestimate extreme high-temperature and low-temperature consecutive days over China. Moreover, ERA5 underestimates the observational data in the southern part of Region VI for the GSL. There are 91.22% of stations that have an RB less than 0 in Region VI. The RB of other regions is mainly concentrated in the range of -10–10%. It is considered to be a slight overestimation or underestimation within a reasonable range.
The RB value is mainly distributed between -20% and 0 for DTR. The cumulative percentage of stations with RB less than 0 reaches 91.59%. This finding shows that ERA5 slightly underestimates the DTR compared with the observational data over China. In summary, ERA5 tends to underestimate the frequency of extreme high-temperature events and overestimate the frequency of extreme low-temperature events. Also, the duration of warm and cold days has been overestimated by ERA5 over China.
3.2.2 Subregion Validation
Furthermore, there are substantial differences in terrain and climate characteristics of the six subregions in China. Some indices were not applicable in each region. For example, the Tibetan Plateau has a unique plateau climate, which rarely has a daily minimum temperature >20°C. The evaluation of the TR20 index (tropical nights) is not applicable in Region VI. Hence, it is necessary to exclude unsuitable indices in specific regions before evaluation to ensure the accuracy of the evaluation of ERA5. Figure 5 demonstrates the DISO of selected extreme temperature indices in six subregions.
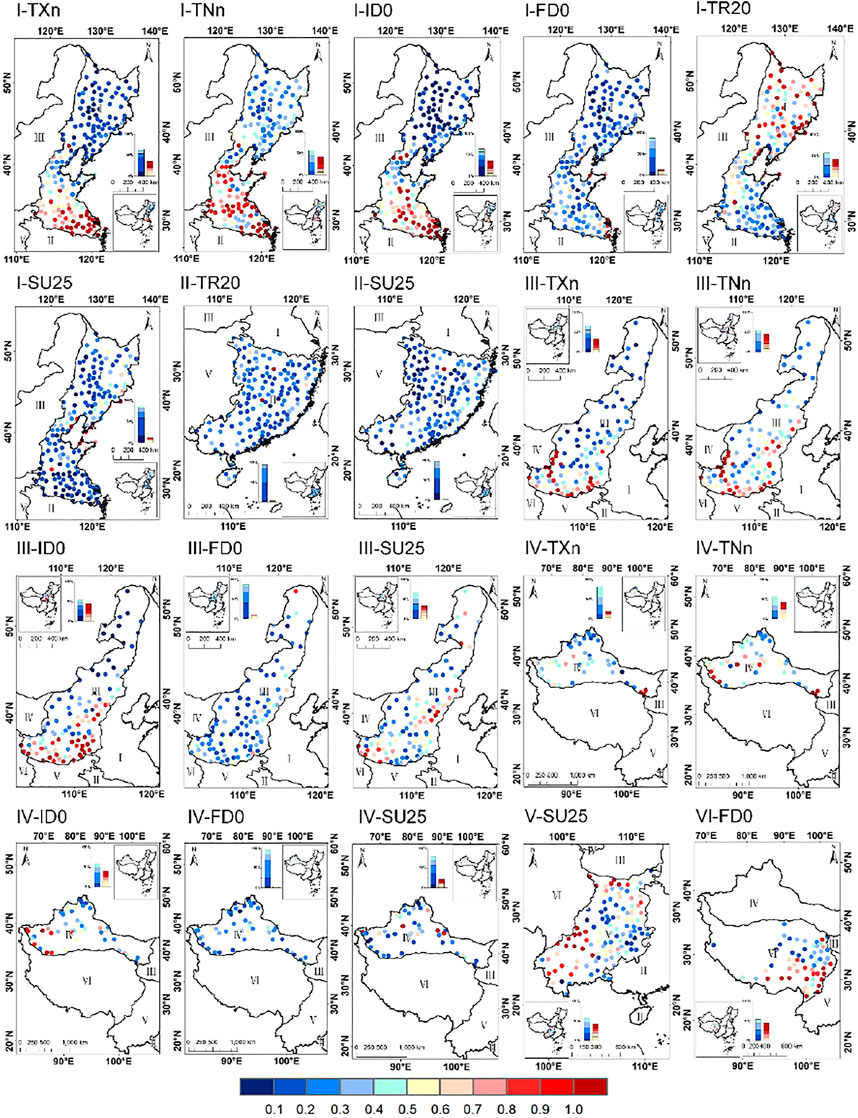
FIGURE 5. Spatial distribution of DISO for selected extreme temperature indices of ERA5 in six regions.
TXn, TNn, and ID0 display similar spatial distribution characteristics of DISO in Region I. Three indices all present a north-south differentiation. The higher DISO stations are located in the northern part of Region I, and stations with a lower DISO are concentrated in the south. It indicates that the reliability of ERA5 in the north is greater than that in the southern part Region I for TXn, TNn, and ID0. It is noteworthy that TR20 displays an opposite spatial distribution characteristic with ID0. The accuracy of ERA5 in the southern part of Region I is greater than that in the northern part for TR20. This difference may be due to the relatively high latitude of the northern part in Region I, where a minimum temperature warmer than 20.0°C is rare. It is also rare that the annual maximum temperature is colder than 0.0°C in the southern part of Region I. Hence, there is a large discrepancy in the spatial distribution of DISO for the two indices, which is due to the local climate condition. Furthermore, the FD0 and SU25 of ERA5 show the best performance in Region I, and the average of DISO is 0.30 and 0.26, respectively. Stations with a DISO of less than 0.5 account for more than 80.00% of all stations. For Region II, the cumulative percentages of stations with the DISO less than 0.5 for SU25 and TR20 are 95.60 and 96.85%, respectively. It implied that ERA5 can identify the number of summer days (SU25) and tropical nights (TR20) well in Region II.
ERA5 also performs well for capturing the FD0 index in Region III, which shows a similar performance with Region I. The percentage of stations with the DISO less than 0.5 reaches 88.46% for all stations. Additionally, the spatial distribution characteristics of DISO for TXn, TNn, and ID0 in Region III are also similar to those in Region I. The simulation effect of ERA5 in the northern part of the region was better than that in the southern part. There is no denying that the range of latitude is similar in Region I and Region III. Therefore, the results demonstrate that the reliability of ERA5 for TXn, TNn, and ID0 is related to latitude location. There is a higher accuracy in the north of 40°N but a lower accuracy in 30–40°N for TXn, TNn, and ID0. Also, in Region IV, the same condition occurs for TXn, TNn, and ID0, which is in accordance with the conclusion obtained. The most reliable index for Region IV is FD0 too. There are 95.74% of stations with a DISO value less than 0.5, followed by SU25 with approximately 80.00% of stations showing a DISO smaller than 0.5.
For Region V, stations with the lower DISO are mainly located in the middle and southeast of the region where the Sichuan Basin is. Stations with higher DISO are mainly in the southwestern region, where the Hengduan Mountains are located. This phenomenon also demonstrated that the accuracy of reanalysis data in basins is better than that in mountainous areas. This is consistent with the findings from Region VI. FD0 performed poorer in Region VI than in other regions, and the average of the DISO was 0.68. This larger deviation is due to the high altitude of the Tibetan Plateau, the complex terrain, and the lack of observations leads to more difficulty in simulation (Kistler et al., 2001; Minder et al., 2010; Holden et al., 2016; Ma et al., 2018).
Generally, there is a substantial difference in the reliability of ERA5 to capture the extreme temperature events in various subregions of China. ERA5 performs worse in mountainous areas, especially in the Tibetan Plateau. In addition, the accuracy of ERA5 to simulate some indices (TXn, TNn, TR20, and ID0) demonstrates a north-south distribution, which is due to the local climate condition.
3.3 Validation of ERA5 Monthly and Seasonal Extreme Temperatures
To further evaluate the applicability of ERA5 to capture the extreme temperature indices at a seasonal scale, Figure 6 and Figure 7 present the spatial distribution of DISO for TXx and TNx from spring to winter over China. The four seasons include spring (March, April, and May), summer (June, July, and August), autumn (September, October, and November), and winter (December, January, and February). Table 6 summarized the DISO for TXx and TNx for each month and season.
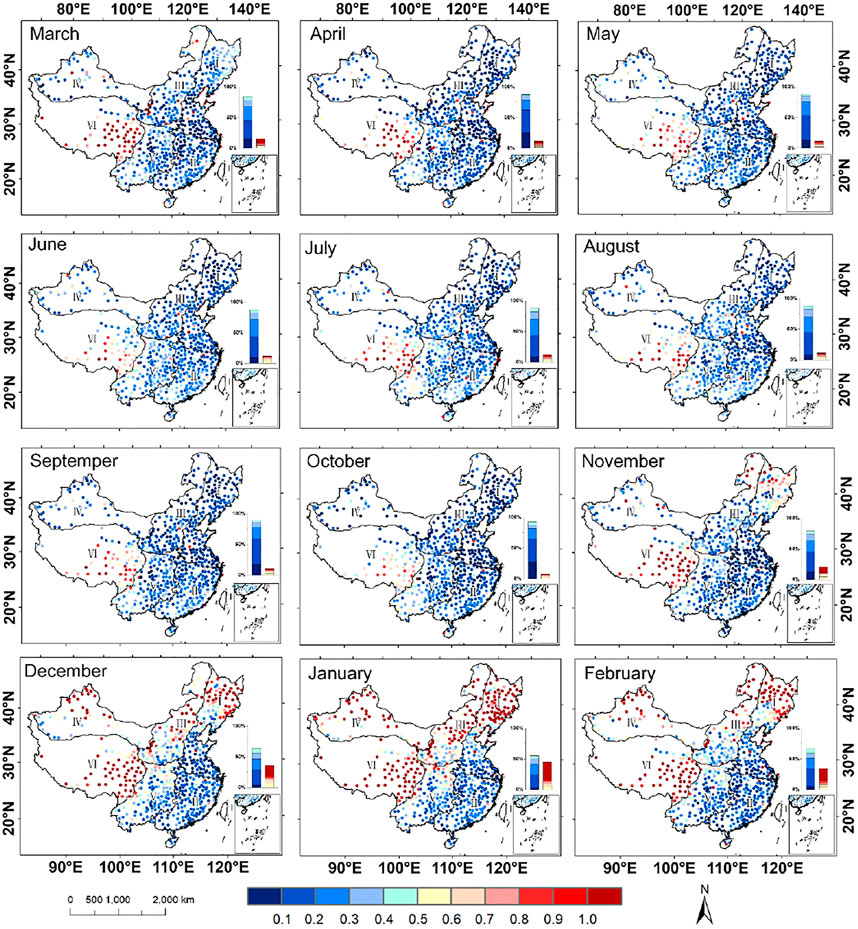
FIGURE 6. Spatial distribution of DISO for TXx of the ERA5 over China from spring to winter. Spring (March, April, and May), summer (June, July, and August), autumn (September, October, and November), and winter (December, January, and February).
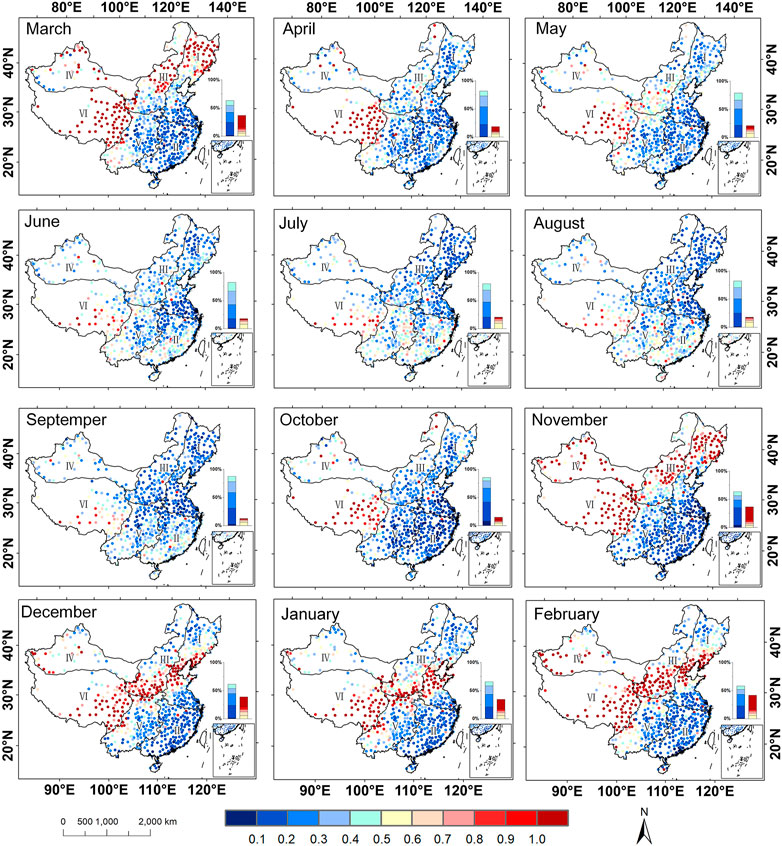
FIGURE 7. Spatial distribution of DISO for the TNx of ERA5 over China from spring to winter. Spring (March, April, and May), summer (June, July, and August), autumn (September, October, and November), and winter (December, January, and February).

TABLE 6. Monthly and seasonal DISO for TXx and TNx over China.
The average values of DISO for warmest days (TXx) in spring, summer, autumn, and winter are 0.28, 0.28, 0.27, and 1.20, respectively. Notably, DISO in winter is higher than that in the other seasons. The stations with DISO greater than 0.5 in winter account for approximately 40.00% of all stations. In addition, the spatial pattern of distribution in spring, summer, and autumn are similar. Stations with higher DISO are mainly distributed in Region VI. However, the spatial distribution of DISO shows a “southeast-northwest” distribution in winter. More than 100 stations with a DISO higher than 1.0 are concentrated in the northern part of Regions I and III and Regions IV and VI.
ERA5 also works better in spring, summer, and autumn than in winter for TNx (Figure 7). However, TNx is slightly distinct in November and March. The performance of TNx in the late fall (November) and early spring (March) during the transition of winter is worse. The cumulative percentage of stations with the DISO greater than 0.5 exceeded 35.00%. In terms of spatial distribution, the ability of ERA5 to simulate the TNx in summer displays a different north-south characteristic, with DISO gradually increasing from north to south. The DISO greater than 0.5 stations are located in Regions II, V, and VI, which demonstrates that the ERA5 reanalysis has better simulation ability for the north than the south of China in summer. This finding may be due to the southeastern part of China being affected by the East Asian monsoon and accompanying precipitation in summer (Ding, 2007), resulting in unstable accuracy in Regions II and V. Furthermore, there is a spatial discrepancy of DISO for TXx and TNx in December and January. Stations with higher DISO (above 1.0) are located in the central part of Region I and the southern part of Regions III and VI.
In summary, the results demonstrated that ERA5 captured the intensity of extreme temperature events in spring, summer, and autumn with higher reliability than in winter. The possible reason may be due to the air temperature being more changeable and complex in winter (Zhao et al., 2020). Additionally, the low simulation accuracy of snow cover and snow depth resulted in large uncertainty of temperature modeling in winter (Kanamitsu et al., 2002; Ma et al., 2008). Previous studies have also found that the accuracy of reanalysis to capture air temperature is better in summer, whereas worse in winter (Zhao et al., 2008; Zhao et al., 2020; Yu et al., 2021). Furthermore, there is a large discrepancy of the climate and topography characteristics in various subregions of China. Therefore, a certain model always failed to capture all climate features across seasons over such a large area (Gao et al., 2016a).
3.4 Climatology and Trends of ERA5 Extreme Temperatures
The PWMK trends of ERA5 and observations for extreme temperature indices in 1979–2020 are shown in Figure.8. TXx (warmest day), TNx (warmest night), TX90p (warm days), TN90p (warm nights), and GSL (growing season length) show a significant positive trend. This result shows that the frequency and intensity of extreme high-temperature events are gradually increasing as global warming in China. Also, ERA5 can capture the trend of extreme high-temperature indices well. WSDI and CSDI do not demonstrate an overall increase or decrease trend. Additionally, TX10p (cool days) and TN10p (cool nights) calculated from ERA5 and observations both have a negative trend. In other words, the frequency of extreme low-temperature events tends to decrease in China. Nevertheless, there is a discrepancy in the trend of the diurnal temperature range (DTR) by ERA5 and observations. The average of the trend of observations DTR is decreasing, whereas the DTR of ERA5 has a slightly increased tendency. It is indicated that ERA5 fails to capture the trend of DTR. Overall, there is agreement among the trend of extreme indices of ERA5 data with observations, except for DTR. ERA5 data can be used for predicting the tendency of extreme temperature events over China, except for DTR.
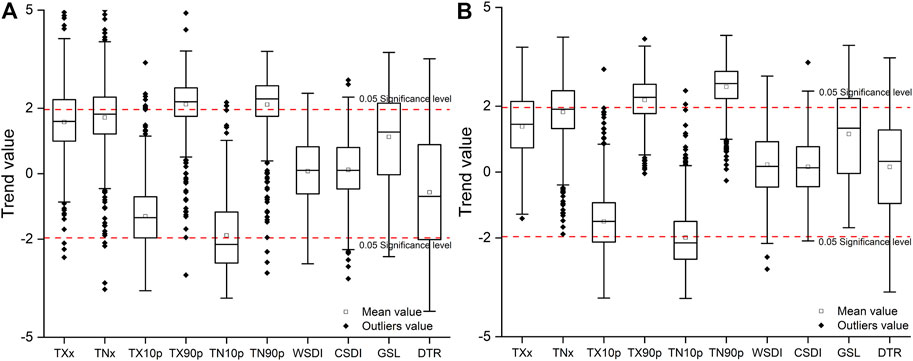
FIGURE 8. Box plots of the PWMK test value of DISO for Obs (A) and ERA5 (B) for extreme temperature indices over China from 1979 to 2020.
3.5 Possible Bias Analysis of ERA5 Temperature
Many studies have reported that the elevation difference is the principal reason leading to the error of the reanalysis data (Gao L. et al., 2012, 2014; Zhou et al., 2018; Tarek et al., 2020b). Gao et al. (2016b) concluded that the altitude difference between meteorological stations and ERA-20CM led to the temperature bias. Zhao et al. (2020) found the bias increases with the elevation difference between ERA5-Interim and observation temperature data. Figure 9 demonstrates the distribution of elevation gaps between stations and ERA5 data (ERA5 original grid point height minus Obs elevation) to further explore the reasons for the deviation of ERA5 temperature data. There are 67 stations with an elevation gap above 500 m, which are mainly located in the southeast part of Region III, the northeast and western part of Region V, and the southeast part of Region VI. Among these stations, 10 stations have elevation gaps above 1000 m in Region VI. The Emei mountain station shows the maximum elevation gap of 1765.40 m in Sichuan Province.
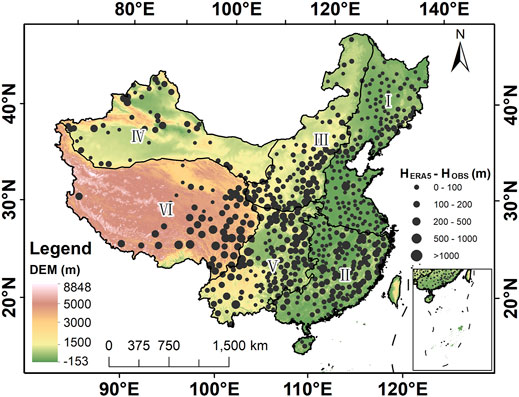
FIGURE 9. Distribution of elevation gaps between stations and ERA5 data.
Figure 10 shows the relationship of the elevation gap and the RMSE between ERA5 and the stations. The RMSE ranges from 0 to 13.50°C. The R2 of mean temperature, max temperature, and min temperature is 0.70, 0.73, and 0.52, respectively. The correlation coefficient (CC) is 0.84, 0.85, and 0.72, respectively. It is implied that the performance of ERA5 is related to the elevation gap between ERA5 and observations. The simulation accuracy of ERA5 decreases with the increase in the elevation gap. Therefore, this is also responsible for the weak simulation effect in the Tibetan Plateau with the higher elevation difference. It must be pointed out that the number of stations used in this study is limited, especially in the Tibetan Plateau. However, previous studies have concluded that limited stations can also accurately evaluate the bias of reanalysis data. It is generally believed that the elevation difference between the reanalysis grid point and the ground station is the main error source (Gao et al., 2014, 2018, 2021; Zhou et al., 2018; Zhao et al., 2020).
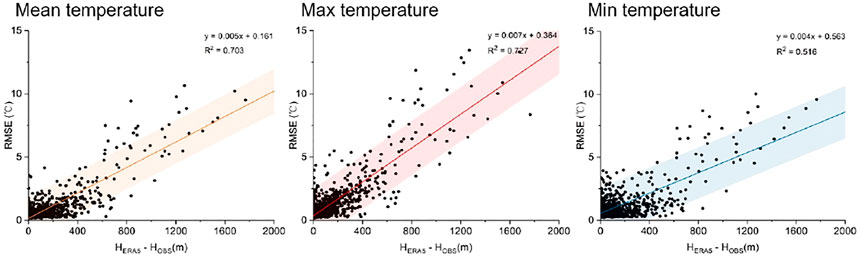
FIGURE 10. Linear regression of the RMSE and elevation gaps between stations and ERA5 reanalysis. Shading shows the prediction bands at the 95% confidence level.
4 Conclusion
This study is based on the comparison of ERA5 reanalysis data and observational data during 1979–2020. The applicability of ERA5 to identify temperatures and reproduce extreme temperature events in six subregions of China at different timescales has been evaluated. Conclusions are summarized as follows:
ERA5 performs well for capturing the original temperature field over China. The maximum temperature and mean temperature reproduced by ERA5 are more ideal than the minimum temperature. However, the performance of ERA5 in the Tibetan Plateau is worse. Additionally, ERA5 has a good agreement in simulating extreme temperature absolute indices and percentile-based indices. In other words, ERA5 performs well in identifying the intensity and frequency of extreme temperature events. Nevertheless, ERA5 tends to underestimate the frequency of extreme high-temperature events and overestimate the frequency of extreme low-temperature events. Moreover, the reliability of ERA5 reanalysis to reproduce extreme temperature duration is disappointed. The duration of warm days and cold days has been overestimated by ERA5.
Spatially, the reproducibility of ERA5 to capture extreme temperature events in different geomorphological regions has a spatial discrepancy, which is manifested in that the performance of ERA5 in plains and basins is superior to that in mountainous areas. The southeastern part of China performs best, and the Tibetan Plateau performs worst. This result may be due to the substantial differences resulting from the uneven distribution of stations, the absence of long-term, high-quality climate station data, and the elevation gaps between the ERA5 grid and the observed station in the Tibetan Plateau.
Based on the simulation of extreme indices at a seasonal scale, the accuracy of ERA5 in reproducing the intensity of extreme temperature indices in spring, summer, and autumn is significantly better than that in winter, especially in Regions I, III, IV, and VI. Furthermore, the results confirmed that ERA5 is reliable for capturing the trend of absolute indices, percentile-based indices, and duration indices, except for DTR. In summary, ERA5 data are ideal for temperature data simulation and identification of extreme temperature events, which can be used as important reference data for temperature changes and extreme climate research.
Data Availability Statement
The original contributions presented in the study are included in the article/Supplementary Material; further inquiries can be directed to the corresponding authors.
Author Contributions
LG, AF, and WX designed the research and collected the data, WX, XL, SC, and MZ contributed to the data processing and analysis, WX prepared the original draft, LG edited and reviewed the manuscript, LJ, RB, XL, XG, MM, TY, ZH, and JW contributed to the discussion. WX, LG, TY, and ZH revised the final manuscript.
Funding
This work was supported by the National Key Research and Development Program of China (2018YFE0206400), the Natural Science Foundation of China (41775081), the National Youth Talent Program (Grant No. E1190301), and the Scientific Project from the Fujian Key Laboratory of Severe Weather (2020KFKT01).
Conflict of Interest
The authors declare that the research was conducted in the absence of any commercial or financial relationships that could be construed as a potential conflict of interest.
Publisher’s Note
All claims expressed in this article are solely those of the authors and do not necessarily represent those of their affiliated organizations, or those of the publisher, the editors, and the reviewers. Any product that may be evaluated in this article, or claim that may be made by its manufacturer, is not guaranteed or endorsed by the publisher.
References
Albergel, C., Dutra, E., Munier, S., Calvet, J.-C., Munoz-Sabater, J., de Rosnay, P., et al. (2018). ERA-5 and ERA-Interim Driven ISBA Land Surface Model Simulations: Which One Performs Better? Hydrol. Earth Syst. Sci. 22, 3515–3532. doi:10.5194/hess-22-3515-2018
Alexander, L. V., Zhang, X., Peterson, T. C., Caeser, J., Gleason, B., Haylock, M., et al. (2006). Global Observed Changes in Daily Climate Extremes of Temperature and Precipitation. J. Geophys. Res. Atmos. 111, 1–22. doi:10.1029/2005JD006290
Awasthi, A. (2021). Retrospection of Heatwave and Heat Index : A Case Study Using ERA5 Dataset. Theor. Appl. Climatol. doi:10.21203/rs.3.rs-597802/v1
Berrisford, P., Dee, D., Poli, P., Brugge, R., Fielding, K., Fuentes, M., et al. (2011). The ERA-Interim Archive Version 2.0. Available at https://www.ecmwf.int/node/8174.
Best, M. J., Beljaars, A., Polcher, J., and Viterbo, P. (2004). A Proposed Structure for Coupling Tiled Surfaces with the Planetary Boundary Layer. J. Hydrometeorol. 5, 1271–1278. doi:10.1175/jhm-382.1
Boer, G. J. (1986). A Comparison of Mass and Energy Budgets from Two FGGE Datasets and a GCM. Mon. Wea. Rev. 114, 885–902. doi:10.1175/1520-0493(1986)114<0885:acomae>2.0.co;2
Burn, D. H., and Hag Elnur, M. A. (2002). Detection of Hydrologic Trends and Variability. J. Hydrology 255, 107–122. doi:10.1016/s0022-1694(01)00514-5
Cheng, W., Zhou, C., and Li, B. (2019). Geomorphological Regionalization Theory System and Division Methodology of China. Acta Geogr. Sin. 74, 839–856. doi:10.11821/dlxb201905001
Deng, M., Meng, X., Lu, Y., Li, Z., Zhao, L., Hu, Z., et al. (2021). Impact and Sensitivity Analysis of Soil Water and Heat Transfer Parameterizations in Community Land Surface Model on the Tibetan Plateau. J. Adv. Model. Earth Syst. 13, 1–13. doi:10.1029/2021ms002670
Diamond, H. J., Karl, T. R., Palecki, M. A., Baker, C. B., Bell, J. E., Leeper, R. D., et al. (2013). U.S. Climate Reference Network after One Decade of Operations: Status and Assessment. Bull. Am. Meteorol. Soc. 94, 485–498. doi:10.1175/bams-d-12-00170.1
Ding, Y. (2007). The Variability of the Asian Summer Monsoon. J. Meteorological Soc. Jpn. 85B, 21–54. doi:10.2151/jmsj.85b.21
Donat, M. G., Sillmann, J., Wild, S., Alexander, L. V., Lippmann, T., and Zwiers, F. W. (2014). Consistency of Temperature and Precipitation Extremes across Various Global Gridded In Situ and Reanalysis Datasets. J. Clim. 27, 5019–5035. doi:10.1175/jcli-d-13-00405.1
Gao, C., Jiang, X., Wu, H., Tang, B., Li, Z., and Li, Z.-L. (2012). Comparison of Land Surface Temperatures from MSG-2/SEVIRI and Terra/MODIS. J. Appl. Remote Sens. 6, 063606. doi:10.1117/1.jrs.6.063606
Gao, L., Bernhardt, M., Schulz, K., Chen, X., Chen, Y., and Liu, M. (2016a). A First Evaluation of ERA-20CM over China. Mon. Weather Rev. 144, 45–57. doi:10.1175/mwr-d-15-0195.1
Gao, L., Bernhardt, M., Schulz, K., and Chen, X. (2016b). Elevation Correction of ERA-Interim Temperature Data in the Tibetan Plateau. Int. J. Climatol. 37, 3540–3552. doi:10.1002/joc.4935
Gao, L., Bernhardt, M., and Schulz, K. (2012). Elevation Correction of ERA-Interim Temperature Data in Complex Terrain. Hydrol. Earth Syst. Sci. 16, 4661–4673. doi:10.5194/hess-16-4661-2012
Gao, L., Deng, H., Lei, X., Wei, J., Chen, Y., Li, Z., et al. (2021). Evidence of Elevation-dependent Warming from the Chinese Tian Shan. Cryosphere 15, 5765–5783. doi:10.5194/tc-15-5765-2021
Gao, L., Hao, L., and Chen, X.-w. (2014). Evaluation of ERA-Interim Monthly Temperature Data over the Tibetan Plateau. J. Mt. Sci. 11, 1154–1168. doi:10.1007/s11629-014-3013-5
Gao, L., Wei, J., Wang, L., Bernhardt, M., Schulz, K., and Chen, X. (2018). A High-Resolution Air Temperature Data Set for the Chinese Tian Shan in 1979-2016. Earth Syst. Sci. Data 10, 2097–2114. doi:10.5194/essd-10-2097-2018
Gleixner, S., Demissie, T., and Diro, G. T. (2020). Did ERA5 Improve Temperature and Precipitation Reanalysis over East Africa? Atmos. (Basel) 11, 1–19. doi:10.3390/atmos11090996
He, W.-p., and Zhao, S.-s. (2018). Assessment of the Quality of NCEP-2 and CFSR Reanalysis Daily Temperature in China Based on Long-Range Correlation. Clim. Dyn. 50, 493–505. doi:10.1007/s00382-017-3622-0
Hersbach, H., Bell, B., Berrisford, P., Hirahara, S., Horányi, A., Muñoz‐Sabater, J., et al. (2020). The ERA5 Global Reanalysis. Q.J.R. Meteorol. Soc. 146, 1999–2049. doi:10.1002/qj.3803
Holden, Z. A., Swanson, A., Klene, A. E., Abatzoglou, J. T., Dobrowski, S. Z., Cushman, S. A., et al. (2016). Development of High‐resolution (250 M) Historical Daily Gridded Air Temperature Data Using Reanalysis and Distributed Sensor Networks for the US Northern Rocky Mountains. Int. J. Climatol. 36, 3620–3632. doi:10.1002/joc.4580
Hu, Z., Chen, X., Zhou, Q., Chen, D., and Li, J. (2019). DISO: A Rethink of Taylor Diagram. Int. J. Climatol. 39, 2825–2832. doi:10.1002/joc.5972
Huang, X., Han, S., and Shi, C. (2021). Multiscale Assessments of Three Reanalysis Temperature Data Systems over China. Agric 11, 1292. doi:10.3390/agriculture11121292
Jiang, H., Yang, Y., Bai, Y., and Wang, H. (2020). Evaluation of the Total, Direct, and Diffuse Solar Radiations from the ERA5 Reanalysis Data in China. IEEE Geosci. Remote Sens. Lett. 17, 47–51. doi:10.1109/lgrs.2019.2916410
Jiang, Q., Li, W., Fan, Z., He, X., Sun, W., Chen, S., et al. (2021). Evaluation of the ERA5 Reanalysis Precipitation Dataset over Chinese Mainland. J. Hydrology 595, 125660. doi:10.1016/j.jhydrol.2020.125660
Jiang, Q., Yue, Y., and Gao, L. (2019). The Spatial-Temporal Patterns of Heatwave Hazard Impacts on Wheat in Northern China under Extreme Climate Scenarios. Geomatics, Nat. Hazards Risk 10, 2346–2367. doi:10.1080/19475705.2019.1693435
Kalnay, E., Kanamitsu, M., Kistler, R., Collins, W., Deaven, D., Gandin, L., et al. (1995). The NCEP/NCAR 40-Year Reanalysis Project. Bull. Am. Meteorol. Soc. 77, 437–471. doi:10.4324/9781315793245-16
Kanamitsu, M., Ebisuzaki, W., Woollen, J., Yang, S.-K., Hnilo, J. J., Fiorino, M., et al. (2002). NCEP-DOE AMIP-II Reanalysis (R-2). Bull. Am. Meteorol. Soc. 83, 1631–1643. doi:10.1175/bams-83-11-1631(2002)083<1631:nar>2.3.co;2
Kistler, R., Collins, W., Saha, S., White, G., Woollen, J., Kalnay, E., et al. (2001). The NCEP-NCAR 50-year Reanalysis: Monthly Means CD-ROM and Documentation. Bull. Amer. Meteor. Soc. 82, 247–267. doi:10.1175/1520-0477(2001)082<0247:tnnyrm>2.3.co;2
Kozubek, M., Krizan, P., and Lastovicka, J. (2020). Homogeneity of the Temperature Data Series from ERA5 and MERRA2 and Temperature Trends. Atmos. (Basel) 11, 235. doi:10.3390/atmos11030235
Lei, X., Gao, L., Ma, M., Wei, J., Xu, L., Wang, L., et al. (2021a). Does Non-stationarity of Extreme Precipitation Exist in the Poyang Lake Basin of China? J. Hydrology Regional Stud. 37, 100920. doi:10.1016/j.ejrh.2021.100920
Lei, X., Gao, L., Wei, J., Ma, M., Xu, L., Fan, H., et al. (2021b). Contributions of Climate Change and Human Activities to Runoff Variations in the Poyang Lake Basin of China. Phys. Chem. Earth, Parts A/B/C 123, 103019. doi:10.1016/j.pce.2021.103019
Liu, J., Hagan, D. F. T., and Liu, Y. (2021). Global Land Surface Temperature Change (2003–2017) and its Relationship with Climate Drivers: AIRS, MODIES, and ERA5-Land Based Analysis. Remote Sens. 13, 1–20. doi:10.3390/rs13010044
Ma, L., Zhang, T., Li, Q., Frauenfeld, O. W., and Qin, D. (2008). Evaluation of ERA-40, NCEP-1, and NCEP-2 Reanalysis Air Temperatures with Ground-Based Measurements in China. J. Geophys. Res. Atmos. 113, 1–15. doi:10.1029/2007jd009549
Ma, Y., Yang, Y., Han, Z., Tang, G., Maguire, L., Chu, Z., et al. (2018). Comprehensive Evaluation of Ensemble Multi-Satellite Precipitation Dataset Using the Dynamic Bayesian Model Averaging Scheme over the Tibetan Plateau. J. Hydrology 556, 634–644. doi:10.1016/j.jhydrol.2017.11.050
Machiwal, D., Gupta, A., Jha, M. K., and Kamble, T. (2019). Analysis of Trend in Temperature and Rainfall Time Series of an Indian Arid Region: Comparative Evaluation of Salient Techniques. Theor. Appl. Climatol. 136, 301–320. doi:10.1007/s00704-018-2487-4
IPCC (2021). Climate Change 2021: The Physical Science Basis. Contribution of Working Group I to the Sixth Assessment Report of the Intergovernmental Panel on Climate Change. Editor V. Masson-Delmotteet al. (Cambridge, United Kingdom: Cambridge University Press).
Minder, J. R., Mote, P. W., and Lundquist, J. D. (2010). Surface Temperature Lapse Rates over Complex Terrain: Lessons from the Cascade Mountains. J. Geophys. Res. Atmos. 115, 1–13. doi:10.1029/2009jd013493
Mirdashtvan, M., and Mohseni Saravi, M. (2020). Influence of Non-stationarity and Auto-Correlation of Climatic Records on Spatio-Temporal Trend and Seasonality Analysis in a Region with Prevailing Arid and Semi-arid Climate, Iran. J. Arid. Land 12, 964–983. doi:10.1007/s40333-020-0100-z
Olauson, J. (2018). ERA5: The New Champion of Wind Power Modelling? Renew. Energy 126, 322–331. doi:10.1016/j.renene.2018.03.056
Onogi, K., Kobayashi, S., Ota, Y., Harada, Y., Ebita, A., Moriya, M., et al. (2015). The Japanese 55-year Reanalysis : General Specifications and Basic Characteristics. J. Meteorol. Soc. Jpn. 93, 5–48. doi:10.2151/jmsj.2015-001
Onogi, K., Tsutsui, J., Koide, H., Sakamoto, M., Kobayashi, S., Hatsushika, H., et al. (2007). The JRA-25 Reanalysis. J. Meteorological Soc. Jpn. 85, 369–432. doi:10.2151/jmsj.85.369
Pappenberger, F., Ramos, M. H., Cloke, H. L., Wetterhall, F., Alfieri, L., Bogner, K., et al. (2015). How Do I Know if My Forecasts Are Better? Using Benchmarks in Hydrological Ensemble Prediction. J. Hydrology 522, 697–713. doi:10.1016/j.jhydrol.2015.01.024
Poli, P., Hersbach, H., Dee, D. P., Berrisford, P., Simmons, A. J., Vitart, F., et al. (2016). ERA-20C: An Atmospheric Reanalysis of the Twentieth Century. J. Clim. 29, 4083–4097. doi:10.1175/jcli-d-15-0556.1
Saha, S., Moorthi, S., Pan, H. L., Wu, X., Wang, J., Nadiga, S., et al. (2010). The NCEP Climate Forecast System Reanalysis. Bull. Am. Meteorol. Soc. 91, 1015–1057. doi:10.1175/2010BAMS3001.1
Sheridan, S. C., Lee, C. C., and Smith, E. T. (2020). A Comparison between Station Observations and Reanalysis Data in the Identification of Extreme Temperature Events. Geophys. Res. Lett. 47, 0–2. doi:10.1029/2020gl088120
Shin, J. Y., Kim, K. R., Kim, J., and Kim, S. (2021). Long‐term Trend and Variability of Surface Humidity from 1973 to 2018 in South Korea. Int. J. Climatol. 41, 4215–4235. doi:10.1002/joc.7068
Sprenger, M., and Wernli, H. (2003). A Northern Hemispheric Climatology of Cross-Tropopause Exchange for the ERA15 Time Period (1979-1993). J. Geophys. Res. Atmos. 108, 1–14. doi:10.1029/2002jd002636
Tarek, M., Brissette, F. P., and Arsenault, R. (2020a). Evaluation of the ERA5 Reanalysis as a Potential Reference Dataset for Hydrological Modelling over North America. Hydrol. Earth Syst. Sci. 24, 2527–2544. doi:10.5194/hess-24-2527-2020
Tarek, M., Brissette, F. P., and Arsenault, R. (2020b). Large-scale Analysis of Global Gridded Precipitation and Temperature Datasets for Climate Change Impact Studies. J. Hydrometeorol. 21, 2623–2640.
Turner, J., Lu, H., King, J., Marshall, G. J., Phillips, T., Bannister, D., et al. (2021). Extreme Temperatures in the Antarctic. J. Clim. 34, 2653–2668. doi:10.1175/jcli-d-20-0538.1
Uppala, S. M., KÅllberg, P. W., Simmons, A. J., Andrae, U., Bechtold, V. D. C., Fiorino, M., et al. (2005). The ERA-40 Re-analysis. Q.J.R. Meteorol. Soc. 131, 2961–3012. doi:10.1256/qj.04.176
Urraca, R., Huld, T., Gracia-Amillo, A., Martinez-de-Pison, F. J., Kaspar, F., and Sanz-Garcia, A. (2018). Evaluation of Global Horizontal Irradiance Estimates from ERA5 and COSMO-REA6 Reanalyses Using Ground and Satellite-Based Data. Sol. Energy 164, 339–354. doi:10.1016/j.solener.2018.02.059
Watts, N., Amann, M., Arnell, N., Ayeb-Karlsson, S., Beagley, J., Belesova, K., et al. (2021). The 2020 Report of the Lancet Countdown on Health and Climate Change: Responding to Converging Crises. Lancet 397, 129–170. doi:10.1016/S0140-6736(20)32290-X
World Meteorological Organization (2021). The Atlas of Mortality and Economic Losses from Weather, Climate and Water Extremes (1979-2019). Report No.1267.
Xu, Z., and Han, Y. (2020). Short Communication Comments on 'DISO: A Rethink of Taylor Diagram'. Int. J. Climatol. 40, 2506–2510. doi:10.1002/joc.6359
You, Q., Fraedrich, K., Min, J., Kang, S., Zhu, X., Ren, G., et al. (2013). Can Temperature Extremes in China Be Calculated from Reanalysis? Glob. Planet. Change 111, 268–279. doi:10.1016/j.gloplacha.2013.10.003
Yu, Y., Xiao, W., Zhang, Z., Cheng, X., Hui, F., and Zhao, J. (2021). Evaluation of 2-m Air Temperature and Surface Temperature from ERA5 and ERA-I Using Buoy Observations in the Arctic during 2010-2020. Remote Sens. 13, 2813. doi:10.3390/rs13142813
Yue, S., and Wang, C. Y. (2002). Applicability of Prewhitening to Eliminate the Influence of Serial Correlation on the Mann-Kendall Test. Water Resour. Res. 38, 1–4. doi:10.1029/2001wr000861
Zhan, W., He, X., Sheffield, J., and Wood, E. F. (2020). Projected Seasonal Changes in Large-Scale Global Precipitation and Temperature Extremes Based on the CMIP5 Ensemble. J. Clim. 33, 5651–5671. doi:10.1175/jcli-d-19-0311.1
Zhang, P., Ren, G., Xu, Y., Wang, X. L., Qin, Y., Sun, X., et al. (2019). Observed Changes in Extreme Temperature over the Global Land Based on a Newly Developed Station Daily Dataset. J. Clim. 32, 8489–8509. doi:10.1175/jcli-d-18-0733.1
Zhao, P., Gao, L., Wei, J., Ma, M., Deng, H., Gao, J., et al. (2020). Evaluation of ERA-Interim Air Temperature Data over the Qilian Mountains of China. Adv. Meteorology 2020, 1–11. doi:10.1155/2020/7353482
Zhao, T., Guo, W., and Fu, C. (2008). Calibrating and Evaluating Reanalysis Surface Temperature Error by Topographic Correction. J. Clim. 21, 1440–1446. doi:10.1175/2007jcli1463.1
Zheng, Y. (2020). A Preliminary Analysis on the Applicability of ERA5 Reanalysis Data in Guangdong Province. Meteorol. Environ. Res. 11, 3–9. doi:10.19547/j.issn2152-3940.2020.02.007
Zhou, C., He, Y., and Wang, K. (2018). On the Suitability of Current Atmospheric Reanalyses for Regional Warming Studies over China. Atmos. Chem. Phys. 18, 8113–8136. doi:10.5194/acp-18-8113-2018
Zhou, Q., Chen, D., Hu, Z., and Chen, X. (2021). Decompositions of Taylor Diagram and DISO Performance Criteria. Int. J. Climatol. 41, 5726–5732. doi:10.1002/joc.7149
Keywords: ERA5, reanalysis, extreme temperature, DISO, China
Citation: Xu W, Lei X, Chen S, Yu T, Hu Z, Zhang M, Jiang L, Bao R, Guan X, Ma M, Wei J, Gao L and Feng A (2022) How Well Does the ERA5 Reanalysis Capture the Extreme Climate Events Over China? Part II: Extreme Temperature. Front. Environ. Sci. 10:921659. doi: 10.3389/fenvs.2022.921659
Received: 16 April 2022; Accepted: 13 May 2022;
Published: 27 June 2022.
Edited by:
Zengyun Hu, CAS, ChinaReviewed by:
Junqiang Yao, China Meteorological Administration, ChinaTP Sabin, Indian Institute of Tropical Meteorology (IITM), India
Yuzhuo Peng, (CAS), China
Copyright © 2022 Xu, Lei, Chen, Yu, Hu, Zhang, Jiang, Bao, Guan, Ma, Wei, Gao and Feng. This is an open-access article distributed under the terms of the Creative Commons Attribution License (CC BY). The use, distribution or reproduction in other forums is permitted, provided the original author(s) and the copyright owner(s) are credited and that the original publication in this journal is cited, in accordance with accepted academic practice. No use, distribution or reproduction is permitted which does not comply with these terms.
*Correspondence: Lu Gao, l.gao@foxmail.com; Aixia Feng, fax20032008@163.com