
94% of researchers rate our articles as excellent or good
Learn more about the work of our research integrity team to safeguard the quality of each article we publish.
Find out more
ORIGINAL RESEARCH article
Front. Environ. Sci., 15 June 2022
Sec. Atmosphere and Climate
Volume 10 - 2022 | https://doi.org/10.3389/fenvs.2022.921658
This article is part of the Research TopicImpact of Climate Change on the Human Living EnvironmentView all 24 articles
 Xiangyong Lei1,2
 Wanling Xu1,2
 Shiting Chen1,2Tingting Yu2Zengyun Hu3Meng Zhang1,2
 Lizhi Jiang4Ruijuan Bao4
 Xiaojun Guan4Miaomiao Ma5
 Jianhui Wei6Aixia Feng7*
 Lu Gao1,2,8,9*
ERA5 is the fifth-generation atmospheric reanalysis of the European Center for Medium-Range Weather Forecasts, with high spatiotemporal resolution and global coverage. However, the reliability of ERA5 for simulating extreme precipitation events is still unclear over China. In this study, 12 extreme precipitation indices and a comprehensive quantitative distance between indices of simulation and observation were used to evaluate ERA5 precipitation from three fundamental aspects: intensity, frequency, and duration. The geomorphological regionalization method was used to divide the subregions of China. The results showed that the ability of ERA5 to simulate annual total precipitation was better than that of daily precipitation. For the intensity indices, ERA5 performs well for simulating the PRCPTOT (annual total wet days precipitation) over China. ERA5 performs better on RX5day (max 5-days precipitation amount) and R95p (very wet days), especially in eastern China, than on RX1day (max 1-day precipitation amount) and R99p (extremely wet days). For the frequency indices, the ability of the ERA5 simulation increased as the amount of precipitation increased, except for northwestern China. However, the ability of ERA5 to simulate R50 mm (number of extreme heavy precipitation days) decreased. For the duration indices, ERA5 was better at simulating drought events than wet events in eastern China. Our results highlight the need for ERA5 to enhance the simulation of trend changes in extreme precipitation events.
Precipitation is a key factor in the development of the Earth’s system (Zhang et al., 2013). Accuracy assessment of precipitation plays an essential role in helping to understand extreme weather and climate events and in disaster risk reduction, especially in regions with complex topography (Amjad et al., 2020). In a changing environment, the intensity, and frequency of extreme precipitation events have increased since the 1950s (Alexander 2016; Kim et al., 2020; IPCC 2021). As a direct source of precipitation observations, the uneven spatial distribution and the insufficient number of stations, as well as the discontinuity in recording sequences, usually lead to poor performance of the spatiotemporal features of precipitation (Rana et al., 2015; Duan et al., 2016; Yu et al., 2020). The increasing demands of the scientific community contradict the absence of observation stations (You et al., 2013), especially with regard to assessing extreme precipitation events (Donat et al., 2014; IPCC 2021). Therefore, precipitation data with long time series and high spatial resolution are necessary for climate change analysis.
In addition to the observation station data, the current precipitation datasets can be roughly divided into three types based on differences in the models and data sources: interpolated surface observation precipitation datasets, satellite-based datasets, and reanalysis datasets (Jiang et al., 2021). Interpolated datasets have depended on the density of the stations and the interpolation method, for example, HadEX3 and APHRODITE (Yatagai et al., 2012; Dunn et al., 2020). Satellite-based datasets have been obtained by the inversion of precipitation radar and microwave images (Amjad et al., 2020; Yu et al., 2020), such as the Tropical Rainfall Measuring Mission, Global Precipitation Measurement Integrated Multi-Satellite Retrievals. Reanalysis datasets such as the fifth-generation atmospheric reanalysis of the European Center for Medium-Range Weather Forecasts (ERA5) (Hersbach et al., 2020) were constructed using a large amount of measurement and remote sensing information, and the information was gathered via a retrospective analysis of past historical data (Tarek et al., 2020). Compared with the other two data categories, reanalysis datasets have been more widely used in various climatological applications because of their high spatiotemporal resolution, various data types, and global coverage (Gao et al., 2014; Gao et al., 2016; Zhu et al., 2017; Kim et al., 2020). However, the accuracy of the reanalysis data requires further evaluation because of systematic errors in the model and the complex topography of the regional scale (You et al., 2013; Yu et al., 2020). What also needs to be verified is whether the reanalysis data can capture the increased extreme precipitation events in a changing environment.
The applicability of ERA5 precipitation data has been evaluated (Xu et al., 2019; Dullaart et al., 2021). Jiang et al. (2021) found that ERA5 reanalysis data tended to underestimate moderate and higher daily precipitation events (above 10 mm/day) over mainland China. Amjad et al. (2020) found that ERA5 overestimates the observed precipitation for all wetness and performs better in lighter precipitation events than satellite-based products over Turkey. Hu and Yuan (2021) found that ERA5 overestimates the rainfall frequency and underestimates the intensity of precipitation from the Tibetan Plateau to the Sichuan Basin. Therefore, although bias in ERA5 precipitation data was less than that of the prior dataset ERA-Interim (Tarek et al., 2020), the applicability of ERA5 in China needs to be evaluated (Dong et al., 2020). Previous studies tried to investigate the performance of ERA5 precipitation data over China at daily scale and hourly scale precipitation events (Gao et al., 2018), monthly scale precipitation events (Jiang et al., 2021), and seasonal scale precipitation events (Tang et al., 2020). Moreover, most of these studies selected evaluation elements that did not include intensity, frequency, duration of extreme precipitation events [e.g., Extremely wet days (R99p), Number of extreme heavy precipitation days (R50 mm), Consecutive wet days (CWD)]. Additionally, studies have mostly used multiple evaluation indicators and have not proposed comprehensive quantitative indicators (Hu et al., 2019). Therefore, because of the increased extreme precipitation events in the context of global warming (Chen and Sun 2017; IPCC 2021), complex topography, and diverse climatic types, further research is necessary on the reliability of ERA5 precipitation data for assessing extreme precipitation events.
China has experienced a high incidence of extreme precipitation events since 1960s (Gao et al., 2017). Studies have shown that climate change and human activities have caused an increase in extreme precipitation events in China (Lu and Yong 2020; Zhou et al., 2021b ; Li and Chen 2021). In this study, we used a newly updated reanalysis precipitation dataset called ERA5 and observation station datasets (Obs) to assess the applicability of ERA5 for analyzing extreme precipitation events in different geomorphic subdivisions, based on extreme precipitation indices provided by the Expert Team on Climate Change Detection Monitoring and Indices (ETCCDMI). A comprehensive indicator named distance between indices of simulation and observation (DISO) was selected to evaluate ERA5 precipitation data. We attempted to the following three questions: 1) How do ERA5 precipitation data work in complex environments (Section 3.1)? 2) Can ERA5 capture extreme precipitation events (Sections 3.2, 3.3)? 3) Can ERA5 capture the trend of extreme precipitation events (Section 3.4)? Section 2 describes the data and methods used in this study. The conclusions are presented in Section 4.
The geography of China includes mountains, hills, and alluvial plains, with high elevations in the western region and low elevations in the eastern region (Figure 1). The spatial distribution of mean annual precipitation in China decreases from the southeast coast to the northwest inland, which is due to the uneven distribution of monsoons in the country. Studying the applicability of ERA5 in China is necessary because the wide expanse of land with a complex topography and diverse climate.
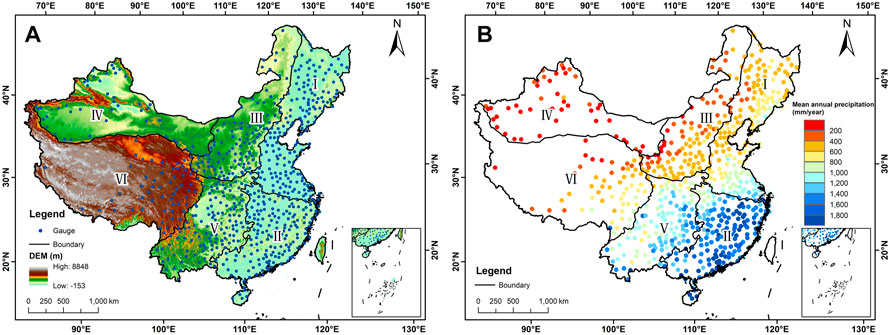
FIGURE 1. Study area information. (A) Meteorological stations and topography. (B) Mean annual precipitation.
China can be divided into six regions based on geomorphological features (Cheng et al., 2019). The information for the six regions is listed in Table 1. The differences in elevation, area, and station number among the six regions are remarkable. The complex topography and extreme climate limit the number of stations in the region (Gao et al., 2018). Therefore, Regions-Ⅳ and Ⅵ have a large area but a low number of stations.
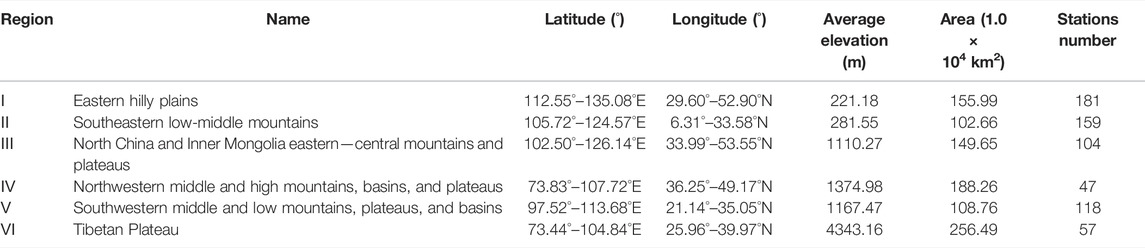
TABLE 1. Geomorphological regionalization information.
The data from a total of 666 stations, collecting long-term consecutive daily precipitation data, were selected to calculate extreme precipitation indices (Figure 1A); the data from 1979 to 2020 were provided by the China Meteorological Data Sharing Service System of the National Meteorological Information Center (http://data.cma.cn/). The provider rigorously tested the quality of the Obs. In addition, to ensure the authenticity and accuracy of the data, error analysis, and quality control of all data were performed before conducing the analysis. The selected stations had data gaps of less than 5%.
The fifth-generation atmospheric reanalysis data product, ERA5, has been released and compared with the first four generation products (FGGE, ERA-15, ERA-40, and ERA-Interim) (Hersbach et al., 2020; Jiang et al., 2021). ERA5 has a higher spatiotemporal resolution than the other versions, with a grid resolution of 31 km and temporal resolution of 1 h. Moreover, advanced assimilation systems and parameterization schemes have also improved reanalysis products. Another advantage of ERA5 over the prior four generation products is the number of parameters; more than 240 parameters fulfill the needs of different types of research.
In this study, we calculated the nearest ERA5 grids to the Obs stations by using Euclidean distance and then used this result to obtain ERA5 precipitation data corresponding to Obs stations. In addition, we converted the hourly scale ERA5 precipitation data to daily scale data by cumulation.
Extreme precipitation indices are widely used in assessments of extreme precipitation events (Zhu et al., 2017; Dong et al., 2020; Kim et al., 2020; Lei et al., 2021a), which are based on daily precipitation data. The extreme precipitation indices used in this study were provided by the ETCCDMI (Zhang et al., 2011). To improve the characterization of regional extreme precipitation, Rnn was modified to R1 mm and R50 mm in this study (Table 2). R1 mm and R50 mm were used to illustrate the ability of ERA5 to capture wet days and the number of extremely heavy precipitation days, respectively.
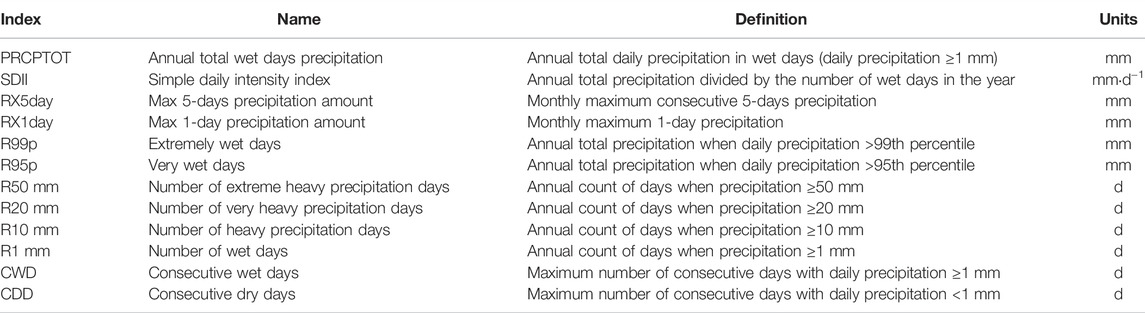
TABLE 2. Definition of extreme precipitation indices.
Extreme precipitation indices are classified by different classification criteria. For example, according to the definition, thresholds are divided into absolute indices and relative threshold indices, while based on the length of the time series, these are divided into monthly and annual extreme precipitation indices. In this study, we divided the 12 extreme precipitation indices into three categories based on their characteristics (Alexander et al., 2019; Yao et al., 2020): 1) intensity indices, namely PRCPTOT, SDII, RX5day, RX1day, R99p, and R95p; 2) frequency indices, including R50 mm, R20 mm, R10 mm, and R1 mm; and 3) duration indices, including CWD and CDD. However, due to regional climate differences, the 12 extreme precipitation indices were not applicable to the whole country. For example, the mean annual precipitation at many stations in northwestern China (Regions-Ⅳ and Ⅵ) was less than 200 mm, and RX1day did not exceed 20 mm. Therefore, R20 mm and R50 mm were not applicable to these two regions. The number of extreme precipitation indices for the six regions in China are listed in Table 3.
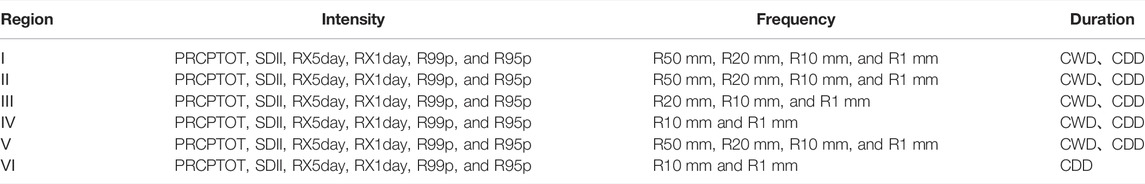
TABLE 3. Extreme precipitation indices for six regions over China.
In the application process, the autocorrelation of hydrological and meteorological elements often causes the elements with nonsignificant trends to become significant. Therefore, many studies have used the prewhitening procedure before trend detection (Das and Scaringi 2021; O’Brien et al., 2021; Shin et al., 2021; Wu et al., 2021). The prewhitening Mann–Kendall (PWMK) test has been used to test the ability of ERA5 to assess the trend of extreme precipitation indices (Mann 1945; Kendall 1975; Yue and Wang 2002).
Conducting a quantitative and comprehensive assessment of the applicability of reanalysis data is important for improving the predictive capability of reanalysis data. A single statistical metric can only provide a one-sided description of the limitations of the dataset and cannot quantitatively describe the accuracies of the models from different perspectives (Hu et al., 2019). Moreover, existing evaluation metrics, such as Taylor diagrams (Taylor 2001), do not allow for a quantitative assessment (Zhou et al., 2021a).
Therefore, we used a new indicator, DISO, to quantitatively and comprehensively evaluate ERA5 precipitation data (Hu et al., 2019; Kalmár et al., 2021). We selected four continually statistical metrics (Lu and Yong 2020) normalized root mean square error (NRMSE), normalized mean absolute error (NMAE), relative bias (RB), and Pearson correlation coefficient (CC) as input variables for DISO (Table 4). NRMSE indicates the mean error of ERA5. NMAE eliminates the effect of positive and negative offsetting of ERA errors. RB accurately describes whether ERA5 underestimates or overestimates extreme precipitation. The CC is a crucial indicator of the correlation between ERA5 and Obs. The statistical metrics used in this study and their formulas are listed in Table 4. DISO is greater than 2.0 when the values of input variables (NRMSE, NMAE, RB, and CC-1) are greater than 1.0. However, if DISO is greater than 2.0, the reliability of ERA5 for simulating extreme precipitation will be extremely low. In addition, when the values of the input variables are less than 0.5, DISO is less than 1.0, which means that ERA5 can capture extreme precipitation. Therefore, we used 1.0 as the dividing line for the simulation effect (Hu et al., 2019). DISO greater than 1.0 indicates a poor simulation (worst if greater than 2.0), and less than 1.0 indicates a good simulation (best if close to 0.0).

TABLE 4. Evaluation criteria used in this study.
Figure 2 illustrates the spatial distribution of DISO for ERA5 over China on two timescales (daily and monthly). ERA5 performs poorly on the daily scale and well on the monthly scale. In other words, ERA5 captures the variation in monthly precipitation but performs poorly on wet days. The number of days and magnitude of precipitation had a significant impact on the accuracy of the simulation.
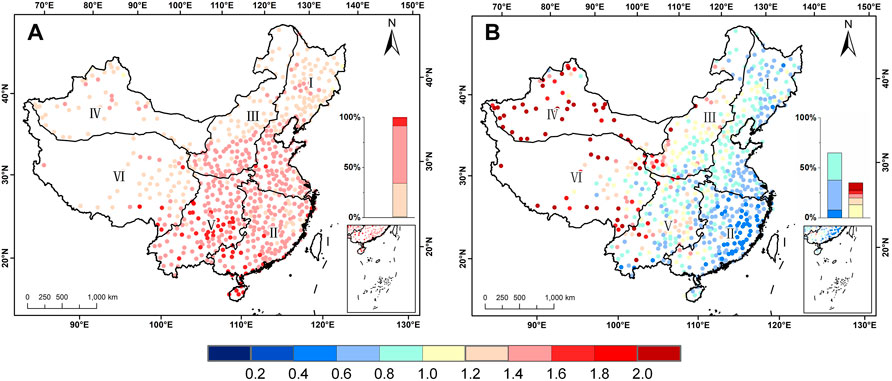
FIGURE 2. Performance of DISO over China from 1979 to 2020. (A) daily precipitation ≥1 mm. (B) monthly total precipitation.
For the daily scale (daily precipitation ≥1 mm), DISO for all stations was greater than 1.0, and approximately 90% of stations showed DISO between 1.2 and 1.6 (Figure 2A). Regions-Ⅱ and Ⅴ showed larger errors than did the other regions. Both regions (mean annual precipitation ≥1000 mm) had the highest wet days and precipitation in China, based on regional precipitation characteristics (Figure 1B). Similarly, the southern part of Regions-Ⅰ and Ⅲ showed high DISO. In wetter regions, some wet days led to a larger DISO.
ERA5 performed better in terms of monthly precipitation than daily precipitation (Figure 2B). Half the stations (approximately 57%) showed DISO between 0.6 and 1.0. The overall trend showed a gradually increasing trend from the southeast to northwest. This finding suggests that ERA5 better captures the variability of monthly precipitation in the wetter regions (Region-Ⅱ) than in the arid regions (Regions-Ⅳ and Ⅵ).
To further evaluate the applicability of ERA5 to extreme precipitation events, nine extreme precipitation indices were selected, based on the geomorphological features of different regions. DISO for extreme precipitation indices in different regions was calculated using the Thiessen polygon method (Şen 1998; Lei et al., 2021b). According to the data in Table 5, ERA5 performs well in eastern China (Regions-Ⅰ and Ⅱ) and poorly in western China (Regions-Ⅳ and Ⅵ). ERA5 is better at simulating CDD and SDII than other extreme precipitation indices. Moreover, ERA5 showed poor simulation capability for RX1day, R99p, and R95p.
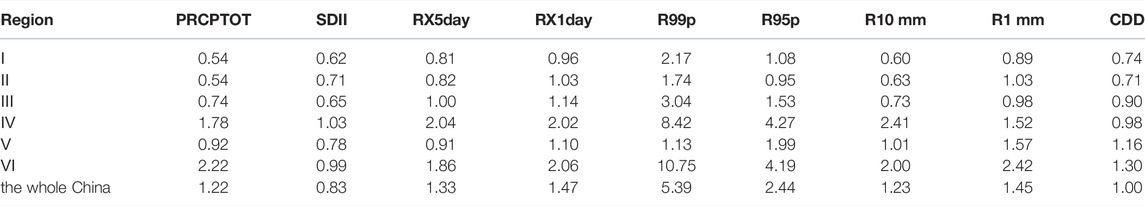
TABLE 5. DISO for extreme precipitation indices over China.
For the different regions, DISO for the extreme precipitation indices for Regions-Ⅰ, Ⅱ, and Ⅲ are lower than 1.0, accounting for 80.96%. DISO in Region-Ⅰ illustrates that ERA5 simulates extreme precipitation very well in Region-Ⅰ. However, ERA5 exhibits a lower ability to capture extreme precipitation events (especially the intensity and frequency of extreme precipitation) in Regions-Ⅳ and Ⅵ. DISO of Region-Ⅴ is concentrated in the range of 0.8–1.2. In general, with the increase in mean annual precipitation, the capability of ERA5 to simulate extreme precipitation events increases.
Figure 3 shows the spatial distribution of DISO for nine extreme precipitation indices of ERA5 over China from 1979 to 2020. For the intensity of extreme precipitation indices, PRCPTOT, SDII, and RX5day show that DISO in eastern China, especially in Regions-Ⅰ and Ⅱ, is mainly below 1.0. However, ERA5 shows poor simulation ability for RX1day and only tends to detect annual maximum precipitation events in the north of Region-Ⅰ. In addition, compared with RX5day (28.98%), RX1day in 64.11% of stations has values greater than 1.0. Similarly, the reliability of ERA5 for R95p is better than that of R99p; the DISO is marginally higher over Regions-Ⅲ, Ⅳ, and Ⅵ. These results imply that the ability of ERA5 to capture extreme precipitation increases as the amount of precipitation increases.
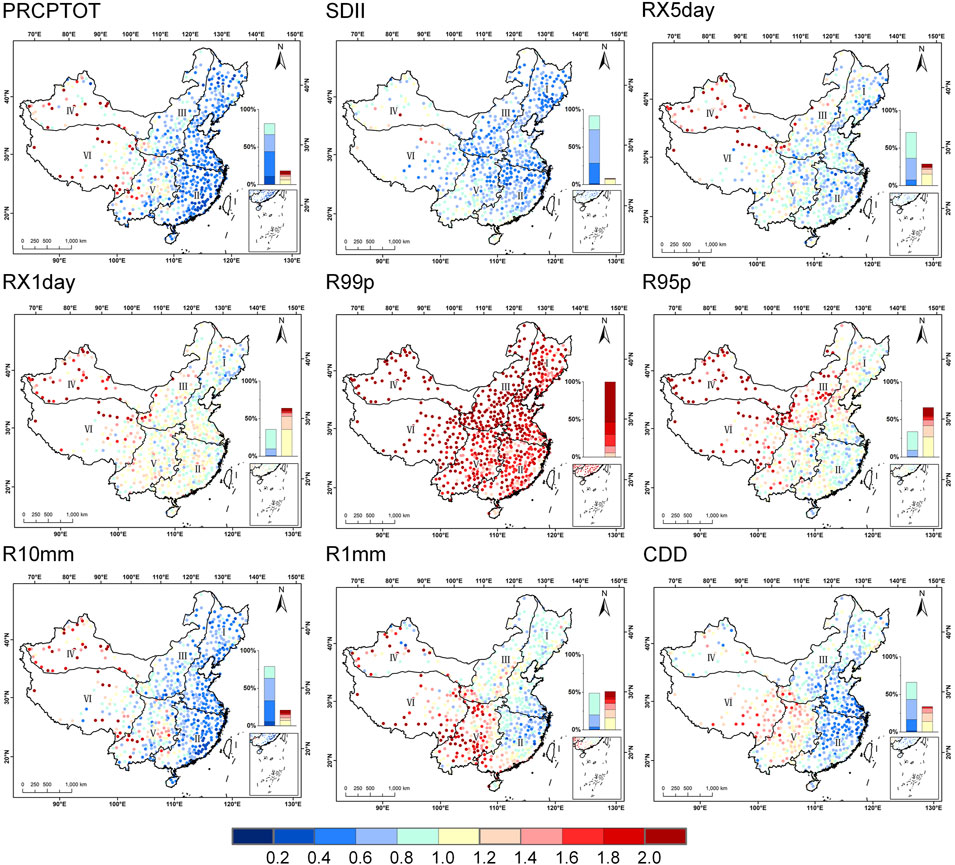
FIGURE 3. Spatial distribution of DISO for extreme precipitation indices of ERA5 over China.
For the frequency indices, the result of R1 mm displays the poor simulation ability of ERA5 for wet days, except in the south of Region-Ⅰ and north of Region-Ⅱ. ERA5 provide high quality precipitation for R10 mm, especially in eastern and northern China (Regions-Ⅰ, Ⅱ, and Ⅲ). Moreover, ERA5 has improved simulation capability for R10 mm in eastern Region-Ⅵ.
For the duration indices, DISO for 66.22% of stations in China is below 1.0, and most stations are concentrated in Regions-Ⅰ, Ⅱ, and Ⅲ. Additionally, ERA5 performs better for CDD in the west of Region-Ⅳ. In general, DISO of CDD is in the range of 0.6–1.0.
Geographically, these results illustrate that ERA5 simulates well in regions with sufficient precipitation but performs poorly in mountainous and high-altitude regions. Simulating precipitation in mountainous and high-altitude regions, especially in the Tibetan Plateau, is difficult (Zhang et al., 2020; Hu and Yuan 2021). Moreover, ERA5 performs poorly on wet days and extremely wet days. Studies have shown that extremely heavy precipitation has complex mechanisms and variable processes (Dai and Nie 2020). In addition, the reanalysis datasets show significantly uncertainties for extremely heavy precipitation (Huang et al., 2016).
Notably, DISO is unable to indicate whether ERA5 overestimates or underestimates extreme precipitation. Therefore, using RB to assess the applicability of ERA5 to extreme precipitation events is necessary (Figure 4).
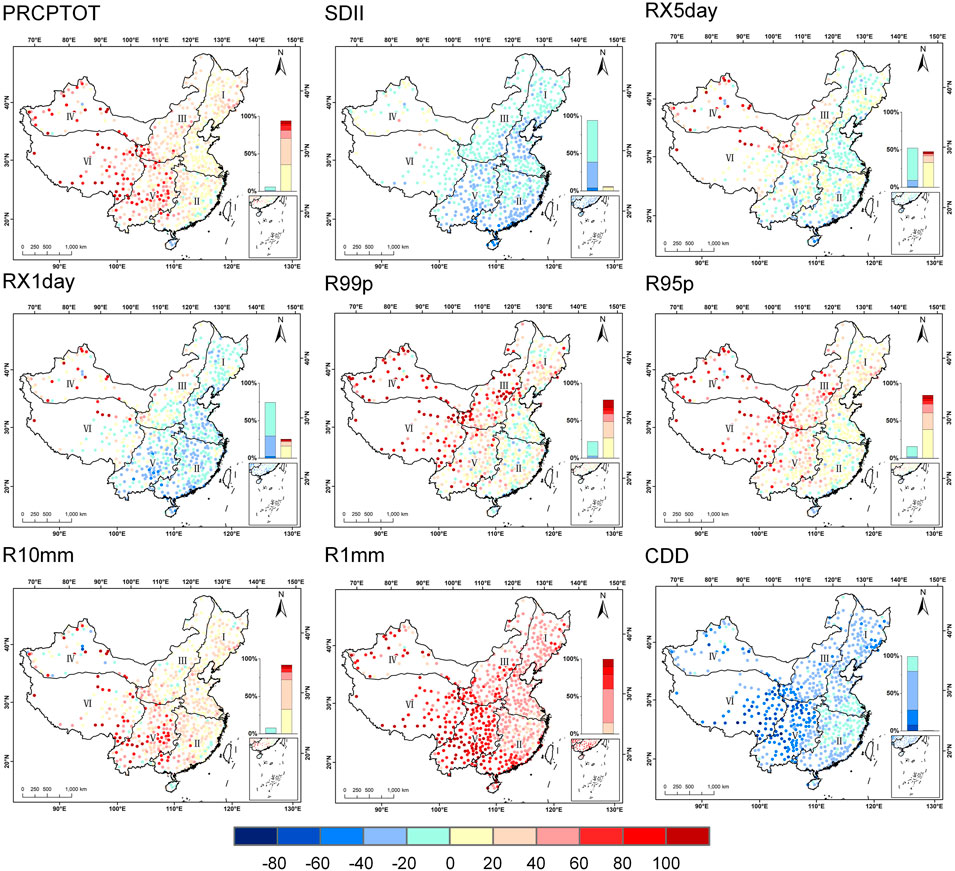
FIGURE 4. Spatial distribution of RB (%) for extreme precipitation indices of ERA5 over China.
Regarding intensity indices, the ERA5 precipitation data are obviously overestimates PRCPTOT and underestimates SDII. The RB of RX5day concentrates in the range of −0.2–0.2 (84.83%), suggesting that ERA5 can better simulate persistent extreme precipitation events than temporary extreme precipitation events. Similar to PRCPTOT, ERA5 underestimates R99p and R95p in most regions. For the frequency indices, ERA5 shows overestimation at more than 95% of stations, especially for R1 mm (100%). Additionally, ERA5 precipitation has a wet bias, although the error of R10 mm is small. However, the duration indices showed that ERA5 underestimates the CDD at all the stations. Similar to R1 mm, ERA5 has poor applicability in western China.
Generally, ERA5 overestimates the intensity of extreme precipitation in western China but underestimates annual maximum precipitation. ERA5 overestimates and underestimates the frequency and duration of extreme precipitation indices. Based on the results in Figures 4, 5, the highest value of DISO is caused by overestimation (e.g., R99p). Singh et al. (2021) found that ERA5 underestimated all extreme precipitation categories over India and failed to capture the variation in hilly topography. However, Bandhauer et al. (2021) found that ERA5 was overestimated the mean precipitation in Europe. Therefore, assessing ERA5 before its application is essential.
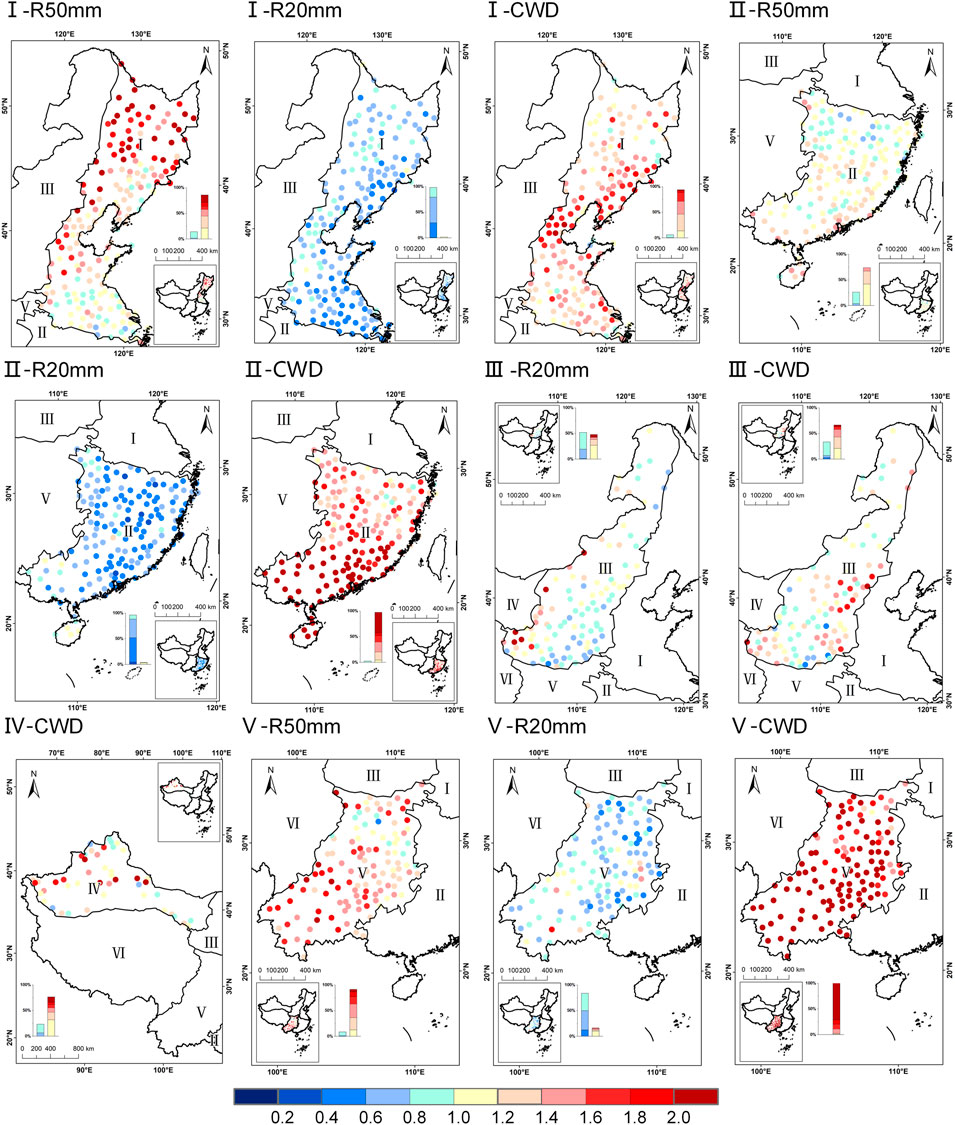
FIGURE 5. Spatial distribution of DISO for the regional extreme precipitation indices of ERA5 in six regions.
Each region has different geomorphological and climatic characteristics, which leads to different regional extreme precipitation indices. In addition to the extreme precipitation indices over China, we used the regional indices (Figure 5). We found that the differences between national and regional indices are the aggregated characteristics of the regional indices. In other words, the regional indices show a similar applicability to ERA5 precipitation because of their similar geomorphological and climatic characteristics. The six regions can be divided into two categories based on the mean annual precipitation and the number of regional indices: 1) those with mean annual precipitation greater than 400 mm (Regions-Ⅰ, Ⅱ, and Ⅴ) and three regional indices (R50 mm, R20 mm, and CWD) and 2) those with mean annual precipitation of less than 400 mm and regional indices below three (Regions-Ⅲ, Ⅳ, and Ⅵ).
The regions in the first category experience temperate monsoon climate and subtropical monsoon climate. The mean annual precipitation at most stations is concentrated in the range of 600–1600 mm. Different from Region-Ⅰ, which mostly belongs to hilly plains, Region-Ⅱ is primarily low-middle mountains. Region-Ⅴ shows higher elevation than Regions-Ⅰ and Ⅱ. However, the performance differences among Regions-Ⅰ, Ⅱ, and Ⅴ are small. Regarding the frequency of extreme precipitation, R20 mm performs the best, and R50 mm performs the worst. Compared with Figure 3, the applicability of ERA5 increases as the precipitation amount increases, except for R50 mm. These results show that the ERA5 is good at simulating light and moderate rainfall, but poor at simulating extremely heavy precipitation. For the duration of extreme precipitation, most stations’ CWD exceeds 1.0.
The regions in the second category are characterized by high altitudes with low mean annual precipitation. The number of observation stations in the second category is relatively low, and the regions experience a temperate grassy climate and an alpine climate. For the frequency of extreme precipitation, ERA5 performs poorly for R20 mm in Region-Ⅲ. Regarding the duration of extreme precipitation, ERA5 performs poorly for CWD.
In general, these results demonstrate that with regard to the simulation ability of R20 mm, ERA5 performs well, and DISO is lower than 1.0, especially in eastern China. However, ERA5 shows poor performance for R50 mm and CWD.
To investigate the ability of ERA5 to simulate monthly extreme precipitation and seasonal differences in the seasons, we used RX1day and RX5day to calculate the DISO. The overall performance of ERA5 monthly precipitation data for RX1day and RX5day are shown in Figures 6, 7, respectively. In addition, many regions receive a large amount of precipitation in summer (June, July, and August) and autumn (September, October, and November), and less precipitation in spring (March, April, and May), and winter (December, January, and February). Studies have shown that ERA5 precipitation data performs very well on a monthly timescale (Xu et al., 2019; Nogueira 2020); however, there is a lack of assessment considering the rainy and non-rainy seasons. Therefore, we also focus on the differences between rainy seasons and non-rainy seasons. Notably, the duration of the rainy season varies among regions because of their different climatic characteristics. In this study, the rainy season is from May to October and the non-rainy season is from November to April.
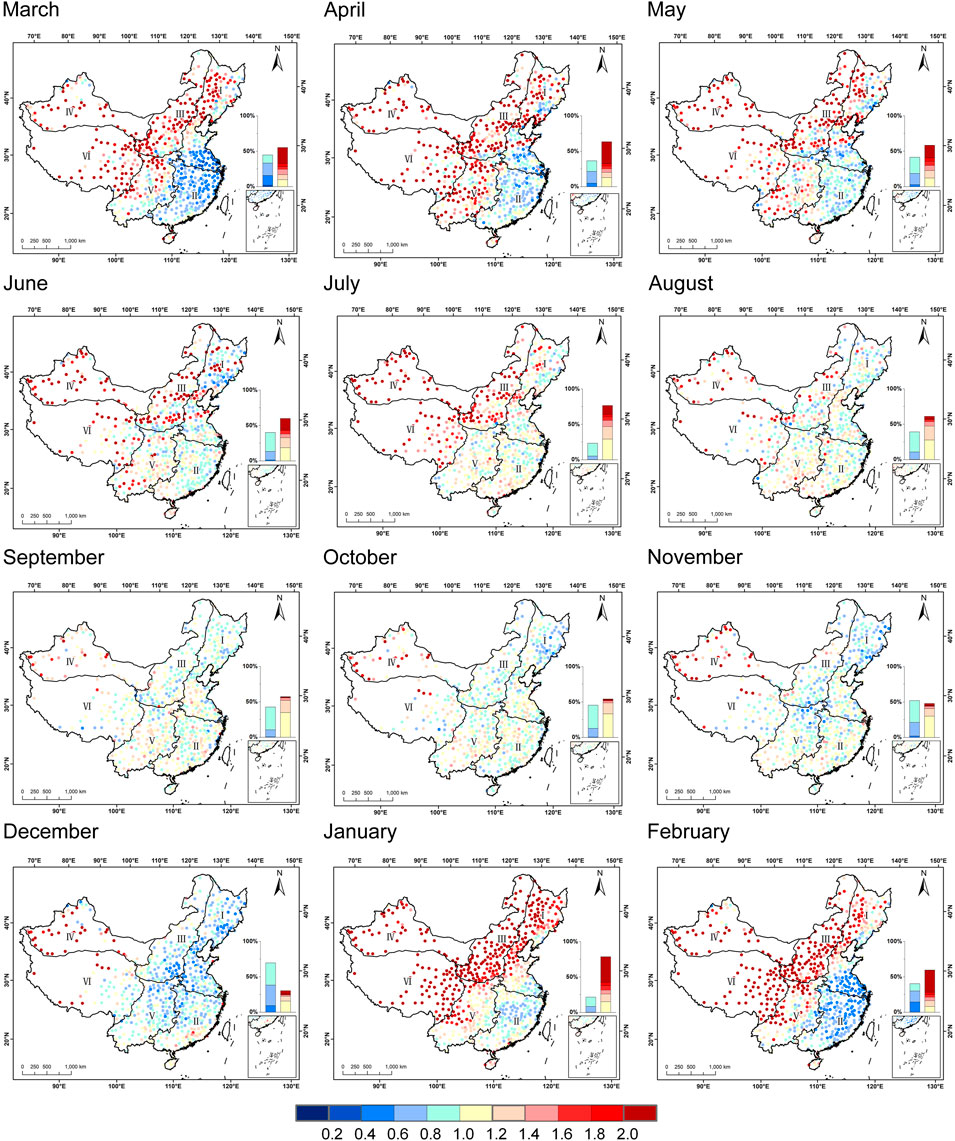
FIGURE 6. Spatial distribution of DISO for RX1day of ERA5 over China from spring to winter. spring (March, April, and May), summer (June, July, and August), autumn (September, October, and November), and winter (December, January, and February).
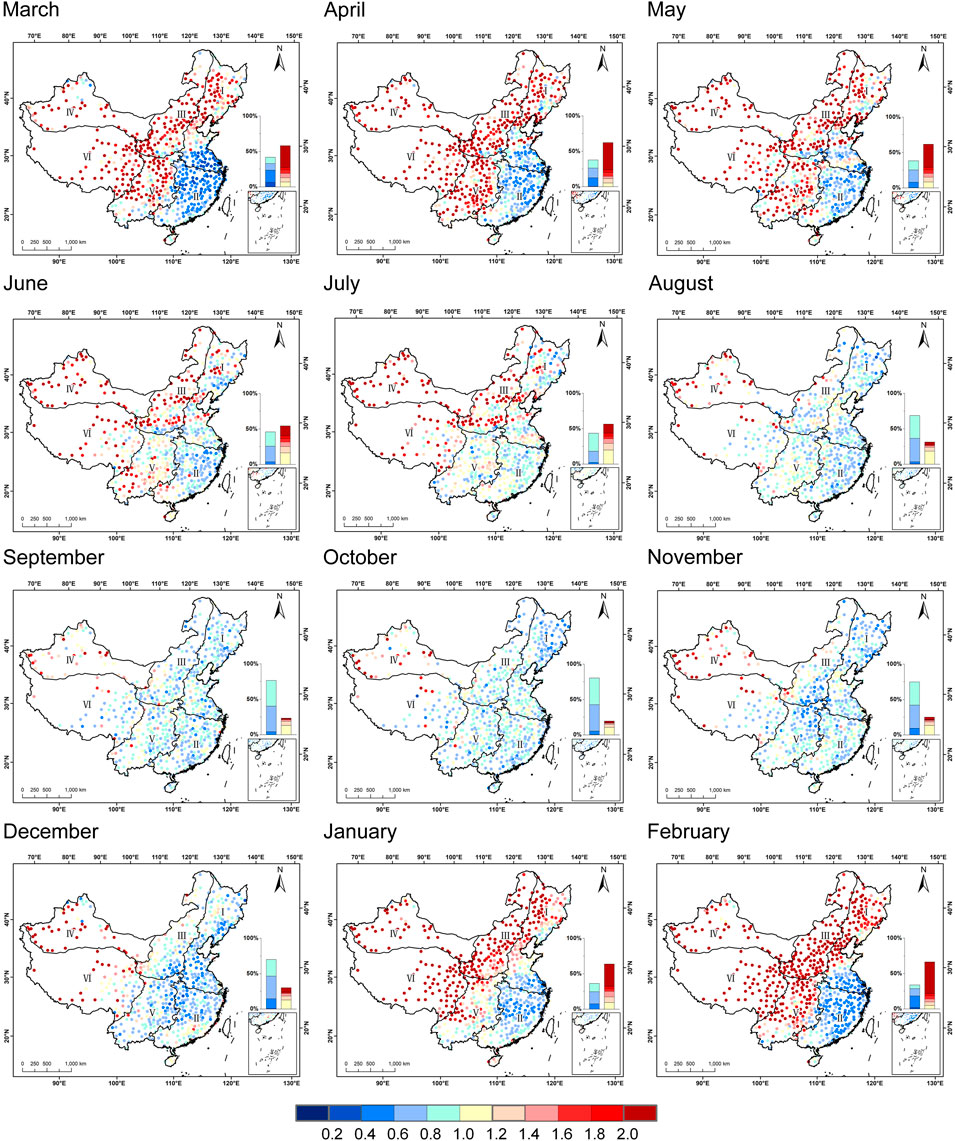
FIGURE 7. Spatial distribution of DISO for RX5day of ERA5 over China from spring to winter. spring (March, April, and May), summer (June, July, and August), autumn (September, October, November), winter (December, January, and February).
Figure 6 illustrates that ERA5 performs well in summer and autumn for RX1day, except for the month of November. For the spring, ERA5 has the best performance in Region-Ⅱ with DISO in the range of 0.8–1.2. For the summer, most stations range from 0.8 to 1.2, except for Region-Ⅳ. In autumn, precipitation begins to decrease over the country. ERA5 performs the best and the worst in October (69.67% stations with DISO in the range of 0.0–1.0) and November (78.53% stations with DISO lager than 1.0), respectively. These 2 months usually represent the end of the rainy season and the beginning of non-rainy season. Therefore, the ability of ERA5 to estimate extreme precipitation is closely related to the total precipitation. For winter, the differences in performance among the six regions are remarkable when DISO is greater than 1.0, except for Region-Ⅱ and the south of Region-Ⅰ.
Monthly DISO clearly demonstrates low value with respect to monthly maximum 1-day precipitation in the rainy season. However, ERA5 performs poorly in non-rainy season. From May to October, DISO decreases from southern to northeastern China because of the movement of the rain belt (Jiang et al., 2021). In other words, ERA5 performs increasingly better as the number of days of the rainy season increases. Notably, the rainy season starts in May, and the non-rainy season ends in November, for both of which, ERA5 shows large errors. Geographically, DISO is greater than 1.0 in northwestern China during the whole year but ranges from 0.0 to 1.0 in southeastern China.
Figure 7 demonstrates that the ability of ERA5 to estimate RX5day is better than its ability to estimate RX1day, and also shows clear seasonal characteristics. For the spring, ERA5 has the best DISO for Region-Ⅱ, with value from 0.6 to 1.0. For summer, DISO at most stations is in the range of 0.6–1.2, except for Region-Ⅳ. Notably, ERA5 has good estimation capability for extreme precipitation in the eastern Tibetan Plateau during the summer. For autumn, similar to RX1day, the ability of ERA5 to estimate extreme precipitation is significantly different between October and November. DISO values of Regions-Ⅰ, Ⅲ, and Ⅴ change from less than 1.0 to greater than 1.0. In winter, DISO of more than 60% of the sites is DISO greater than 1, except for Region-Ⅱ and southern Region-Ⅰ.
ERA5 performs better for RX5day, especially in Region-Ⅱ, than for RX1day. For temporal distribution, the applicability of ERA5 in the rainy season is better than that in the non-rainy season, with the best performance in October. For spatial distribution, ERA5 performs very well in southeastern China, especially in the non-rainy season. ERA5 has poor simulation capability for extreme precipitation in northwestern China.
Figure 8 illustrates that ERA5 cannot simulate the trend of extreme precipitation indices and differs significantly from the Obs. Most Obs show an increasing trend in the intensity of extreme precipitation, while ERA5 shows a decreasing trend. Regarding the frequency of extreme precipitation, ERA5 performs poorly with respect to R10 mm and R1 mm. ERA5 simulates extreme precipitation at many stations with nonsignificant decreasing trends as significant, especially for R1 mm. Regarding the duration of extreme precipitation, ERA5 simulates extreme precipitation approximately half of the stations incorrectly as increasing trends.
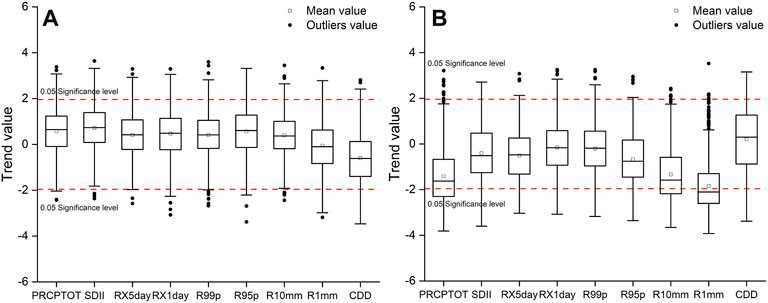
FIGURE 8. Box plots of the PWMK test value of DISO for the Obs (A) and ERA5 (B) for extreme precipitation indices over China from 1979 to 2020.
In this study, 12 extreme precipitation indices were used to evaluate the applicability of ERA5 under complex environmental conditions. We used DISO to perform a comprehensive assessment of the capability of ERA5 simulating extreme precipitation at different spatial and temporal scales. The climatology and trends of ERA5 assessing extreme precipitation were also investigated.
This study shows that ERA5 is better for total simulations than daily precipitation. For the intensity indices, ERA5 has the best simulation for PRCPTOT, with DISO of 81.3% stations below 1.0. ERA5 performs better for RX5day and R95p than RX1day and R99p, especially in eastern China. For the frequency indices, the ability of the ERA5 simulation increases as the amount of precipitation increases, except for northwestern China. For example, the number of stations with DISO below 1.0 increases from R1 mm to R20 mm. However, the ability of ERA5 to simulate extremely heavy rainfall (e.g., R50 mm) decreases. For the duration indices, ERA5 is better at simulating drought events than precipitation events in the eastern China. Moreover, ERA5 overestimates the extreme precipitation intensity and frequency, whereas it underestimates the duration of extreme precipitation.
For the different time scales, ERA5 performs the best and the worst in October and November, respectively. ERA5 has the best ability simulating extreme precipitation in summer, and DISO values of 58.8% of stations below 1.0. In addition, ERA5 shows the worst ability to capture the variation of extreme precipitation in winter, with more than 55% of stations having DISO values lager than 1.0. Moreover, we found that ERA5 performs better in the rainy season than the non-rainy season. The amount of precipitation can explain the differences in the ERA5 performance.
For the different spatial scales, ERA5 performs best in Region-Ⅱ and performs second best in Regions-Ⅰ and Ⅲ. However, ERA5 performs poorly in the remaining regions, especially in northwestern China. Precipitation in high-altitude areas (e.g., the Tibetan Plateau) was difficult to simulate. Moreover, ERA5 cannot simulate changes in extreme precipitation trends. Therefore, the ability of ERA5 to simulate long-term trend changes needs to be improved.
In summary, this study evaluates the ability of ERA5 capture the extreme precipitation events in China. The capturing of the frequency and duration of extreme precipitation in southeastern China is better than the intensity. The ability of ERA5 to simulate precipitation increases as precipitation amounts increases, except for R50 mm. Similar to the reports in many previous studies that the performance of ERA5 was greatly influenced by altitude. This study assessed the performance of ERA5 considering only precipitation, and further research is required to investigate the causes of errors in the future.
The original contributions presented in the study are included in the article/Supplementary Material, further inquiries can be directed to the corresponding authors.
LG, AF, and XL designed the research and collected the data, XL, WX, SC, and MZ contributed to the data processing and analysis, XL prepared the original draft, LG edited and reviewed the manuscript, LJ, RB, XL, XG, MM, TY, ZH and JW contributed to the discussion. All authors have read and agreed to the published version of the manuscript.
This work was supported by the National Key Research and Development Program of China (2018YFE0206400), the Natural Science Foundation of China (41775081), the National Youth Talent Program (Grant No. E1190301) and the Scientific Project from Fujian Key Laboratory of Severe Weather (2020KFKT01).
The authors declare that the research was conducted in the absence of any commercial or financial relationships that could be construed as a potential conflict of interest.
All claims expressed in this article are solely those of the authors and do not necessarily represent those of their affiliated organizations, or those of the publisher, the editors and the reviewers. Any product that may be evaluated in this article, or claim that may be made by its manufacturer, is not guaranteed or endorsed by the publisher.
Alexander, L. V., Fowler, H. J., Bador, M., Behrangi, A., Donat, M. G., Dunn, R., et al. (2019). On the Use of Indices to Study Extreme Precipitation on Sub-daily and Daily Timescales. Environ. Res. Lett. 14, 125008. doi:10.1088/1748-9326/ab51b6
Alexander, L. V. (2016). Global Observed Long-Term Changes in Temperature and Precipitation Extremes: A Review of Progress and Limitations in IPCC Assessments and beyond. Weather Clim. Extrem. 11, 4–16. doi:10.1016/j.wace.2015.10.007
Amjad, M., Yilmaz, M. T., Yucel, I., and Yilmaz, K. K. (2020). Performance Evaluation of Satellite- and Model-Based Precipitation Products over Varying Climate and Complex Topography. J. Hydrology 584, 124707. doi:10.1016/j.jhydrol.2020.124707
Bandhauer, M., Isotta, F., Lakatos, M., Lussana, C., Baserud, L., Izsak, B., et al. (2021). Evaluation of daily precipitation analyses in E-OBS (v19.0e) and ERA5 by comparison to regional high-resolution datasets in European regions. Int. J. Climatol. 1–21, 727–747. doi:10.1002/joc.7269
Chen, H., and Sun, J. (2017). Contribution of Human Influence to Increased Daily Precipitation Extremes over China. Geophys. Res. Lett. 44, 2436–2444. doi:10.1002/2016gl072439
Cheng, W. M., Zhou, C. H., Li, B. Y., and Shen, Y. C. (2019). Geomorphological Regionalization Theory System and Division Methodology of China. Acta. Geogr. Sin. 74, 839–856. doi:10.11821/dlxb201905001
Dai, P., and Nie, J. (2020). A Global Quasigeostrophic Diagnosis of Extratropical Extreme Precipitation. J. Clim. 33, 9629–9642. doi:10.1175/jcli-d-20-0146.1
Das, S., and Scaringi, G. (2021). River Flooding in a Changing Climate: Rainfall-Discharge Trends, Controlling Factors, and Susceptibility Mapping for the Mahi Catchment, Western India. Nat. Hazards 109, 2439–2459. doi:10.1007/s11069-021-04927-y
Donat, M. G., Sillmann, J., Wild, S., Alexander, L. V., Lippmann, T., and Zwiers, F. W. (2014). Consistency of Temperature and Precipitation Extremes across Various Global Gridded In Situ and Reanalysis Datasets. J. Clim. 27, 5019–5035. doi:10.1175/jcli-d-13-00405.1
Dong, S., Sun, Y., and Li, C. (2020). Detection of Human Influence on Precipitation Extremes in Asia. J. Clim. 33, 5293–5304. doi:10.1175/jcli-d-19-0371.1
Duan, Z., Liu, J., Tuo, Y., Chiogna, G., and Disse, M. (2016). Evaluation of Eight High Spatial Resolution Gridded Precipitation Products in Adige Basin (Italy) at Multiple Temporal and Spatial Scales. Sci. Total Environ. 573, 1536–1553. doi:10.1016/j.scitotenv.2016.08.213
Dullaart, J. C. M., Muis, S., Bloemendaal, N., Chertova, M. V., Couasnon, A., and Aerts, J. C. J. H. (2021). Accounting for Tropical Cyclones More Than Doubles the Global Population Exposed to Low-Probability Coastal Flooding. Commun. Earth. Environ. 2, 135. doi:10.1038/s43247-021-00204-9
Dunn, R. J. H., Alexander, L. V., Donat, M. G., Zhang, X., Bador, M., Herold, N., et al. (2020). Development of an Updated Global Land In Situ-Based Data Set of Temperature and Precipitation Extremes: HadEX3. J. Geophys. Res. Atmos. 125, e2019JD032263. doi:10.1029/2019jd032263
Gao, L., Bernhardt, M., Schulz, K., Chen, X., Chen, Y., and Liu, M. (2016). A First Evaluation of ERA-20CM over China. Mon. Weather Rev. 144, 45–57. doi:10.1175/mwr-d-15-0195.1
Gao, L., Hao, L., and Chen, X.-w. (2014). Evaluation of ERA-Interim Monthly Temperature Data over the Tibetan Plateau. J. Mt. Sci. 11, 1154–1168. doi:10.1007/s11629-014-3013-5
Gao, L., Huang, J., Chen, X., Chen, Y., and Liu, M. (2017). Risk of Extreme Precipitation under Nonstationarity Conditions during the Second Flood Season in the Southeastern Coastal Region of China. J. Hydrometeorol. 18, 669–681. doi:10.1175/jhm-d-16-0119.1
Gao, L., Wei, J., Wang, L., Bernhardt, M., Schulz, K., and Chen, X. (2018). A High-Resolution Air Temperature Data Set for the Chinese Tian Shan in 1979-2016. Earth Syst. Sci. Data 10, 2097–2114. doi:10.5194/essd-10-2097-2018
Hersbach, H., Bell, B., Berrisford, P., Hirahara, S., Horányi, A., Muñoz‐Sabater, J., et al. (2020). The ERA5 Global Reanalysis. Q.J.R. Meteorol. Soc. 146, 1999–2049. doi:10.1002/qj.3803
Hu, X., and Yuan, W. (2021). Evaluation of ERA5 Precipitation over the Eastern Periphery of the Tibetan Plateau from the Perspective of Regional Rainfall Events. Int. J. Climatol. 41, 2625–2637. doi:10.1002/joc.6980
Hu, Z., Chen, X., Zhou, Q., Chen, D., and Li, J. (2019). DISO: A Rethink of Taylor Diagram. Int. J. Climatol. 39, 2825–2832. doi:10.1002/joc.5972
Huang, D.-Q., Zhu, J., Zhang, Y.-C., Huang, Y., and Kuang, X.-Y. (2016). Assessment of Summer Monsoon Precipitation Derived from Five Reanalysis Datasets over East Asia. Q.J.R. Meteorol. Soc. 142, 108–119. doi:10.1002/qj.2634
Jiang, Q., Li, W., Fan, Z., He, X., Sun, W., Chen, S., et al. (2021). Evaluation of the ERA5 Reanalysis Precipitation Dataset over Chinese Mainland. J. Hydrology 595, 125660. doi:10.1016/j.jhydrol.2020.125660
Kalmár, T., Pieczka, I., and Pongrácz, R. (2021). A Sensitivity Analysis of the Different Setups of the RegCM4.5 Model for the Carpathian Region. Int. J. Climatol. 41, E1180–E1201. doi:10.1002/joc.6761
Kendall, M. G. (1975). Rank Correlation Methods. fourth ed.. London, United Kingdom: Charles Griffin.
Kim, Y.-H., Min, S.-K., Zhang, X., Sillmann, J., and Sandstad, M. (2020). Evaluation of the CMIP6 Multi-Model Ensemble for Climate Extreme Indices. Weather Clim. Extrem. 29, 100269. doi:10.1016/j.wace.2020.100269
Lei, X., Gao, L., Ma, M., Wei, J., Xu, L., Wang, L., et al. (2021a). Does Non-stationarity of Extreme Precipitation Exist in the Poyang Lake Basin of China? J. Hydrology Regional Stud. 37, 100920. doi:10.1016/j.ejrh.2021.100920
Lei, X., Gao, L., Wei, J., Ma, M., Xu, L., Fan, H., et al. (2021b). Contributions of Climate Change and Human Activities to Runoff Variations in the Poyang Lake Basin of China. Phys. Chem. Earth, Parts A/B/C 123, 103019. doi:10.1016/j.pce.2021.103019
Li, W., and Chen, Y. (2021). Detectability of the Trend in Precipitation Characteristics over China from 1961 to 2017. Int. J. Climatol. 41, E1980–E1991. doi:10.1002/joc.6826
Lu, D., and Yong, B. (2020). A Preliminary Assessment of the Gauge-Adjusted Near-Real-Time GSMaP Precipitation Estimate over Mainland China. Remote Sens. 12, 141. doi:10.3390/rs12010141
Mann, H. B. (1945). Nonparametric Tests against Trend. Econometrica 13, 245–259. doi:10.2307/1907187
IPCC (2021). “Climate Change 2021: The Physical Science Basis,” in Contribution of Working Group I to the Sixth Assessment Report of the Intergovernmental Panel on Climate Change. Editor V. Masson-Delmotte (New York, NY, United States: Cambridge University Press).
Nogueira, M. (2020). Inter-comparison of ERA-5, ERA-Interim and GPCP Rainfall over the Last 40 years: Process-Based Analysis of Systematic and Random Differences. J. Hydrology 583, 124632. doi:10.1016/j.jhydrol.2020.124632
O’Brien, N. L., Burn, D. H., Annable, W. K., and Thompson, P. J. (2021). Trend Detection in the Presence of Positive and Negative Serial Correlation: A Comparison of Block Maxima and Peaks-Over-Threshold Data. Water. Resour. Res. 57, e2020WR028886. doi:10.1029/2020WR028886
Rana, S., McGregor, J., and Renwick, J. (2015). Precipitation Seasonality over the Indian Subcontinent: An Evaluation of Gauge, Reanalyses, and Satellite Retrievals. J. Hydrometeorol. 16, 631–651. doi:10.1175/jhm-d-14-0106.1
Şen, Z. (1998). Average Areal Precipitation by Percentage Weighted Polygon Method. J. Hydrol. Eng. 3, 69–72. doi:10.1061/(ASCE)1084-0699(1998)3:1(69)
Shin, J. Y., Kim, K. R., Kim, J., and Kim, S. (2021). Long‐term Trend and Variability of Surface Humidity from 1973 to 2018 in South Korea. Int. J. Climatol. 41, 4215–4235. doi:10.1002/joc.7068
Singh, T., Saha, U., Prasad, V. S., and Gupta, M. D. (2021). Assessment of Newly-Developed High Resolution Reanalyses (IMDAA, NGFS and ERA5) against Rainfall Observations for Indian Region. Atmos. Res. 259, 105679. doi:10.1016/j.atmosres.2021.105679
Tang, G., Clark, M. P., Papalexiou, S. M., Ma, Z., and Hong, Y. (2020). Have Satellite Precipitation Products Improved Over Last Two Decades? A Comprehensive Comparison of GPM IMERG with Nine Satellite and Reanalysis Datasets. Remote. Sens. Environ. 240, 111697. doi:10.1016/j.rse.2020.111697
Tarek, M., Brissette, F. P., and Arsenault, R. (2020). Evaluation of the ERA5 Reanalysis as a Potential Reference Dataset for Hydrological Modelling over North America. Hydrol. Earth Syst. Sci. 24, 2527–2544. doi:10.5194/hess-24-2527-2020
Taylor, K. E. (2001). Summarizing Multiple Aspects of Model Performance in a Single Diagram. J. Geophys. Res. 106, 7183–7192. doi:10.1029/2000jd900719
Wu, D., Fang, S., Tong, X., Wang, L., Zhuo, W., Pei, Z., et al. (2021). Analysis of Variation in Reference Evapotranspiration and its Driving Factors in Mainland China from 1960 to 2016. Environ. Res. Lett. 16, 054016. doi:10.1088/1748-9326/abf687
Xu, X. Y., Frey, S. K., Boluwade, A., Erler, A. R., Khader, O., Lapen, D. R., et al. (2019). Evaluation of Variability Among Different Precipitation Products in the Northern Great Plains. J. Hydrol. Reg. Stud. 24, 100608. doi:10.1016/j.ejrh.2019.100608
Yao, J. Q., Chen, Y., Chen, J., Tuoliewubieke, D., Li, J., Yang, L., et al. (2020). Intensification of Extreme Precipitation in Arid Central Asia. J. Hydrol. 598, 125760. doi:10.1016/j.jhydrol.2020.125760
Yatagai, A., Kamiguchi, K., Arakawa, O., Hamada, A., Yasutomi, N., and Kitoh, A. (2012). APHRODITE: Constructing a Long-Term Daily Gridded Precipitation Dataset for Asia Based on a Dense Network of Rain Gauges. Bull. Am. Meteorol. Soc. 93, 1401–1415. doi:10.1175/bams-d-11-00122.1
You, Q., Fraedrich, K., Min, J., Kang, S., Zhu, X., Ren, G., et al. (2013). Can Temperature Extremes in China Be Calculated from Reanalysis? Glob. Planet. Change 111, 268–279. doi:10.1016/j.gloplacha.2013.10.003
Yu, C., Hu, D., Liu, M., Wang, S., and Di, Y. (2020). Spatio-temporal Accuracy Evaluation of Three High-Resolution Satellite Precipitation Products in China Area. Atmos. Res. 241, 104952. doi:10.1016/j.atmosres.2020.104952
Yue, S., and Wang, C. Y. (2002). Applicability of Prewhitening to Eliminate the Influence of Serial Correlation on the Mann-Kendall Test. Water Resour. Res. 38, 4–1. doi:10.1029/2001wr000861
Zhang, L., Ren, D., Nan, Z., Wang, W., Zhao, Y., Zhao, Y., et al. (2020). Interpolated or Satellite-Based Precipitation? Implications for Hydrological Modeling in a Meso-Scale Mountainous Watershed on the Qinghai-Tibet Plateau. J. Hydrology 583, 124629. doi:10.1016/j.jhydrol.2020.124629
Zhang, Q., Körnich, H., and Holmgren, K. (2013). How Well Do Reanalyses Represent the Southern African Precipitation? Clim. Dyn. 40, 951–962. doi:10.1007/s00382-012-1423-z
Zhang, X., Alexander, L., Hegerl, G. C., Jones, P., Tank, A. K., Peterson, T. C., et al. (2011). Indices for Monitoring Changes in Extremes Based on Daily Temperature and Precipitation Data. WIREs Clim. Change 2, 851–870. doi:10.1002/wcc.147
Zhou, Q., Chen, D., Hu, Z., and Chen, X. (2021a). Decompositions of Taylor Diagram and DISO Performance Criteria. Int. J. Climatol. 41, 5726–5732. doi:10.1002/joc.7149
Zhou, Z. Q., Xie, S. P., and Zhang, R. (2021b). Historic Yangtze Flooding of 2020 Tied to Extreme Indian Ocean Conditions. Proc. Natl. Acad. Sci. U. S. A. 118, e2022255118. doi:10.1073/pnas.2022255118
Keywords: ERA5, reanalysis, extreme precipitation, DISO, China
Citation: Lei X, Xu W, Chen S, Yu T, Hu Z, Zhang M, Jiang L, Bao R, Guan X, Ma M, Wei J, Feng A and Gao L (2022) How Well Does the ERA5 Reanalysis Capture the Extreme Climate Events Over China? Part I: Extreme Precipitation. Front. Environ. Sci. 10:921658. doi: 10.3389/fenvs.2022.921658
Received: 16 April 2022; Accepted: 23 May 2022;
Published: 15 June 2022.
Edited by:
Zengyun Hu, Chinese Academy of Sciences (CAS), ChinaReviewed by:
Junqiang Yao, China Meteorological Administration, ChinaCopyright © 2022 Lei, Xu, Chen, Yu, Hu, Zhang, Jiang, Bao, Guan, Ma, Wei, Feng and Gao. This is an open-access article distributed under the terms of the Creative Commons Attribution License (CC BY). The use, distribution or reproduction in other forums is permitted, provided the original author(s) and the copyright owner(s) are credited and that the original publication in this journal is cited, in accordance with accepted academic practice. No use, distribution or reproduction is permitted which does not comply with these terms.
*Correspondence: Aixia Feng, ZmF4MjAwMzIwMDhAMTYzLmNvbQ==; Lu Gao, bC5nYW9AZm94bWFpbC5jb20=
Disclaimer: All claims expressed in this article are solely those of the authors and do not necessarily represent those of their affiliated organizations, or those of the publisher, the editors and the reviewers. Any product that may be evaluated in this article or claim that may be made by its manufacturer is not guaranteed or endorsed by the publisher.
Research integrity at Frontiers
Learn more about the work of our research integrity team to safeguard the quality of each article we publish.