 Wei Wei
 Weikun Xie
 Chengying Zhou
- 1School of Economics and Business Administration, Central China Normal University, Wuhan, China
- 2School of Economics, Nankai University, Tianjin, China
Economic Development Zones have been proven to be an economic success and have been pursued by many governments around the world over the past several decades, but there is still a research gap on their impact on the environment. This paper documents the effect of national-level EDZs on the environmental performance of firms. Combining rich firm and administrative data in China from 1998–2012, we exploit the relationship between the foundation of EDZs and firms’ pollution emissions with a multi-period differences-in-differences model. We find that the establishment of national EDZs can effectively reduce the pollution emission intensity of firms within it. Moreover, this pollution reduction effects vary across industries, firms, and EDZs types. We also find that the establishment of EDZs can improve firm environmental performance by improving energy efficiency, optimizing the business environment, and upgrading technology.
1 Introduction
Economic Development Zones (EDZs)—special economic areas aimed at fostering economic growth within a jurisdiction—play an important supporting role in economic growth. Like other place-based programs, EDZs aim to foster agglomeration economies, enhance employment, and attract technologically advanced industrial facilities. A number of studies have analyzed the effect of EDZs on economic growth, such as increasing the number of firms and employment (Cusimano et al., 2021: Givord et al., 2018; Zheng, 2021), improving firm productivity (Koster et al., 2019; Li et al., 2021) and industrial land use efficiency (Lu et al., 2020; Sun et al., 2020c), boosting innovation (Zheng and Li, 2020; Liu et al., 2022), fostering agglomeration economies (Wang et al., 2022) and attracting foreign capital (Delimatsis, 2021). Over the past 3 decades, China’s economy has grown at an impressive pace by means of various reforms and economic liberalization policies, and EDZs have been widely adopted as a key industrial policy and EDZs accounted for more than 60% of gross national industrial output value and more than 50% of GDP (Bao, 2013). However, economic expansion and spatial concentration have also brought serious environmental problems (Sun et al., 2020a). EDZs are also extensive consumers of natural resources and giant emitters of pollutants. Some literature thus documents the environmental effects of EDZs in recent years (Turgel et al., 2019; Zhuo et al., 2019; Hu and Zhou, 2020; Jiang et al., 2022). Yet, few efforts have been made to examine how EDZs affect the environmental performance of firms within EDZs. Against the background that environmental protection and sustainable development have become the world consensus, clarifying the relationship between EDZs and firms’ environmental performance has great policy relevance, which could help China to achieve high-quality development as well as provide replicable experience for other developing countries.
China provides an ideal laboratory for exploring the effects of EDZs on regions and firms, which is of great policy relevance. China built its first four EDZs in 1979 as an experiment policy guided by Deng Xiaoping’s principle of “crossing the river by feeling the stones.” After early success, China has gradually expanded EDZs polices from the coastal regions to the center and west in several waves over 4 decades. There are two main types of EDZs in China: national-level and provincial-level zones. The former is approved by the central government, while the latter are provincial government authorized. The national EDZs are given more policy priveliges and lead in innovation and economic growth; for instance, national-level EDZs accounted for about 23.2% of GDP and 23.5% of tax revenue in 2019 (China’s Ministry of Commerce, 2019; China’s Ministry of Science and Technology, 2019). A substantial literature has documented the influence of EDZs on regional environment, the main objective of this paper is to identify the impact of national-level EDZs policies on firms’ environmental performance and explore the mechanisms through which the effects work. Considering the larger number of provincial zones, we will also discuss the difference between provincial-level zones and national-level zones in the following sections. The insights in this paper could help.
Our studies are related to two strands of literature. In the first strand, most of the literature focuses on the economic effects of EDZs and explores them from different perspectives. Wang (2013) and Busso et al. (2013) found that EDZs increased foreign direct investment, wage income, and local employment. Hu et al. (2015) investigated firms that are the cornerstone of economic development, and found industrial agglomeration positively affects firm productivity. The spillover effect of EDZs on the total factor productivity of surrounding firms was found by Luo et al. (2015). Zheng et al. (2017) examined spillover effects from industrial parks and found industrial parks facilitated retail activity in the vicinity. Following land use data of electronic firms in Shanghai from 2003 to 2008, Huang et al. (2017) discovered the average output per unit of land of firms in EDZs was significantly higher than that outside EDZs. Employing the difference-in-difference method, Howell (2019) discovered that EDZs significantly improved firm productivity, while the degree of impact varied by EDZS types. Sun et al. (2020b) showed that the upgrading of EDZs increased the total consumption of urban residents. Kong et al. (2021) explored the relationship between high-tech zones (HTDZs) and innovation based on the data of listed firms. They found HTDZs devoted to the improvement of firm innovation. The above studies showed that EDZs have a certain economic effect in different aspects, which provided evidence support for the viewpoints of some scholars who deemed EDZs promoted regional development through some channels (Ambroziak, 2016; Xie et al., 2015).
The second strand of literature includes the recently emerging empirical studies on the effects of EDZs on the environment. In recent years, against the background of green development, some scholars considering the fact that firm economic performance is closely related to the environment had shifted their research focuses to the environmental effects of EDZs and found somewhat mixed results. Some studies found that EDZs were beneficial to the regional environment. Wagner and Timmins (2009) deemed the agglomeration effect, as one of the main advantages of EDZs, was conductive to reducing pollution. Qualitatively similar results were also found by Ali et al. (2017) and Effiong (2018). Wang and Wei (2019), supported by microdata, further held that EDZs mitigated local pollution levels. Wang and Feng (2021) found that EDZs were conducive to the common development of the economy and environment and their environmental effects were heterogeneous by using the spatial DID method based on the data of prefecture-level cities in China from 2013 to 2018. However, some scholars believed that EDZs may worsen the environment, and the possible reason is the negative externality of The agglomeration effect (Andersson and Lööf, 2011; Drucker and Feser, 2012). Wang and Nie (2016) verify this view by using data from Chinese micro-firms. Using the simultaneous equation model, Cheng (2016) claimed the agglomeration of the manufacturing industry aggravates environmental pollution. Hu and Zhou (2020) found that the negative effects of EDZs on the environment occurred in the short term. Additionally, a nonlinear relationship between industrial agglomeration and the environment was discovered by some papers. Wang and Wang (2019) confirmed different stages of industrial agglomeration had different impacts on the environment. Chen et al. (2020) also showed similar qualitative conclusions by adopting the spatial Dubin model.
The literature on EDZs has highlighted the positive externalities of EDZs on economic growth, but there were mixed results on environmental effects. Based on the fact that firms are the main body of pollution emissions and heterogeneity among firms, most of the conclusions drawn from macro data may cover the heterogeneity behavior of firms and thus lead to results bias. That is, the current environmental literature may not provide uncontroversial and precise advice for the country. Meanwhile, China is trying to build a new development pattern that benefits both the economy and the environment. The central government had promulgated many relevant policies to better stimulate the environmental effects of EDZs. For example, “Opinions of the General Office of the State Council on Promoting the Reform and Innovative Development of EDZs” issued by The State Council in 2017, requesting the layout and construction of EDZs must follow the environmental impact assessment system according to law. Therefore, it is lucrative for us to combine the above-mentioned two strands of literature and further assess the environmental effects of EDZs.
Against the backdrop of a relatively limited firm-level literature on the EDZs-environment nexus, this paper contributes to the existing literature by examining the causal effect of EDZs policy on firms’ pollution emission intensity. Using the panel data of more than 100 thousand firms from 1998 to 2012 and taking the foundation of national EDZs as a quasi-natural experiment, we use the multi-periods differences-in-differences (DID) method to examine the effects and check whether EDZs could enhance the environment performance of firms while promoting economic growth. To the best of our knowledge, this paper has been a first step toward understanding the impact of national-level EDZs on firms’ environmental performance. Compared with the existing research, the possible innovation and contribution of this paper are mainly reflected in the following three aspects: 1) this paper enriches the related research on the environmental effects of EDZs. Compared with previous studies using macro-level data, the micro-level data adopted in this paper could more efficiently reveal the channels and mechanism of EDZs’ impact on the environment, which can enhance the deep understanding of EDZs environment externality; 2) we improve the identification strategy used in previous literature (which generally relied on the inclusion of region or firm fixed effects and most were carried out at province or prefecture city level) by taking advantage of the variation in foundation time of EDZs at the county level. By adopting a more detailed county administrative code to identify firms within the EDZs, we get more accurate estimates. 3) In order to comprehensively measure firms’ environmental performance, we construct pollutants equivalents for firms, which included all kinds of pollutant instead of taking certain pollutants as a dependent variable.
The rest of this paper is arranged as follows. Background and Theoretical Hypothesis present background related to the development of EDZs and list the main hypothesis. Empirical Strategy introduces explains our data, estimation specification, econometric models, and variables. Empirical Results and Discussion present the empirical results and discusses them in relation. Conclusion concludes and put forwards policy suggestions.
2 Background and Theoretical Hypothesis
2.1 Background
China set up its first EDZs to explore new ways of economic development in 1979. Since then, various EDZs ware constructed in terms of the strategic layout of the state or local government. However, many places built EDZs blindly, and EDZs so induced failed to produce the desired effect. In order to improve the quality of EDZs, the General Office of the State Council issued “the Notice on Cleaning up and Rectifying Various Development Zones and Strengthening the Management of Construction Land” in 2003. The “Catalogue of China’s EDZs Review and Announcement (2006 Edition)” issued in 2007 symbolized the phased completion of the clean-up and rectification of EDZs. The State Council restarted the application process for upgrading province-level EDZs to national-level EDZs to mitigate the impact of the 2008 international financial crisis. There are several types of EDZs, such as Economic and technological development zones (ETDZs) and High-tech industrial development zones (HIDZs), in which the preferential policies have different focuses (Alder et al., 2016). For example, ETDZs main purpose is to attract foreign investment and import while HIDZs aimed to cultivate domestic innovative firms. ETDZs and HIDZs are the main types of EDZs. 230 national-level ETDZs and 168 national-level HIDZs had been established across the country by 2021.
As all developing economies experience, the growth of China’s economic development had inevitably brought pollution problems. China’s GDP grew at a remarkable speed while China’s industrial sulfur dioxide emissions remained at a high level from 1998 to 2012. Although overall emissions of sulfur dioxide are high, as shown in Figure 1, the pollution emission intensity of each province has decreased in varying degrees from 1998 to 2012. The possible reasons are that relevant environmental protection measures and industrial policies implemented by China, such as EDZs contributed to the pollution reduction as some of the literature showed. Moreover, Figure 1 shows the pollution levels of regional heterogeneity. The SO2 emission intensity of each province is obtained by calculating industrial SO2 emissions (tons)/total industrial output value (100 million yuan). The eastern, central, and western regions have different economic development levels while their pollution emission intensity also shows an obvious difference. The pollution emission intensity of the central and western regions has decreased more obviously.
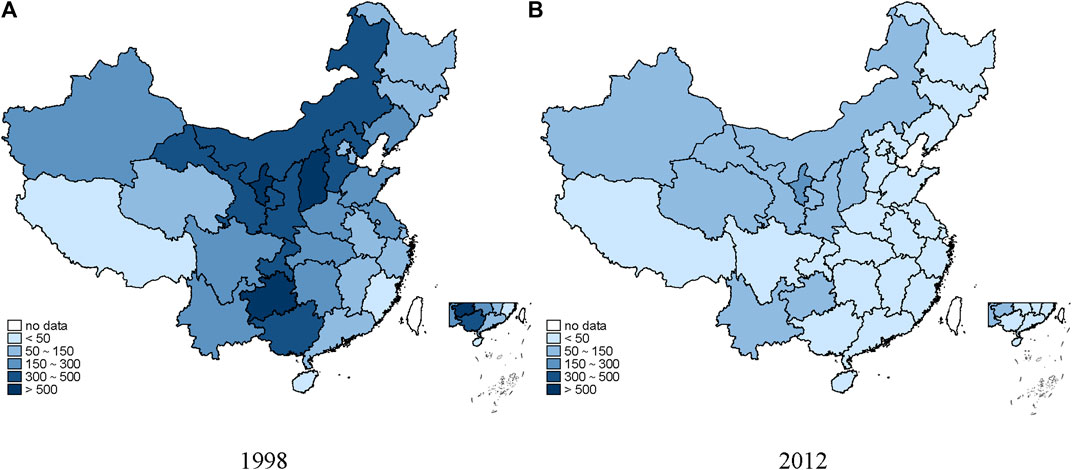
FIGURE 1. Emission intensity of SO2 of each province in 1998 and 2012.
EDZs-as an important engine of economic development-determine China’s environmental level to a certain extent. Figure 2 compares the pollution emissions of firms in EDZs and those in non-EDZs. In terms of the logarithm of emission intensity of SO2, COD, and pollution equivalent, the firms in the non-EDZs are more than twice as much as those in the EDZs. The difference in pollution equivalent between non-EDZs firms and EDZs firms is significant. Hence, that had given rise to crucial questions: How do EDZs affect firms’ environmental performance? Could EDZs improve firms’ environmental performance?
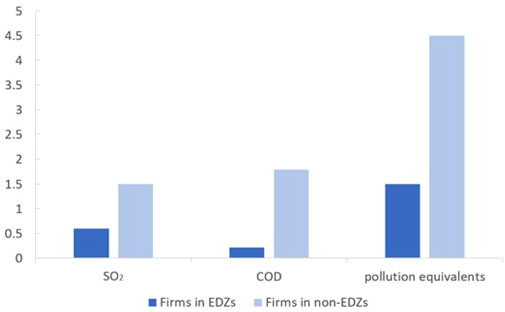
FIGURE 2. Differences between groups in the intensity of firms’ pollution emissions. Notes: The dashed lines represent the 95% confidence interval of the estimated effect.
2.2 Theoretical Hypothesis
In accordance with previous studies, policy effect, agglomeration effect, and supporting facilities in EDZs may affect the environmental performance of firms. From the perspective of policy effects, EDZs possess preferential policies which were mainly reflected in tax incentives, land use, and private property rights protection (Wang, 2013; Xi et al., 2021). For example, tax preference can help ease financing constraints of firms, increasing the scale of production and reducing emissions per unit of output (Andersen, 2016).
The agglomeration effect is another effect of EDZs. Agglomeration can affect the environmental performance of firms through various channels: 1) The formation of a circular economy in industrial agglomeration zones is beneficial to resource allocation and cost-saving, which enable firms to invest more funds in pollution abatement; 2) The precise matching between firms and employees in EDZs improves the production efficiency of firms and restrains the pollution emission of firms; 3) Technology sharing induced by specialized agglomeration and technological revolution caused by diversified agglomeration restrain firm emissions.
The supporting facilities of the EDZs also affect the environmental behavior of firms. On the one hand, the EDZs management committees restrain firm emissions by regulating firms’ environmental behavior. On the other hand, the complete supporting facilities in the zones reduce the operating cost of firms. For instance, the customs and industrial and commercial institutions in Shanghai Jiading High-tech Zone had greatly reduced the “sole cost” of firms, which mitigates firms’ pollution; the unified pollution treatment equipment in the EDZs can form the scale effect of pollution treatment, then reducing pollution emissions. Previous studies have confirmed the relation between institutional quality and energy efficiency (Sun et al., 2021), thus the EDZs with higher institutional quality may affect the environmental performance. Based on the above analysis, this paper proposes the following hypothesis:
Hypothesis 1. EDZs can affect firms’ environmental performance.Hypothesis 1 checks whether EDZs have an impact on firm environmental performance, and does not mention in detail how EDZs affect firm environmental performance. Therefore, this paper further discusses the mechanism channel related to EDZs affecting the pollution emission intensity of firms:First of all, the scale effect brought by EDZs affects the energy utilization efficiency of firms. The high concentration of industries in the zone intensifies the technology spillover among firms and helps firms to reduce production costs. Technology spillover may help firms to improve production know-how and optimize management structures, meanwhile, the improvement of productivity promotes firms to form economies of scale, improve energy efficiency and reduce pollution emissions (Cui et al., 2015; Wang and Wei, 2019). Second, EDZs affect the environment by optimizing the business environment. On the one hand, an improved business environment represents a higher level of rule of law. The improvement of the rule of law is conducive to the implementation of environmental laws and regulations, compelling firms to reduce pollution emissions. On the other hand, a good business environment represents clean government-firm relations. It reduces firms’ rent-seeking behaviors and the cost of rent-seeking accordingly (Shaheer et al., 2019). The cost reduction of firms encourages them to invest more funds in environmental protection construction. Finally, EDZs can enhance the innovation ability of firms, and thus improve their environmental performance. The clustering of similar industries in EDZs facilitates the sharing of green technology, finally leading to lower emissions. Moreover, the agglomeration of firms in different industries is conducive to the collision of technologies between fields which can induce the reform of green technologies. The improvement of firm technology level has improved firm environmental performance (Yi et al., 2022; Zhang et al., 2022). Based on the above analyses, this paper proposes another hypothesis:
Hypothesis 2. EDZs mitigate the intensity of pollution discharged by firms by improving energy efficiency, optimizing the business environment, and technological innovation.
3 Empirical Strategy
3.1 Data
The main data used in this study includes information on firm-level operation, firm-level environmental pollution, and city-level characteristics. To this end, we construct our unique dataset by merging three data sources manually. Firm-level production and financial information come from the Annual Survey of Industrial Firms (ASIF), which is maintained by the National Bureau of Statistics (NBS) of China. This is the most comprehensive firm-level dataset available in China, as it includes all state-owned firms (SOEs) and non-state-owned firms with annual sales above five million yuan (around US$600,000) from the period 1998–2012. It provides detailed information on each firm, such as name, location, and industry affiliation as well as most items of each firm’s operational information, such as age, fixed assets, and ownership (Liu et al., 2021). The second data source is the Environmental Survey and Reporting (ESR) administrated by the Ministry of Environmental Protection (or the former State Environmental Protection Administration). It is the most comprehensive and reliable environmental microeconomic database in China (Chen and Chen, 2019). The dataset contains firm information such as the legal person code, coal consumption, and pollution treatment equipment of the firms. In addition, COD, ammonia nitrogen, SO2, NOx, industrial smoke and dust, and solid waste emissions are also included in it. The third dataset we used comes from China Statistical Yearbooks and China Urban Statistical Yearbooks. These yearbooks provide city-level economic and social development information, such as GDP, employment, and area. EDZs information comes from the “China Economic Development Zone Review Announcement Catalogue (2018 Edition)” compiled by National Development and Reform Commission, Ministry of Land and Resources, Housing and Urban-rural Development, and the Ministry of Urban and Rural Development, including the code of the Economic Development Zone, the time of establishment and leading industries. There are 141 ETDZs and 88 HTDZs in our sample period.
The time interval for our sample is 1998–2012, which is the major wave of EDZs establishment. The EDZs provide a large number of preferential policies for firms and attract lots of firms to settle in. It provides a quasi-natural experiment for us to identify the impact of the national EDZs on firms’ environmental performance. Following Zhang et al. (2016), we use the name of the national EDZs to obtain the county-level administrative area code where the EDZ is located through the Baidu coordinate pick-up system. The code of the administrative area where it is located is matched to identify whether the firm is in the EDZs. The administrative area codes of firms and cities are collated using the 2003 annual administrative area codes published by the Ministry of Civil Affairs.
In order to construct firm-level panel data, we need to efficiently match these databases. We construct ASIF firm panel data using the name, identification number, industry, county, etc. (Brandt et al., 2012; Brandt et al., 2017). We clean the dataset according to the rules of generally accepted Accounting Principles: drop firms with fixed assets greater than total assets, current assets greater than total assets, and net fixed assets greater than total assets. Considering that firms with fewer than eight employees have poor accounting systems and are subject to different legal systems, we also exclude these samples. Then we link the ESR data to the ASIF firm panel data primarily by using the firm identification number. However, some observations in the ESR data have no or incorrect identification numbers. We change uppercase to lowercase or delimit the space in the number to improve the rate of matching by using the firm’s name and location. Finally, we merge the prefectures’ characteristics from the China City Statistical Yearbook to the panel. Industries in ASIF include mining, manufacturing, and utilities, while in this analysis we focus only on manufacturing firms.
Considering that Chinese industry codes and region codes have changed a lot during the sample period, we unify the 4-digit industry codes and 6-digit region codes into the 2003 standard issued by The National Bureau of Statistics of China and The Ministry of Civil Affairs of the People’s Republic of China, respectively.1 Ideally, we need spatial information of both firms and EDZs to identify the firms located in or outside the EDZs, and it is difficult to get all the spatial dimensions of EDZs. As an alternative, we match the firms and EDZs according to their 6-digit region codes. We obtain the county where the EDZ is located on the Baidu API system by the name of the EDZ2, which allows us to get the EDZs’ 6-digit region codes. The number of firms varies from more than 22,000 in 1998 to more than 56,000 in 2012 in our sample, spanning 30 provinces or province-equivalent municipalities and all 2-digits manufacturing industries, which ensure invaluable representation. To make nominal variables comparable over time, all gross values are deflated at constant 1998 prices index. In order to alleviate the possible distortion caused by extreme value, we, therefore, winsorize the continuous variables at the 1 top and bottom percentiles of their respective distributions.
3.2 Estimation Specification
Our analysis is based on the period from 1998–2012. Our objective is to estimate the effects of national EDZs on the environmental activities of firms. The key challenge of identifying any causal effects of EDZs is selecting appropriate control groups, given the possible presence of spillovers. This paper adopts a multi period DID analysis at the county level (the most disaggregated geographic unit of EDZs). We thus examine the difference between the change in environmental activities by firms in EDZs with better institutional policies because of the EDZs foundation (the treated group) and the corresponding change by firms in non- EDZs (the control group), conditional on a rich set of control variables including firm and region features. Beyond that, we investigate the robustness of the findings by checking parallel trends between targeted and control groups. Moreover, to examine any potential bias due to the self-selection effect that the national EDZs may have an entrance threshold for firms (such that only more productive and cleaner firms are allowed to operate in EDZs), we only retained firms built before the foundation of EDZs in the treated group and check whether the pollution reduction effect still holds. Specifically, we propose the following specification for our basic DID estimation:
where lnEIict is the pollution emission intensity of firm i in county c in year t; didct is a dummy variable, which takes a value of 1 if firm i belong to certain national EDZs in year t, and 0 otherwise. X includes a series of control variables reflecting firm, region, and industry characteristics, respectively. μi is the firm fixed effects, controlling for all time-invariant firm characteristics. It also controls for industrial and regional differences that do not vary over time but may affect the propensity of the industry to take up cleaner production technology. The year fixed effect is φt, controlling for all yearly shocks such as business cycles, technological progress, changes in the patenting system, etc., εict is the error term. To deal with the potential heteroskedasticity and serial autocorrelation, we cluster the standard errors at the firm level.
Dependent variable lnEIict takes log value of share of general pollutants equivalent over real gross output by firm i. In ESR data, there are two water pollution indicators: COD emission and ammonia nitrogen emission, and four air pollution indicators: SO2 emission, NOx emission, soot emission, and industrial dust emission. Due to the large differences in the degree of harmfulness of various pollutants to the environment, we calculated the general pollution equivalent that can better represent the overall pollution level of the firm. lnEIict is calculated by Eqs 2, 3 as follows:
where i, t, and j represent a firm, a year, and a kind of pollutant. Eijt is the firm i emission of pollutant j in year t, for which the unit is kilograms,
The main control variables used in the regression are as follows. Firm age (Age) is manually calculated after carefully processing the establishment time of the firm by taking into account the business status of the firm and the scale of the firm, since then. Firm size (lnSize) takes the log of the real capital stock of the firm which is calculated according to Brandt et al. (2012). Firm capital intensity (lnKI) takes the log of the ratio of the total actual fixed assets of the firm to the number of employees. Besides the above characteristics of the firms, we also introduce some region and industry variables. Regional economic development (lnGDP_pc) is the real GDP per capita of the city. Economic agglomeration (EG) is the ratio of the sum of the actual output value of the secondary and tertiary industries to the area of the city. Industry competition (HHI)is the Herfindahl index of the four-digit industry to which firm i belongs to. Industry openness (Ex_share) is the share of the number of export firms in the four-digit industry. The description and summary statistics of our key variables are presented in Table 1.
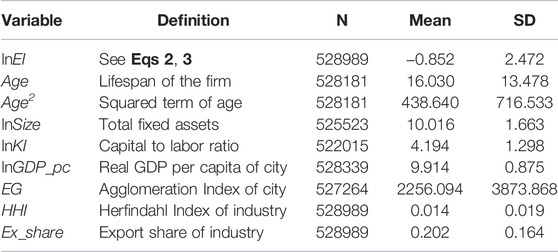
TABLE 1. Descriptive statistics of main variables.
4 Empirical Results and Discussion
4.1 Main Results
Table 2 reports the results across the different specifications, with different fixed effect structures as specified in the table. All estimations show that the foundation of national EDZs leads to a decline in the pollution emission intensity of firms. In Column (1), with only firm fixed effect and year fixed effect being controlled for, we find a statistically significant and negative estimate for our interest regressor did. The negative sign indicates that firms in EDZs undertake less pollution.
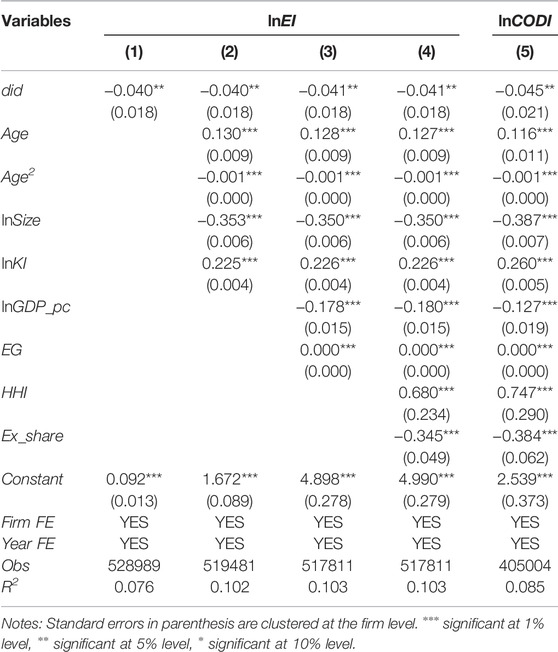
TABLE 2. Baseline results.
We start with a simple DID specification that includes only firm and year fixed effects in Column (1). Our regressor of interest, did, is negative and statistically significant, suggesting that the firm’s pollution emission intensity has declined after the establishment of the EDZs. In Column (2), we include several time-varying firm characteristics that may influence innovation activities, such as age, size, and capital-labor ratio. Evidently, the negative effect of EDZs policy on pollution emission intensity is very robust to these additional controls. As for the effects of the control variables, we find that firms having a larger size, or lower capital-labor ratio have less pollution intensity. Size could affect firms’ emissions in several ways: a larger size means the fixed costs of adopting cleaner emissions technology is less burdensome and a larger size also allows for an economy of scale effect with respect to emissions, which is consistent with the findings in the literature (e.g., Cui et al., 2015). Higher capital-labor ratio firms always belong to iron and steel, as well as the nonferrous metals industry in China, there, industries tend to produce more pollutants. Columns (3–4) further include the control variables at the industry level and city level. Our results are robust to these additional controls. Considering that our dependent variable is general pollutants equivalent and many previous studies focused on only one certain pollutant, we construct the COD emission intensity in Column (5) and we find EDZs could also effectively reduce COD emission intensity.
4.2 Robustness Checks
4.2.1 Parallel Trend Test
A key assumption of the DID estimator is that the pretreatment trends in the control and treated groups would be the same in the absence of any intervention. By plotting a set of estimated coefficients from the regression of pollution emission intensity on did along with all of the controls in Eq. 1, Figure 3 further shows the differences in pollution emission intensity changes between the treatment and control groups over time. It can be seen that before the establishment of the EDZs, there is no significant difference between firms in EDZs and the ones in non-EDZs, indicating a good comparability between our treated and control groups conditional on our selected controls. However, in the post-EDZs period, the treatment group experienced a gradual and persistent decline in pollution emission intensity compared with the control group, indicating that the foundation of national-level EDZs had a negative effect on firm pollution emission in the treatment group. Although the effect may be unstable at the early stage, the difference remains significant after the second post-EDZs period.
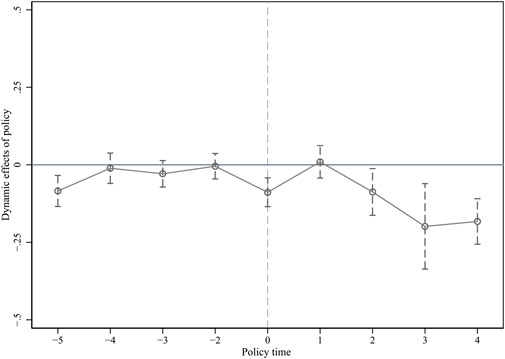
FIGURE 3. Parallel trend test.
4.2.2 Placebo Test
To exclude the possibility that the cleaner firms are selected for in EDZs thus giving the impression that EDZs could reduce pollution emission intensity, we carry out a randomization test as a further robustness check. We randomly select some firms to be affected by the EDZs and repeat the exercise 1,000 times (Zhou et al., 2018), we can obtain 1,000 estimators of the impact of the establishment of EDZs on firms’ pollution emission intensity. Given the random generating process of the data, this false did is expected to have no effects; otherwise, it may indicate the misspecification of Eq. 1. The 1,000 coefficients and p-values are reported in Figure 4. Evidently, the estimators are around 0 which is far from our benchmark estimate of −0.041 and most of the p-values are greater than 0.1, leading further support to the validity of our research design. Our benchmark estimates are not contaminated by any rare events but are robust.
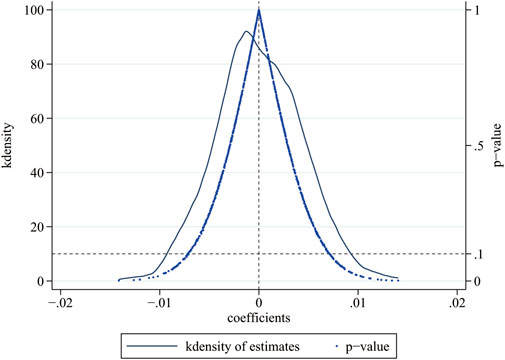
FIGURE 4. Placebo test.
4.2.3 Alternative Specifications
In our benchmark analysis, we adopt firm fixed effect to control for all time-invariant characteristics of firms and year fixed effect to control for all yearly shocks common to all industries. For robustness, we adopt alternative specifications with more fixed effects and cluster standard error at the industry level. In Column (1) of Table 3, to alleviate concern that firms within the same industry may be correlated as they are affected by the same industrial policies, we adopt cluster standard error at the industry level instead of the firm level. Column (2) of Table 3 reports the results after including 2-digit industry-year fixed effects which could control for any industry-specific pollution trends. Following Wu et al. (2020), we further utilize industry-year fixed effects, city-year fixed effects, and industry-county fixed effects as reported in Column (3) of Table 3. The results in Columns (1–3) show that coefficients of interest remain negative and significant, further demonstrating the robustness of our results.
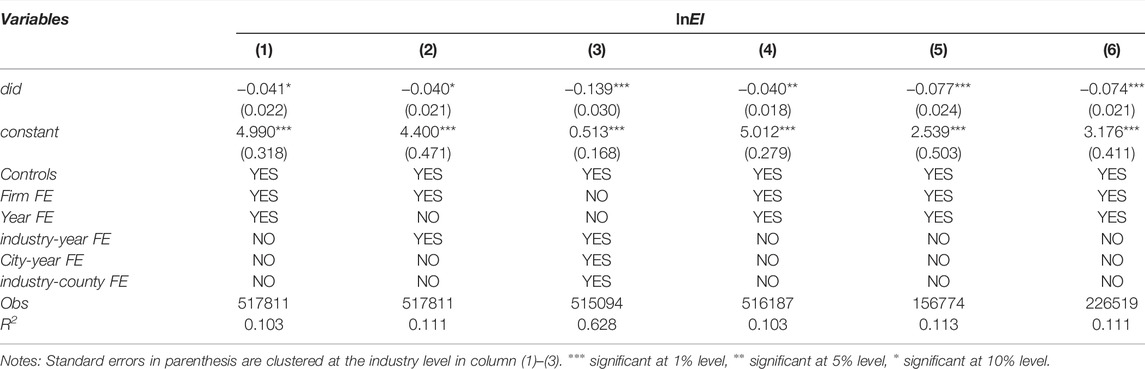
TABLE 3. Robustness test results: alternative specifications and PSM-DID.
4.2.4 PSM-DID
The possible correlation between the treatment status (did) and the error term (εict) means that our treated and control groups are not comparable. For example, the selection of which firms could operate in EDZs is not random; hence, the firms in EDZs and the firms outside EDZs could have been experiencing different trends before the foundation of EDZs, and these differences might have generated differential trends in our outcomes across the two types of firms in the post-EDZs period. To alleviate this identification concern, we have controlled for time-varying firm characteristics to balance firms in different groups, here we further employ a propensity score matching (PSM) technique developed by Rosenbaum and Rubin (1983) to better ensure comparability between treated and control groups. Considering the fact that estimation results may vary due to the difference in matching method, we, respectively apply the kernel matching, one-to-one proximity matching, and one-to-two proximity matching year by year to obtain a suitable control group. The coefficients for did are still significantly negative in all three matching methods as shown in Columns (4–6) of Table 3, indicating again that the main results are robust.
4.2.5 Exclusion of Other Policies
If there exist any policy reforms introduced in China around the sample period which may affect our treated and control groups differently, then the effects of those policy reforms may also be captured in the DID estimates. One important policy shock is the entry of China into the WTO in 2001. Since then, the trade tariffs that China faced have dropped significantly, which may stimulate the export of firms in the EDZs as many EDZs also are export processing zones (Lu et al., 2019). Much literature has documented that export could improve firms’ environmental performance (Holladay, 2016; Forslid et al., 2018), the results in baseline regression may be affected by WTO entry. In addition, the reform of State-owned firms started in the 1980s and accelerated in the early 2000s. The SOE reform leads to large-scale privatization, close-down of small SOEs, and an improvement in the efficiency of surviving (large) SOEs. These ownership reforms may affect firms’ environmental performance. We include the 3-digit industry-level tariff variable and the share of the output value of SOEs in the 3-digit industry in our DID estimation, to control any possible effects arising from these two policies. The estimated results are shown in Table 4. Column (1) adds tariff variables, and Column (2) adds the share of state-owned firms’ output value. The regression results show that the coefficients of did are all significantly negative at the 5% level. In Column (3), we add the tariff variables and the share of state-owned firm output value at the same time. The coefficient of did is still significant at the 5% level.
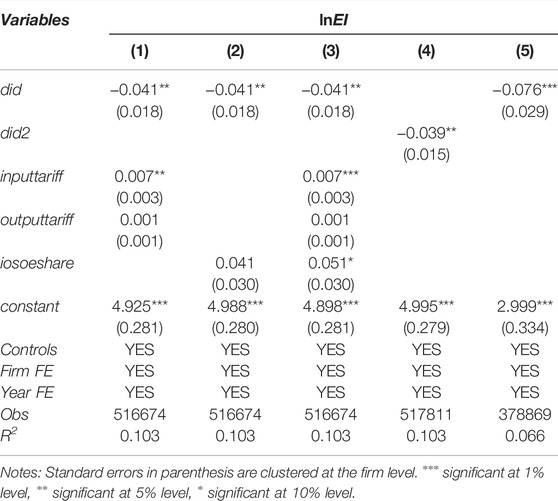
TABLE 4. Other robustness checks.
4.2.6 The Number of EDZs
In baseline specification, we take did as 1 if there is any EDZ in one county, while some counties actually have more than one EDZ. Compared with one county with one zone, one county with multiple zones is not only more common in regional development but also plays a significant role in the creation of a more complete economic environment. At present, there are few studies on whether the number of EDZs has an impact on the firm’s pollution discharge behavior. We establish the following regression model to examine the effect:
We construct did2ct, using the number of national-level EDZs in county c in year t. The estimate in Column (4) of Table 4 shows that did2 is significantly negative at the 5% level. For each additional EDZ, the pollution emission intensity of firms in the zone decreases by 3.9%. It can be seen that more EDZs could have a greater impact on firm environmental performance.
4.2.7 Sample Period
In the main analysis, we conduct empirical analysis based on data from 1998 to 2012. A related fact is that a relatively few national EDZs were built in 1998–2009 and most ones were founded in 2010–2012. We have reason to suspect that the pollution emission intensity reduction effect in the basic regression is mainly driven by the EDZs established after 2009. To address this concern, we use Chinese firm-level data from 1998 to 2009 to rerun regression. The regression results are reported in Column (5) in Table 4 which indicates that EDZs established in any period can effectively reduce the pollution emissions intensity of firms within it, suggesting that our findings are not driven by a particular sample period.
4.3 Heterogeneity Analysis
Our aforementioned analysis documents a negative impact of national-level EDZs on firm pollution emission intensity. However, studies in the literature also find that many industrial agglomerated areas or industrial parks may deteriorate the environment, including the deterioration of water quality, the increase in pollution emissions, and the decrease of eco-efficiency in the surrounding areas (Wang and Nie, 2016; Wang and Wei, 2019). Andersson and Lööf (2011) claim it may be caused by the negative externality of the agglomeration effect.
EDZs may pose threats to the local environment due to intensive resource consumption and waste emission. To gain a further understanding of our findings, we examine the treatment heterogeneity across firms and EDZs types to shed light on the relevance.
4.3.1 Firm Heterogeneity
Firms are heterogeneous in many dimensions, and so is environmental performance. We explore the possible heterogeneous effects of national EDZs on the pollution emission intensity of firms by firms’ ownership and scale. These results are reported in Table 5. In terms of ownership structure, two major types of firms primarily exist in China: SOEs and Non-SOEs. Determining whether firms with different ownership structures have different responses to national EDZs would be an interesting exercise since ownership issues are very important topics in transmission countries like China. We find that EDZs have a significant impact on the pollution emission intensity of SOEs [Column (1)], but not on Non-SOEs [Column (2)]. The possible reason is that SOEs possess more capital and undertake more social responsibility for environmental protection compared with Non-SOEs (Liang and Langbein, 2021). We also examine the heterogeneity of firm scale. Due to the large number of Non-SOEs in EDZs and the insignificant influence of EDZs on Non-SOEs, we only discuss the scale heterogeneity of Non-SOEs. We split Non-SOEs into large/medium firms and small ones according to the “Notice on the Issuance of the Classification Standards for Small and Medium-sized Enterprises” issued by the National Bureau of Statistics (NBS) of China, then rerun the regression in these two groups separately. The regression results show EDZs significantly reduce the pollution emission intensity of large and medium firms [Column (3)], but do not yield a significant impact on the small group as shown in Column (4), which is consistent with the view proposed by Li et al. (2021). This heterogeneity could stem from the difference in financial resources and organizational resources. Compared to small firms, large firms are easier to recruit new hires and raise capital (Meulenaere et al., 2021). As a result, large firms have extra resources to innovate (Balasubramanian et al., 2021) and these innovations could mitigate pollution emissions.
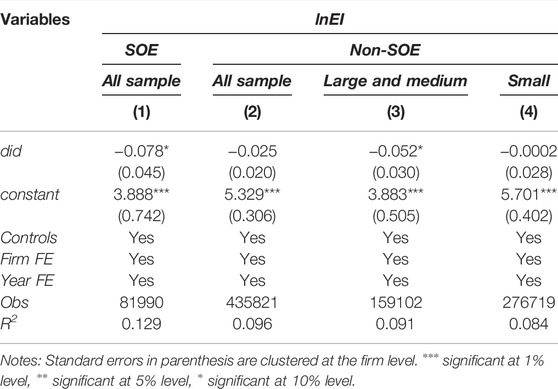
TABLE 5. Firm heterogeneity.
4.3.2 Industry Heterogeneity
The fact that industries differ in many dimensions has been demonstrated by existing literature. It is natural to infer that the effect of EDZs may vary across the industry due to the difference in production factor input and utilization efficiency. In addition, the stringency of the environmental regulations in EDZs may vary across industries. EDZs Management Committees always favor industries with stronger innovation ability or higher added value. Thereby, industries with high-tech intensity better enjoy the preferential policies of the EDZs and more easily realize the transformation and upgrading through technology sharing and innovation spillover. We divide industries into high-tech, mid-tech, and low-tech intensive industries according to the OECD standard4 to examine the heterogeneous environmental responses of firms within different industries. The estimation results reported in Columns (1–3) of Table 6 suggest that firms in high-tech and mid-tech intensive industries experience a significant improvement in environmental performance, especially those in high-tech intensive industries. We also find EDZs tend to worsen the environmental performance of firms in low-tech intensive industries. The possible reason may be that it is difficult for low-tech firms to absorb the agglomeration externality in EDZs.
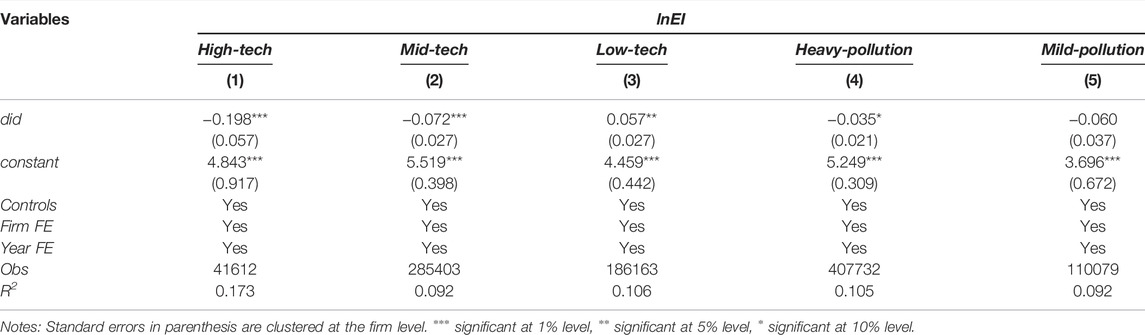
TABLE 6. Industry heterogeneity analysis.
To further check if the effects vary across industries with different pollution intensities, we estimate the environmental performance of heavy polluting firms and others respectively. The classification of polluting firms is subject to The Guidelines on Environmental Information Disclosure of Listed Companies issued by the Ministry of Ecology and Environmental in 2010. The regression results are shown in Columns (4–5) of Table 6. The regression results indicate that EDZs have a more significant impact on the environmental performance of firms in heavy pollution industries. The possible reason is that EDZs Management Committee pays more attention to emissions from heavy-polluting firms which consequently spend more resources to cut emissions.
4.3.3 EDZs Types
As introduced before, there are two main EDZs: national-level and provincial-level. They are approved by the central government and provincial government separately and the former is endowed with more privileged policies. The number of provincial-level EDZs is much larger than national-level ones. Geographically, national and provincial EDZs are mutually exclusive-a location cannot be both a provincial and a national EDZs at the same time, however, provincial-level EDZs could be upgraded to national-level EDZs if certain relevant standards are met. The largest upgrade is 87 in 2010 followed by 57 in 2012. To further account for the possible impact difference of EDZs level on firms’ environmental performance, we take the firms in the provincial-level EDZs before upgrading, the provincial-level EDZs without upgrading, the provincial-level EDZs and the national-level EDZs as the treatment group separately, and the firms outside the EDZs as the control group. Three regression results are reported in Columns (1–4) of Table 7. The core explanatory variables did is not significant while in Column (4) it is significantly negative, which demonstrates that the pollution emission intensity reduction effect mainly occurs in national-level EDZs. National-level EDZs tend to benefit from more preferential policies and better infrastructure. In contrast, the construction requirements of provincial-level EDZs are often lower and most of their policy support coming from provincial departments is also lower. Therefore, only the establishment of national-level EDZs begets good environmental performance. This finding suggests that the policy and operation quality of EDZs are important in achieving pollution reduction effects.
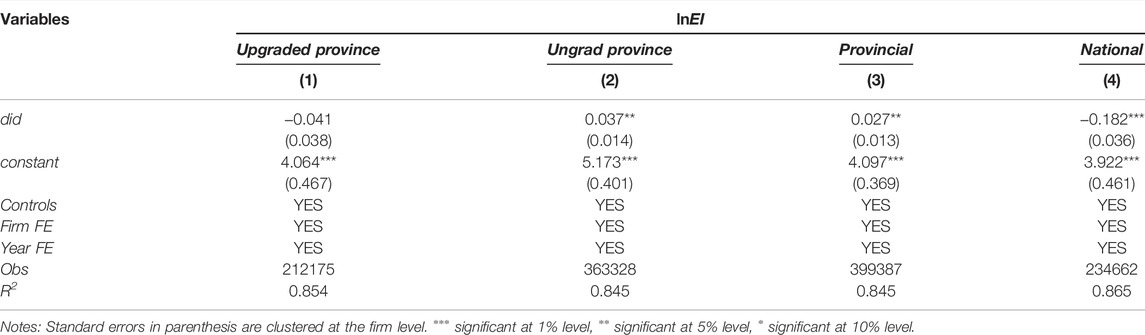
TABLE 7. EDZs types.
4.4 Mechanism
The previous section establishes that EDZs have a significant negative impact on the pollution emission intensity of firms, and this result is supported by a series of robust checks. In this section, we extend our discussion to investigate the possible mechanisms by which the EDZs affect firms’ environmental performance.
4.4.1 Energy Efficiency
As China is abundant in coal reservations, coal is not only the main fuel for China’s industrial production but also an important source of SO2 and other pollutants. Thus, energy efficiency plays an important role in energy conservation and pollution control. Due to the technology spillovers caused by agglomeration externality within the EDZs, the EDZs policy may reduce pollution emission intensity by improving firms’ energy efficiency. To verify that this is indeed the case, we further take the ratio of the firms’ real gross output to fuel coal consumption as the proxy variable of energy efficiency (EE) and estimate the following model:
Column (1) in Table 8 reports a result of interest regarding explanatory variable did. In line with our expectations, its coefficient is positive and statistically significant at 10% which suggests that energy efficiency experienced a 4.3% increase after EDZs’ foundation. This tends to confirm that firms within EDZs are much more energy-efficient than their counterpart outside the EDZs, which also verifies Hypothesis 2. That result is of positive policy reference for China’s regional governments which is seeking the balance of keeping economic growth and controlling carbon emission.
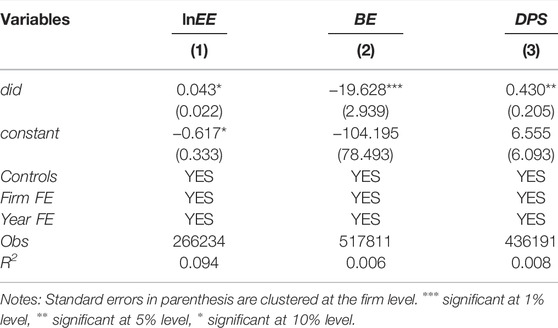
TABLE 8. Mechanism analysis.
4.4.2 Business Environment
Attracting high-quality firms is a prerequisite for achieving the development goals of EDZs, and the business environment is a key factor in determining whether EDZs can attract high-quality firms. The EDZs enjoy a certain degree of independence and have the authority to define, within limits, their own preferential policies. These policies usually include tax deductions and customs duty exemptions, discounted land-use fees, special treatment in securing bank loans, and efficient administrative service (Alder et al., 2016; Lu et al., 2019) which could provide a better business environment. A better business environment will significantly reduce the cost of rent-seeking for firms and make them focus more on their own development. Additionally, the optimization of the business environment will facilitate firms to reduce pollution emissions by solving the externality problem of technological innovation. We use the degree of comprehensive tax distortion to measure the regional business environment (BE) according to Mao and Wang (2020). The results reported in Column (2) of Table 8 show that the coefficient of did remains statistically significant, which indicates that the EDZs have significantly optimized the business environment faced by firms within EDZs.
4.4.3 Innovation Ability
Improvement of firms’ technology innovation ability will lead to the decrease of pollution emission per unit output value, as well as an enhancement of the terminal pollution control capability, which can induce the improvement of firms’ environmental performance (Wang and Xie, 2014). Moreover, compared with neutral technological progress, biased technological progress has a greater impact on the environmental performance of local firms. The establishment of EDZs may promote regional technology spillover through the agglomeration effect. To verify this hypothesized channel, we use the sum of numbers of utility patents, invention patents, and design patents as the proxy variables of innovation ability. As shown in Column (3) of Table 8, we observe that the establishment of EDZs induces a significant increase in the total number of patents, that is, the channel of firms’ innovation ability is confirmed.
5 Conclusion
Place-based policies are a popular type of development policy in both developed and developing country contexts. China’s EDZs programs have demonstrated a magnificent effect on the economic growth of targeted areas (Howell, 2019). By adopting the establishment of EDZs as a policy shock, this paper exploits the impact of China’s EDZs on firms’ pollution emission intensity. Given the large number of developing countries implementing similar zone programs and popular environmental concerns, the findings of this paper have important implications for policy and the design of more effective EDZs which aim at higher but cleaner production.
In applying the multi-period DID method, the benchmark estimates of this paper indicate that the establishment of EDZs has significantly reduced firms’ pollution emission intensity compared with those located outside EDZs. After a series of robustness tests, the results still held. We also found that EDZs’ pollution reduction effect varies across industry, ownership, and types of EDZs. The reduction effect is more obvious in high-tech intensive industries while is not significant in low-tech industries. Compared with non-state-owned firms, the magnitude of the reduction effect is larger for state-owned ones. The improvement of firms’ environmental performance mainly occurs in national-level EDZs while the effect of provincial-level EDZs is not significant. Another important finding is that there are several ways through which EDZs affect firms’ pollution emission intensity. According to our results, EDZs mainly reduce pollution emission intensity by improving energy efficiency, optimizing the business environment in parks, and promoting firms’ innovation ability.
This study has been a first step toward understanding the micro-foundations of the impact of EDZs policies on the environment in developing countries. The policy implications in this paper are in the following areas. First of all, the establishment of national-level EDZs has a significant pollution intensity reduction effect and provides meaningful practice for achieving economic development achievements without sacrificing the environment. Other level EDZs can take more valuable lessons from national-level ones. On the other hand, there is a lack of a one-size-fits-all solution because of the presence of strong heterogeneity among industries, firms, and types of EDZs. Thus, formulating an effective EDZs policy requires paying close attention to the circumstances.
Data Availability Statement
The raw data supporting the conclusion of this article will be made available by the authors, without undue reservation.
Author Contributions
WW: handled the theme and research direction, collected data, provided model building guidance, and helped with manuscript modification. WX: was responsible for theoretical analysis, and wrote the manuscript. CZ: collected and constructed panel data, built model, and wrote the manuscript.
Funding
Acknowledges financial support from the National Social-Science Foundation of China (21BJL063).
Conflict of Interest
The authors declare that the research was conducted in the absence of any commercial or financial relationships that could be construed as a potential conflict of interest.
Publisher’s Note
All claims expressed in this article are solely those of the authors and do not necessarily represent those of their affiliated organizations, or those of the publisher, the editors and the reviewers. Any product that may be evaluated in this article, or claim that may be made by its manufacturer, is not guaranteed or endorsed by the publisher.
Acknowledgments
Thanks to participants at the third China Energy Environment and Climate Change Economists Seminar and the Wuhan Young Economist Society for many helpful comments. All errors remain our own.
Footnotes
1http://www.mca.gov.cn/article/sj/xzqh/1980/201507/20150715854904.shtml
3http://www.mee.gov.cn/ywgz/fgbz/gz/200302/t20030228_86250.shtml
4ISIC REV.3 technology intensity definition: classification of manufacturing industries into categories based on R&D intensities, Economic Analysis and Statistics Division, OECD, 2011.
References
Alder, S., Shao, L., and Zilibotti, F. (2016). Economic reforms and industrial policy in a panel of Chinese cities. J. Econ. GrowthBost. 21 (4), 305–349. doi:10.1007/s10887-016-9131-x
Ali, H. S., Abdulrahim, A., and Ribadu, M. B. (2017). Urbanization and carbon dioxide emissions in Singapore: Evidence from the ARDL approach. Environ. Sci. Pollut. Res. 24 (2), 1967–1974. doi:10.1007/s11356-016-7935-z
Ambroziak, A. A. (2016). Income tax exemption as a regional state aid in special economic zones and its impact upon development of polish districts. oc. 7 (2), 245. doi:10.12775/OeC.2016.015
Andersen, D. C. (2016). Credit constraints, technology upgrading, and the environment. J. Assoc. Environ. Resour. Econ. 3 (2), 283–319. doi:10.1086/684509
Andersson, M., and Lööf, H. (2011). Agglomeration and productivity: Evidence from firm-level data. Ann. Reg. Sci. 46 (3), 601–620. doi:10.1007/s00168-009-0352-1
Balasubramanian, S., Shukla, V., Mangla, S., and Chanchaichujit, J. (2021). Do firm characteristics affect environmental sustainability? A literature review‐based assessment. Bus. Strategy Environ. 30 (2), 1389–1416. doi:10.1002/bse.2692
Bao, X. (2013). Exploring a road to ecological transformation for industrial parks. Beijing, China: Economic Daily. The Economic Daily Press Group.
Brandt, L., Biesebroeck, J. V., and Zhang, Y. (2012). Creative accounting or creative destruction? Firm-level productivity G.00rowth in Chinese manufacturing. J. Dev. Econ. 97 (2), 339–351. doi:10.1016/j.jdeveco.2011.02.002
Brandt, L., Van Biesebroeck, J., Wang, L., and Zhang, Y. (2017). WTO accession and performance of Chinese manufacturing firms. Am. Econ. Rev. 107, 2784–2820. doi:10.1257/aer.20121266
Busso, M., Gregory, J., and Kline, P. (2013). Assessing the incidence and efficiency of a prominent place based policy. Am. Econ. Rev. 103, 897–947. doi:10.1257/aer.103.2.897
Chen, C., Sun, Y., Lan, Q., and Feng, J. (2020). Impacts of industrial agglomeration on pollution and ecological efficiency-A spatial econometric analysis based on a big panel dataset of China’s 259 cities. J. Clean. Prod. 258, 120721. doi:10.1016/j.jclepro.2020.120721
Chen, Z., and Chen, Q. (2019). Energy efficiency of Chinese firms: Heterogeneity, influencing factors and policy implications. Chi. Ind. Econ. 12, 78–82. (In Chinese). doi:10.19581/j.cnki.ciejournal.2019.12.005
Cheng, Z. H. (2016). The spatial correlation and interaction between manufacturing agglomeration and environmental pollution. Ecol. Indic. 61, 1024–1032. doi:10.1016/j.ecolind.2015.10.060
China’s Ministry of Commerce (2019). Available at: http://ezone.mofcom.gov.cn/article/n/202007/20200702987161.shtml.
China’s Ministry of Science and Technology, (2019). Available at: http://www.gov.cn/xinwen/2020-07/24/content_5529638.htm.
Cui, J., Lapan, H., and Moschini, G. C. (2015). Productivity, export, and environmental performance: Air pollutants in the United States. Am. J. Agric. Econ. 98 (2), 447–467. doi:10.1093/ajae/aav066
Cusimano, A., Mazzola, F., and Barde, S. (2021). Place-based policy in southern Italy: Evidence from a dose–response approach. Reg. Stud. 55 (8), 1–17. doi:10.1080/00343404.2021.1902974
Delimatsis, P. (2021). Financial services trade in special economic zones. J. Int. Econ. Law. 24 (2), 277–297. doi:10.1093/jiel/jgab023
Drucker, J., and Feser, E. (2012). Regional industrial structure and agglomeration economies: An analysis of productivity in three manufacturing industries. Reg. Sci. Urban Econ. 42 (1–2), 1–14. doi:10.1016/j.regsciurbeco.2011.04.006
Effiong, E. L. (2018). On the urbanization-pollution nexus in africa: A semiparametric analysis. Qual. Quant. 52 (1), 445–456. doi:10.1007/s11135-017-0477-8
Forslid, R., Okubo, T., and Ulltveit-Moe, K. H. (2018). Why are firms that export cleaner? International trade, abatement and environmental emissions. J. Environ. Econ. Manage. 91 (c), 166–183. doi:10.1016/j.jeem.2018.07.006
Givord, P., Quantin, S., and Trevien, C. (2018). A long-term evaluation of the first generation of French urban enterprise zones. J. Urban Econ. 105, 149–161. doi:10.1016/j.jue.2017.09.004
Holladay, J. S. (2016). Exporters and the environment. Can. J. Economics/Revue Can. d'economique. 49 (1), 147–172. doi:10.1111/caje.12193
Howell, A. (2019). Heterogeneous impacts of China’s economic and development zone program. J. Reg. Sci. 59 (5), 797–818. doi:10.1111/jors.12465
Hu, C., Xu, Z., and Yashiro, N. (2015). Agglomeration and productivity in China: Firm level evidence. China Econ. Rev. 33, 50–66. doi:10.1016/j.chieco.2015.01.001
Hu, Q., and Zhou, Y. (2020). Environmental effects of industrial agglomeration in development zones: Aggravating pollution or promoting governance? Chin. Popul. Resour. Environ. 10, 64–72. (In Chinese). doi:10.12062/cpre.20200639
Huang, Z., He, C., and Zhu, S. (2017). Do China’s economic development zones improve land use efficiency? The effects of selection, factor Accumulation and agglomeration. Landsc. Urban Plan. 162, 145–156. doi:10.1016/j.landurbplan.2017.02.008
Jiang, W., Cao, K., Jin, L., Cheng, Y., and Xu, Q. (2022). How do China’s development zones affect environmental pollution under government domination. Sustainability 14 (7), 3790. doi:10.3390/su14073790
Kong, Q., Li, R., Peng, D., and Wong, Z. (2021). High-technology development zones and innovation in knowledge-intensive service firms: Evidence from Chinese A-share listed firms. Int. Rev. Financial Analysis 78, 101883. doi:10.1016/j.irfa.2021.101883
Koster, H. R. A., Cheng, F., Gerritse, M., and van Oort, F. G. (2019). Place-based policies, firm productivity, and displacement effects: Evidence from shenzhen, China. J. Reg. Sci. 59 (2), 187–213. doi:10.1111/jors.12415
Li, F., Xu, X., Li, Z., Du, P., and Ye, J. (2021). Can low-carbon technological innovation truly improve enterprise performance? The case of Chinese manufacturing Companies. J. Clean. Prod. 293, 125949. doi:10.1016/j.jclepro.2021.125949
Li, X. Y., Wu, X. J., and Tan, Y. (2021). Impact of special economic zones on firm performance. Res. Int. Bus. Finance 58, 101463. doi:10.1016/j.ribaf.2021.101463
Liang, J., and Langbein, L. (2021). Are state-owned Enterprises good citizens in environmental governance? Evidence from the control of air pollution in China. Adm. Soc. 53 (8), 009539972110058. doi:10.1177/00953997211005833
Liu, Q., Lu, R., Lu, Y., and Luong, T. A. (2021). Import competition and firm innovation: Evidence from China. J. Dev. Econ. 151, 102650. doi:10.1016/j.jdeveco.2021.102650
Liu, X., Zhang, J., Liu, T. H., and Zhang, X. J. (2022). Can the special economic zones promote the green technology innovation of Enterprises? An evidence from China. Front. Environ. Sci. 10, 870019. doi:10.3389/fenvs.2022.870019
Lu, X. H., Chen, D. L., Kuang, B., Zhang, C. Z., and Cheng, C. (2020). Is high-tech zone a policy trap or a growth drive? Insights from the perspective of urban land use efficiency. Land Use Policy 95, 104583. doi:10.1016/j.landusepol.2020.104583
Lu, Y., Wang, J., and Zhu, L. (2019). Place-based policies, creation, and agglomeration economies: Evidence from China’s economic zone program. Am. Econ. J. Econ. Policy 11 (3), 325–360. doi:10.1257/pol.20160272
Luo, D., Liu, Y., Wu, Y., Zhu, X., and Jin, X. (2015). Does development zone have spillover effect in China? J. Asia Pac. Econ. 20 (3), 489–516. doi:10.1080/13547860.2015.1054171
Mao, Q., and Wang, F. (2020). Institutional environment, technical sophistication and asymmetric spatial spillovers across industries. Chin. Ind. Econ. 05, 118–136. (In Chinese). doi:10.19581/j.cnki.ciejournal.2020.05.018
Meulenaere, K. D., Winne, S. D., Marescaux, E., and Vanormelingen, S. (2021). The role of firm size and knowledge intensity in the performance effects of collective turnover. J. Manag. 47 (4), 993–1023. doi:10.1177/0149206319880957
Rosenbaum, P. R., and Rubin, D. B. (1983). The central role of the propensity score in observational studies for causal effects. Biometrika 70 (1), 41–55. doi:10.1093/biomet/70.1.41
Shaheer, N., Yi, J., Li, S., and Chen, L. (2019). State-owned Enterprises as bribe payers: The role of institutional environment. J. Bus. Ethics 159 (1), 221–238. doi:10.1007/s10551-017-3768-z
Sun, H., Edziah, B. K., Sun, C., and Kporsu, A. K. (2021). Institutional quality and its spatial spillover effects on energy efficiency. Socioecon. Plann. Sci. 101023. doi:10.1016/j.seps.2021.101023
Sun, H., Samuel, C. A., Amissah, J. C. K., Taghizadeh-Hesary, F., and Mensah, I. A. (2020a). Non-linear nexus between CO2 emissions and economic growth: A comparison of OECD and B&R countries. Energy 212, 118637. doi:10.1016/j.energy.2020.118637
Sun, W., Wu, J., and Zheng, S. (2020b). The consumption-driven effect of place-based industrial policy: An empirical study based on development zone policy. Soc. Sci. China 41 (4), 44–62. doi:10.1080/02529203.2020.1844427
Sun, Y., Ma, A., Su, H., Su, S., Chen, F., Wang, W., et al. (2020c). Does the establishment of development zones really improve industrial land use efficiency? Implications for China’s high-quality development policy. Land Use Policy 90, 104265. doi:10.1016/j.landusepol.2019.104265
Turgel, I., Bozhko, L., Pracheva, E., and Naizabekov, A. (2019). Impact of zones with special status on the environment (experience of Russia and Kazakhstan). Environ. Clim. Technol. 23 (2), 102–113. doi:10.2478/rtuect-2019-0058
Wagner, U. J., and Timmins, C. D. (2009). Agglomeration effects in foreign direct investment and the pollution haven hypothesis. Environ. Resour. Econ. (Dordr). 43 (2), 231–256. doi:10.1007/s10640-008-9236-6
Wang, B., and Nie, X. (2016). Industrial agglomeration and environmental governance: The power or resistance-evidence from A quasi-natural experiment of establishment of the development zone. Chin. Ind. Econ. 12, 77–91. (In Chinese). doi:10.19581/j.cnki.ciejournal.2016.12.006
Wang, J. (2013). The economic impact of special economic zones: Evidence from Chinese municipalities. J. Dev. Econ. 101, 133–147. doi:10.1016/j.jdeveco.2012.10.009
Wang, J., and Wei, Y. D. (2019). Agglomeration, environmental policies and surface water quality in China: A study based on a quasi-natural experiment. Sustainability 11 (19), 5394. doi:10.3390/su11195394
Wang, P., and Xie, L. (2014). Pollution control investment, enterprise technological innovation and pollution control efficiency. Chin. Popul. Resour. Environ. 24 (09), 51–58. (In Chinese). doi:10.3969/j.issn.1002-2104.2014.09.008
Wang, X., and Feng, Y. (2021). The effects of national high-tech industrial development zones on economic development and environmental pollution in China during 2003–2018. Environ. Sci. Pollut. Res. 28 (1), 1097–1107. doi:10.1007/s11356-020-10553-1
Wang, Y., and Wang, J. (2019). Does Industrial Agglomeration Facilitate Environmental Performance: New Evidencefrom Urban China?. J. Environ. Manage. 248, 109244. doi:10.1016/j.jenvman.2019.07.015
Wang, Z., Wang, S., Wang, J., and Wang, Y. (2022). Development zones and urban economic performance in China: Direct impact and channel effects. Growth Change. doi:10.1111/grow.12621
Wu, W. X., Hong, C., and Muhammad, A. (2020). The spillover effect of export processing zones. China Econ. Rev. 63, 101478. doi:10.1016/j.chieco.2020.101478
Xi, Q. M., Sun, R. D., and Mei, L. (2021). The impact of special economic zones on producer services productivity: Evidence from China. China Econ. Rev. 65, 101558. doi:10.1016/j.chieco.2020.101558
Xie, L., Pumain, D., and Swerts, E. (2015). Economic development zones and urban growth in China. Cybergeo. doi:10.4000/cybergeo.30143
Yi, M., Lu, Y., Wen, L., Luo, Y., and Zhang, T. (2022). Whether green technology innovation is conducive to haze emission reduction: Empirical evidence from China. Environ. Sci. Pollut. Res. 29 (8), 12115–12127. doi:10.1007/s11356-021-16467-w
Zhang, G., Wang, Y., Li, K., Economics, S. O., and University, N. (2016). Special economic development zones and firm dynamic growth: Research based on firm entry, exit and growth. Finance. Econ. Res. 42 (12), 49–60. (In Chinese). doi:10.16538/j.cnki.jfe.2016.12.005
Zhang, M., Yan, T. H., and Ren, Q. Z. (2022). Does innovative development drive green economic growth in resource-based cities? Evidence from China. Front. Environ. Sci. 9, 745498. doi:10.3389/fenvs.2021.745498
Zheng, L. (2021). Job creation or job relocation? Identifying the impact of China’s special economic zones on local employment and industrial agglomeration. China Econ. Rev. 69, 101651. doi:10.1016/j.chieco.2021.101651
Zheng, S., and Li, Z. (2020). Pilot Governance and the Rise of China’s Innovation. China Econ. Rev. 63, 101521
Zheng, S., Sun, W., Wu, J., and Kahn, M. E. (2017). The birth of edge cities in China: Measuring the effects of industrial parks policy. J. Urban Econ. 100 (jul), 80–103. doi:10.1016/j.jue.2017.05.002
Zhou, M., Yi, L. U., Yan, D. U., and Yao, X. (2018). Special economic zones and region manufacturing upgrading. Chin. Ind. Econ. 03, 62–79. (In Chinese). doi:10.19581/j.cnki.ciejournal.2018.03.004
Keywords: EDZs, pollutants equivalent, pollution emission intensity, firm heterogeneity, DID
Citation: Wei W, Xie W and Zhou C (2022) EDZs and Firms’ Environment Performance: Empirical Evidence From Chinese Firms. Front. Environ. Sci. 10:919600. doi: 10.3389/fenvs.2022.919600
Received: 14 April 2022; Accepted: 31 May 2022;
Published: 19 July 2022.
Edited by:
Huaping Sun, Jiangsu University, ChinaReviewed by:
Zhen Liu, Nanjing Normal University, ChinaLiang Liu, Soochow University, China
Feng Wang, Chongqing University, China
Copyright © 2022 Wei, Xie and Zhou. This is an open-access article distributed under the terms of the Creative Commons Attribution License (CC BY). The use, distribution or reproduction in other forums is permitted, provided the original author(s) and the copyright owner(s) are credited and that the original publication in this journal is cited, in accordance with accepted academic practice. No use, distribution or reproduction is permitted which does not comply with these terms.
*Correspondence: Chengying Zhou, emhvdWN5MDQxNUAxNjMuY29t