 Yucong Miao
 Xinxuan Zhang1
 Huizheng Che
95% of researchers rate our articles as excellent or good
Learn more about the work of our research integrity team to safeguard the quality of each article we publish.
Find out more
BRIEF RESEARCH REPORT article
Front. Environ. Sci. , 30 June 2022
Sec. Atmosphere and Climate
Volume 10 - 2022 | https://doi.org/10.3389/fenvs.2022.918076
This article is part of the Research Topic Weather and Climate Extremes in the Urban Environment: Modeling and Observations View all 10 articles
Heavy PM2.5 (particulate matter with an aerodynamics diameter less than 2.5 μm) pollution frequently happens in Wuhan under unfavorable meteorological conditions. To comprehensively understand the complex impact of both regional-scale synoptic forcing and local-scale processes within the planetary boundary layer (PBL) on air quality in Wuhan, this study analyzed long-term PM2.5 concentration measurement, near-surface and upper-air meteorological observations from March 2015 to February 2019, in combination with the Modern-Era Retrospective Analysis for Research and Applications version 2 (MERRA-2). We found that in winter the day-to-day change of PM2.5 pollution level in Wuhan was governed by the synoptic warm/cold advection, in addition to the high emissions of pollutants. The synoptic condition can largely determine both the vertical development of PBL and horizontal transport of pollutants. When a high-pressure system is located to the north of Wuhan at the 900-hPa level, the induced warm advection above 1,000 m can enhance the thermal stability of lower troposphere and inhibit the development of daytime PBL, leading to a decreased dispersion volume for pollutants. Meanwhile, within the PBL the pollutants emitted from Henan, Shandong, and Anhui provinces can be transported to Wuhan, further worsening the pollution. Our results highlight the importance of coordinated pollution controls in Central China and adjacent north regions under the unfavorable synoptic condition.
Wuhan, the capital city of Hubei province, is one of most populated and heaviest polluted cities in China (Miao et al., 2019; Xiao et al., 2020; Tao et al., 2021). It is a major industrial and commercial city in Central China, with a population of more than ten million. Due to the high level of urbanization and industrialization, and associated huge consumptions of energy and resources, anthropogenic air pollution has become one of most critical environmental issues in Wuhan (Miao et al., 2019). The PM2.5 (particulate matter with an aerodynamics diameter less than 2.5 μm) pollution events have been frequently reported under unfavorable meteorological conditions (e.g., Lu et al., 2019; Miao and Liu, 2019; Tao et al., 2021), threatening the health of citizens (Pope and Dockery, 2006).
The city is crossed by the transportation routes of road, rail, and river from almost every direction, linking the north, south, west, and east parts of China. This unique geographical location (Supplementary Figure S1) makes it subject to the influence of air masses/pollutants moved from every direction (Mbululo et al., 2019; Miao et al., 2019). For example, during a pollution episode in November 2017, large amounts of aerosols were transported to Wuhan from North China along with the movement of cold air masses (Xiao et al., 2020). Similar processes have also been reported by Hu et al. (2021) and Lu et al. (2019). In addition to these trans-boundary transport processes, the local-scale planetary boundary layer (PBL) also plays a critical role in the formation of PM2.5 pollution (Liu et al., 2018; Mbululo et al., 2019; Xiao et al., 2020). Because the PBL governs the vertical exchange of energy, matter, and heat between surface and upper free atmosphere, the height of boundary layer (BLH) is widely used to quantify the volume for pollutant dispersion and dilution (Stull, 1988; Miao and Liu, 2019). Within the PBL, near-surface inversion layer and calm wind condition were often found to be associated with the PM2.5 pollution in Wuhan (Mbululo et al., 2019; Miao and Liu, 2019). Although the importance of regional-scale synoptic condition (Xiao et al., 2020) or local-scale PBL thermal structure (Miao and Liu, 2019) for the PM2.5 pollution in Wuhan has been pointed out, the connection between these multi-scale atmospheric processes and their integrated effects on pollution are not yet clear understood, particularly in the heavily polluted winter.
In order to comprehensively understand the pollution formation mechanism in Wuhan and elucidate the environmental impact of multi-scale meteorological processes, we collected and analyzed long-term PM2.5 concentration measurement, near-surface and upper-air meteorological observations from March 2015 to February 2019, in combination with the Modern-Era Retrospective Analysis for Research and Applications version 2 (MERRA-2).
In this study, hourly PM2.5 concentration data from March 2015 to February 2019 in Wuhan were collected from nine monitoring sites in Wuhan (Supplementary Figure S1B), which are operated by the China National Environmental Monitoring Center (CNEMC). We first calculated the daily concentrations for each PM2.5 monitoring site, and then averaged the concentrations of all sites to derive the daily values. Besides, both ground-level and upper-air meteorological observations were obtained from a station (114.05°E, 30.60°N) in Wuhan, which is operated by the China Meteorological Administration. The ground-level meteorological parameters were recorded hourly. The sounding balloon was launched twice a day at 08:00 LT (00:00 UTC) and 20:00 LT (12:00 UTC), which can provide fine-resolution vertical profiles of temperature, humidity, wind, and pressure (Miao et al., 2015).
To complement these above-mentioned discrete observations to gain further insight into the nature of PM2.5 pollution, we analyzed the MERRA-2 data in this study, which is the latest atmospheric reanalysis of the modern satellite era developed by NASA’s Global Modeling and Assimilation Office (Gelaro et al., 2017). In the vertical dimension, there are 72 model levels from surface to 0.01-hPa level. The MERRA-2 dataset was used as an alternative to derive the daily maximum BLH in the afternoon (Miao et al., 2022). We estimated the BLH as the level at which the potential temperature (PT) first exceeds the minimum PT within the PBL by 1.5 K (Nielsen-Gammon et al., 2008; Miao et al., 2021). Based on the meteorological fields (e.g., pressure, temperature) derived from MERRA-2, we employed the T-mode principal component analysis (T-PCA) (Huth et al., 2008) to identify the typical synoptic conditions associated with the polluted and clean conditions in Wuhan. The T-PCA studied region covered Central China and its adjacent regions, in a range from 110 to 121°E and 26 to 37°N. The T-PCA has been widely used to untangle the relationships between regional-scale background meteorological conditions and local-scale weather phenomena or pollution processes (e.g., Miao et al., 2018; Yan et al., 2019; Li et al., 2021), which has proven to be a reliable objective classification method due to its high temporal and spatial stability in the classified results (Philipp et al., 2010; Zhang et al., 2012; Ye et al., 2016). The detailed information of the T-PCA can be found in previous studies of Huth et al. (2008) and Philipp et al. (2010). After identifying the typical synoptic conditions, the spatial distributions of PM2.5 concentration could be revealed on the basis of the Chinese Air Quality Reanalysis (CAQRA), which is the assimilation dataset of surface observations from the CNEMC using the ensemble Kalman filter and Nested Air Quality Prediction Modeling System (Kong et al., 2021).
Besides, 48-h backward trajectories of air masses were simulated using the Hybrid Single Particle Lagrangian Integrated Trajectory model (HYSPLIT) (Draxler and Hess, 1998) and MERRA-2 data, which can help to recognize the transport pathways of pollutants (Sun et al., 2017). For each day during the study period, a 48-h backward trajectory was calculated with ending time at 20:00 LT, and the trajectory ending point was set above the meteorological station in Wuhan (114.05°E, 30.60°N, 100 m above ground level). Based on the simulated backward trajectories, we calculated the map of potential source contribution function (PSCF) (Mbululo et al., 2019; Sun et al., 2017) for the PM2.5 pollution in Wuhan. The PSCF value in the ij-th grid was calculated as Pij/Nij, in which the Nij was the number of endpoints that fall in the ij-th grid and the Pij was the number of “polluted” trajectory endpoints in the same grid. The “polluted” trajectory was usually determined according to a threshold value of pollutants’ concentration. In this study, we calculated the PSCF with a resolution of 0.5° × 0.5°.
During the study period from March 2015 to February 2019, prominent seasonal variation of PM2.5 concentration in Wuhan can be observed (Supplementary Figure S2). The maximum seasonally average PM2.5 concentration was 86.5 μg m−3 in winter (Dec-Jan-Feb), significantly higher than the average concentrations in other seasons, which were 55.3 μg m−3 in spring (Mar-Apr-May), 31.0 μg m−3 in summer (Jun-Jul-Aug), and 49.1 μg m−3 in autumn (Sep-Oct-Nov). Therefore, we focused on the wintertime PM2.5 pollution in Wuhan. Because most pollution events in winter occurred on the dry conditions, we excluded the rainy days (i.e., 24-h accumulated precipitation greater than 0.5 mm) in this study. In total, the measurements of 260 days in winter were analyzed.
The day-to-day variation of PM2.5 concentration in Wuhan is shown in Figure 1A. It was found that higher PM2.5 concentrations were often associated with warmer atmosphere above 1,000 m. Comparing the 850-hPa PT with daily PM2.5 concentration in Wuhan, a significant positive correlation (R = 0.29, p < 0.001) can be found. To further understand the relationship between 850-hPa PT and PM2.5 pollution level, we grouped both variables into five bins according to the quintile values of PM2.5 concentration (Figure 2). Binning is an effective approach to isolate the expected variability from sampling uncertainty (Seidel et al., 2010; Miao et al., 2018). There was a pronounced increasing trend in the 850-hPa PT along with the deterioration of PM2.5 pollution from the first quintile to the fifth quintile, with a spearman correlation coefficient of 0.99 (p < 0.001) between the averages of binned PTs and PM2.5 concentrations. This relationship between the 850-hPa PT and PM2.5 concentration is consistent with the previous study in Central China (Miao et al., 2018). Specifically, the first quintile of PM2.5 concentration ranged from 20.3 of 61.5 μg m−3, corresponding to the 850-hPa PT within a range from 269 to 296 K, while the fifth quintile of PM2.5 concentration (121.4–292.3 μg m−3) was relevant to higher PT (280–299 K). The elevated warming above 1,000 m was also reported in the pollution episode in Wuhan during November 2017 (Xiao et al., 2020), which may enhance the thermal stability in lower troposphere, suppress the development of PBL, and limit the dispersion and dilution of pollutants (Miao et al., 2019; Wang et al., 2020). Such a physical mechanism will be systematically elucidated in the following section by combining synoptic classification and PBL structure analysis. In the rest, we referred the first and fifth quintiles to the clean and polluted conditions in Wuhan, respectively.
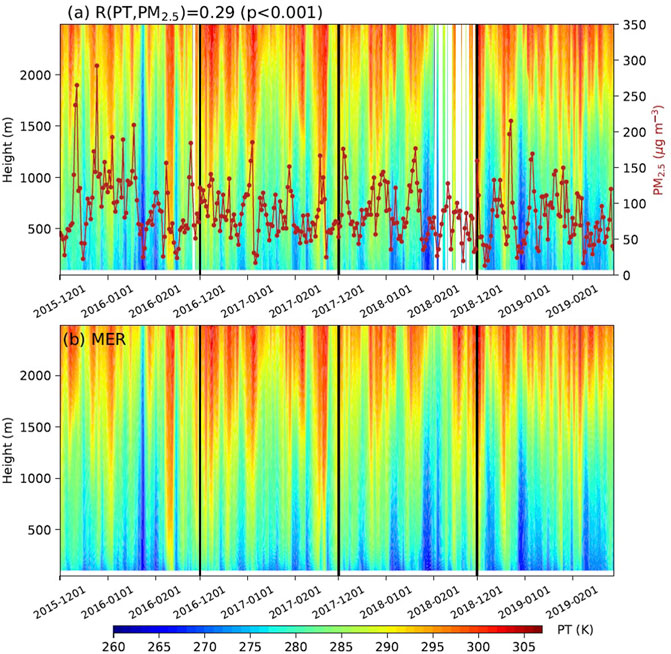
FIGURE 1. Time-height sections of potential temperature (PT) in winter from December 2015 to February 2019 in Wuhan, derived from (A) radiosonde measurements and (B) MERRA-2 at 08:00 LT. In (A), the time series of daily PM2.5 concentration (red line and dots) is also shown, and the correlation coefficient between the daily concentration and 850-hPa PT is 0.29 (p < 0.001). The correlation coefficient between the measured PT profiles and MERRA-2 PT profiles is 0.99 (p < 0.001).
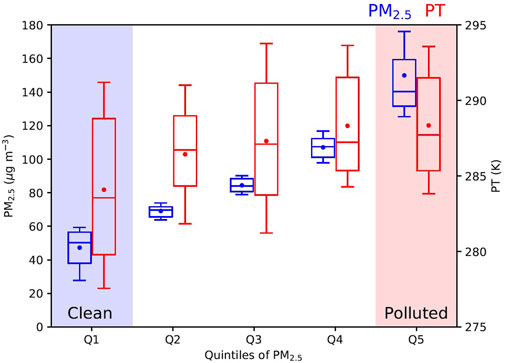
FIGURE 2. Boxplot showing the changes of daily PM2.5 concentration (blue) and 850-hPa PT (red) in Wuhan during winter on the days of different quintiles of PM2.5 concentration (Q1 to Q5). The PTs shown were derived from the radiosonde measurements at 08:00 LT, and the measurements of rainy days (24-h accumulated precipitation greater than 0.5 mm) were excluded. The central box represents the values from the lower to upper quartile (25th to 75th percentile). The vertical line extends from the 0th percentile to the 90th percentile value. The middle solid line represents the median, and the dot represents the mean value.
In addition to the thermal structure, significant difference in the wind profiles between the clean and polluted conditions can also be observed (Supplementary Figure S3B); the clean condition featured north or northwesterly winds at the height between 700 and 1,200 m, while the polluted condition was associated with relatively weaker northeasterly winds. All these above-mentioned differences of PT, wind speed and direction in Wuhan were well reproduced by MERRA-2 (Figure 1 and Supplementary Figure S3). Thus, it would be reliable to explore the underlying physical processes in Wuhan using MERRA-2.
Because the change of PM2.5 pollution in Wuhan was closely related to the variation of 850-hPa PT, we used the daily 850-hP PT fields derived from MERRA-2 as the T-PCA input data, and eight types of synoptic pattern were objectively classified (Supplementary Figure S4). Among these identified synoptic types, Type-1 was predominantly relevant to the PM2.5 pollution days, and Type-2 was in relation to the clean condition (Supplementary Figure S5). These two synoptic types were the most occurred conditions in Central China, accounted for 74.5% of the total (Supplementary Figure S4). Under the control of Type-2, Wuhan was influenced by a cold advection from the northwest (Figure 3B). By contrast, Wuhan was under the influence of a 900-hPa high-pressure system in the north of city when Type-1 happened, leading to weak northeasterly winds and input of warmer air masses from the east to Wuhan (Figure 3A). The elevated warm advection can significantly increase PT above 1,000 m (Figure 4A), and strengthen the thermal inversion above the PBL, leading to a depressed PBL in the afternoon. Specifically, the average BLH at 14:00 LT was merely around 1,100 m in Wuhan under the control of Type-1, significantly shallower than the average BLH of Type-2 (1,400 m). Such a depression of BLH decreased the dispersion volume for pollutants (Stull, 1988; Li et al., 2021; Miao et al., 2022), leading to an increased PM2.5 concentration in Wuhan.
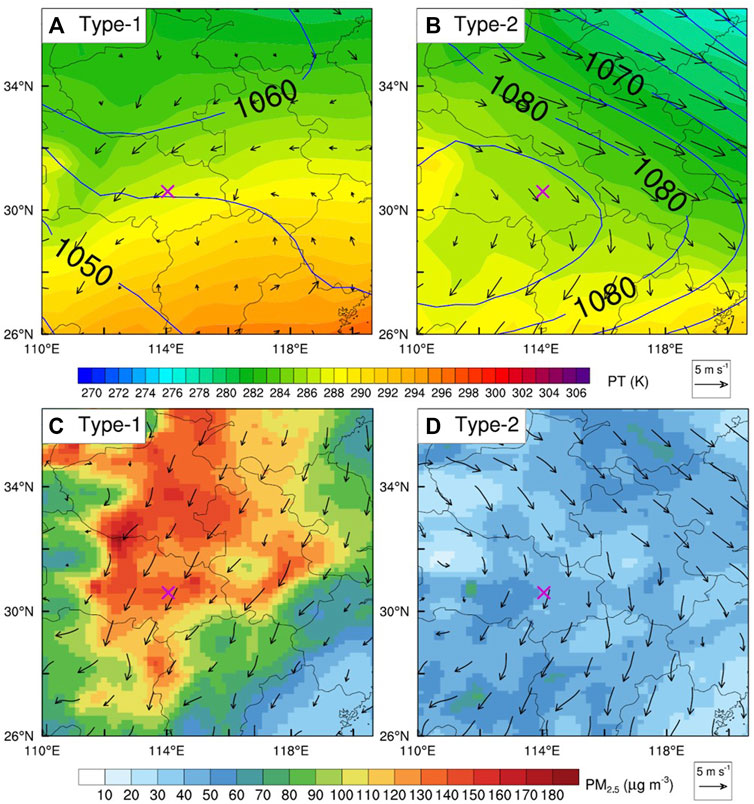
FIGURE 3. Typical synoptic patterns associated with (A) polluted and (B) clean conditions in Wuhan, and the corresponding (C,D) near-surface PM2.5 concentration and wind fields. In (A,B), the synoptic patterns were identified using the T-PCA on the basis of daily MERRA-2 850-hPa PT fields, overlaid with geopotential height and wind vector fields at the 900-hPa level. In (C,D), the PM2.5 concentration and wind fields were derived from the CAQRA data, and only the data on the polluted or clean days were averaged for the specific type of synoptic pattern.
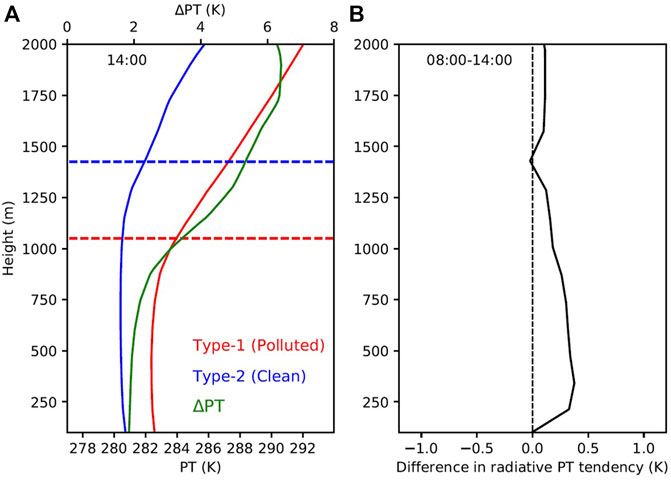
FIGURE 4. (A) Averaged PT profiles at 14:00 LT in Wuhan on the polluted (in red) and clean (in blue) days under the typical synoptic types and their difference (in green), and (B) the difference in the PT tendency due to radiation between the polluted and clean days from 08:00 to 14:00 LT. All the PT profiles shown are derived from MERRA-2, and the BLHs at 14:00 LT were denoted by the dashed lines in (A).
In addition to the regional-scale synoptic forcing, the radiative effect of aerosol can also modulate the PBL thermal structure (Wang et al., 2018; Miao et al., 2020), which might be another cause of PBL depression in the afternoon. Based on the temperature tendency due to radiation derived from MERRA-2, the PBL thermal modulation caused by the aerosol radiative effect at 14:00 LT can be approximately estimated, which is calculated as the difference of 6-h accumulated radiative temperature tendency (08:00 to 14:00 LT) between the polluted and clean days (Figure 4B). From 08:00 to 14:00 LT, the aerosol radiative effect can increase the PT of the upper and middle portions of PBL by 0.2–0.4 K, however, it cannot explain the pronounced difference (around 4–6 K) near the PBL top between the polluted and clean days (Figure 4A). It indicates that the depression of afternoon PBL on the pollution days in Wuhan is primarily caused by the synoptic forcing (Figure 3), although the aerosol radiative effect (Figure 4B) may further suppress the development of PBL to some extent (Miao et al., 2019).
The synoptic condition not only modulates the PBL structure, but also determines the transport pathways of pollutants (Ye et al., 2016; Xiao et al., 2020). Because the day-to-day variation of PM2.5 concentration in Wuhan can be well duplicated by CAQRA (Supplementary Figure S6), we derived the near-surface spatial distributions of PM2.5 concentration and wind from CAQRA (Figures 3C,D). Under the influence of Type-1, grids with PM2.5 concentration greater than 120 μg m−3 not only can be found in Wuhan, but also in the north upstream regions (Figure 3C), including Henan, Anhui, and Shandong provinces. When influencing by the large-scale northerly prevailing winds, the massive pollutants in Henan, Anhui, and Shandong provinces can be easily transported to Wuhan. Such a transport of pollutants from north under the Type-1 must be partly responsible for the formation of heavy PM2.5 pollution in Wuhan.
To further validate the regional transport from north, we derived the PSCF map for PM2.5 pollution in Wuhan on the basis of HYSPLIT backward trajectories. The trajectories ending on the PM2.5 pollution days were identified as the “polluted” trajectories. In addition to the local emissions, the potential source regions for the heavy PM2.5 pollution in Wuhan included the north part of Anhui, the east part of Henan, and the west part of Shandong (Supplementary Figure S7), which are well consistent with the CAQRA PM2.5 concentration fields of Type-1 (Figure 3C). It indicates that the transport of pollutants from Henan, Anhui, and Shandong provinces is critical to the formation of heavy PM2.5 pollution in Wuhan. Therefore, to achieve a pollution-free environment, coordinated controls between Wuhan and its north upstream regions should be implemented when the unfavorable synoptic condition happens.
In short, the synoptic condition governs the wintertime PM2.5 pollution in Wuhan via both vertical depression of BLH (Figures 3A, 4) and horizontal transport of pollutants (Figure 3C). When there is a high-pressure system located to the north of Wuhan at the 900-hPa level, the elevated warm advection above 1,000 m can enhance the thermal stability in lower troposphere and inhibit the development of daytime PBL, leading to a decreased dispersion volume for pollutants in Wuhan. Meanwhile, within the PBL the pollutants emitted from the north provinces (i.e., Henan, Shandong, and Anhui) can be transported to Wuhan, further worsening the pollution. These multi-scale meteorological processes are critical to the frequent occurrence of PM2.5 pollution in Wuhan during winter, in addition to the high emissions of pollutants.
Our results improve the understanding of PM2.5 pollution formation mechanism in the populated Central China, as well as the environmental impacts of multi-scale meteorological conditions during winter. We find that synoptic warm/cold air advection is critical to the formation of air pollution in Wuhan, because it governs both the vertical development of PBL and horizontal transport of pollutants. When a high-pressure system is located to the north of Wuhan at the 900-hPa level, the elevated warm advection above 1,000 m can enhance the thermal stability in lower troposphere and inhibit the development of daytime PBL in Wuhan. Meanwhile, the pollutants emitted from the adjacent Henan, Shandong, and Anhui provinces can be transported to Wuhan, further worsening the pollution. This study highlights the importance of coordinated pollution controls in Central China and its adjacent north regions under the unfavorable synoptic condition.
Besides, although this study has emphasized the impact of physical processes on the PM2.5 pollution in Wuhan, the chemical processes within the PBL also should not be deemphasized, which merits further experimental, observational, and numerical investigations.
Publicly available datasets were analyzed in this study. This data can be found here: The MERRA-2 datasets analyzed for this study are archived by the National Aeronautics and Space Administration of the United States (https://gmao.gsfc.nasa.gov/reanalysis/MERRA-2/). The air quality measurements analyzed are archived by the China National Environmental Monitoring Center (http://www.cnemc.cn/). The meteorological measurements analyzed are archived by the China Meteorological Administration (http://data.cma.cn/). The CAQRA datasets analyzed can be found in the Science Data Bank (https://doi.org/10.11922/sciencedb.00053).
Conceptualization, methodology, formal analysis, writing—original draft, writing—review and editing: YM and HC; visualization, data curation: XZ; supervision: SL.
This study received financial support from the Beijing Nova Program (Z201100006820138), the National Natural Science Foundation of China (42030608, 41875181), and the S&T Development Fund of CAMS (2022KJ001), and the Institute of Heavy Rain of China Meteorological Administration.
The authors declare that the research was conducted in the absence of any commercial or financial relationships that could be construed as a potential conflict of interest.
All claims expressed in this article are solely those of the authors and do not necessarily represent those of their affiliated organizations, or those of the publisher, the editors and the reviewers. Any product that may be evaluated in this article, or claim that may be made by its manufacturer, is not guaranteed or endorsed by the publisher.
The Supplementary Material for this article can be found online at: https://www.frontiersin.org/articles/10.3389/fenvs.2022.918076/full#supplementary-material
Draxler, R. R., and Hess, G. D. (1998). An Overview of the HYSPLIT_4 Modelling System for Trajectories, Dispersion and Deposition. Aust. Meteorol. Mag. 47, 295–308.
Gelaro, R., McCarty, W., Suárez, M. J., Todling, R., Molod, A., Takacs, L., et al. (2017). The Modern-Era Retrospective Analysis for Research and Applications, Version 2 (MERRA-2). J. Clim. 30, 5419–5454. doi:10.1175/JCLI-D-16-0758.1
Hu, X. M., Hu, J., Gao, L., Cai, C., Jiang, Y., Xue, M., et al. (2021). Multisensor and Multimodel Monitoring and Investigation of a Wintertime Air Pollution Event Ahead of a Cold Front over Eastern China. Geophys Res. Atmos. 126, e2020JD033538. doi:10.1029/2020JD033538
Huth, R., Beck, C., Philipp, A., Demuzere, M., Ustrnul, Z., Cahynová, M., et al. (2008). Classifications of Atmospheric Circulation Patterns. Ann. N. Y. Acad. Sci. 1146, 105–152. doi:10.1196/annals.1446.019
Kong, L., Tang, X., Zhu, J., Wang, Z., Li, J., Wu, H., et al. (2021). A 6-Year-Long (2013-2018) High-Resolution Air Quality Reanalysis Dataset in China Based on the Assimilation of Surface Observations from CNEMC. Earth Syst. Sci. Data 13, 529–570. doi:10.5194/essd-13-529-2021
Li, Y., Miao, Y., Che, H., and Liu, S. (2021). On the Heavy Aerosol Pollution and its Meteorological Dependence in Shandong Province, China. Atmos. Res. 256, 105572. doi:10.1016/j.atmosres.2021.105572
Liu, L., Guo, J., Miao, Y., Liu, L., Li, J., Chen, D., et al. (2018). Elucidating the Relationship between Aerosol Concentration and Summertime Boundary Layer Structure in Central China. Environ. Pollut. 241, 646–653. doi:10.1016/j.envpol.2018.06.008
Lu, M., Tang, X., Wang, Z., Wu, L., Chen, X., Liang, S., et al. (2019). Investigating the Transport Mechanism of PM2.5 Pollution during January 2014 in Wuhan, Central China. Adv. Atmos. Sci. 36, 1217–1234. doi:10.1007/s00376-019-8260-5
Mbululo, Y., Qin, J., Yuan, Z., Nyihirani, F., and Zheng, X. (2019). Boundary Layer Perspective Assessment of Air Pollution Status in Wuhan City from 2013 to 2017. Environ. Monit. Assess. 191, 69. doi:10.1007/s10661-019-7206-9
Miao, Y., Hu, X.-M., Liu, S., Qian, T., Xue, M., Zheng, Y., et al. (2015). Seasonal Variation of Local Atmospheric Circulations and Boundary Layer Structure in the Beijing-Tianjin-Hebei Region and Implications for Air Quality. J. Adv. Model. Earth Syst. 7, 1602–1626. doi:10.1002/2015MS000522
Miao, Y., Liu, S., Guo, J., Huang, S., Yan, Y., and Lou, M. (2018). Unraveling the Relationships between Boundary Layer Height and PM2.5 Pollution in China Based on Four-Year Radiosonde Measurements. Environ. Pollut. 243, 1186–1195. doi:10.1016/j.envpol.2018.09.070
Miao, Y., Li, J., Miao, S., Che, H., Wang, Y., Zhang, X., et al. (2019). Interaction between Planetary Boundary Layer and PM2.5 Pollution in Megacities in China: a Review. Curr. Pollut. Rep. 5, 261–271. doi:10.1007/s40726-019-00124-5
Miao, Y., Che, H., Zhang, X., and Liu, S. (2020). Integrated Impacts of Synoptic Forcing and Aerosol Radiative Effect on Boundary Layer and Pollution in the Beijing-Tianjin-Hebei Region, China. Atmos. Chem. Phys. 20, 5899–5909. doi:10.5194/acp-20-5899-2020
Miao, Y., Che, H., Zhang, X., and Liu, S. (2021). Relationship between Summertime Concurring PM2.5 and O3 Pollution and Boundary Layer Height Differs between Beijing and Shanghai, China. Environ. Pollut. 268, 115775. doi:10.1016/j.envpol.2020.115775
Miao, Y., Che, H., Liu, S., and Zhang, X. (2022). Heat Stress in Beijing and its Relationship with Boundary Layer Structure and Air Pollution. Atmos. Environ. 282, 119159. doi:10.1016/j.atmosenv.2022.119159
Miao, Y., and Liu, S. (2019). Linkages between Aerosol Pollution and Planetary Boundary Layer Structure in China. Sci. Total Environ. 650, 288–296. doi:10.1016/j.scitotenv.2018.09.032
Nielsen-Gammon, J. W., Powell, C. L., Mahoney, M. J., Angevine, W. M., Senff, C., White, A., et al. (2008). Multisensor Estimation of Mixing Heights over a Coastal City. J. Appl. Meteorol. Climatol. 47, 27–43. doi:10.1175/2007JAMC1503.1
Philipp, A., Bartholy, J., Beck, C., Erpicum, M., Esteban, P., Fettweis, X., et al. (2010). Cost733cat - A Database of Weather and Circulation Type Classifications. Phys. Chem. Earth, Parts A/B/C 35, 360–373. doi:10.1016/j.pce.2009.12.010
Pope, C. A., and Dockery, D. W. (2006). Health Effects of Fine Particulate Air Pollution: Lines that Connect. J. Air & Waste Manag. Assoc. 56, 709–742. doi:10.1080/10473289.2006.10464485
Seidel, D. J., Ao, C. O., and Li, K. (2010). Estimating Climatological Planetary Boundary Layer Heights from Radiosonde Observations: Comparison of Methods and Uncertainty Analysis. J. Geophys. Res. 115, D16113. doi:10.1029/2009JD013680
Stull, R. B. (1988). An Introduction to Boundary Layer Meteorology. Editor R. B. Stull (Dordrecht: Springer Netherlands). doi:10.1007/978-94-009-3027-8
Sun, J., Huang, L., Liao, H., Li, J., and Hu, J. (2017). Impacts of Regional Transport on Particulate Matter Pollution in China: a Review of Methods and Results. Curr. Pollut. Rep. 3, 182–191. doi:10.1007/s40726-017-0065-5
Tao, M., Huang, H., Chen, N., Ma, F., Wang, L., Chen, L., et al. (2021). Contrasting Effects of Emission Control on Air Pollution in Central China during the 2019 Military World Games Based on Satellite and Ground Observations. Atmos. Res. 259, 105657. doi:10.1016/j.atmosres.2021.105657
Wang, Z., Huang, X., and Ding, A. (2018). Dome Effect of Black Carbon and its Key Influencing Factors: A One-Dimensional Modelling Study. Atmos. Chem. Phys. 18, 2821–2834. doi:10.5194/acp-18-2821-2018
Wang, Q., Miao, Y., and Wang, L. (2020). Regional Transport Increases Ammonia Concentration in Beijing, China. Atmosphere 11, 563. doi:10.3390/atmos11060563
Xiao, Z., Miao, Y., Du, X., Tang, W., Yu, Y., Zhang, X., et al. (2020). Impacts of Regional Transport and Boundary Layer Structure on the PM2.5 Pollution in Wuhan, Central China. Atmos. Environ. 230, 117508. doi:10.1016/j.atmosenv.2020.117508
Yan, Y., Miao, Y., Guo, J., Liu, S., Liu, H., Lou, M., et al. (2019). Synoptic Patterns and Sounding-Derived Parameters Associated with Summertime Heavy Rainfall in Beijing. Int. J. Climatol. 39, 1476–1489. doi:10.1002/joc.5895
Ye, X., Song, Y., Cai, X., and Zhang, H. (2016). Study on the Synoptic Flow Patterns and Boundary Layer Process of the Severe Haze Events over the North China Plain in January 2013. Atmos. Environ. 124, 129–145. doi:10.1016/j.atmosenv.2015.06.011
Keywords: PM2.5 pollution, synoptic condition, regional transport, planetary boundary layer, multi-scale processes
Citation: Miao Y, Zhang X, Che H and Liu S (2022) Influence of Multi-Scale Meteorological Processes on PM2.5 Pollution in Wuhan, Central China. Front. Environ. Sci. 10:918076. doi: 10.3389/fenvs.2022.918076
Received: 12 April 2022; Accepted: 13 June 2022;
Published: 30 June 2022.
Edited by:
Ashish Sharma, University of Illinois at Urbana-Champaign, United StatesReviewed by:
Zhenxing Shen, Xi’an Jiaotong University, ChinaCopyright © 2022 Miao, Zhang, Che and Liu. This is an open-access article distributed under the terms of the Creative Commons Attribution License (CC BY). The use, distribution or reproduction in other forums is permitted, provided the original author(s) and the copyright owner(s) are credited and that the original publication in this journal is cited, in accordance with accepted academic practice. No use, distribution or reproduction is permitted which does not comply with these terms.
*Correspondence: Yucong Miao, bWlhb3l1Y29uZ0B5ZWFoLm5ldA==; Huizheng Che, Y2hlaHpAY21hLmdvdi5jbg==
Disclaimer: All claims expressed in this article are solely those of the authors and do not necessarily represent those of their affiliated organizations, or those of the publisher, the editors and the reviewers. Any product that may be evaluated in this article or claim that may be made by its manufacturer is not guaranteed or endorsed by the publisher.
Research integrity at Frontiers
Learn more about the work of our research integrity team to safeguard the quality of each article we publish.