 Roni Bhowmik
 Dil Bahadur Rahut
 Qasim Raza Syed
- 1School of Business, Guangdong University of Foreign Studies, Guangzhou, China
- 2Asian Development Bank Institute, Tokyo, Japan
- 3National Tariff Commission, Ministry of Commerce, Islamabad, Pakistan
Carbon emissions from the transport sector (COE) has witnessed unprecedented growth, which calls for special measures to control these emissions to achieve carbon neutrality by 2050. One of the measures taken to limit these emissions is climate change mitigation technology related to the transport sector (CCMT). However, there exists relatively scant literature that explores the CCMT-COE nexus. Hence, the present study explores whether CCMT curbs COE in the top transport sector carbon-emitting countries. For this purpose, we employ a panel quantile regression (PQR) approach, which probes the impact of CCMT on COE in low-, middle, and high-emission countries. The result shows that CCMT does not affect COE at the lowest quantile (i.e., 10th quantile) while CCMT plunges the emissions at all other quantiles. In particular, a 1% increase in CCMT curbs COE by 0.13% at the 25th, 50th, and 75th quantile, while a 1% upsurge in CCMT impedes COE by 0.22% at the 90th quantile. In the light of these findings, the carbon policy in the transport sector should invest in climate change mitigating technology in the transport sector and scale it up and out.
Introduction
The transport sector is regarded as one of the imperative sectors because it contributes significantly to social and economic development. Improved transport facilities assist the mobilization of the labor force and help to transfer other resources (e.g., coal, machines, other capital goods, etc.). Not only this, the transport sector plays a pivotal role while providing quality education and health services. Further, quality transportation services boost tourism, trade, and effective distribution, thereby upsurging economic growth (EG). Besides, transportation transfers resources from resource-abundant to resource-scarce areas and reduces income inequality. In the US and European Union (EU), the share of the transport sector to GDP is around 8% and 5%, respectively1. Thus, the transport sector is undoubtedly inevitable for the socio-economic development of the nation and the well-being of people (Monioudi et al., 2018; Xu and Lin, 2018; Ülengin et al., 2018; Jiang et al., 2019; Lv et al., 2019; Georgatzi et al., 2020).
However, it is important to note that the transport sector significantly relies on energy. Whether it is road transportation, railways, or air transport services, the use of energy is profound. Both production and consumption/use of transport require a substantial amount of energy. For instance, an enormous amount of energy is used as an input to produce vehicles, ships, and jets, among others. On the contrary, petroleum-based products (e.g., gasoline and jet fuel, etc.) are required to operate vehicles, ships, jets, etc. Such a heavy reliance on energy is responsible for high greenhouse gas (GHG) emissions. According to the World Bank, 16.2% of world energy consumption is associated with the transport sector (Cozzi et al., 2020).
Similarly, the transport sector emits the second-highest level of greenhouse gases (EIA, 2020). Further, according to Energy Information Administration, the transport sector is responsible for almost 22% of global carbon emissions (EIA, 2020). Recently, Tunde et al. (2022) analyzed the trends (i.e., forecasting) of sectoral carbon emissions and concluded that the transport sector emissions experienced the highest trend. Hence proper environmental planning in the transport sector is inevitable for sustainable growth (ibid). Not only this, but the transport sector’s emissions also affect EG. Rehman et al. (2022) argued that carbon emissions from various sectors have an asymmetric impact on EG. In particular, the transport sector emissions have an asymmetric effect on both the short- and long-term growth.
Against the backdrop of increasing climate risk resulting from greenhouse gas emissions and a global effort to achieve carbon neutrality by 2050, reducing transport-related carbon emissions (COE) is crucial. Therefore, it is critical to explore the drivers of COE. The literature presents several factors that explain transport-related carbon emissions (COE), such as economic growth (EG) (Arvin et al., 2015; Berg et al., 2017; Nasreen et al., 2020; Godil et al., 2021), non-renewable energy consumption (Nathaniel and Iheonu, 2019; Sharif et al., 2019; Destek and Sinha, 2020; Sharma et al., 2021), renewable energy consumption (Dong et al., 2017; Lee et al., 2017; Hu et al., 2018; Amin et al., 2020; Naderipour et al., 2021), urbanization (Zhang et al., 2020; Hanif, 2018; Liu et al., 2018; Zhou et al., 2021), and environmental policies (Huisingh et al., 2015; Xie et al., 2017; Bhowmik et al., 2020; Chan, 2020; Moran et al., 2020; D’Orazio and Dirks, 2022; Hussain et al., 2022), etc. Parallel to these factors, environmental technologies are the eminent drivers that can help to limit COE (Kwon et al., 2017; Raza et al., 2019; Chen and Lee, 2020; Nguyen et al., 2020; Rissman et al., 2020). Further, climate change mitigation technology related to the transport sector (CCMT) is among the critical factors that play a vital role in curbing COE (Wang et al., 2018; Fan et al., 2019). CCMT is referred to as the technological advancements that escalate the energy efficiency and share of renewables in the transport sector. The literature disregards the CCMT while modeling COE (Lee et al., 2017; Durmaz, 2018), which is necessary to shape policies related to sustainable transportation. CCMT upsurges the energy efficiency, thereby helping to reduce COE. Moreover, CCMT can also escalate the use of renewable energy products, which, in turn, mitigate COE.
Rudyk et al. (2015) examines the impact of CCMT on COE for European countries and found that CCMT helps in reducing COE. Su and Moaniba (2017) report that CCMT curbs COE for selected 70 countries. In the case of 30 Chinese provinces, Xu and Lin (2015) find similar results. Alatas (2021) reported that CCMT impedes COE in selected OECD economies. Although these studies mentioned above explain the impact of CCMT on COE, no study covers the issue of individual and unobserved heterogeneity. On top of this, no research outlet examines the impact of CCMT on low-, middle-, and higher levels of COE. Therefore, the present study addresses these aforesaid drawbacks of the existing literature.
Based on the above-reported arguments, the objective of this study is to reinvestigate the impact of CCMT on COE for the top five carbon emitters of the transport sector2 (i.e., China, India, Russia, United States, and Brazil). This set of countries is also the world’s leading economy, with a significant rate of EG. Also, these countries consume a major chunk of global energy, thereby emitting a profound quantity of greenhouse gas emissions. Besides, these countries lead the world in terms of population and area. Therefore, they consist of an extensive transportation system that requires tons of energy and produces enormous emissions.
Hence, the current study has three contributions compared to the existing body of knowledge. First, this is the first strive to explore the impact of CCMT on COE for top emitters of the transport sector, namely China, India, Russia, the US, and Brazil. Second, based on our best knowledge, this is the first endeavor that employs the panel quantile regression (PQR) approach to discern the impact of CCMT on COE. The panel quantile regression (PQR) methodology captures the heterogeneous impact of CCMT on various quantiles of COE. Third, we employ Dumitrescu and Hurlin (2012) causality test (henceforth D-H test), which is insusceptible to cross-sectional dependence, slope heterogeneity, and unobserved heterogeneity, and thus provides reliable results (Husnain et al., 2022).
Literature
This section is segregated into two parts. The first part explores the drivers of aggregate/total carbon emissions, while the second section highlights the determinants of emissions in the transport sector. Also, the summary of literature in a smart chart format is depicted in Figure 1.
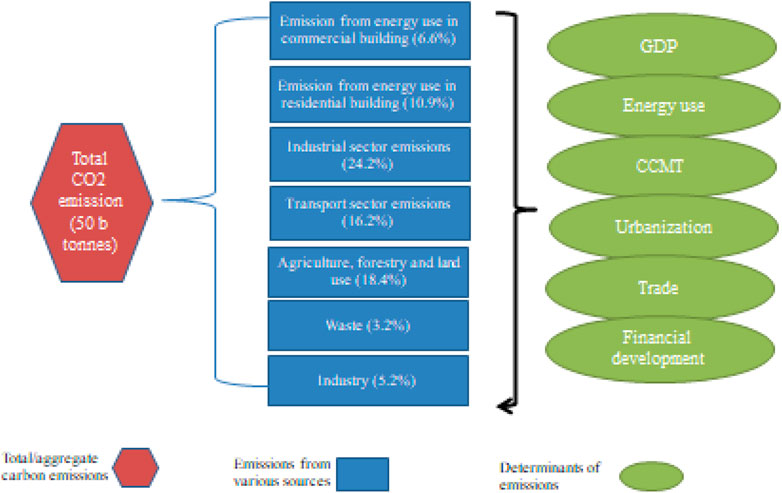
FIGURE 1. Summary of literature.
Determinants of Aggregate/Total Carbon Emissions
A plethora of literature related to environmental economics discerns the impact of EG on emissions, with the Environmental Kuznets Curve (EKC) being the most critical hypothesis to test (Grossman and Krueger, 1991). Energy efficiency also plays a pivotal role in curbing COE. For instance, Liobikienė et al. (2019) noted that EG reduces COE in the presence of improved energy efficiency. Contrarily, EN is a key determinant of COE. Several researchers conclude that non-renewable energy is accountable for COE (Erdogan et al., 2020). Since renewable energy is considered low-carbon energy, its use will result in the decline of COE (Lee et al., 2017; Hu et al., 2018). Syed et al. (2022) investigate whether economic policy uncertainty affects emissions in BRICST countries, and the outcomes of the study document that policy uncertainty escalates emissions. Syed and Bouri (2021) apply bootstrap ARDL to examine whether policy uncertainty affects emissions in the United States. The authors find that policy uncertainty has a heterogeneous effect on carbon emissions across the long- and short-run. Similarly, Bhowmik et al. (2022), using a dynamic ARDL approach, shows that monetary policy uncertainty increases emissions, fiscal policy uncertainty impedes emissions, and trade policy uncertainty does not affect the volume of emissions. Like policy uncertainty, geopolitical risk can also affect emissions. Anser et al. (2021a) found that geopolitical risk leads to higher emissions in BRICS countries. Hashmi et al. (2021), using the bootstrap ARDL approach, observed that higher geopolitical risk triggers the use of non-renewables which escalates emissions. Anser et al. (2021b) test the validity of the Environmental Phillips Curve (EPC) in BRICST economies and found that the EPC holds true. Similar findings are reported by Bhowmik et al. (2022) in the United States. Valeria and Giovanna (2022) show that corporate governance strategies reduce firm-level emissions. In the case of India, Irfan et al. (2022) divulge that technological and infrastructural factors, in consort with financial and political factors, are the key barriers to biomass energy, which impedes emissions levels. Tang et al. (2022) validate the financial resource curse hypothesis and also confirm that business regulations moderate the finance-resources relationship. Gentile et al. (2022) reveal that the CCMT reduces carbon emissions and is cheaper to plunge emissions than the conventional emissions capture system. Khan et al. (2022) argue that energy trilemma and clean energy transition improve the environmental quality. Likewise, Zhang et al. (2022) revealed that ICT decreases emissions while education and EG escalate the levels of emissions in selected developing countries. Parallel to this, Kassouri (2022) uses a quantile-based approach and reports that fiscal decentralization has an asymmetric impact on public energy research development and demonstration in selected developed countries. Muhammad and Khan (2021) noted that EG, FDI, and globalization escalate emissions. Similarly, Murshed et al. (2021) reveal that EG, globalization, urbanization, and renewable electricity are the key drivers of carbon emissions. Hussain et al. (2022) mentioned that environment-related technology can decrease environmental degradation in developing countries by gradually switching from old to modern technologies. Yu and Du (2019) point out that environment-friendly technology or innovation significantly reduces emissions. Wang et al. (2019) noted that the impact of new technological development significantly mitigates emissions. Similarly, Cheng et al. (2021) find that technological innovation significantly mitigates emissions in OECD countries. Moore et al. (2021) also highlight that CCMT has a significant role in decreasing emissions.
Determinants of Carbon Emissions in the Transport Sector
Several studies highlight that economic growth (EG) is an indispensable driver of emissions in the transport sector (Andreoni and Galmarini, 2012; Chandran and Tang, 2013). Zhang and Nian (2013) use the STIRPAT model to explore transport-related emissions and found that EG, EN, and population increase emissions. Liddle (2015) validates the EKC for the transport sector. In the transport sector, energy is undoubtedly a key driver of emissions. Anwar et al. (2021) showed that public-private investment is also a key driver of emissions. EN is an essential source of transport emissions (Mohsin et al., 2019). Lu et al. (2020) explore the direct and indirect effects of EN on emissions. The study reports that the level of emissions witnessed an upsurge due to the transportation sector development in China. Ahmed et al. (2020) also found similar results in India- that the EN causes an upsurge in emissions.
Recently, Pani et al. (2021) investigated the drivers of transport emissions in India and highlighted that urbanized areas produce higher emissions than the less urbanized regions. Similar findings are reported by Habib et al. (2021) in G20 countries. Robaina and Neves (2021) explore the relationship between the transport sector, EG, and emissions in Europe. The study notes that an upsurge in the number of electric vehicles reduces carbon emissions. Georgatzi et al. (2020) examined whether CCMT affected the transport sector emissions in selected European countries and noted that CCMT significantly plunges emissions. Sajid et al. (2022) highlighted that investment in technology can help to decrease emissions in the transport sector.
Model and Data
This section briefly presents the empirical model and provides details on the selected dataset. In the literature on environmental economics, the EKC framework is considered a core empirical model to explore the socio-economic drivers of COE (Syed and Bouri, 2021). Therefore, following the study of Hashmi et al. (2021), this study also uses the EKC framework to test the impact of CCMT on COE. The model used in this study is highlighted as follows:
COE denotes carbon dioxide emissions in the transport sector, EG reflects GDP per capita, EG2 represents the square of GDP per capita, EN denotes energy consumption, and CCMT is climate change mitigation technologies related to the transport sector. To validate the EKC hypothesis, EG should be positive, while EG2 needs to be negative. Further, the expected sign for EN is positive, while we expect CCMT to be negative as it has GHG reducing effect. It is worth noting that the EKC3 is a widely used theoretical and empirical framework in the literature on environmental economics. The theory of EKC argues that EG escalates emissions whereas it decreases emissions once EG exceeds a certain level (Bilgili et al., 2016). The EKC, which is an inverted U-shape relationship between EG and emissions, notes that EG is linked with emissions through scale, composition, and technique effect. Similarly, EN (i.e., a control variable in this study) also theoretically affects emissions as energy sources mostly contain fossil fuels that transmit emissions (Syed et al., 2022). CCMT improves energy efficiency, which in turn plunges emissions. Moreover, CCMT has also been upsurging the use of renewable energy, which is regarded as low carbon energy, and hence emissions witnessed a reduction (Georgatzi et al., 2020).
Regarding the details of the dataset, the present study uses panel data covering 1999–2015 for the top five carbon emitter countries4, namely China, United States, India, Brazil, and Russia. Next, COE (measured in percentage of total fuel combustion) is used as a dependent variable. While EG (GDP per capita—measured in constant $2015), EG2 (square of EG), and EN (energy consumption—measured in kg oil equivalent per capita) are employed as control variables. The independent variable of interest is climate change mitigation technologies in the transport sector (CCMT), which is measured as the ratio of environment-related patents in total patents. The data on the COE, EG, and EN are collected from the World Development Indicators (WDI), whereas the OECD database is used to obtain the data on CCMT. It is worth reporting that we converted the entire dataset into a natural logarithmic formation.
The descriptive statistics of the data used in the study is summarized in Table 1. EG has the highest mean value, while COE has the lowest mean value. Likewise, EG has the highest variation, and COE contains the lowest deviation. The entire dataset is positively skewed. In contrast, kurtosis confirms that the dataset does not contain the fat tail. Finally, the entire dataset is distributed non-normally except for EG, which has a normal distribution. It is extensively reported in the prior literature that traditional least square-based methodologies can come up with unreliable results if the dataset is non-normally distributed (Khalid et al., 2021; Syed et al., 2022). This motivates the application of the PQR approach, which is reliable even if the dataset follows a non-normal distribution (Li et al., 2022).
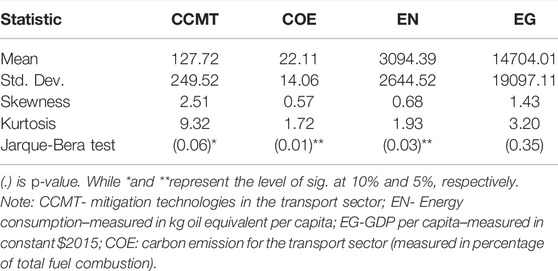
TABLE 1. Descriptive statistics.
This study also uses the q-q plot to explore graphically whether the dataset is normally distributed. Figures 1–4 depict q-q plots for the considered variables. In the q-q plots, the diagonal line represents the normality of data, while the blue dotted line shows the actual distribution of the variable. The deviation of the blue dotted line from the diagonal line expresses that the data are non-normally distributed. In Figures 2–5, the blue dotted line diverges from the diagonal line for all variables, indicating that the dataset used in the study is distributed non-normally.
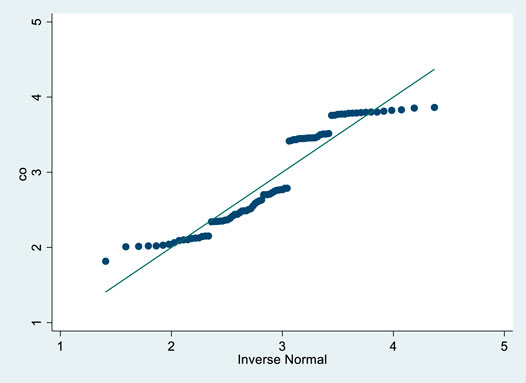
FIGURE 2. COE.
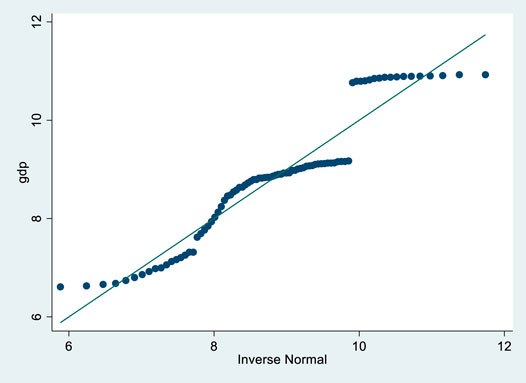
FIGURE 3. EG.
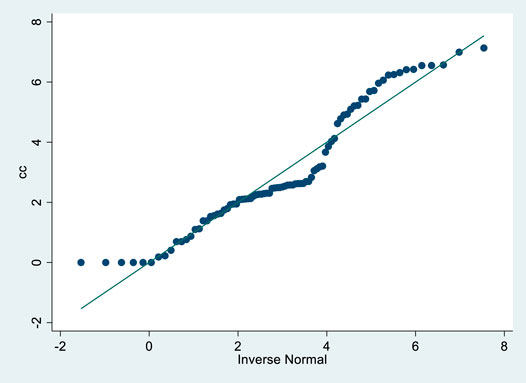
FIGURE 4. CCMT.
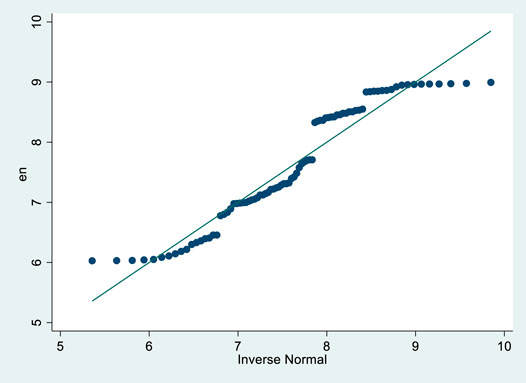
FIGURE 5. EN.
Methodology
In the prior literature, it is well-cited that OLS regression gives an unbiased estimator with a minimum variance if: 1) disturbance term in OLS regression contains zero mean, and it follows an identical distribution (iid); and 2) disturbance term is normally distributed. Da Silva et al. (2016) noted that these assumptions mentioned above are not satisfied most of the time, leading to unreliable results. To avoid the deficiency of OLS regression, Koenker and Bassett (1978) put forward the quantile regression (QR) approach. Quantile regression (QR) has certain merits, for instance, 1) the QR does not use any assumption related to the occurrence of moment function (Zhu et al., 2016); 2) QR gives relatively truthful and robust outcomes if outliers and fat tail distribution occur in the dataset (Bera et al., 2016); 3) Quantile regression (QR) does not establish any assumption related to the distribution (Sherwood and Wang, 2016). Based on these properties of Quantile regression (QR), this study employs this methodology.
Equation 2 yields the conditional quantile
In Eq. 3,
In Eq. 4, i and t respectively note country and year. k shows the quantile while
Empirical Findings
The current section presents the empirical findings, and the steps we follow are depicted in Figure 6. While handling the panel dataset, the occurrence of cross-sectional dependence (CSD) can be critical for the reliability of the results. The CSD holds if the shock in any of the cross-sections has a spillover effect to other cross-sections. Hence, it is indispensable to test for the CSD to check for the reliability of the findings. Various CSD testing approaches have been developed in econometrics literature, Pesaran (2007) CSD test other being the most extensively used test. Hence, including Pesaran (2007) CSD test, we use the other three tests, namely, i.e., Pesaran test, Frees test, and the Friedman test, to discern the presence of CSD in this study.
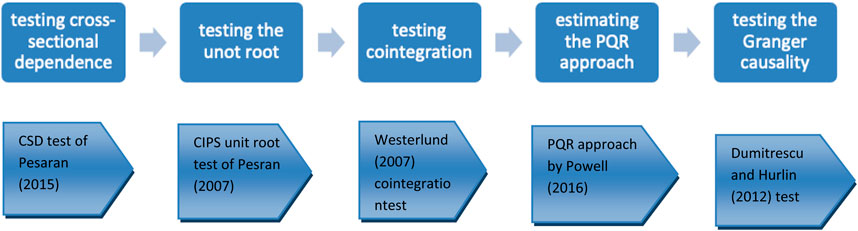
FIGURE 6. Route of Methodology.
Table 2 highlights the findings from the CSD tests. The Ho of these tests mentioned above is the absence of CSD where the alternate hypothesis assumes vice versa. As shown in Table 2, we can reject the Ho for all tests. Hence, it could be noted that there is an occurrence of CSD in our case.
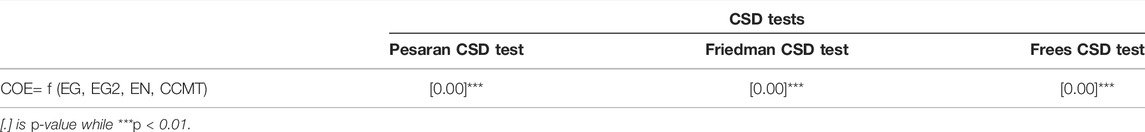
TABLE 2. Testing CSD.
After testing the CSD, we perform the unit root test. It is crucial to test for the unit root as disregarding it could lead the pseudo findings. In panel data econometrics, second-generation unit root tests have been extensively used because of their ability to handle the CSD. Therefore, we also apply the second-generation unit root test (i.e., the CIPS test). The findings from the CIPS test are provided in Table 3. The Ho of the CIPS test assumes of the absence of unit root where the alternate hypothesis vice versa. As depicted in Table 3, we cannot reject Ho at level, indicating that the dataset contains the unit root at the level. Contrarily, we can reject the Ho at the first difference for the entire dataset, implying that the dataset is stationary at the first difference.
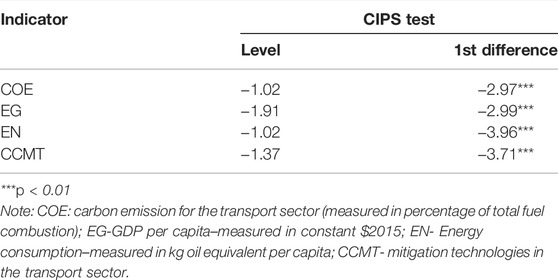
TABLE 3. CIPS test.
The next step is to discern the cointegration, which notes whether there is a long-run relationship among the chosen variables. To this end, we employ Westerlund (2007) test, which can handle the CSD. The Ho of this test mentioned above expounds no cointegration while the alternate hypothesis notes vice versa. The outcomes from Westerlund (2007) test are presented in Table 4. We can reject the Ho in the case of all four statistics of the Westerlund test. Thus, it confirms that cointegration holds among the chosen variables of this study.
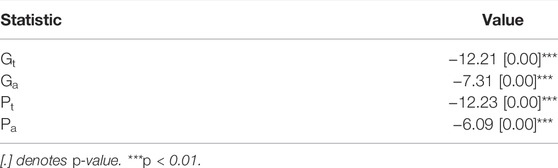
TABLE 4. Testing cointegration.
Thereafter, we report the findings from the panel quantile regression (PQR) approach at 10th, 25th, 50th, 75th, and 90th quantiles. We also estimate the fixed effect model to compare its results with the panel quantile regression (PQR) approach and included the results in Table 5. With regard to the findings from the fixed-effect model, the EG is statistically significant with a positive coefficient, while EG2 is insignificant. Therefore, we conclude that the Environment Kuznets Curve (EKC) hypothesis does not hold in the case of the top five transport emitter countries as it requires both EG and EG2 to be statistically significant with a positive and negative coefficient, respectively. Next, EN–in kg oil equivalent per capita is negative and statistically significant, implying that the use of renewable energy mitigates COE. Finally, CCMT is negative and statistically significant, indicating that CCMT reduces emissions. The value of CCMT is 0.136, indicating that a 1% increase in CCMT reduces emissions by 0.136%. It is worth mentioning that the fixed-effects model assumes the normality assumption, and some of the findings from this model (e.g., results of the EKC and EN) are not in line with the theory. Thus, applying the quantile regression (QR) approach is inevitable if the normality assumption violates.
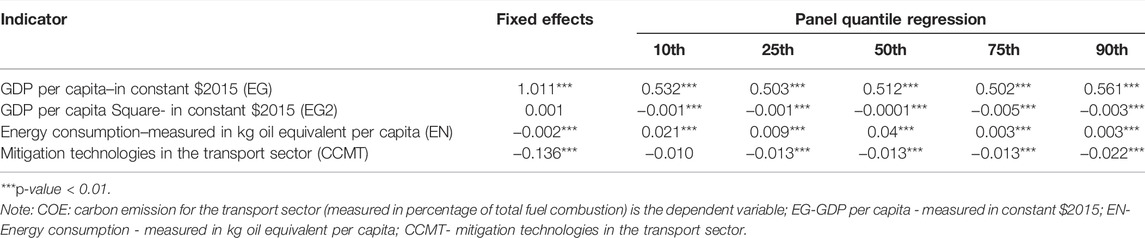
TABLE 5. Empirical findings from the panel quantile regression (PQR) approach.
In the case of the panel quantile regression (PQR) approach, the 10th and 25th quantiles are regarded as the lower quantiles, the 50th quantile is considered the middle quantile, while 75th and 90th quantiles are considered are the higher quantiles. EN is statistically significant and positive across the quantiles, whereas EG2 is negative and statistically significant across all quantiles. This implies that EG escalates COE, and after a certain level, it curbs the COE. Thereby, we conclude that the EKC holds in this analysis. The results are also backed by the studies of Bilgili et al. (2021), Anser et al. (2021a), Anser et al. (2021b), and Bilgili et al. (2022). The sign of EN is positive with statistical significance at a 1% level across the distribution. This indicates that energy use escalates transport-related carbon emission COE in low-, middle-, and higher- emitters. Moreover, the impact of EN is relatively high at lower quantiles. Similar outcomes are reported by Bilgili et al. (2016) and Bashir et al. (2022).
Regarding CCMT, the coefficient is negative and statistically significant at all quantiles except the 10th quantile, which is insignificant. This implies that an increase in CCMT mitigates COE in top emitter countries at the 25th, 50th, 75th, and 90th quantile. At the 10th quantile (countries with lower levels of transport sector emissions), CCMT is found to be ineffective. The latent reasons could be that these CCMT are not properly used in the transport sector. The high cost of CCMT, complex procedure to adopt CCMT, and lack of bindings from the government to use CCMT could hinder inappropriate usage of CCMT in the low emitter countries. At the 25th, 50th, and 75th quantile, CCMT is 0.013. This indicates that a 1% upsurge in CCMT decreases the COE by 0.013%. These results highlight that CCMT improves energy efficiency and exacerbates renewables use. As a result, the proper usage of the CCMT curbs emissions. Next, the CCMT is −0.022 at the 90th quantile, reporting that a 1% growth in CCMT decreases the COE by 0.22%. It is worth reporting that the impact of CCMT is heterogeneous across the quantiles, which could not be captured using conventional methodologies (e.g., fixed effect model, etc.). These results are almost similar to Alatas (2021), which argues that environment-related technologies curb transport-related emissions in OECD countries. The key findings from the PQR approach are graphically delineated in Figure 7.
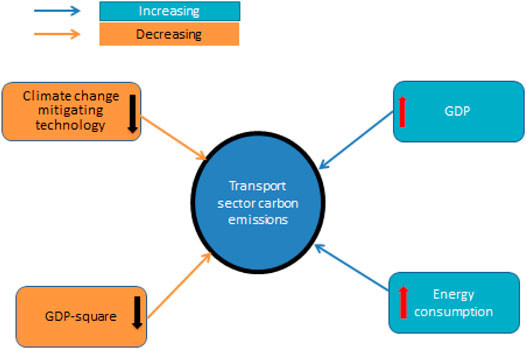
FIGURE 7. Graphical representation of the key findings.
Next, we employ a pooled mean group-auto regressive distributed lags (PMG-ARDL) approach as a sensitivity analysis to see whether our baseline findings from the PQR approach are consistent with a dynamic regression approach (i.e., PMG-ARDL model). The findings are reported in Table 6.
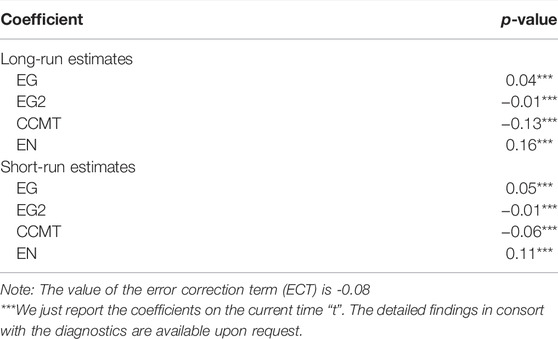
TABLE 6. Findings from PMG-ARDL model.
As depicted in Table 6, all coefficients are statistically significant in both the short- and long-run, which implies that EG, EN, and CCMT affect COE. In the long-run, the coefficient of CCMT is -0.13, expressing that a 1% increase in CCMT plunges the COE by 0.13%. While EG and EG2 are positive and negative, respectively, and this shows that the EKC holds in the long-run. Further, the coefficient on EN is positive, indicating that energy consumption leads to higher COE. Similarly, in the short-run, the coefficient of CCMT is −0.06, which illustrates that a 1% increase in CCMT fosters a 0.06% reduction in COE. We also validate the existence of the EKC in the short-run. Further, the positive coefficient of EN indicates that energy use contributes to COE. It is worth reporting that the key findings from the PMG-ARDL approach are supported by the findings of the PQR approach, which divulges that CCMT impedes COE.
Finally, we employ the D-H causality test to inspect the direction of causality, and the result is presented in Table 7. As shown in Table 6, there is unidirectional causality from CCMT to COE, indicating that a change in CCMT will affect COE, whereas any change in COE will not alter CCMT. Further, there is unidirectional causality from CCMT to EN, which implies that CCMT affects the use of energy, but vice versa is not valid. We observe the bidirectional causality between EG and CCMT. This notes that economic growth leads to higher CCMT, and CCMT also impacts economic growth. Next, we find a unidirectional causality from EG to EN, which shows that economic growth leads to higher energy use. Thus, we validate the conservation hypothesis in top emitters in the transport sector.
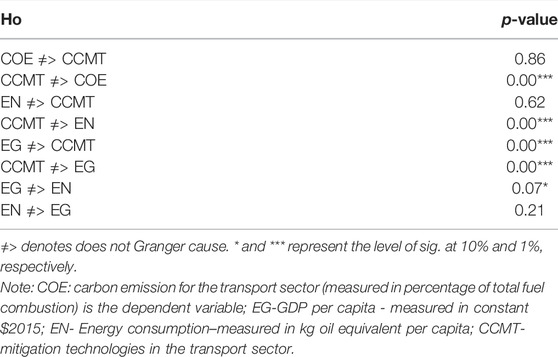
TABLE 7. D-H causality test.
Future research should apply dynamic panel data methods to explore the long- and short-run impact of CCMT on emissions. Further, the asymmetric impact of CCMT on emissions can also be discerned in the future.
Conclusion and Policy Recommendations
The transport sector is a leading sector in terms of energy consumption, thereby emitting tons of carbon, especially in the last few decades. The emission from transport sectors is likely to increase due to increasing demand for transport. Therefore, policymakers, environmental scientists, and economists have been questing to explore the drivers of the transport sector emissions in consort with the factors that can curb emissions. Climate change mitigation technology (CCMT) is considered an option that can plunge emissions. However, there is scant empirical evidence on the nexus between CCMT and greenhouse gas (GHG) emissions. Hence, the present study explored whether CCMT impedes transport sector emissions (COE) in the top five transport sector emitters countries. We used the panel quantile regression (PQR) approach, which examines the heterogeneous impact of CCMT on low-, middle-, and high-level emissions. We found the validity of the environmental Kuznets curve (EKC) hypothesis. The findings revealed that at the lowest quantile (i.e., 10th quantile), CCMT does not affect emissions. Next, CCMT mitigated emissions at all other quantiles. Also, the impact of CCMT on emissions is the strongest at the highest quantile (i.e., 90th quantile). Next, EN upsurged the COE at all quantiles.
Additionally, the D-H causality test findings reported that unidirectional causality runs from CCMT to COE and EN. In contrast, bidirectional causality was observed between EG and CCMT. Finally, unidirectional causality runs from EG to EN. We propose few policy recommendations. First, the validity of the EKC hypothesis confirms that EG is an avenue to curb COE. Therefore, the selected countries need to focus on improving EG by initiating policies that help achieve higher EG. Next, to achieve a higher EG without deteriorating the environmental quality, the selected countries need to use renewable energy resources. Further, there should be an investment in human capital, R&D, and innovations that might lead to sustainable EG. Since EN upsurges the COE, policies should be initiated to discourage non-renewable energy sources. For this purpose, environmental/carbon taxes should be introduced on non-renewables, while renewable energy usage should be encouraged. The positive impact of CCMT in curbing COE in all quantiles, except the 10th quantile, implies that there should be more and more utilization of CCMT in the lower-, middle-, and high-emission countries. To escalate the use of CCMT, these countries should invest in R&D related to environmental technology. The high-emission countries need to pay attention to increase the number of CCMT since the role of CCMT is the strongest for the high-emission countries.
Next, to increase CCMT, there should be social awareness programs. To get benefit from the CCMT, countries should share their technologies with each other. Not only this, countries should collaborate to produce efficient CCMT. Also, there should be incentives for individuals (e.g., tax exemptions, etc.) for the individuals who use products having high levels of CCMT. The governments of selected countries should escalate subsidized public transport services which will decrease the privately-owned transportation (e.g., vehicles, ships, jets, etc.). Not only this, governments should introduce public transportation with high CCMT, which will reduce COE. The causality analysis shows that EG and CCMT cause each other; therefore, achieving higher levels of CCMT can be an option to escalate EG, and vice versa. Next, the validity of the conservation hypothesis notes that policies to conserve energy will not adversely impact EG; therefore, the selected countries should initiate energy conservation policies.
Regarding the limitations of this study, the data on CCMT is unavailable for most developing countries, which hinders exploring the CCMT-COE nexus in the aforesaid countries. Also, a relatively small dataset does not allow for incorporating several control variables because, by doing so, the model could be comprised of a low degree of freedom. Next, a relatively small panel dataset discourages us from using several recent methodologies, such as the dynamic panel quantile regression approach by Harding et al. (2020). Regarding future research directions, researchers can employ dynamic panel methodologies such as CS-ARDL, AMG, and CCMG estimators. Moreover, the CCMT-COE nexus could be explored for other sectors, such as the industrial and commercial sectors, among others.
Data Availability Statement
Publicly available datasets were analyzed in this study. This data can be found here: https://stats.oecd.org/Index.aspx?DataSetCode=EPS.
Author Contributions
RB: led the conceptualization of the research idea, data cleaning, analysis, write up, editing and structuring, revision. QS: led and contributed in conceptualization of the research idea, data cleaning, analysis, write up, editing and structuring, revision. DR: contributed in conceptualization of the research idea, data cleaning, analysis, write up, editing and structuring, revision.
Funding
Financial support for the data analysis and preparation of the manuscript and open access was provided by the Asian Development Bank Institute (ADBI), Japan.
Author Disclaimer
The views expressed here are those of the authors and do not necessarily reflect the views of the authors’ institutions, or ADBI, and the usual disclaimer applies.
Conflict of Interest
The authors declare that the research was conducted in the absence of any commercial or financial relationships that could be construed as a potential conflict of interest.
Publisher’s Note
All claims expressed in this article are solely those of the authors and do not necessarily represent those of their affiliated organizations, or those of the publisher, the editors, and the reviewers. Any product that may be evaluated in this article, or claim that may be made by its manufacturer, is not guaranteed or endorsed by the publisher.
Acknowledgments
We would like to thank the Asian Development Bank Institute (ADBI), Japan, for the support. Authors would like to thank the handling editor and reviewers for their comments and suggestions on the paper. The views expressed here are those of the authors and do not necessarily reflect the views of the authors’ institutions, ADBI, and shall not be used for advertising purposes.
Footnotes
1https://joint-research-centre.ec.europa.eu/scientific-activities-z/transport-sector-economic-analysis_en#:∼:text=Transport%20plays%20an%20important%20role,gross%20domestic%20product%20(GDP).
2https://www.wri.org/insights/everything-you-need-know-about-fastest-growing-source-global-emissions-transport#:∼:text=The%2010%20countries%20with%20the,%2C%20Germany%2C%20Mexico%20and%20Iran.
3For the detailed theortetical understanding on the EKC approach, please see Bibi and Jamil (2021).
4In 2015, the per capita carbon dioxide emissions in the selected countries are as follows: 44.75 metric tons per capita (MTPC) in Brazil, 8.60 MTPC in China, 11.47 MTPC in India, 16.24 MTPC in Russia, and 33.39 MTPC in the United States.
References
Ahmed, Z., Ali, S., Saud, S., and Shahzad, S. J. H. (2020). Transport CO2 Emissions, Drivers, and Mitigation: An Empirical Investigation in India. Air Qual. Atmos. Health 13 (11), 1367–1374. doi:10.1007/s11869-020-00891-x
Alataş, S. (2021). The Role of Information and Communication Technologies for Environmental Sustainability: Evidence from a Large Panel Data Analysis. J. Environ. Manag. 293, 112889. doi:10.1016/j.jenvman.2021.112889
Amin, A., Altinoz, B., and Dogan, E. (2020). Analyzing the Determinants of Carbon Emissions from Transportation in European Countries: The Role of Renewable Energy and Urbanization. Clean. Techn Environ. Policy 22 (8), 1725–1734. doi:10.1007/s10098-020-01910-2
Andreoni, V., and Galmarini, S. (2012). Decoupling Economic Growth from Carbon Dioxide Emissions: A Decomposition Analysis of Italian Energy Consumption. Energy 44 (1), 682–691. doi:10.1016/j.energy.2012.05.024
Anser, M. K., Apergis, N., Syed, Q. R., and Alola, A. A. (2021b). Exploring a New Perspective of Sustainable Development Drive through Environmental Phillips Curve in the Case of the BRICST Countries. Environ. Sci. Pollut. Res. 28 (35), 48112–48122. doi:10.1007/s11356-021-14056-5
Anser, M. K., Syed, Q. R., and Apergis, N. (2021a). Does Geopolitical Risk Escalate CO2 Emissions? Evidence from the BRICS Countries. Environ. Sci. Pollut. Res. 28 (35), 48011–48021. doi:10.1007/s11356-021-14032-z
Anwar, A., Sharif, A., Fatima, S., Ahmad, P., Sinha, A., Rehman Khan, S. A., et al. (2021). The Asymmetric Effect of Public Private Partnership Investment on Transport CO2 Emission in China: Evidence from Quantile ARDL Approach. J. Clean. Prod. 288, 125282. doi:10.1016/j.jclepro.2020.125282
Arvin, M. B., Pradhan, R. P., and Norman, N. R. (2015). Transportation Intensity, Urbanization, Economic Growth, and CO2 Emissions in the G-20 Countries. Util. Policy 35, 50–66. doi:10.1016/j.jup.2015.07.003
Bashir, M. F., Ma, B., Hussain, H. I., Shahbaz, M., Koca, K., and Shahzadi, I. (2022). Evaluating Environmental Commitments to COP21 and the Role of Economic Complexity, Renewable Energy, Financial Development, Urbanization, and Energy Innovation: Empirical Evidence from the RCEP Countries. Renew. Energy 184, 541–550. doi:10.1016/j.renene.2021.11.102
Bera, A. K., Galvao, A. F., Montes-Rojas, G. V., and Park, S. Y. (2016). Asymmetric Laplace Regression: Maximum Likelihood, Maximum Entropy and Quantile Regression. J. Econ. Method. 5 (1), 79–101. doi:10.1515/jem-2014-0018
Berg, C. N., Deichmann, U., Liu, Y., and Selod, H. (2017). Transport Policies and Development. J. Dev. Stud. 53 (4), 465–480. doi:10.1080/00220388.2016.1199857
Bhowmik, R., Patnaik, B. C. M., Patnaik, B. C. M., Debnath, G. C., and Satpathy, I. (2020). Impact of Carbon Tax Scheme and CO2 Control Technologies on Bangladesh Aviation Industry. Ijeat 9 (3), 54–62. doi:10.35940/ijeat.b3408.029320
Bhowmik, R., Syed, Q. R., Apergis, N., Alola, A. A., and Gai, Z. (2022). Applying a Dynamic ARDL Approach to the Environmental Phillips Curve (EPC) Hypothesis amid Monetary, Fiscal, and Trade Policy Uncertainty in the USA. Environ. Sci. Pollut. Res. 29 (10), 14914–14928. doi:10.1007/s11356-021-16716-y
Bilgili, F., Khan, M., and Awan, A. (2022). Is There a Gender Dimension of the Environmental Kuznets Curve? Evidence from Asian Countries. Environ. Dev. Sustain. 1, 1–32. doi:10.1007/s10668-022-02139-3
Bilgili, F., Koçak, E., and Bulut, Ü. (2016). The Dynamic Impact of Renewable Energy Consumption on CO 2 Emissions: A Revisited Environmental Kuznets Curve Approach. Renew. Sustain. Energy Rev. 54, 838–845. doi:10.1016/j.rser.2015.10.080
Bilgili, F., Nathaniel, S. P., Kuşkaya, S., and Kassouri, Y. (2021). Environmental Pollution and Energy Research and Development: An Environmental Kuznets Curve Model through Quantile Simulation Approach. Environ. Sci. Pollut. Res. 28 (38), 53712–53727. doi:10.1007/s11356-021-14506-0
Chan, Y. T. (2020). Are Macroeconomic Policies Better in Curbing Air Pollution Than Environmental Policies? A DSGE Approach with Carbon-dependent Fiscal and Monetary Policies. Energy Policy 141, 111454. doi:10.1016/j.enpol.2020.111454
Chandran, V. G. R., and Tang, C. F. (2013). The Impacts of Transport Energy Consumption, Foreign Direct Investment and Income on CO2 Emissions in ASEAN-5 Economies. Renew. Sustain. Energy Rev. 24, 445–453. doi:10.1016/j.rser.2013.03.054
Chen, Y., and Lee, C.-C. (2020). Does Technological Innovation Reduce CO2 emissions?Cross-Country Evidence. J. Clean. Prod. 263, 121550. doi:10.1016/j.jclepro.2020.121550
Cheng, C., Ren, X., Dong, K., Dong, X., and Wang, Z. (2021). How Does Technological Innovation Mitigate CO2 Emissions in OECD Countries? Heterogeneous Analysis Using Panel Quantile Regression. J. Environ. Manag. 280, 111818. doi:10.1016/j.jenvman.2020.111818
Cozzi, L., Gould, T., Bouckart, S., Crow, D., Kim, T. Y., Mcglade, C., et al. (2020). World Energy Outlook 2050, 1–461.
Da Silva, P. P., Moreno, B., and Figueiredo, N. C. (2016). Firm-specific Impacts of CO2 Prices on the Stock Market Value of the Spanish Power Industry. Energy Policy 94, 492–501. doi:10.1016/j.enpol.2016.01.005
Destek, M. A., and Sinha, A. (2020). Renewable, Non-renewable Energy Consumption, Economic Growth, Trade Openness and Ecological Footprint: Evidence from Organisation for Economic Co-operation and Development Countries. J. Clean. Prod. 242, 118537. doi:10.1016/j.jclepro.2019.118537
Dong, K., Sun, R., and Hochman, G. (2017). Do natural Gas and Renewable Energy Consumption Lead to Less CO2 Emission? Empirical Evidence from a Panel of BRICS Countries. Energy 141, 1466–1478. doi:10.1016/j.energy.2017.11.092
D’Orazio, P., and Dirks, M. W. (2022). Exploring the Effects of Climate-Related Financial Policies on Carbon Emissions in G20 Countries: a Panel Quantile Regression Approach. Environ. Sci. Pollut. Res. 29 (5), 7678–7702. doi:10.1007/s11356-021-15655-y
Dumitrescu, E.-I., and Hurlin, C. (2012). Testing for Granger Non-causality in Heterogeneous Panels. Econ. Model. 29 (4), 1450–1460. doi:10.1016/j.econmod.2012.02.014
Durmaz, T. (2018). The Economics of CCS: Why Have CCS Technologies Not Had an International Breakthrough? Renew. Sustain. Energy Rev. 95, 328–340. doi:10.1016/j.rser.2018.07.007
EIA (2020). Annual Energy Outlook 2020. Washington, DC: Energy Information Administration, 1672–1679.
Erdogan, S., Okumus, I., and Guzel, A. E. (2020). Revisiting the Environmental Kuznets Curve Hypothesis in OECD Countries: The Role of Renewable, Non-renewable Energy, and Oil Prices. Environ. Sci. Pollut. Res. 27 (19), 23655–23663. doi:10.1007/s11356-020-08520-x
Fan, J.-L., Da, Y.-B., Wan, S.-L., Zhang, M., Cao, Z., Wang, Y., et al. (2019). Determinants of Carbon Emissions in 'Belt and Road Initiative' Countries: A Production Technology Perspective. Appl. Energy 239, 268–279. doi:10.1016/j.apenergy.2019.01.201
Galvao, A. F., and Kato, K. (2016). Smoothed Quantile Regression for Panel Data. J. Econ. 193 (1), 92–112. doi:10.1016/j.jeconom.2016.01.008
Gentile, G., Bonalumi, D., Pieterse, J. A. Z., Sebastiani, F., Lucking, L., and Manzolini, G. (2022). Techno-economic Assessment of the FReSMe Technology for CO2 Emissions Mitigation and Methanol Production from Steel Plants. J. CO2 Util. 56, 101852. doi:10.1016/j.jcou.2021.101852
Georgatzi, V. V., Stamboulis, Y., and Vetsikas, A. (2020). Examining the Determinants of CO2 Emissions Caused by the Transport Sector: Empirical Evidence from 12 European Countries. Econ. Analysis Policy 65, 11–20. doi:10.1016/j.eap.2019.11.003
Godil, D. I., Yu, Z., Sharif, A., Usman, R., and Khan, S. A. R. (2021). Investigate the Role of Technology Innovation and Renewable Energy in Reducing Transport Sector CO 2 Emission in China: A Path toward Sustainable Development. Sustain. Dev. 29 (4), 694–707. doi:10.1002/sd.2167
Grossman, G., and Krueger, A. (1991). Environmental Impacts of a North American Free Trade Agreement. Cambridge, MA: National Bureau of Economic Research. doi:10.3386/w3914
Habib, Y., Xia, E., Hashmi, S. H., and Ahmed, Z. (2021). The Nexus between Road Transport Intensity and Road-Related CO2 Emissions in G20 Countries: An Advanced Panel Estimation. Environ. Sci. Pollut. Res. 28 (41), 58405–58425. doi:10.1007/s11356-021-14731-7
Hanif, I. (2018). Impact of Economic Growth, Nonrenewable and Renewable Energy Consumption, and Urbanization on Carbon Emissions in Sub-saharan Africa. Environ. Sci. Pollut. Res. 25 (15), 15057–15067. doi:10.1007/s11356-018-1753-4
Harding, M., Lamarche, C., and Pesaran, M. H. (2020). Common Correlated Effects Estimation of Heterogeneous Dynamic Panel Quantile Regression Models. J. Appl. Econ. 35 (3), 294–314. doi:10.1002/jae.2753
Hashmi, S. M., Bhowmik, R., Inglesi-Lotz, R., and Syed, Q. R. (2021). Investigating the Environmental Kuznets Curve Hypothesis amidst Geopolitical Risk: Global Evidence Using Bootstrap ARDL Approach. Environ. Sci. Pollut. Res. 29, 24049–24062. doi:10.1007/s11356-021-17488-1
Hu, H., Xie, N., Fang, D., and Zhang, X. (2018). The Role of Renewable Energy Consumption and Commercial Services Trade in Carbon Dioxide Reduction: Evidence from 25 Developing Countries. Appl. Energy 211, 1229–1244. doi:10.1016/j.apenergy.2017.12.019
Huisingh, D., Zhang, Z., Moore, J. C., Qiao, Q., and Li, Q. (2015). Recent Advances in Carbon Emissions Reduction: Policies, Technologies, Monitoring, Assessment and Modeling. J. Clean. Prod. 103, 1–12. doi:10.1016/j.jclepro.2015.04.098
Husnain, M. I. U., Haider, A., and Khan, M. A. (2021). Does the Environmental Kuznets Curve Reliably Explain a Developmental Issue? Environ. Sci. Pollut. Res. 28 (9), 11469–11485. doi:10.1007/s11356-020-11402-x
Hussain, M., Mir, G. M., Usman, M., Ye, C., and Mansoor, S. (2022). Analysing the Role of Environment-Related Technologies and Carbon Emissions in Emerging Economies: A Step towards Sustainable Development. Environ. Technol. 43 (3), 367–375. doi:10.1080/09593330.2020.1788171
Irfan, M., Elavarasan, R. M., Ahmad, M., Mohsin, M., Dagar, V., and Hao, Y. (2022). Prioritizing and Overcoming Biomass Energy Barriers: Application of AHP and G-TOPSIS Approaches. Technol. Forecast. Soc. Change 177, 121524. doi:10.1016/j.techfore.2022.121524
Jiang, J., Ye, B., and Liu, J. (2019). Peak of CO2 Emissions in Various Sectors and Provinces of China: Recent Progress and Avenues for Further Research. Renew. Sustain. Energy Rev. 112, 813–833. doi:10.1016/j.rser.2019.06.024
Kassouri, Y. (2022). Fiscal Decentralization and Public Budgets for Energy RD&D: A Race to the Bottom? Energy Policy 161, 112761. doi:10.1016/j.enpol.2021.112761
Khalid, K., Usman, M., and Mehdi, M. A. (2021). The Determinants of Environmental Quality in the SAARC Region: A Spatial Heterogeneous Panel Data Approach. Environ. Sci. Pollut. Res. 28 (6), 6422–6436. doi:10.1007/s11356-020-10896-9
Khan, I., Zakari, A., Zhang, J., Dagar, V., and Singh, S. (2022). A Study of Trilemma Energy Balance, Clean Energy Transitions, and Economic Expansion in the Midst of Environmental Sustainability: New Insights from Three Trilemma Leadership. Energy 248, 123619. doi:10.1016/j.energy.2022.123619
Koenker, R., and Bassett, G. (1978). Regression Quantiles. Econometrica 46, 33–50. doi:10.2307/1913643
Koenker, R. (2004). Quantile Regression for Longitudinal Data. J. Multivar. Analysis 91 (1), 74–89. doi:10.1016/j.jmva.2004.05.006
Kwon, D. S., Cho, J. H., and Sohn, S. Y. (2017). Comparison of Technology Efficiency for CO 2 Emissions Reduction Among European Countries Based on DEA with Decomposed Factors. J. Clean. Prod. 151, 109–120. doi:10.1016/j.jclepro.2017.03.065
Lamarche, C. (2011). Measuring the Incentives to Learn in Colombia Using New Quantile Regression Approaches. J. Dev. Econ. 96 (2), 278–288. doi:10.1016/j.jdeveco.2010.10.003
Lancaster, T. (2000). The Incidental Parameter Problem since 1948. J. Econ. 95 (2), 391–413. doi:10.1016/S0304-4076(99)00044-5
Lee, C. T., Hashim, H., Ho, C. S., Fan, Y. V., and Klemeš, J. J. (2017). Sustaining the Low-Carbon Emission Development in Asia and beyond: Sustainable Energy, Water, Transportation and Low-Carbon Emission Technology. J. Clean. Prod. 146, 1–13. doi:10.1016/j.jclepro.2016.11.144
Li, X., Ozturk, I., Syed, Q. R., Hafeez, M., and Sohail, S. (2022). Does Green Environmental Policy Promote Renewable Energy Consumption in BRICST? Fresh Insights from Panel Quantile Regression. London: Economic Research-Ekonomska Istraživanja, 1–17. doi:10.1080/1331677x.2022.2038228
Liddle, B. (2015). What Are the Carbon Emissions Elasticities for Income and Population? Bridging STIRPAT and EKC via Robust Heterogeneous Panel Estimates. Glob. Environ. Change 31, 62–73. doi:10.1016/j.gloenvcha.2014.10.016
Liobikienė, G., Butkus, M., and Matuzevičiūtė, K. (2019). The Contribution of Energy Taxes to Climate Change Policy in the European Union (EU). Resources 8 (2), 63. doi:10.3390/resources8020063
Liu, B., Tian, C., Li, Y., Song, H., and Ma, Z. (2018). Research on the Effects of Urbanization on Carbon Emissions Efficiency of Urban Agglomerations in China. J. Clean. Prod. 197, 1374–1381. doi:10.1016/j.jclepro.2018.06.295
Lu, Q., Chai, J., Wang, S., Zhang, Z. G., and Sun, X. C. (2020). Potential Energy Conservation and CO2 Emissions Reduction Related to China's Road Transportation. J. Clean. Prod. 245, 118892. doi:10.1016/j.jclepro.2019.118892
Lv, Q., Liu, H., Yang, D., and Liu, H. (2019). Effects of Urbanization on Freight Transport Carbon Emissions in China: Common Characteristics and Regional Disparity. J. Clean. Prod. 211, 481–489. doi:10.1016/j.jclepro.2018.11.182
Mohsin, M., Abbas, Q., Zhang, J., Ikram, M., and Iqbal, N. (2019). Integrated Effect of Energy Consumption, Economic Development, and Population Growth on CO2 Based Environmental Degradation: A Case of Transport Sector. Environ. Sci. Pollut. Res. 26 (32), 32824–32835. doi:10.1007/s11356-019-06372-8
Monioudi, I. Ν., Asariotis, R., Becker, A., Bhat, C., Dowding-Gooden, D., Esteban, M., et al. (2018). Climate Change Impacts on Critical International Transportation Assets of Caribbean Small Island Developing States (SIDS): The Case of Jamaica and Saint Lucia. Reg. Environ. Change 18 (8), 2211–2225. doi:10.1007/s10113-018-1360-4
Moore, B., Verfuerth, C., Minas, A. M., Tipping, C., Mander, S., Lorenzoni, I., et al. (2021). Transformations for Climate Change Mitigation: A Systematic Review of Terminology, Concepts, and Characteristics. WIREs Clim. Change 12 (6), e738. doi:10.1002/wcc.738
Moran, D., Wood, R., Hertwich, E., Mattson, K., Rodriguez, J. F. D., Schanes, K., et al. (2020). Quantifying the Potential for Consumer-Oriented Policy to Reduce European and Foreign Carbon Emissions. Clim. Policy 20 (Suppl. 1), S28–S38. doi:10.1080/14693062.2018.1551186
Muhammad, B., and Khan, M. K. (2021). Foreign Direct Investment Inflow, Economic Growth, Energy Consumption, Globalization, and Carbon Dioxide Emission Around the World. Environ. Sci. Pollut. Res. 28 (39), 55643–55654. doi:10.1007/s11356-021-14857-8
Murshed, M., Rashid, S., Ulucak, R., Dagar, V., Rehman, A., Alvarado, R., et al. (2021). Mitigating Energy Production-Based Carbon Dioxide Emissions in Argentina: the Roles of Renewable Energy and Economic Globalization. Environ. Sci. Pollut. Res. 29, 16939–16958. doi:10.1007/s11356-021-16867-y
Naderipour, A., Abdul-Malek, Z., Arshad, R. N., Kamyab, H., Chelliapan, S., Ashokkumar, V., et al. (2021). Assessment of Carbon Footprint from Transportation, Electricity, Water, and Waste Generation: Towards Utilisation of Renewable Energy Sources. Clean. Techn Environ. Policy 23 (1), 183–201. doi:10.1007/s10098-020-02017-4
Nasreen, S., Mbarek, M. B., and Atiq-ur-Rehman, M. (2020). Long-run Causal Relationship between Economic Growth, Transport Energy Consumption and Environmental Quality in Asian Countries: Evidence from Heterogeneous Panel Methods. Energy 192, 116628. doi:10.1016/j.energy.2019.116628
Nathaniel, S. P., and Iheonu, C. O. (2019). Carbon Dioxide Abatement in Africa: the Role of Renewable and Non-renewable Energy Consumption. Sci. Total Environ. 679, 337–345. doi:10.1016/j.scitotenv.2019.05.011
Nguyen, T. T., Pham, T. A. T., and Tram, H. T. X. (2020). Role of Information and Communication Technologies and Innovation in Driving Carbon Emissions and Economic Growth in Selected G-20 Countries. J. Environ. Manag. 261, 110162. doi:10.1016/j.jenvman.2020.110162
Pani, A., Sahu, P. K., and Holguín-Veras, J. (2021). Examining the Determinants of Freight Transport Emissions Using a Fleet Segmentation Approach. Transp. Res. Part D Transp. Environ. 92, 102726. doi:10.1016/j.trd.2021.102726
Pesaran, M. H. (2007). A Simple Panel Unit Root Test in the Presence of Cross-Section Dependence. J. Appl. Econ. 22 (2), 265–312. doi:10.1002/jae.951
Raza, S. A., Shah, N., and Sharif, A. (2019). Time Frequency Relationship between Energy Consumption, Economic Growth and Environmental Degradation in the United States: Evidence from Transportation Sector. Energy 173, 706–720. doi:10.1016/j.energy.2019.01.077
Rehman, A., Ma, H., Ozturk, I., and Ulucak, R. (2022). Sustainable Development and Pollution: The Effects of CO2 Emission on Population Growth, Food Production, Economic Development, and Energy Consumption in Pakistan. Environ. Sci. Pollut. Res. 29 (12), 17319–17330. doi:10.1007/s11356-021-16998-2
Rissman, J., Bataille, C., Masanet, E., Aden, N., Morrow, W. R., Zhou, N., et al. (2020). Technologies and Policies to Decarbonize Global Industry: Review and Assessment of Mitigation Drivers through 2070. Appl. Energy 266, 114848. doi:10.1016/j.apenergy.2020.114848
Robaina, M., and Neves, A. (2021). Complete Decomposition Analysis of CO2 Emissions Intensity in the Transport Sector in Europe. Res. Transp. Econ. 90, 101074. doi:10.1016/j.retrec.2021.101074
Rudyk, I., Owens, G., Yolpe, A., Ondhowe, R., and Dechezleprêtre, A. (2015). Climate Change Mitigation Technologies in Europe-Evidence from Patent and Economic Data. London: The United Nations Environment Programme (UNEP) and the European Patent Office.
Sajid, M. J., Ali, G., and Santibanez Gonzalez, E. D. R. (2022). Estimating CO2 Emissions from Emergency-Supply Transport: The Case of COVID-19 Vaccine Global Air Transport. J. Clean. Prod. 340, 130716. doi:10.1016/j.jclepro.2022.130716
Sharif, A., Raza, S. A., Ozturk, I., and Afshan, S. (2019). The Dynamic Relationship of Renewable and Nonrenewable Energy Consumption with Carbon Emission: A Global Study with the Application of Heterogeneous Panel Estimations. Renew. Energy 133, 685–691. doi:10.1016/j.renene.2018.10.052
Sharma, G. D., Tiwari, A. K., Erkut, B., and Mundi, H. S. (2021). Exploring the Nexus between Non-renewable and Renewable Energy Consumptions and Economic Development: Evidence from Panel Estimations. Renew. Sustain. Energy Rev. 146, 111152. doi:10.1016/j.rser.2021.111152
Sherwood, B., and Wang, L. (2016). Partially Linear Additive Quantile Regression in Ultra-high Dimension. Ann. Stat. 44 (1), 288–317. doi:10.1214/15-AOS1367
Su, H.-N., and Moaniba, I. M. (2017). Does Innovation Respond to Climate Change? Empirical Evidence from Patents and Greenhouse Gas Emissions. Technol. Forecast. Soc. Change 122, 49–62. doi:10.1016/j.techfore.2017.04.017
Syed, Q. R., Bhowmik, R., Adedoyin, F. F., Alola, A. A., and Khalid, N. (2022). Do economic Policy Uncertainty and Geopolitical Risk Surge CO2 Emissions? New Insights from Panel Quantile Regression Approach. Environ. Sci. Pollut. Res. 29, 27845–27861. doi:10.1007/s11356-021-17707-9
Syed, Q. R., and Bouri, E. (2021). Impact of Economic Policy Uncertainty on CO 2 Emissions in the US : Evidence from Bootstrap ARDL Approach. J. Public Aff.. doi:10.1002/pa.2595
Tang, C., Irfan, M., Razzaq, A., and Dagar, V. (2022). Natural Resources and Financial Development: Role of Business Regulations in Testing the Resource-Curse Hypothesis in ASEAN Countries. Resour. Policy 76, 102612. doi:10.1016/j.resourpol.2022.102612
Tunde, O. L., Adewole, O. O., Alobid, M., Szűcs, I., and Kassouri, Y. (2022). Sources and Sectoral Trend Analysis of CO2 Emissions Data in Nigeria Using a Modified Mann-Kendall and Change Point Detection Approaches. Energies 15 (3), 766. doi:10.3390/en15030766
Ülengin, F., Işık, M., Ekici, Ş. Ö., Özaydın, Ö., Kabak, Ö., and Topçu, Y. İ. (2018). Policy Developments for the Reduction of Climate Change Impacts by the Transportation Sector. Transp. Policy 61, 36–50. doi:10.1016/j.tranpol.2017.09.008
Valeria, N., and Giovanna, C. (2022). Effectiveness of Business Practices Related to Climate Change as a Driver for Improving Environmental Performance. Am. J. Appl. Sci. 19 (1), 21–33. doi:10.3844/ajassp.2022.21.33
Wang, B., Wang, Q., Wei, Y.-M., and Li, Z.-P. (2018). Role of Renewable Energy in China's Energy Security and Climate Change Mitigation: An Index Decomposition Analysis. Renew. Sustain. Energy Rev. 90, 187–194. doi:10.1016/j.rser.2018.03.012
Westerlund, J. (2007). Testing for Error Correction in Panel Data. Oxf. Bull Econ Stats 69 (6), 709–748. doi:10.1111/j.1468-0084.2007.00477.x
Xie, R., Fang, J., and Liu, C. (2017). The Effects of Transportation Infrastructure on Urban Carbon Emissions. Appl. Energy 196, 199–207. doi:10.1016/j.apenergy.2017.01.020
Xu, B., and Lin, B. (2015). Factors Affecting Carbon Dioxide (CO2) Emissions in China's Transport Sector: a Dynamic Nonparametric Additive Regression Model. J. Clean. Prod. 101, 311–322. doi:10.1016/j.jclepro.2015.03.088
Xu, B., and Lin, B. (2018). Investigating the Differences in CO2 Emissions in the Transport Sector across Chinese Provinces: Evidence from a Quantile Regression Model. J. Clean. Prod. 175, 109–122. doi:10.1016/j.jclepro.2017.12.022
Yu, Y., and Du, Y. (2019). Impact of Technological Innovation on CO2 Emissions and Emissions Trend Prediction on 'New Normal' Economy in China. Atmos. Pollut. Res. 10 (1), 152–161. doi:10.1016/j.apr.2018.07.005
Zhang, C., Khan, I., Dagar, V., Saeed, A., and Zafar, M. W. (2022). Environmental Impact of Information and Communication Technology: Unveiling the Role of Education in Developing Countries. Technol. Forecast. Soc. Change 178, 121570. doi:10.1016/j.techfore.2022.121570
Zhang, C., and Nian, J. (2013). Panel Estimation for Transport Sector CO2 Emissions and its Affecting Factors: A Regional Analysis in China. Energy Policy 63, 918–926. doi:10.1016/j.enpol.2013.07.142
Zhang, W., Li, J., Li, G., and Guo, S. (2020). Emission Reduction Effect and Carbon Market Efficiency of Carbon Emissions Trading Policy in China. Energy 196, 117117. doi:10.1016/j.energy.2020.117117
Zhou, Y., Chen, M., Tang, Z., and Mei, Z. (2021). Urbanization, Land Use Change, and Carbon Emissions: Quantitative Assessments for City-Level Carbon Emissions in Beijing-Tianjin-Hebei Region. Sustain. Cities Soc. 66, 102701. doi:10.1016/j.scs.2020.102701
Keywords: transport, greenhouse gas, panel quantile regression, climate change mitigation technologies, CO2 emissions
Citation: Bhowmik R, Rahut DB and Syed QR (2022) Investigating the Impact of Climate Change Mitigation Technology on the Transport Sector CO2 Emissions: Evidence From Panel Quantile Regression. Front. Environ. Sci. 10:916356. doi: 10.3389/fenvs.2022.916356
Received: 09 April 2022; Accepted: 09 May 2022;
Published: 13 June 2022.
Edited by:
Faik Bilgili, Erciyes University, TurkeyReviewed by:
Vishal Dagar, Great Lakes Institute of Management, IndiaAtif Jahanger, Hainan University, China
Yacouba Kassouri, Leipzig University, Germany
Valeria Naciti, University of Messina, Italy
Copyright © 2022 Bhowmik, Rahut and Syed. This is an open-access article distributed under the terms of the Creative Commons Attribution License (CC BY). The use, distribution or reproduction in other forums is permitted, provided the original author(s) and the copyright owner(s) are credited and that the original publication in this journal is cited, in accordance with accepted academic practice. No use, distribution or reproduction is permitted which does not comply with these terms.
*Correspondence: Qasim Raza Syed, cWFzaW1yYXphc3llZC5lY29ub21pY3NAZ21haWwuY29t
†ORCID: Dil Bahadur Rahut, orcid.org/0000-0002-7505-5271Roni Bhowmik, orcid.org/0000-0001-8664-8286