 Rylan Boothman
 Jeffrey A. Cardille
- 1Department of Natural Resource Sciences, McGill University, Sainte-Anne-de-Bellevue, QC, Canada
- 2Bieler School of the Environment, McGill University, Montreal, QC, Canada
Disturbances such as fire play a critical role in forest ecosystems. However, anthropogenic fires can profoundly impact forests to the point of destabilizing ecosystems. In addition, fires have legacy effects on environments which may be observed in forests for decades after the fire is extinguished. Thus, understanding the extent of historic fires in a landscape is vital to understanding current forest structure and ecological processes (e.g., carbon sequestration capacity and provision of habitat) and, therefore, essential for informing land-management decisions. However, little work has been done to map forest fires pre 1980s due to the challenges of interpreting imagery from the 1970s-era Landsat Multispectral Scanner (MSS) platform. MSS imagery is distinguished from recent satellite missions through lower temporal, spatial, and spectral resolutions. Recent advances in image processing have brought the goal of high-quality MSS classifications within reach. In this study, we use deep learning, specifically UNet (a fully convolutional neural network (CNN)), to detect historic forest fires in MSS imagery for the forest-dominated regions of Quebec, Canada. While other studies have applied deep learning to present-day satellite data for land cover classification, hardly any work has specifically applied deep learning to MSS data for fire detection. We trained our UNet model on 206 MSS images that were labelled by applying thresholds to the Burned Area Index inside polygons drawn by the authors around burned areas. We then used the trained model to label burns in 5104 MSS images that were compiled to generate annual burned area maps. Our results identified (with a 95% confidence interval) 3503.95 ± 484.90 km2 of burns not previously reported in any database; this represents a 35.30 ± 3.94% increase in the total known burned area across the forest-dominated regions of Quebec between 1973 and 1982.
1 Introduction
Forest fires profoundly impact the environment by altering biogeochemical and hydrological cycles, subsequently impacting biological communities and how ecosystems function (Bowman et al., 2009; Bowman et al., 2011). Today, it is commonly understood that human influence is changing modern fire regimes (Flannigan et al., 2000; Bowman et al., 2011; Schaphoff et al., 2016; Hanes et al., 2019). As well, anthropogenic climate change and fire exist in a positive feedback loop, as fires destroy forests and release greenhouse gasses, which increases retained solar radiation and surface temperatures, which increases evapotranspiration, while the lack-of forests lowers the ability for water retention, resulting in more favorable conditions for fires (Clark, 1990; Weber and Flannigan, 1997; Stocks et al., 1998; Flannigan et al., 2000; Amiro et al., 2001a; Schaphoff et al., 2016). As it can take an ecosystem decades to return to pre-disturbance conditions after a fire occurs (Flannigan et al., 2000; Amiro et al., 2001a; Burton et al., 2007; Hudiburg et al., 2017), the amount of carbon released by a fire and how much carbon can be sequestered afterwards is contingent on the disturbance history of a region (Amiro et al., 2001a; Balshi et al., 2007). Thus, to understand the state of a forest, which is crucial for successful ecosystem management, climate change mitigation, and adaptation, we must first understand the history of a forest.
The Canadian National Fire Database (CNFDB) (Canadian Forest Service, 2021) is the primary resource for studying long term trends in forest fires in Canada and understanding their impacts on ecosystems. The CNFDB has spatially explicit records of forest fires across Canada, including entries as early as 1917 in some regions. Given the reliance on in-person accounts for historic forest monitoring, the data from before the 1970s is not complete (Stocks et al., 2002). Stocks et al. (2002) note that “fires in more remote northern regions … that occurred between 1959 and the mid-1970s are undoubtedly missing from [the CNFDB]” (2002, p. g., FFR5-3). The CNFDB mainly includes maps for recorded fires larger than 200 ha and, for many fires, has only an outline of the burned area that falsely includes unburned interior areas. The exclusion of fires smaller than 200 ha and the inclusion of unburned islands is considered a limitation to the CNFDB (Amiro et al., 2001b; Stocks et al., 2002; Burton et al., 2007; Coops et al., 2018; Hanes et al., 2019). In response, more spatially explicit maps based on the analysis of historical satellite data have been added to the CNFDB. For example, Coops et al. (2018) created maps of fires across Canada from 1985 to 2015, based on Landsat Thematic Mapper (LTM) and Operational Land Imager (OLI) data.
The historical record of fires can be extended back an additional decade using Landsat Multispectral Scanner (MSS) imagery. Problematically, MSS data has a limited spatial, spectral, and temporal resolution in comparison to current satellite missions such as Landsat 8 and Sentinel-2. The coarser spatial resolution of MSS imagery (60 m) makes it challenging to accurately identify fire borders as larger pixels are more likely to contain a mixture of both burned and unburned land. The lower spectral resolution means less information per pixel than current data. Critically, MSS images do not have a short-wave infrared band commonly used for fire classification (Holden et al., 2005). Finally, unlike today, when multiple satellites are operating simultaneously and data gaps in one instrument’s time series can be augmented with images from other satellite missions, the MSS image collection is the only freely-accessible global Earth observation dataset that exists for the 1970s. In addition, as there are only a few MSS images available for a typical growing season, low-quality imagery must be included to construct a time series based on MSS images.
Neural networks may overcome some of the challenges associated with interpreting MSS imagery as they can encode more complex relationships than traditional image analysis techniques. Therefore, they may be less susceptible to some of the noise and sensor artifacts present in MSS images as well as the differences in brightness and saturation between MSS images. Moreover, because convolutional neural networks (CNNs) explicitly use spatial relationships among pixels, they may circumvent the limitation of having only four bands by using information from surrounding pixels. Previously, researchers have used deep learning to map forest disturbances in modern remote sensing data (Ortega Adarme et al., 2020; Belenguer-Plomer et al., 2021; Maretto et al., 2021; Zhang et al., 2021). Work has also been done mapping forest disturbances in Landsat MSS imagery using non-deep learning methods (Gaveau et al., 2007; Renó et al., 2011; Vogeler et al., 2020). However, we do not know of previous work that specifically applied deep learning to map forest fires in Landsat MSS data.
Given the above, we propose using deep learning to augment the CNFDB by creating maps of forest fires in Quebec, Canada, based on MSS imagery. The objective of this study is to expand the number of fires explicitly mapped in the CNFDB, and not to replace the existing CNFDB dataset. To achieve this objective we developed MSS image preprocessing steps, a deep learning model that classifies MSS images into six land cover classifications, and time-series classification steps to create maps of burned areas.
2 Materials and methods
The goal of this study is to augment the historical records of forest fires in Canada. To achieve this goal, we use Landsat Multispectral Scanner (MSS) imagery and a deep learning model to create maps of forest fires over the forest-dominated ecozones of Quebec, Canada for the years 1973–1982.
2.1 Study region
For this study, we created maps of historic fires in the forest-dominated ecozones of Quebec. Forest-dominated ecozone boundaries were derived from the Canada Committee on Ecological Land Classification (CCELC) and the Agriculture and Agrifood Canada (AAFC) Ecological Stratification Working Group ecozones (Ecological Stratification Working Group, 1995) and are visualized in Figure 1. Four forest-dominated ecozones overlap with Quebec; 1) the Taiga Shield (forested with shrublands and meadows), 2) the Hudson Plains (predominantly forested with wetlands), 3) the Boreal Shield (forested), and 4) the Atlantic Maritime (forested with some agricultural and built-up areas) (Ecological Stratification Working Group, 1995). These ecozones contain a mix of conifers and deciduous species (Ecological Stratification Working Group, 1995).
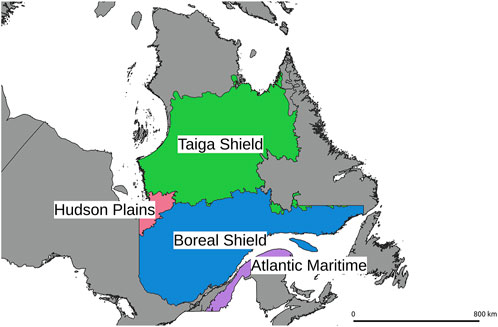
FIGURE 1. Forest dominated ecozones of Quebec.
We created maps of forest fires in these ecozones for the years 1973–1982. Although (MSS) data is available from 1972 on, burn scars are detectable in MSS images for some years after a fire occurs, so we would have no way of determining if burns detected in 1972 are from fires that occurred in 1972 or earlier. We ended the study period in 1982 (even though MSS images continued to be acquired after 1982) because Landsat 4 (the first Landsat mission to carry a non-MSS sensor) was launched in 1982. Therefore, we have access to higher quality images than MSS images after 1982. Because our methods rely on having a time series of classifications to detect fires properly, we classified MSS images through the end of 1984.
2.2 Landsat multispectal scanner
The images in this study were acquired by the Landsat Multispectral Scanner (MSS) platform. The MSS platform was the first global Earth monitoring satellite and the sole instrument in operation during the 1970s. Each MSS image has four bands: visible green (0.5 − 0.6 μm), visible red (0.6 − 0.7 μm), near-infrared 1 (0.7–0.8μm), and near-infrared 2 (0.8 − 1.1 μm) (National Aeronautics and Space Administration (NASA). MSS images are re-sampled to a spatial resolution of 60 m by 60 m, have a radiometric resolution of 6 bits, and have a revisit period (i.e. best case temporal resolution) of 18 days (Landsat 1–3) or 16 days (Landsat 4 and 5) (NASA). The above specifications mean that MSS images have lower spectral, spatial, radiometric, and temporal resolution than modern systems (e.g., Landsat 8 and Sentinel-2). Moreover, many MSS images are also misregistered or corrupted with noise, further limiting the amount of usable MSS data.
2.3 Image preprocessing
We considered for inclusion in this study all MSS images from 1972–1984 acquired between the 120th and 270th Day-of-Year (approximately May 1st to September 31st) that overlap with the forest-dominated ecozones of Quebec, have cloud cover less than or equal to 35% (to permit a reasonable starting sample size), and geometric root-mean-square error less than 0.5 pixels (to minimize the use of misregistered images). A total of 5752 images were initially selected. Through visual inspection, 642 images were removed for either 1) being misregistered, 2) having higher cloud cover than indicated by their metadata, or 3) if they had too many sensor artifacts to be usable.
The remaining MSS images were converted to top-of-atmosphere reflectance images following the process outlined in Braaten et al. (2015). To help distinguish burns, we calculated the Normalized Difference Vegetation Index (NDVI) (Rouse et al., 1973), tasseled cap angle (Powell et al., 2010), Burned Area Index (BAI) (Chuvieco et al., 2002), and the normalized difference between the green and red bands to help detect cloud shadows (Braaten et al., 2015). As the BAI does not have an upper bound, we clamped all BAI values to be less than 800 (i.e., we set all values greater than 800 to 800). 800 was determined to be a reasonable upper bound through trial and error. After clamping, the BAI was normalized to 0–1. The clamping and normalization were applied to the BAI to allow comparison between BAI values and the other indices. Finally, to minimize differences in brightness between images, each image was normalized by subtracting the median value per band (or band index) from each band. We performed all data inspection, gathering, and preprocessing in Google Earth Engine (Gorelick et al., 2017).
2.4 Model
The model used in this study is UNet (Ronneberger et al., 2015), a fully convolutional neural network (CNN) designed initially for image segmentation (i.e., assigning labels to each pixel in an image). The model was implemented in TensorFlow (Abadi et al., 2015) and trained on the Google Cloud Platform. Our model has six classes: 1) “none” (for pixels that lie off the edge of MSS images whose band values are zero), 2) “un-burned”, 3) “burned”, 4) “water”, 5) “cloud shadow”, and 6) “cloud”. We included multiple non-burned classes in the model because our experiments showed that explicitly separating the un-burned classes caused the model to confuse water and cloud shadow for burns less frequently.
2.4.1 Training and testing data
We created a training dataset from 206 MSS images that were selected from the entire study region and time period. Due to the requirement of balanced classes in the training data and because the total burned area is small relative to the total study area, a random sampling procedure to select the images included in the training data would likely not have included enough burned pixels. Instead, the 206 training images were selected by looking for images that contained visible burns while also representing the variety of MSS image qualities, cloud covers, and land covers expected within the study region. The “burned” class was labelled by finding image-specific thresholds of the BAI inside user-drawn polygons around all burn scars visible in the training images. Pixels were labelled as “water” using a threshold of the NDVI inside the bounds of the maximum extent of water in the Joint Research Centre (JRC) Global Surface Water dataset (Pekel et al., 2016). “Cloud” and “cloud shadow” classes were labelled using the MSS Clearview Mask (Braaten et al., 2015). All remaining unlabelled pixels were labelled as “un-burned” if they were over an MSS image or “none” if they were outside the bounds of the MSS image.
60 patches of 256x256 pixels centered on a random pixel labelled as burned and 20 patches centered on a random pixel labelled as any non-burn class were sampled from each of the 206 images in our training dataset for a total of 16,408 patches. During training, we used standard data augmentation techniques such as random cropping (to patches with a size of 128x128 pixels), random flips, and random rotations to increase the size of the training dataset. During model development, 25% of the patches sampled from each image were held out of the training dataset and instead used to validate the model (see Section 3.1).
We classified 5104 MSS images using a version of the model trained on the complete training dataset to generate the final maps of fires in Quebec between 1973 and 1982. We applied the same preprocessing steps to each image before giving them to the model, except each image was exported as 128x128 pixel patches (58.9 km2) with an overlap of 16 pixels between adjacent patches to reduce edge artifacts in the model’s output. Data augmentation steps were skipped in the generation of the final map.
2.5 Postprocessing
During postprocessing, we first gave all pixels whose band values were all zero or that were in agricultural and built-up regions (as determined by the Copernicus Global Land Cover map (Buchhorn et al., 2020)) the class “none”. We then reduced the six classes down to three classes: 1) “valid burns” from the “burned” class; 2) “valid non-burns” from the “un-burned” and “water” classes; and 3) “invalid” from the “none”, “cloud shadow”, and “cloud” classes. We then masked all pixels classified as “invalid”. Finally, we combined the model outputs into a time series of classifications per pixel to remove false positives and then used object-based methods to combine groups of pixels into fires and removed all fires smaller than 40 ha. We set the minimum fire size to 40 ha, as fires smaller than this were indistinguishable from noise by visual inspection. Individual burn pixels were then assigned a burn date based on the observation date of the first burn in the time series.
Two types of false positive errors appeared in the raw outputs from the model: single-instance errors (most often caused by misclassified clouds and cloud shadows) and persistent errors (most often caused by misclassified bare land in the northern regions of Quebec and misclassified wetlands in the southern regions of Quebec). We removed single instance errors by removing all burn observations that did not have a sequence of at least four consecutive “valid burn” classifications. We removed the persistent errors by removing any pixels labelled as “valid burns” in more than 6 years. We set these thresholds through trial and error. As the goal of this work is to augment an existing database of fires, we tuned these thresholds towards including fewer false positives at the expense of including more false negatives. These thresholds work well for our study region and purpose, but depend on the regrowth rate of vegetation after a disturbance which in turn likely depends on the region and type of disturbance, therefore applications of our methodology to other regions or disturbance types will likely require that these thresholds be re-tuned.
2.6 Assessment of model and final burned area map
To assess the UNet model, a version of the model was trained on 75% of the patches randomly selected from each of the 206 training images and then assessed on the 25% of the patches that were never given to the model during training. Note that a version of the model trained on the complete training dataset was used to generate the final burned area maps.
To assess the final burned area maps we followed the guidelines outlined in Olofsson et al. (2014); Stehman, (2014); Olofsson et al. (2020). In order to compare our burned area map against the existing maps of forest fires in Quebec (from the CNFDB and the Quebec Forest Fire database (MFFP, 2021a; MFFP, 2021b)) we sampled reference points from 4 strata: the area marked as burned by neither our map nor the existing fire databases (i.e. agreed non-burns); the area marked as burned by the existing fire databases, but unburned in our map (i.e. missed burns); the area marked as burned by our map, but unburned in the existing fire databases (i.e. new burns); and the area marked as burned in both our map and the existing fire databases (i.e. agreed burns). Because the total area marked as burned represents less than 2% of the total study area we anticipated receiving high error of omission rates due to the stratification procedure as outlined in Olofsson et al. (2020), we therefore introduced a buffer strata class as recommended by Olofsson et al. (2020). Our buffer class had a size of four pixels: two pixels buffered out from the burn class boundary and two pixels buffered in from the burn class boundary. This gave us a total of eight strata: each of the original four strata inside the buffer and each of the original four strata outside of the buffer. The sizes of each strata are shown in Table 1.
Given a target standard error for the overall accuracy of 0.01, the strata sizes shown in Table 1, and an assumed user’s accuracy of 0.95 for the agreed non-burn outside buffer strata and 0.6 for the remaining strata Olofsson et al. (2014) recommends a reference point sample size of 498 points. We allocated 50 points to each of the strata and the remaining 98 points to the agreed non-burn outside buffer strata. Because 148 points was well below what proportionally allocating the points would recommend for the agreed non-burn outside buffer strata we then sampled an additional 200 points from that strata. During assessment, the assessors assigned a confidence between zero and five to their assessment and only reference points with a confidence greater than or equal to three were included in the final assessment. The final number of reference points for each strata is listed in Table 1. The points were sampled equally from each year of the study period within each strata, but due to the low number of points within each year we only report accuracy and area estimates for the entire study period.
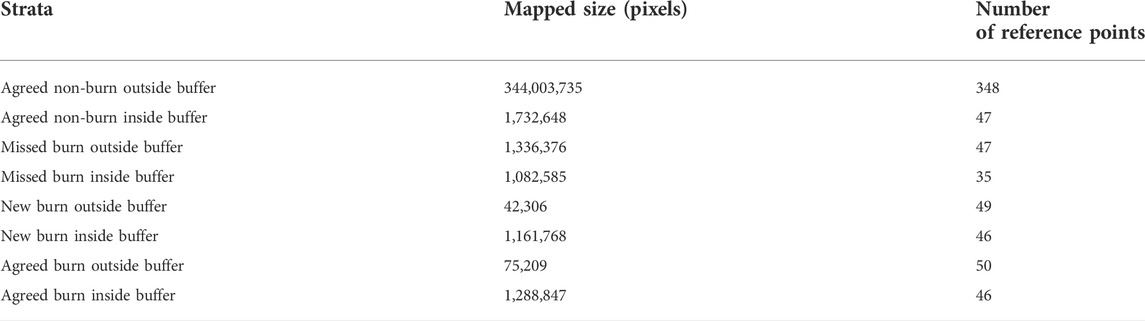
TABLE 1. Strata size and reference point allocation.
Two assessors worked to assign the true class of each reference point by visually inspecting the time series of MSS images overlapping each point. The assessors dated burns in the reference points with the date when the first image showing the point as burned was acquired. We consider the map and the reference to be in agreement only if both were labelled as burned in the year that the reference point was sampled from or both were not burned in the year that the reference point was sampled from. Note that a significant limitation of this accuracy assessment is that the only data available to assign classes to the reference points is the same data used to generate our map as the only dataset that exists during our study period is Landsat MSS.
Because our map classes and strata classes are different, we calculated the unbiased burned area estimates and the unbiased estimates of the overall, user’s and producer’s accuracies following the procedure outlined in Stehman, (2014). The overall, user’s, and producer’s accuracies are provided along with their 95% confidence intervals calculated as ± 1.96 times the standard error of the accuracy.
To compare our map against the existing databases we calculated error matrices and accuracies for our map as well as for the existing databases. We also calculated error matrices and accuracies for a map created by taking the union of the burned area in our map and the existing databases.
3 Results
3.1 UNet results
As can be seen in Table 2, before applying postprocessing, our UNet model achieves an overall accuracy of 95.42% and has producers and users accuracies greater than 90% in all but the cloud and cloud shadow classes. Because only images where the majority of the image could be annotated by hand were included in the training/testing data, the accuracies in Table 2 represent on optimistic assessment of the model as images that would be difficult to annotate by hand had to be included in the full set of images used to generate the final maps in order to achieve complete spatial and temporal coverage of the study area. The inclusion of these more difficult to annotate images is why our post processing steps to remove false positive errors are a necessary part of our methodology.
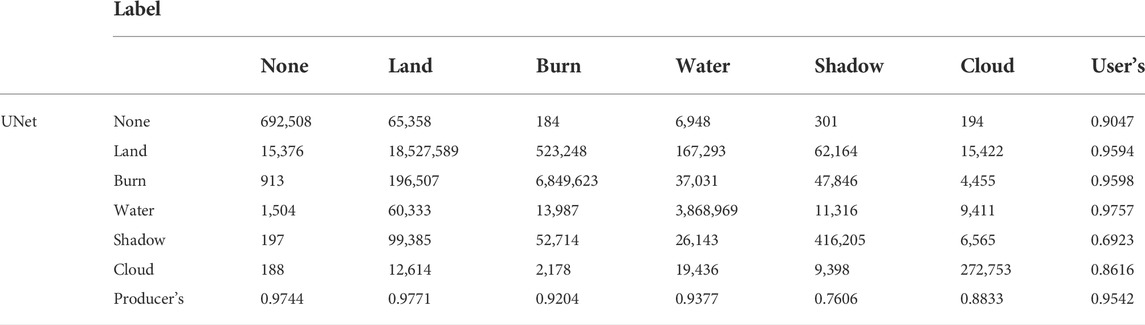
TABLE 2. UNet Model Error Matrix based on a 75/25 train/test split of hand labelled MSS images.
3.2 Final map results
An overview of our map compared to the existing fire databases (a combination of the CNFDB (Canadian Forest Service, 2021) and the Quebec Forest Fire database (MFFP, 2021a; MFFP, 2021b)) is shown in Figure 2. As expected many of the fires detected in our map and not listed in the existing fire databases occur in the central and northern half of the study area away from populated regions and therefore less likely to have been identified by the in-person or aerial mapping methods that were common in the 1970s. Evidence that these newly detected fires exist is qualitatively shown in Figures 3–6. A quantitative assessment of our map, the existing database, and the union of burned areas between the two is shown in Tables 3–5.
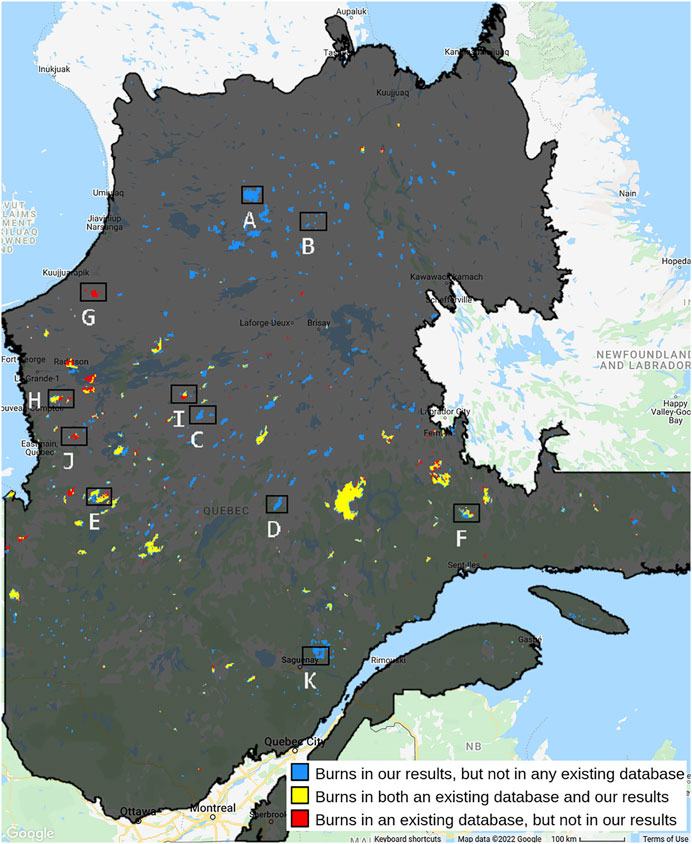
FIGURE 2. Results overview.
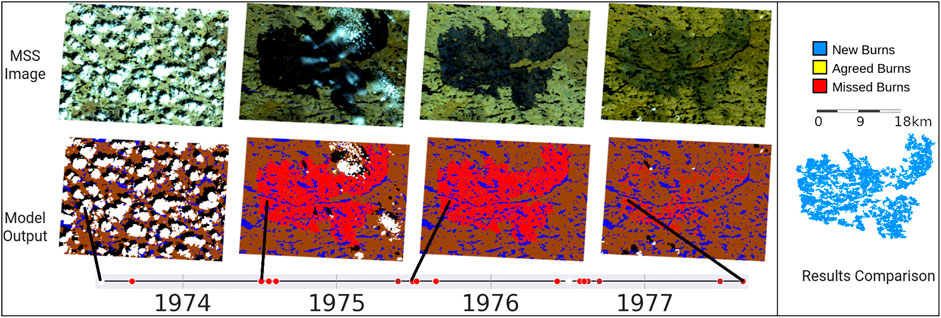
FIGURE 3. Results Detail A. MSS images and model classifications of a newly detected fire, along with a timeline of each model classification for a single pixel.

FIGURE 4. Results Detail B. MSS images and model classifications of a newly detected fire, along with a timeline of each model classification for a single pixel.
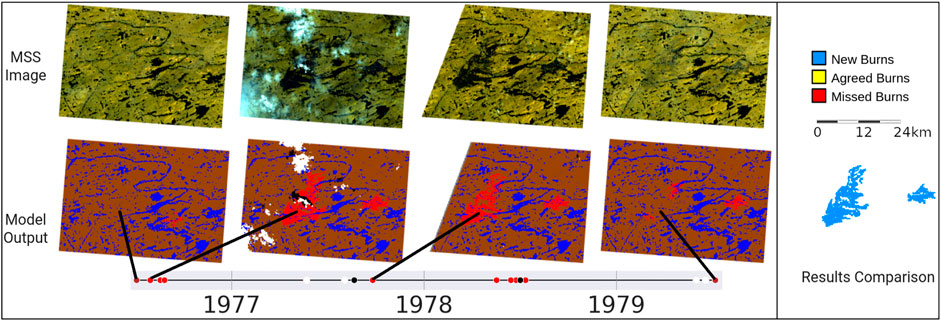
FIGURE 5. Results Detail C. MSS images and model classifications of a newly detected fire, along with a timeline of each model classification for a single pixel.

FIGURE 6. Results Detail D. MSS images and model classifications of a newly detected fire, along with a timeline of each model classification for a single pixel.
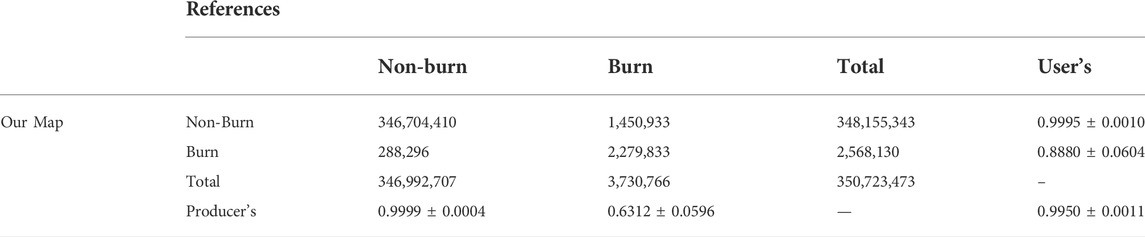
TABLE 3. Error matrix of population pixel count estimates and unbiased accuracies (with 95% confidence interval) of our map based on Stehman, (2014).
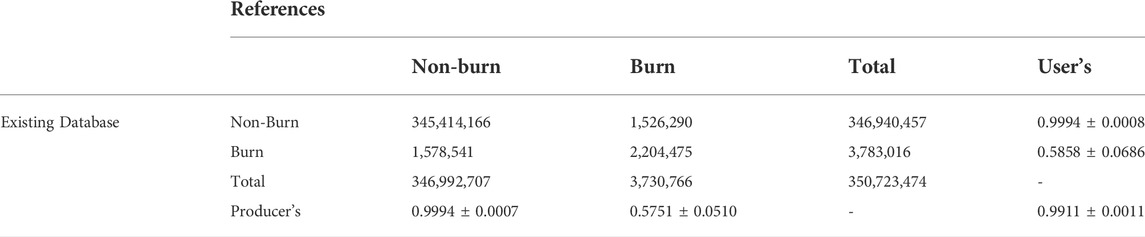
TABLE 4. Error matrix of population pixel count estimates and unbiased accuracies (with 95% confidence interval) of existing fire databases based on Stehman, (2014).
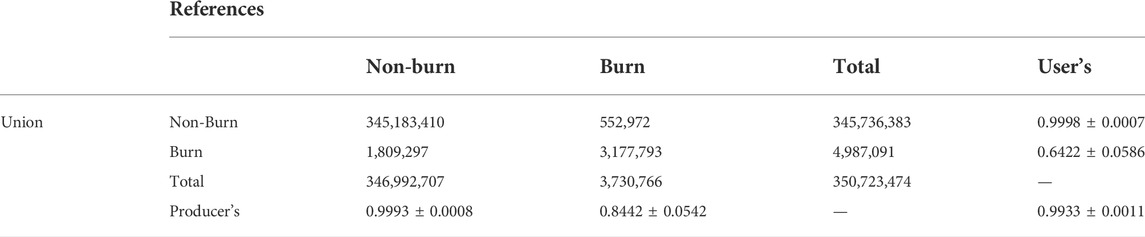
TABLE 5. Error matrix of population pixel count estimates and unbiased accuracies (with 95% confidence interval) of the union of the burned areas in our map and the existing fire databases based on Stehman, (2014).
As shown in Tables 3 our map acheives an overall unbiased accuracy of 99.50 ± 0.0011%. As shown in Tables 3–5 the three maps only differ when looking at the user’s and producer’s accuracy of the burn class and are essentially the same from the perspective of overall accuracy or the non-burned class with all three maps achieving an overall accuracy and user’s and producer’s accuracy for the non-burned class over 99%. The high unbiased overall accuracy for each of the maps is likely due to the non-burned class representing more than 98% of the study area and the fact that none of the maps makes many errors in that class.
The decrease in the unbiased users accuracy of the burn class between our map (88.80 ± 0.0604%) and the union map (64.22 ± 0.0586%) likely comes from the existing database containing fires that are rough polygons drawn around burns and therefore overestimate the amount of burned area at the edges of fires and also incorrectly label unburned islands as burned (see Figures 7, 8). The increase in the unbiased producers accuracy of the burn class between our map (63.12 ± 0.0596%) and the union map (84.42 ± 0.0542%) likely comes from the handful of fires that our model misses, but are listed in the existing databases. Most of these fires are missed by our methods due to there not being enough clear observations fo the fires (see Figures 9–11). The increase in the unbiased producers accuracy of the burn class between the existing database (57.51 ± 0.0510%) and the union map (84.42 ± 0.0542) is likely due to the many fires that are completely absent from the existing database primarily in the northern part of the study region (see Figures 3–6).
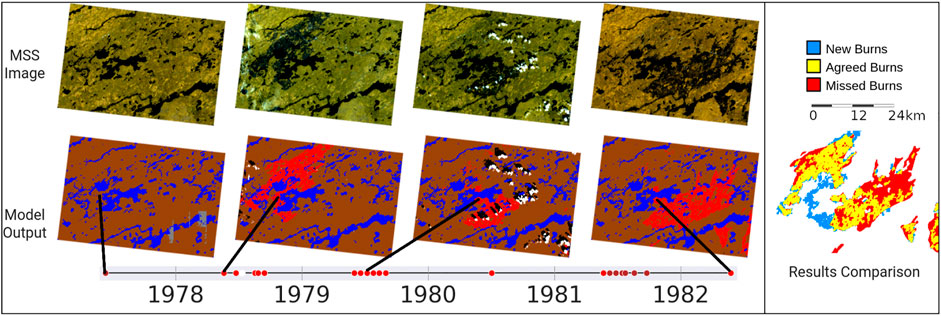
FIGURE 7. Results Detail E. MSS images and model classifications of a fire detected by our methods and listed in the existing databases, along with a timeline of each model classification for a single pixel.
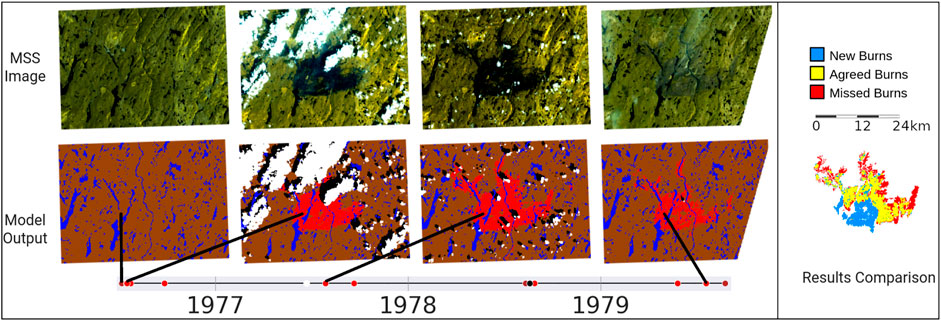
FIGURE 8. Results Detail F. MSS images and model classifications of a fire detected by our methods and listed in the existing databases, along with a timeline of each model classification for a single pixel.
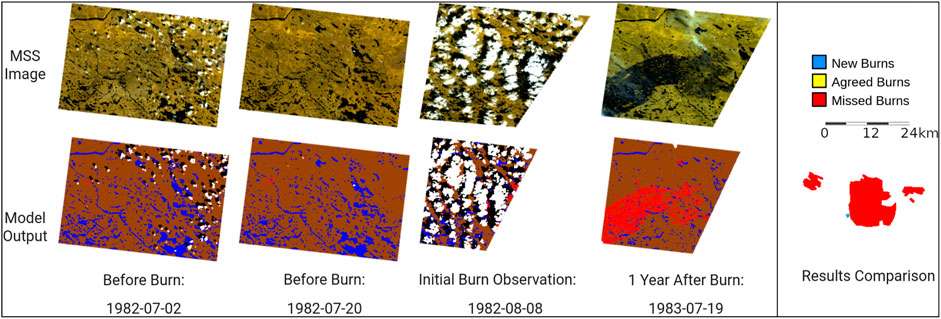
FIGURE 9. Results Detail G. The only MSS observation of a fire that started on 1981–07-27 from within the study period.
Following the procedure outlined in Stehman, (2014) the unbiased estimate for the total area burned is 13,430.76 ± 390.97 km2. 9,926.81 ± 1,256.48 km2 was already mapped in the existing fire databases and this work detected 3503.95 ± 484.90 km2 of new burns. This represents an increase in the known total area burned of 35.30 ± 3.94%. 3232.66 ± 892.29 km2 of burns occurred in the existing fire databases, but not in our map.
4 Discussion
4.1 Limitations
The main limitations of this work come from the low temporal resolution of Landsat Multispectral Scanner (MSS) data which causes fires to be missed in our results completely and the low spectral and spatial resolution of MSS imagery which causes the edges of fires to be mapped poorly. Additionally, we have discovered at least one false positive fire detection in our results that must be removed by hand before the results can be included in a fire database (see Figure 13).
Not having enough clear observations of a fire immediately after the fire occurred is the primary reason behind most of the burned area in the existing databases that we failed to detect. This problem is demonstrated in Figures 9–12. In Figure 9, we have exactly one observation of the fire during the study period after it started on 1982–07-27 (according to the CNFDB), and clouds cover the burn scar in that observation. In Figures 10, 11, 12, we get three or fewer clear observations of the burns in the 3 years following their start date, but we require at least four consecutive observations of a burn to remove false positives from our results.
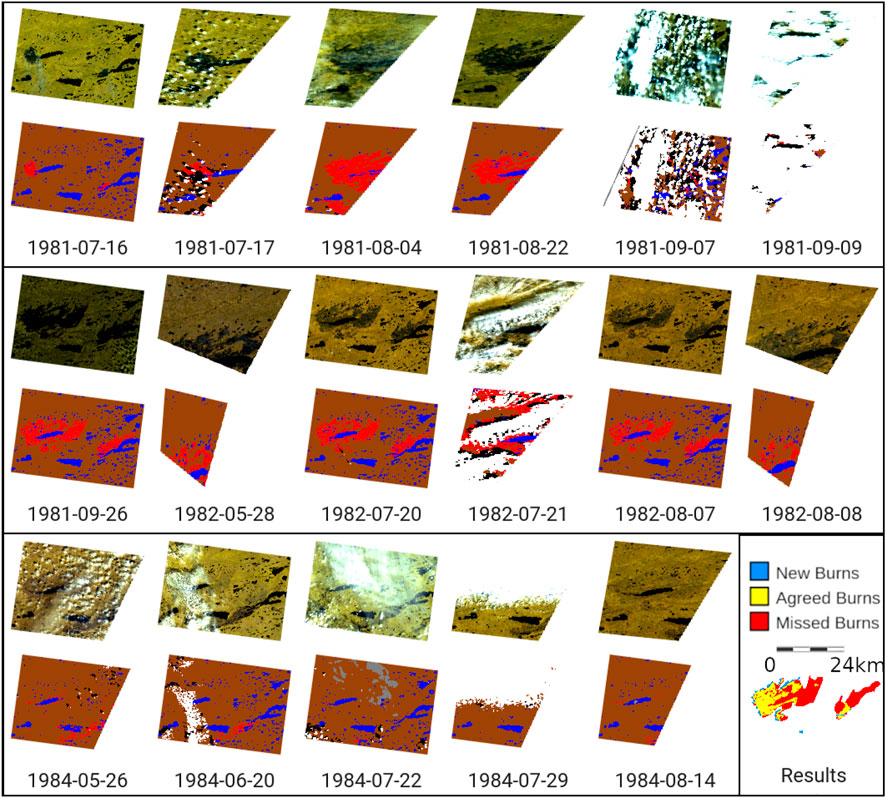
FIGURE 10. Results Detail H. Every Usable MSS image and UNet classification of a fire that started 1981–07-13 according to the CNFDB, but was only partially detected by our methodology.
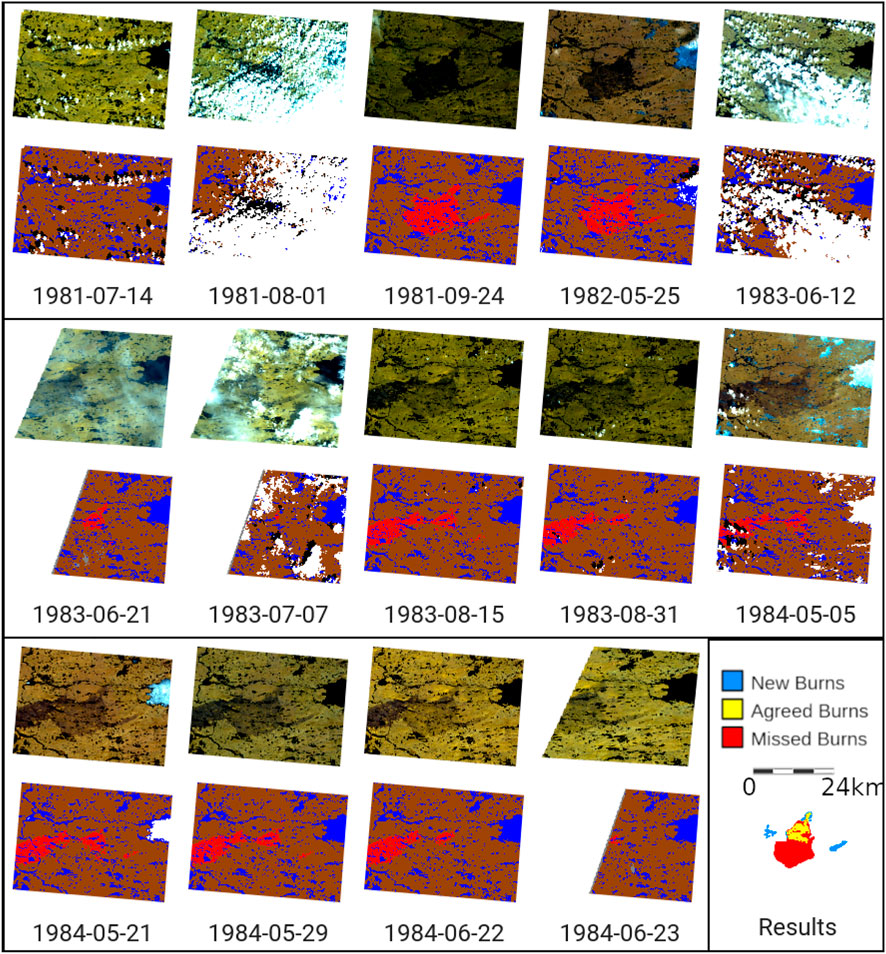
FIGURE 11. Results Detail I. Every usable MSS image and UNet classification of a fire that started 1981–07-06 accordig to the CNFDB, but was only partially detected by our methodology.
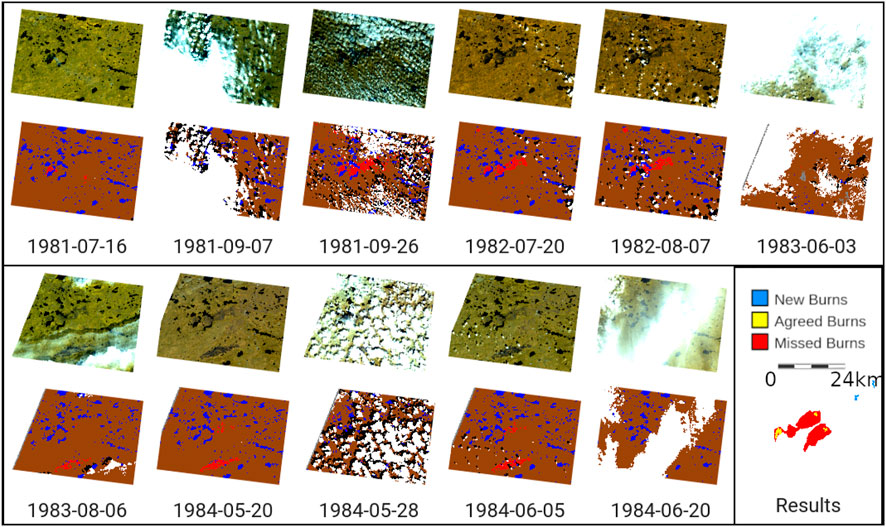
FIGURE 12. Results Detail J. Every usable MSS image and UNet classification of a fire that started 1981–07-13 according to the CNFDB but was not detected by our methodology.
Because the goal of this study was to augment the existing fire databases rather than replace them, we made decisions in the design of the methodology to limit the number of false positives at the expense of getting more false negatives. It is also likely that our methods failed to detect burns that are not in the existing databases, and given the high amount of burns in the existing databases that our methods failed to detect, there is likely still a significant number of fires that remain unmapped in the study region. Therefore, the total burned area from the combination of our results and the existing databases should be considered a lower limit on the actual total burned area.
The other main source of discrepancy between the burned area reported in the existing databases and the burned area reported by our methods comes from the accumulation of slight differences in the shape, edges, and unburned islands between our maps of a fire and the maps of the same fire in the databases. As mentioned in Amiro et al. (2001b), Stocks et al. (2002) the CNFDB incorrectly includes unburned islands in the burned area for some fires, we suspect that this inclusion is part of the cause of the large amount of known burned area that our methods failed to detect. Additionally, the low spatial resolution of MSS pixels means that many pixels around the edges of burns will contain both burned and unburned land. This mixing of actual classes within a pixel, combined with the low spectral resolution of MSS pixels, makes classifying pixels along the edges of burned regions as burnt or unburnt error-prone. Any two methods of making these classifications are likely to have disagreements in those pixels. These kinds of errors can be seen in Figures 7, 8.
The low temporal resolution of MSS data also affects our ability to assign dates to burns. We assigned dates to burns using the date of the first burn observation in a sequence of at least four burn observations. However, due to the low temporal resolution of MSS data, the first observation of a fire may occur in the year following the fire. For example, Figure 9 shows a detail of a burn that, according to the CNFDB, started on 1982-07-27. However, the first clear observation of the fire in an MSS image occurred in 1983, so the fire was excluded from our results due to it erroneously being dated as starting outside of the study period. This issue also occurs in other places in our results where the only observation of a fire in a given year is partially cloudy, so the fire in the final results is assigned a patchwork of two different dates. We suspect that many of the new fires in our results are assigned the wrong date, but due to the lack of available data have no way to verify this accurately.
Of the fires detected in our methods but not listed in any existing database, we could find only one where we could not find evidence of a fire when visually inspecting the images. Figure 13 shows this “burn”. Despite having spectral characteristics that are somewhat similar to those of other fires, due to the size of the fire, its proximity to inhabited regions, and the fact that existing fire databases do not contain it, we believe that the fire shown in Figure 13 is a false positive. We believe the error occurred primarily due to a sequence of relatively darker images in 1976 which caused the model to mistake unburned land for burned land.

FIGURE 13. Results Detail K. False positive burn.
4.2 Future work
Potential future areas of work for this study include expanding to map forest fires in other boreal regions and expanding to map other forest disturbance types. Additionally, this work points to the possibility of improved general land cover classification of MSS imagery.
The method developed within this study presents a means to augment the existing knowledge of historical fires in Quebec. By retraining our UNet model with an expanded dataset, these methods can easily be reapplied to different geographical extents. For example, with a training dataset containing images from all the forest-dominated ecozones of Canada, our methods could augment the CNFDB for the entire country, not just Quebec. Secondly, the success of deep learning at mapping forest fires in MSS imagery suggests that deep learning may also be able to map other forest disturbance types such as deforestation or forest die-off from invasive insects in MSS imagery.
Moreover, this study develops a method that may be used to generate high-quality maps of other land covers from historical MSS images, allowing conservation and land management practitioners to extend historical remote sensing analyses back an additional decade. For example, as a by-product of creating maps of forest fires, we also created relatively high-quality maps of water, clouds, and cloud shadow. By refocusing our methodology towards water, there is a possibility that our methods could be used to extend the Joint Research Centre (JRC) Global Surface Water dataset (Pekel et al., 2016), which currently goes back only to 1984. Alternatively, by refocusing our methodology toward clouds and cloud shadows, there may be room to improve the MSS Clearview Mask, used for masking clouds and cloud shadows in MSS images (Braaten et al., 2015). Land cover maps based on MSS images would provide earlier baselines and longer time series, thereby telling a more complete story of how land cover has changed through time.
Finally, there may be potential to improve our maps of fires by 1) replacing the deep learning model we used with a more sophisticated architecture similar to that proposed by Zhang et al. (2021), or 2) by retraining the model with an expanded training dataset (>206 images). In both instances, improving the model may allow us to lower the threshold of at least four consecutive burn observations, in turn, possibly reducing the number of false negatives. Although we believe there are more fires in the study region than we are currently able to detect, we suspect that due to the low temporal resolution of MSS data, even a model with a 0% false-positive rate (and therefore a model that needs no postprocessing) would still miss some fires and assign the wrong date to others. In other words, the lack of available MSS images may mean some fires are not detected, or the actual start date of the fire is missed.
5 Conclusion
While natural forest fires are an essential process in forest ecosystems, the growing number and intensity of anthropogenic fires have expanded beyond natural extents, impacting global forest ecosystems long after they stop burning. In this work, we demonstrate that neural networks can overcome the challenges associated with Multispectral Scanner (MSS) data and can be used to identify burned areas previously not captured in the MSS era. In this project, 3503.95 ± 484.90 km2 of new fires were detected in the forest-dominated regions of Quebec between 1973 and 1982. Mapping these new fires augments the existing record of fires, thereby improving our understanding of how fire regimes are changing in the anthropocene. Given the extendability of our methodology, historic fire maps could be extended by analyzing MSS images across Canada and even the global boreal forest. Moreover, this work demonstrates that neural networks applied to MSS imagery can improve our baseline understanding of land cover and the length of time series analysis we can perform on land cover change.
Data availability statement
The code used in this study can be found on Google Earth Engine here: https://code.earthengine.google.com/?accept_repo=users/boothmanrylan/MSSForestDisturbances and on Github here: https://github.com/boothmanrylan/MSSForestDisturbances. The code includes the methods necessary to retrieve the Landsat Multispectral Scanner (MSS) images used in this study.
The raw UNet model outputs are available on Google Earth Engine here: https://code.earthengine.google.com/?asset=users/boothmanrylan/MSSForestDisturbances/test2. The final map produced by this study is available on Google Earth Engine here: https://code.earthengine.google.com/?asset=users/boothmanrylan/MSSForestDisturbances/quebec_fires_cleaned2. And, the comparison of our results to the existing fire databases is available on Google Earth Engine here: https://code.earthengine.google.com/?asset=users/boothmanrylan/MSSForestDisturbances/resultsComparisonOverview.
Author contributions
Concept: JC and RB; Methodology: RB; Analysis: RB and JC.
Funding
Funding for this study comes from SilvaCarbon and a Natural Sciences and Engineering Research Council of Canada (NSERC) Discovery Grant.
Acknowledgments
The authors would like to thank Eli Perez for assistance with coding in Google Earth Engine and Bryant Serre for help with editing.
Conflict of interest
The authors declare that the research was conducted in the absence of any commercial or financial relationships that could be construed as a potential conflict of interest.
Publisher’s note
All claims expressed in this article are solely those of the authors and do not necessarily represent those of their affiliated organizations, or those of the publisher, the editors and the reviewers. Any product that may be evaluated in this article, or claim that may be made by its manufacturer, is not guaranteed or endorsed by the publisher.
References
Amiro, B., Stocks, B., Alexander, M., Flannigan, M., and Wotton, B. (2001a). Fire, climate change, carbon and fuel management in the canadian boreal forest. Int. J. Wildland Fire 10, 405. doi:10.1071/WF01038
Amiro, B., Todd, J. B., Wotton, B. M., Logan, K. A., Flannigan, M. D., Stocks, B. J., et al. (2001b). Direct carbon emissions from canadian forest fires, 1959-1999. Can. J. For. Res. 31, 512–525. doi:10.1139/x00-197
Abadi, M., Agarwal, A., Barham, P., Brevdo, E., Chen, Z., Citro, C., et al. (2015). TensorFlow: Large-scale machine learning on heterogeneous systems. Software, 1–19. doi:10.48550/arXiv.1603.04467
Balshi, M. S., McGuire, A. D., Zhuang, Q., Melillo, J., Kicklighter, D. W., Kasischke, E., et al. (2007). The role of historical fire disturbance in the carbon dynamics of the pan-boreal region: A process-based analysis. J. Geophys. Res. 112, G02029. doi:10.1029/2006JG000380
Belenguer-Plomer, M. A., Tanase, M. A., Chuvieco, E., and Bovolo, F. (2021). Cnn-based burned area mapping using radar and optical data. Remote Sens. Environ. 260, 112468. doi:10.1016/j.rse.2021.112468
Bowman, D. M. J. S., Balch, J., Artaxo, P., Bond, W. J., Cochrane, M. A., D’Antonio, C. M., et al. (2011). The human dimension of fire regimes on Earth. J. Biogeogr. 38, 2223–2236. doi:10.1111/j.1365-2699.2011.02595.x
Bowman, D. M. J. S., Balch, J. K., Artaxo, P., Bond, W. J., Carlson, J. M., Cochrane, M. A., et al. (2009). Fire in the Earth system. Science 324, 481–484. doi:10.1126/science.1163886
Braaten, J. D., Cohen, W. B., and Yang, Z. (2015). Automated cloud and cloud shadow identification in landsat mss imagery for temperate ecosystems. Remote Sens. Environ. 169, 128–138. doi:10.1016/j.rse.2015.08.006
Buchhorn, M., Lesiv, M., Tsendbazar, N.-E., Herold, M., Bertels, L., Smets, B., et al. (2020). Copernicus global land cover layers-collection 2. Remote Sens. 12, 1044. doi:10.3390/rs12061044
Burton, P. J., Parisien, M. A., Hicke, J. A., Hall, R. J., and Freeburn, J. T. (2007). Large fires as agents of ecological diversity in the north American boreal forest. Int. J. Wildland Fire 17, 754. doi:10.1071/WF07149
Canadian Forest Service (2021). Canadian national fire database. Available at: http://cwfis.cfs.nrcan.gc.ca/datamart
Chuvieco, E., Martín, M. P., and Palacios, A. (2002). Assessment of different spectral indices in the red-near-infrared spectral domain for burned land discrimination. Int. J. Remote Sens. 23, 5103–5110. doi:10.1080/01431160210153129
Clark, J. S. (1990). Fire and climate change during the last 750 yr in northwestern Minnesota. Ecol. Monogr. 60, 135–159. doi:10.2307/1943042
Coops, N. C., Hermosilla, T., Wulder, M. A., White, J. C., and Bolton, D. K. (2018). A thirty year, fine-scale, characterization of area burned in canadian forests shows evidence of regionally increasing trends in the last decade. Plos one 13, e0197218. doi:10.1371/journal.pone.0197218
Ecological Stratification Working Group (1995). A national ecological framework for Canada (Ottawa/Hull: Agriculture and agri-food Canada, research branch, Centre for land and biological resources research, and environment Canada. State Environ. 39, 25.
Flannigan, M. D., Stocks, B. J., and Wotton, B. M. (2000). Climate change and forest fires. Sci. Total Environ. 262, 221–229. doi:10.1016/S0048-9697(00)00524-6
Gaveau, D. L., Wandono, H., and Setiabudi, F. (2007). Three decades of deforestation in southwest sumatra: Have protected areas halted forest loss and logging, and promoted re-growth? Biol. Conserv. 134, 495–504. doi:10.1016/j.biocon.2006.08.035
Gorelick, N., Hancher, M., Dixon, M., Ilyushchenko, S., Thau, D., Moore, R., et al. (2017). Google Earth engine: Planetary-scale geospatial analysis for everyone. Remote Sens. Environ.Big Remote. Sensed Data tools, Appl. Exp. 202, 18–27. doi:10.1016/j.rse.2017.06.031
Hanes, C. C., Wang, X., Jain, P., Parisien, M.-A., Little, J. M., Flannigan, M. D., et al. (2019). Fire-regime changes in Canada over the last half century. Can. J. For. Res. 49, 256–269. doi:10.1139/cjfr-2018-0293
Holden, Z. A., Smith, A. M. S., Morgan, P., Rollins, M. G., and Gessler, P. E. (2005). Evaluation of novel thermally enhanced spectral indices for mapping fire perimeters and comparisons with fire atlas data. Int. J. Remote Sens. 26, 4801–4808. doi:10.1080/01431160500239008
Hudiburg, T. W., Higuera, P. E., and Hicke, J. A. (2017). Fire-regime variability impacts forest carbon dynamics for centuries to millennia. Biogeosciences 14, 3873–3882. doi:10.5194/bg-14-3873-2017
Maretto, R. V., Fonseca, L. M. G., Jacobs, N., Körting, T. S., Bendini, H. N., Parente, L. L., et al. (2021). Spatio-temporal deep learning approach to map deforestation in amazon rainforest. IEEE Geosci. Remote Sens. Lett. 18, 771–775. doi:10.1109/LGRS.2020.2986407
Olofsson, P., Arévalo, P., Espejo, A. B., Green, C., Lindquist, E., McRoberts, R. E., et al. (2020). Mitigating the effects of omission errors on area and area change estimates. Remote Sens. Environ. 236, 111492. doi:10.1016/j.rse.2019.111492
Olofsson, P., Foody, G. M., Herold, M., Stehman, S. V., Woodcock, C. E., Wulder, M. A., et al. (2014). Good practices for estimating area and assessing accuracy of land change. Remote Sens. Environ. 148, 42–57. doi:10.1016/j.rse.2014.02.015
Ortega Adarme, M., Queiroz Feitosa, R., Nigri Happ, P., Aparecido De Almeida, C., and Rodrigues Gomes, A. (2020). Evaluation of deep learning techniques for deforestation detection in the brazilian amazon and cerrado biomes from remote sensing imagery. Remote Sens. 12, 910. doi:10.3390/rs12060910
Pekel, J.-F., Cottam, A., Gorelick, N., and Belward, A. S. (2016). High-resolution mapping of global surface water and its long-term changes. Nature 540, 418–422. doi:10.1038/nature20584
Powell, S. L., Cohen, W. B., Healey, S. P., Kennedy, R. E., Moisen, G. G., Pierce, K. B., et al. (2010). Quantification of live aboveground forest biomass dynamics with landsat time-series and field inventory data: A comparison of empirical modeling approaches. Remote Sens. Environ. 114, 1053–1068. doi:10.1016/j.rse.2009.12.018
Renó, V. F., Novo, E. M., Suemitsu, C., Rennó, C. D., and Silva, T. S. (2011). Assessment of deforestation in the lower amazon floodplain using historical landsat mss/tm imagery. Remote Sens. Environ. 115, 3446–3456. doi:10.1016/j.rse.2011.08.008
Ronneberger, O., Fischer, P., and Brox, T. (2015). “U-net: Convolutional networks for biomedical image segmentation,” in Medical image computing and computer-assisted intervention – miccai 2015. Editors N. Navab, J. Hornegger, W. M. Wells, and A. F. Frangi (Cham: Springer International Publishing), 234–241.
Rouse, J., Haas, R., Schell, J., and Deering, D. (1973). Third earth resources Technology satellite-1 symposium: Section AB technical presentations. Washington D.C.: Scientific and Technical Information Office, National Aeronautics and Space, 309. Paper a 20.
Schaphoff, S., Reyer, C. P., Schepaschenko, D., Gerten, D., and Shvidenko, A. (2016). Tamm review: Observed and projected climate change impacts on Russia’s forests and its carbon balance. For. Ecol. Manag. 361, 432–444. doi:10.1016/j.foreco.2015.11.043
Stehman, S. V. (2014). Estimating area and map accuracy for stratified random sampling when the strata are different from the map classes. Int. J. Remote Sens. 35, 4923–4939. doi:10.1080/01431161.2014.930207
Stocks, B. J., Fosberg, M. A., Lynham, T. J., Mearns, L., Wotton, B. M., Yang, Q., et al. (1998). Climate change and forest fire potential in Russian and canadian boreal forests. Clim. Change 36, 1–13. doi:10.1023/A:1005306001055
Stocks, B., Mason, J., Todd, J., Bosch, E., Wotton, B., Amiro, B., et al. (2002). Large forest fires in Canada, 1959–1997. J. Geophys. Res. 107, 8149. doi:10.1029/2001JD000484
Vogeler, J. C., Slesak, R. A., Fekety, P. A., and Falkowski, M. J. (2020). Characterizing over four decades of forest disturbance in Minnesota, USA. Forests 11, 362. doi:10.3390/f11030362
Weber, M. G., and Flannigan, M. D. (1997). Canadian boreal forest ecosystem structure and function in a changing climate: Impact on fire regimes. Environ. Rev. 5, 145–166. doi:10.1139/er-5-3-4-145
Keywords: forest fire, land cover classification, landsat MSS, deep learning, convolutional neural network (CNN)
Citation: Boothman R and Cardille JA (2022) New techniques for old fires: Using deep learning to augment fire maps from the early satellite era. Front. Environ. Sci. 10:914493. doi: 10.3389/fenvs.2022.914493
Received: 06 April 2022; Accepted: 11 July 2022;
Published: 17 August 2022.
Edited by:
David Thau, World Wildlife Fund, United StatesReviewed by:
Yan Gao, Universidad Nacional Autonoma de Mexico, MexicoPuzhao Zhang, Royal Institute of Technology, Sweden
Copyright © 2022 Boothman and Cardille. This is an open-access article distributed under the terms of the Creative Commons Attribution License (CC BY). The use, distribution or reproduction in other forums is permitted, provided the original author(s) and the copyright owner(s) are credited and that the original publication in this journal is cited, in accordance with accepted academic practice. No use, distribution or reproduction is permitted which does not comply with these terms.
*Correspondence: Rylan Boothman, cnlsYW4uYm9vdGhtYW5AbWFpbC5tY2dpbGwuY2E=