 Siying Wang1
 Xiaokun Lin
94% of researchers rate our articles as excellent or good
Learn more about the work of our research integrity team to safeguard the quality of each article we publish.
Find out more
ORIGINAL RESEARCH article
Front. Environ. Sci., 24 August 2022
Sec. Environmental Informatics and Remote Sensing
Volume 10 - 2022 | https://doi.org/10.3389/fenvs.2022.912523
This article is part of the Research TopicAdvanced Application of Deep Learning, Statistical Modelling, and Numerical Simulation on Geo-Environmental HazardsView all 59 articles
In recent years, the major geological hazard of landslides has greatly impact normal human life. Deep belief networks (DBN) is a commonly used deep learning model, and the DBN hyperparameter determination problem is the key to its application. To improve the accuracy of regional landslide susceptibility prediction, this paper introduces the particle swarm algorithm (PSO) to determine the hyperparameters of the DBN; this is applied to regional landslide susceptibility prediction. Firstly, PSO is used to optimize the hyperparameters of the DBN and obtain a set of hyperparameters with the optimal fitness function. A landslide susceptibility prediction model based on PSO-DBN is then constructed and the K-fold cross-validation method is used to determine its accuracy. The model is applied to landslide susceptibility prediction in the most impacted area of the Wenchuan earthquake to analyze the model’s accuracy. Finally, model susceptibility analysis is performed. The research results show that the final optimal model accuracy of the PSO-DBN model is 95.52%, which is approximately 28.31% and 15.35% higher than that of the logistic regression (LR) model and the common DBN model, respectively. The Kappa coefficient is 0.883, which is higher than that of the LR model. Compared with the LR model and the common DBN model, Kappa coefficient is improved by approximately 0.542 and 0.269 respectively; the area under the curve (AUC) is 0.951, which is improved by approximately 0.201 and 0.080 compared to the LR model and the common DBN model. The susceptibility of the model to the inertia factor is low, the average change in model accuracy (when the inertia factor changes by 0.1) is approximately 0.1%, and the overall stability of the model is high. The landslide susceptibility level is very high. The area includes 219 landslide points, which account for 39.2% of total landslide points. In the area with a high level of landslide susceptibility are 191 landslide points, accounting for 34.2% of total landslide points. Together, the two contain approximately 73.4% of the landslide points. This indicates that the model prediction results agree well with the spatial distribution characteristics of the landslide.
Sichuan Province has some of the most serious geological hazard in China. Approximately 97% of its land area is in geologically disaster-prone areas. By the end of 2020, Sichuan Province had identified more than 36,000 hidden dangers from various geological hazards, including more than 22,000 landslides, which threatened the lives of 1.5 million people and the safety of 85 billion yuan worth of property (People’s Government of Sichuan Province). Therefore, it is especially important to apply scientific methods to evaluate the susceptibility of geological hazards in the study area and to take necessary preventive measures to protect the safety of human life and property.
The main components of geological disaster assessment include risk assessment, susceptibility assessment, damage loss assessment and prevention, and control engineering assessment. Of these, risk assessment and vulnerability assessment are the basis of disaster assessment, damage loss assessment is the core of disaster assessment, and prevention and control engineering assessment is the application of disaster assessment. There are two main types of susceptibility assessment methods for geological hazards. The first is the application of empirical knowledge to seismic geohazard prediction based on the analysis of the genetic mechanisms of geohazards (Paronuzzi et al., 2021). The second is reliance on quantitative techniques to obtain the probability of a geohazard occurrence based on the theoretical analysis of the relationship between the geohazard-influencing factors and geohazards (Osna et al., 2014; Ma and Mei, 2021). The second method is more objective and obtains the probability of geohazard occurrences by simulating conditions, such as topography, geology, and the seismic parameters of areas where geohazards occur (Wang et al., 2016; Chen et al., 2019; Zhou et al., 2021). There has also been much research on the principal manifestations of the dynamic coupling of endogenic and exogenic geological processes in the form of earthquake geohazards, on conditions in the form of post-earthquake hazard chains, and on the process of disaster formation (Fan et al., 2019; Zhang and Wu, 2019). For example, among the existing multivariate statistical methods for the spatial quantitative modeling of landslide hazards, the LR model is one of the most widely used. Its main advantage is that it allows the use of a binary dependent variable—the occurrence of landslides in susceptibility mapping (Yilmaz, 2009; Ozdemir and Altural, 2013; Kavzoglu et al., 2014; Chan et al., 2018; Tian et al., 2019). In addition, methodological models, such as the frequency ratio model, multivariate adaptive regression splines, the generalized summation model, the deterministic factor method, the weight of evidence, and the entropy method have also been widely used in the spatial modeling of landslide hazards (Pardeshi et al., 2013; Xu et al., 2013; Jaafari et al., 2014; Regmi et al., 2014; Conoscenti et al., 2015; Youssef et al., 2015; Ilia and Tsangaratos, 2016; Xie et al., 2017; Ma and Xu, 2019). However, researchers have found that traditional mathematical methods were not sufficient to address the problems caused by the complexity of topography, geology, and other elements associated with the occurrence of landslide hazards: more flexible nonlinear methods were generally needed. At present, machine learning methods such as artificial neural networks, support vector machines, random forests, and adaptive neuro-fuzzy inference systems are used for modeling, leading to further studies on landslide susceptibility maps (Van Westen et al., 2006). Among such methods, deep learning is particularly outstanding (Wang et al., 2020a). Commonly used deep learning models include DNN, convolutional neural networks (CNN), DBN (Li et al., 2021b), deep residual networks (DRN) (Li, 2022a), and long short-term memory (LSTM) (Li et al., 2021a; Li, 2022b). Of these, DBN is the most widely used model. It consists of several restricted Boltzmann machines (RBMs) and an unsupervised learning framework trained by a contrastive divergence algorithm. Its essence is to learn more abstract high-level characteristics containing semantic information by building machine learning models with many hidden layers and large amounts of training data, which can ultimately improve classification or prediction accuracy (Ma et al., 2016; Wang et al., 2017).
How to improve the quality of a model is always a focus of attention by researchers, although related studies have been conducted on improving predictive accuracy (Safran et al., 2015). Although many techniques have been proposed and used, there is currently no unified paradigm for landslide hazard susceptibility research (Chowdhuri et al., 2020). At present, there are many aspects to the optimization of DBN, such as the group search-based multi-verse optimization algorithm, the improved sunflower optimization (IFSO) algorithm which optimizes DBN by adjusting the weights (Shen et al., 2020; Kumar et al., 2022), the PSO algorithm, the improved gray wolf optimization algorithm, and the information entropy method, which optimizes the learning rate and the DBN network structure by determining the number of neurons in the DBN hidden layer (Gai et al., 2021; Jia et al., 2021; Jin et al., 2022). In addition, the principal component analysis method improves the training efficiency of the DBN model by reducing the number of design variables (Jun et al., 2020), and the regularization method optimizes the DBN model by reducing the error rate (Elleuch et al., 2017). Currently, the optimization of the deep learning model is focused on its structural hyperparameters, which are determined randomly. The hyperparameters studied by researchers mainly include the number of hidden layers (Choldun et al., 2019), learning rate (Yu et al., 1995), convolution kernel density (Mohsenzadeh and Sheikhzadeh, 2014), weight attenuation coefficient (Wang et al., 2021), and the dropout ratio (Park and Kwak, 2016). The vast majority of them optimize only one or two hyperparameters. However, it is important to clarify that the deep learning model is a complex network system, so optimizing only a small number of hyperparameters is likely to result in local optimization. Therefore, optimizing multiple hyperparameters of the deep learning model at the same time may lead to better results.
After the 2008 earthquake in Wenchuan County, Sichuan Province, post-earthquake geological hazards occurred frequently, among which landslide hazards were the most representative, seriously affecting the sustainable development of the region. Neural networks are widely used in landslide susceptibility prediction; the settings of the hyperparameter batch size, learning rate, and so on have always been key factors affecting the prediction effect of a neural network. However, most of the hyperparameters in neural network models are artificially determined, which makes established neural network models inevitably subjective, thus affecting the prediction effect of the model. Therefore, scientifically determining these parameters is the key to improving the prediction accuracy of the neural network (Cui et al., 2021).
To realize the scientific setting of neural network hyperparameters and eliminate the shortcomings of setting artificial hyperparameters to further improve the accuracy of neural network prediction, this paper proposes the PSO algorithm to solve the hyperparameter optimization problem in the DBN algorithm. This solution is then applied to landslide susceptibility prediction. Firstly, the PSO algorithm is introduced to optimize the hyperparameters of the DBN algorithm. Secondly, a landslide susceptibility prediction model based on PSO-DBN is built. Then, the validity of the constructed model is verified by the example of the most impacted areas of the Wenchuan earthquake in Sichuan. Finally, the influence of the inertia factor on the accuracy of the model is analyzed.
On 12 May 2008, a magnitude 8.0 earthquake occurred in Wenchuan County, Longmen Mountain Region, Sichuan, causing heavy casualties and economic losses. Post-earthquake investigations revealed 18,000 potential geological hazards in Sichuan Province alone that pose a direct threat to people’s lives and property safety that were caused by the earthquake. Among them are dozens of landslides with a scale of more than 10 million m3, and more than ten landslides that buried hundreds of people (Gorum et al., 2011).
This paper employs the ten extremely earthquake-stricken areas in the 2008 Wenchuan earthquake as the research area. These ten areas are Dujiangyan, Pengzhou, Mianzhu, Shifang, Anxian, Beichuan, Qingchuan, Pingwu, Wenchuan, and Maoxian, as displayed in Figure 1. The location and spatial distribution of the landslide hazard points in the study area are obtained through remote sensing interpretation technology. The data we selected are from 2016. Figure 1A shows that the landslide points in the study area are relatively densely distributed. ArcGIS software was then used to divide the study area into grids with pixels of 60 m * 60 m, generating 9,936,770 grids . Thence, 668 landslide points in the study area were obtained by remote sensing interpretation while 668 non-landslide points were randomly selected in the study area 10 km away from the landslide point, giving a total of 1,336 sample points.
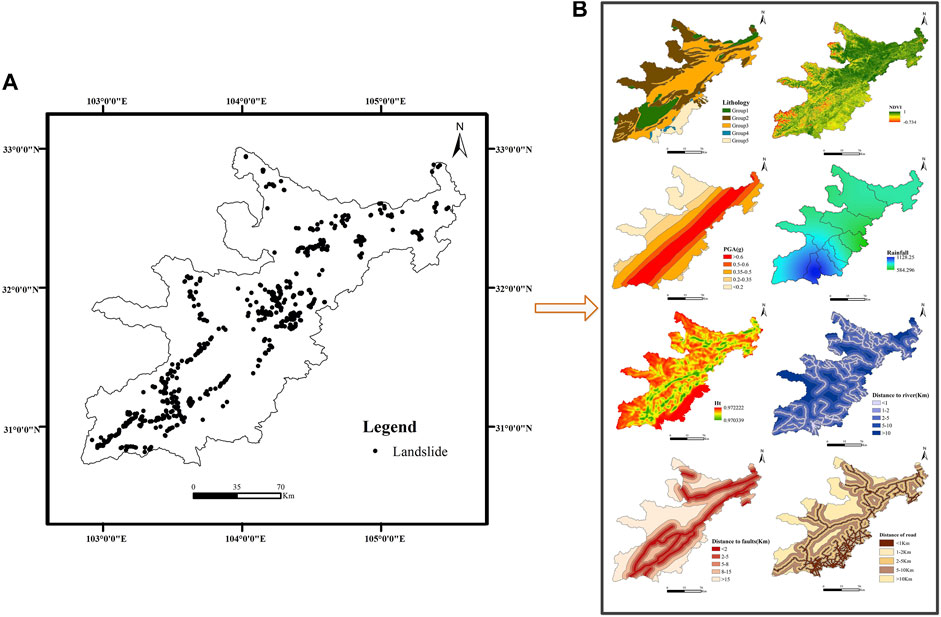
FIGURE 1. Overview of the research area. (A) shows the distribution of landslide points in the study area, and (B) shows the distribution of the size of eight influencing factors in the study area.
In selecting influencing factors, the literature reviewed and the availability of the data are the main considerations, with all selected influencing factors playing the same role across different types of landslide (Pourghasemi et al., 2012). After comprehensive consideration, this paper uses ArcGIS to extract eight influencing factors (Figure 1B): the terrain information entropy (terrain-geomorphology factor), the distance to faults, the distance to rivers, the normalized difference vegetation index (NDVI), lithology (geological environmental factor), the distance from the road, peak ground acceleration (PGA), and the average annual rainfall (inducing factor). The details of the impact factors are depicted in Table 1.
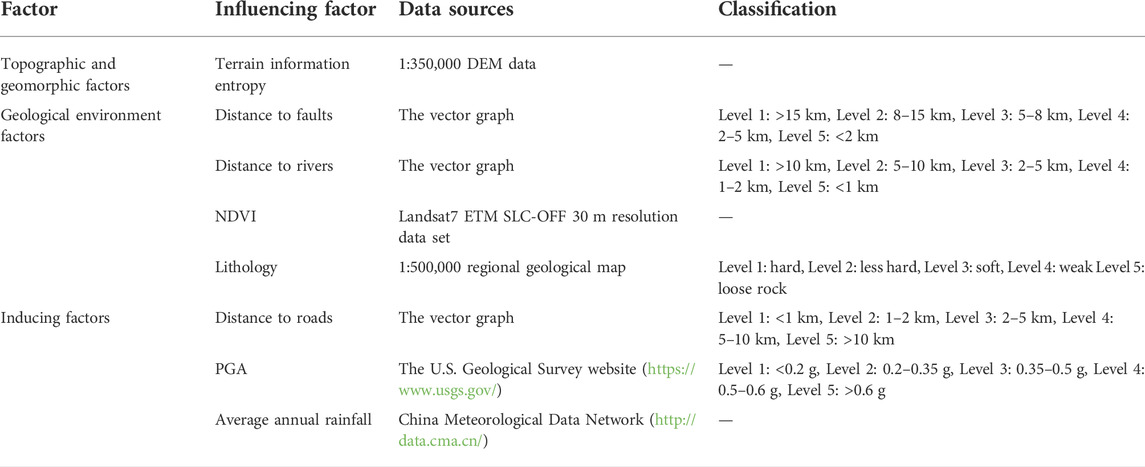
TABLE 1. The specific situation of the influencing factors.
On the basis of the common DBN model, PSO is introduced in this paper to optimize the hyperparameters of the DBN model; a landslide susceptibility prediction model based on PSO-DBN is thus constructed (Figure 2). The specific steps are:
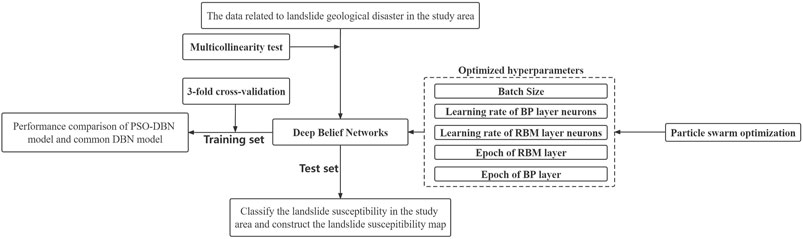
FIGURE 2. Research framework diagram.
Step 1: Determine the parameters, such as the inertia factor, the learning factor, population size, and the number of iterations of the PSO.
Step 2: Determine the basic structure of the conventional model—that is, determine the number of hidden layers of the DBN model and the number of neurons in each layer.
Step 3: Determine the hyperparameters of DBN (batch size, learning rate of neurons in the BP layer, learning rate of neurons in the RBM layer, epoch of the RBM layer, epoch of the BP layer) using the PSO (PSO).
Step 4: Obtain 668 landslide points in the study area by remote sensing interpretation and 668 randomly selected non-landslide points in the study area 10 km away from the landslide point, for a total of 1,336 sample points.
Step 5: Extract the entropy of the terrain information (terrain-geomorphology factor), distance to faults, distance to rivers, NDVI, lithology (geological environmental factor), distance to road, PGA, and average annual rainfall (inducing factor) as eight influencing factors for DBN. A multicollinearity test was performed on the eight influencing factors and then the already-processed training set was applied to train the PSO-DBN model.
Step 6: Using the K-fold cross-validation method, divide the training set into K equal parts, with the number of landslide points in each part equal to the number of non-landslide points. One subset was selected as the validation set without repetition and the remaining K−1 subsets were merged into the training set. Accuracy and other evaluation indices were calculated in each test and the generalization ability of the model was evaluated by taking the average value of evaluation indices after K tests. We then compared and analyzed the PSO-DBN model with the LR model and the common DBN model by calculating the accuracy, AUC, Kappa coefficient, and the ROC curve.
Step 7: Select the PSO-DBN model with the highest model accuracy to predict landslide susceptibility in the research area.
Multicollinearity refers to the linear dependence of two or more related variables in a dataset. The collinearity between evaluation factors can be investigated through the two statistics of variance inflation factor (VIF) and tolerance (Adeboye et al., 2014; Perez-Melo and Kibria, 2020). The ideal evaluation factor can be selected to build a model with higher performance. The calculation formula of the variance inflation factor and tolerance is as follows:
where
Previous research has shown that a linear relationship between parameters minimizes the predictability of the model. Therefore, to improve the model's predictability, SPSS software was used to conduct a multicollinearity test on the above eight evaluation factors preliminarily selected to further screen the evaluation factors. Any tolerance less than 0.1 and VIF value >10 indicates the existence of a multicollinearity problem (Katrutsa and Strijov, 2017).
Figure 3 shows the schematic diagram of DBN. The DBN model is composed of four layers of neurons; the first layer is the input layer, and its number of neurons is determined by the characteristic number of the input data. The last layer is the output layer, and its number of neurons is determined by the number of categories for classification (Chu and Krzyżak, 2014). The first two layers of the DBN model make up the first RBM, where the first layer is the explicit layer and the second is the hidden layer of the RBM. The hidden layer of the first RBM is the explicit layer of the second RBM and the third layer of the DBN model is the hidden layer of the second RBM, making up the second RBM. The last layer is the BP layer of the DBN model (Salakhutdinov and Murray, 2008; Mohamed et al., 2011; Jang et al., 2017). The neurons between the first and second layers and the second and third layers are connected in an undirected and full manner, while the neurons between the third and fourth layers are connected in a directed and full manner, with neurons in the third layer pointing to neurons in the fourth. The two RBMs are responsible for pretraining the DBN model and the BP layer is responsible for back-tuning the DBN model (Hua et al., 2015).
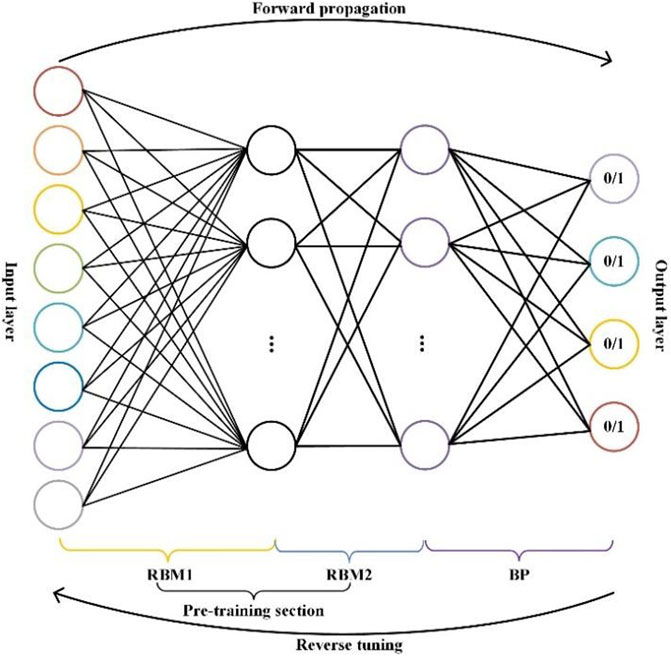
FIGURE 3. Schematic diagram of the DBN structure.
The RBM consists of two layers, including an explicit layer and a hidden layer. The connection between these layers is a bidirectional full connection, while the neurons within the same layer are not connected. Assuming that there are
In the RBM, the probability of the hidden layer neuron being activated is as follows (Mohamed et al., 2009):
Similarly, explicit layer neurons can also be activated by hidden layer neurons as follows (Mohamed et al., 2009):
where
Since there is independence between neurons in the same layer, the probability density also satisfies independence, which we can obtain thus (Mohamed et al., 2009):
Step 1: Fully train the first RBM.
Step 2: Fix the weight and bias of the first RBM, and then use the states of its hidden neurons as the input vectors of the second RBM.
Step 3: After fully training the second RBM, stack it on top of the first RBM.
Step 4: Repeat Steps 1 to 3.
Step 5: Set up the BP neural network in the last layer of DBN and fine-tune the whole DBN model by backward error propagation.
The selection of DBN hyperparameters is an optimization process where each point in the search space is a feasible solution and the objective function can be the loss function of the DBN model. Therefore, the optimal combination of hyperparameters for DBN is, in fact, the combination of hyperparameters that minimizes the value of the loss function of DBN on the validation set. PSO is a population-based evolutionary algorithm with concepts derived from the theory of artificial life and from evolutionary computation. The process of determining the DBN hyperparameters based on the PSO algorithm is shown in Figure 4.
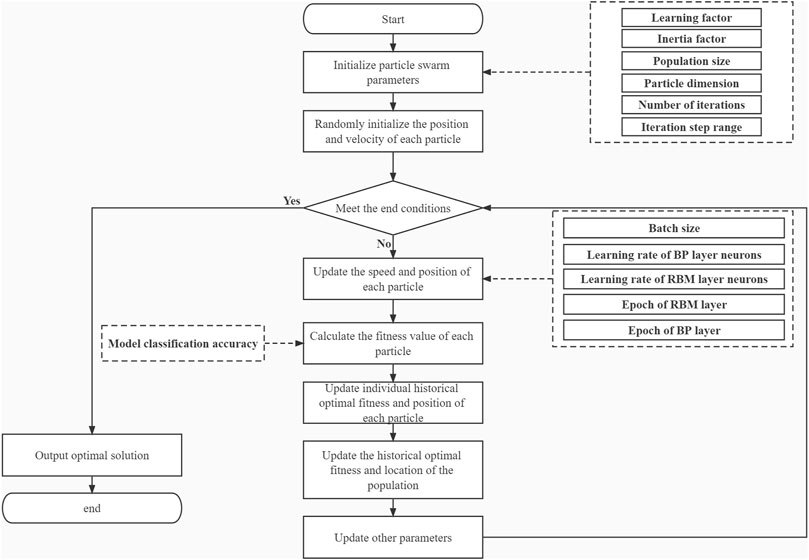
FIGURE 4. Particle swarm optimization algorithm flow chart.
Assume that, in a dimensional search space, each particle forms a cluster, where the position information of each particle can be expressed as
where
K-fold cross-validation is a common method used in machine learning to improve the accuracy of a model, overcoming the disadvantage of considerably varying its accuracy due to the division of the dataset into a training set and a validation set. The basic principle is that the dataset is randomly divided into K parts, one of which is used as the validation set and the other K−1 parts are used as the training set each time. The specific steps are:
Step 1: Divide the known dataset into K parts.
Step 2: Take one of the K parts as the validation set and the other K−1 parts as the training set each time without repetition. Then, calculate the classification accuracy of the model based on the validation set. The classification accuracy of the model for the
where
Step 3: Calculate the final classification accuracy of the model as follows:
In classification, the proportion of samples of each category in every part is the same as that in the total dataset. K-fold cross-validation runs the model K times and the average of the metrics obtained are the final performance of the model. The flow chart for K-fold cross-validation is shown in Figure 5.
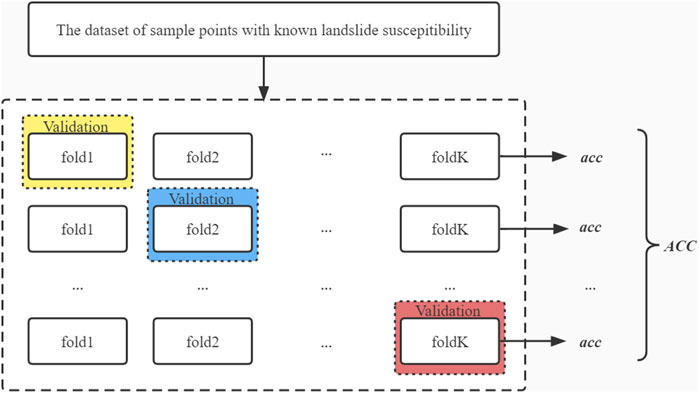
FIGURE 5. K-fold cross-validation flow chat.
Before using K-fold cross-validation, the K value first needs to be determined; the following formula is used to determine the K value in this paper (Jung, 2018).
where
Firstly, the entropy of the terrain information (terrain-geomorphology factor), distance to faults, distance to rivers, NDVI, lithology (geological environmental factor), distance to road, PGA, and average annual rainfall (inducing factor) are extracted as eight influencing factors for DBN. Then, all data are normalized to set the values of all the influencing factors between 0 and 1 in order to eliminate the dimensional influence and speed up the convergence of the algorithm.
Then, the multicollinearity test is carried out on the eight selected factors. The multicollinearity test results are as follows:
Tolerance (the number in parentheses is the tolerance of the influence factor): terrain information entropy (0.771), distance to faults (0.630), distance to rivers (0.850), NDVI (0.885), lithology (0.709), distance to the roads (0.669), PGA (0.734), average annual rainfall (0.710).
VIF (the number in parentheses is the VIF of the influence factor): terrain information entropy (1.297), distance to faults (1.588), distance to rivers (1.177), NDVI (1.130), lithology (1.410), distance to the roads (1.496), PGA (1.363), average annual rainfall (1.409).
The results show that the tolerances of the eight impact factors are all greater than 0.1 and the VIFs of the eight impact factors are all less than 10. This can fully explain why there is no collinearity among the eight influencing factors selected in this paper.
Firstly, the hyperparameters to be optimized are determined before performing DBN hyperparameter optimization. The choice of hyperparameters is important for the optimization results. Here, we chose five hyperparameters: batch size
The search ranges for the five hyperparameters in this paper are shown in Table 2.
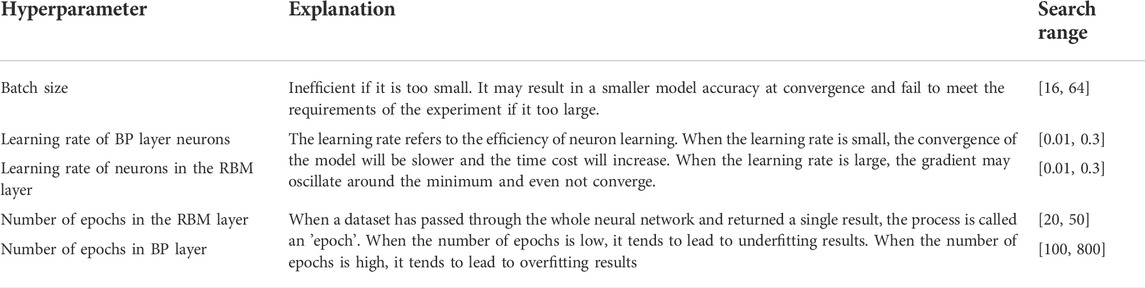
TABLE 2. Search range of DBN hyperparameters.
There are five main parameters to be determined in the PSO: the inertia factor, the cognitive learning factor, the population cognitive learning factor, the population size, and the maximum number of iterations. The specific settings for these parameters are as follows (the numbers in parentheses are the values of the PSO arguments): inertia factor (0.5), self-awareness learning factor (0.2), population cognitive learning factor (0.5), population size (50), maximum number of iterations (10).
In this paper, a four-layer DBN (including two hidden layers) is built, where the output layer contains four neurons: the outputs of these are the probabilities of the landslide susceptibility levels of 0, 1, 2 and 3 for the sample points. The eight influencing factors of 1,336 sample points with known landslide susceptibility (including 668 non-landslide points) are taken as input and the landslide susceptibility class is taken as output. The PSO is applied using the five hyperparameters of the DBN model mentioned above as the optimization hyperparameters and the classification accuracy of the DBN model as the adaptation value of the particles (hyperparameter group), iterating ten times with 50 particles and recording the optimal adaptation value obtained from each iteration. The iterative process, the optimal model accuracy (validation set and training set), and the corresponding hyperparameter combinations for each iteration are shown in Table 3 (note: in the column ‘hyperparameter combinations’, the items from left to right are the batch size, learning rate of neurons in the BP layer, learning rate of neurons in the RBM layer, epoch number of the RBM layer, and epoch number of the BP layer).
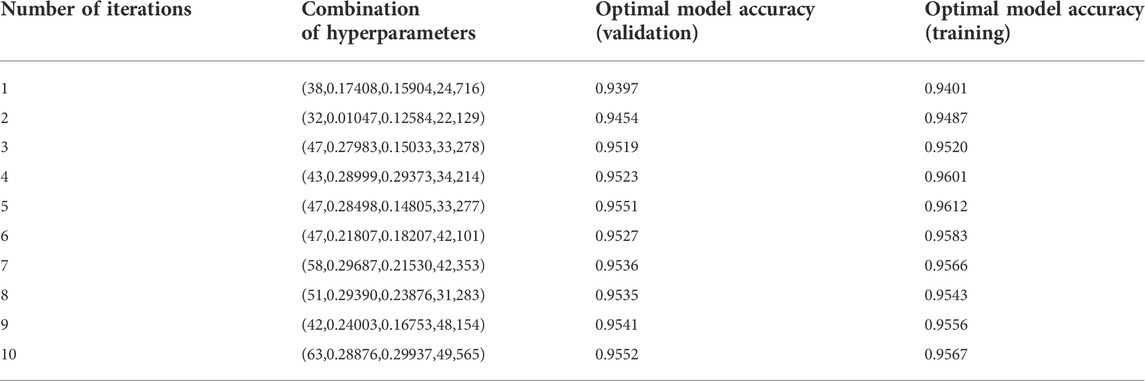
TABLE 3. Iteration process of PSO-DBN model.
Table 3 shows that the optimal model accuracy (validation set and training set) of the population increases with the number of iterations; the final optimal adaptation value (validation set) corresponding to the optimal parameters is
After establishing the PSO-DBN model, this paper, in order to more intuitively show the superiority of the PSO-DBN model, compares the accuracy, robustness, and stability of the PSO-DBN model with the common DBN model using performance evaluation indicators such as ROC curves and AUC values. Within the hyperparameter search range in Section 3.1, 30 different sets of hyperparameters are randomly selected to train the common DBN model under these hyperparameter sets. The ROC curves, AUC values, and other metrics of the common DBN model train under 30 different sets of the obtained hyperparameters. The performance of the PSO-DBN model is then judged by comparing these model performance evaluation metrics.
Using three-fold cross-validation, the AUC, Kappa coefficient, and the mean and standard deviation of the accuracy of the validation set of the LR model and the common DBN model corresponding to the 30 sets of obtained hyperparameters are displayed in Tables 4, 5. In 30 training sessions, the average values of AUC, Kappa coefficients, and accuracy of the LR model are 0.750, 0.341, and 0.670, respectively. The average values of AUC, Kappa coefficients, and accuracy of the common DBN model were 0.871, 0.602, and 0.801, respectively. The AUC, Kappa coefficient, and accuracy obtained by the LR model and the common DBN model training are lower than the results obtained by the PSO-DBN model training (AUC is 0.951, Kappa coefficient is 0.883, accuracy is 95.52%). The standard deviations of the AUC, Kappa coefficient, and accuracy obtained by the LR model after training are 0.030, 0.065, and 0.081, respectively. The standard deviations of the AUC, Kappa coefficient, and accuracy obtained by the common DBN model after training are 0.023, 0.070, and 0.043, respectively, indicating that the logistic regression model and the common DBN model have poor stability. When comparing the performance indicators obtained by the LR model (mean), the common DBN model (mean), and the PSO-DBN model training (as shown in Figures 6, 7), it was found that the PSO-DBN model performs better in terms of the AUC and the Kappa coefficient. The accuracy is also higher than the LR model and the common DBN model. At the same time, the ROC curve of the PSO-DBN model is more inclined to the upper-left corner than the ROC curve of the LR model and the common DBN model, and the AUC is larger. The above results demonstrate that the model performance of the PSO-DBN model is better than that of the LR model and the common DBN model.
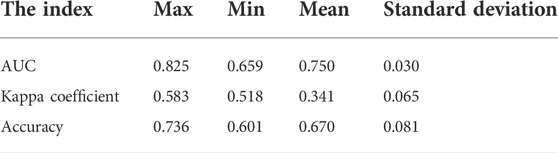
TABLE 4. Logistic regression model training results (30 times).

TABLE 5. Training results of common DBN model (30 times).
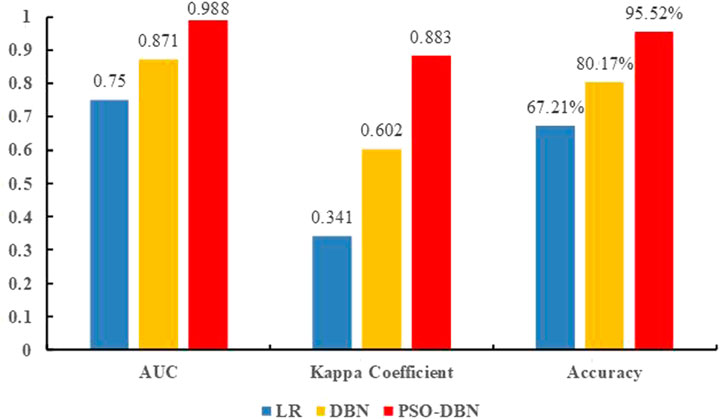
FIGURE 6. Comparison of performance indexes between logistic regression model, general DBN model and PSO-DBN model
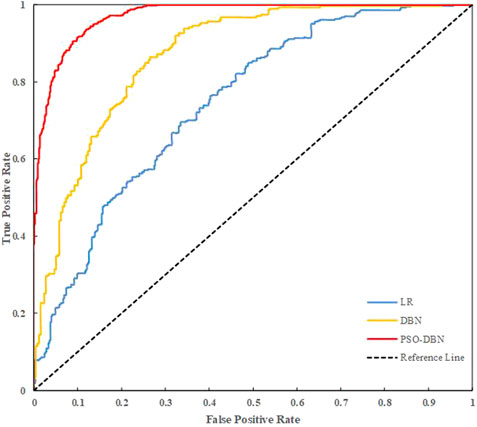
FIGURE 7. ROC curves of the three models.
Using a test set of 9,936,770 sample points as input, the already trained PSO-DBN model is applied to predict the landslide susceptibility in the study area. This paper divides landslide susceptibility maps into four categories: low, moderate, high, and very high. The predicted results are plotted as a landslide susceptibility map (Figure 8).
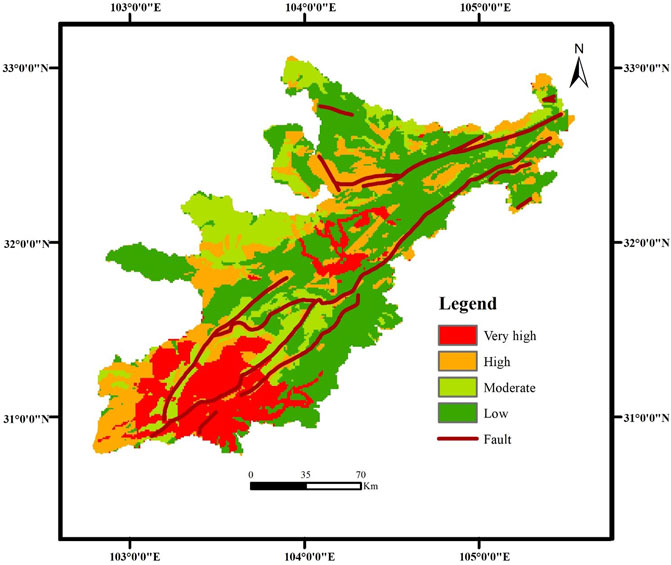
FIGURE 8. Landslide susceptibility map.
As seen in Figure 8, in terms of landslide susceptibility, the distribution trend of the region with high landslide susceptibility is roughly the same as that of the fault zone, while the susceptibility of the region far from the non-fault zone is relatively low. At the same time, statistical methods are applied to the landslide susceptibility characteristics of the research area; the results are shown in Table 6.
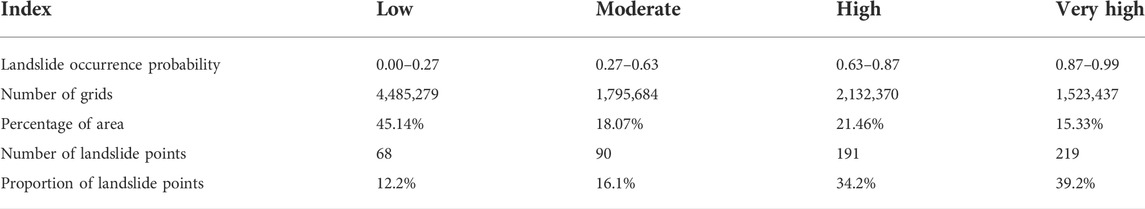
TABLE 6. Statistics on landslide susceptibility prediction results.
As seen in Table 6, the highest number of units are in the landslide susceptibility class–low and the lowest number of units are in the landslide susceptibility class–very high. The areas with landslide susceptibility classes–low, –moderate, –high, and –very high respectively account for 45.14%, 18.07%, 21.46% and 15.33% of the total area of the research region. The area with the landslide susceptibility class–very high contains 219 landslide points, accounting for 39.2% of the total number of landslide points, and the area with the landslide susceptibility class–high contains 191 landslide points, accounting for 34.2% of the total number of landslide points. The proportion of landslide points occupied by each grade area obtained above is consistent with the research results of Yang et al. (2015). At the same time, it was found that the higher the landslide susceptibility, the smaller the proportion of the area occupies. This was confirmed by Wang et al. (2020b).
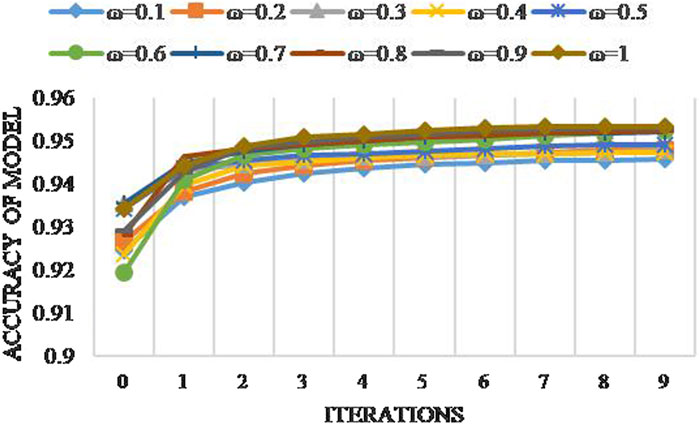
FIGURE 9. Iteration curves of the PSO-DBN model with different inertia factors.
In Figure 9, it was found that the larger the inertia factor, the higher the model accuracy of the PSO-DBN model; however, the change is not larger. It tends to be stable after the ninth iteration and the difference is very small. Therefore, the training effect of the model is less sensitive to the inertia factor and the stability of the model is higher.
The accuracy of the landslide prediction model is affected by the model itself and the input data. At present, data-driven supervised learning of landslide susceptibility is widely used. For the data-driven supervised learning method, most of the models have a “black box” nature and most of the hyperparameters of the model are artificially determined, which has many disadvantages. In this paper, PSO is used to optimize the hyperparameters of the DBN, and the optimal combination of the hyperparameters is found within a certain range for each evaluation index of the model, thus avoiding the above drawbacks to a certain extent. Although the hyperparameters of the DBN model were determined, Da and Xiurun improved PSO by using simulated annealing (SA) technology to establish a neural network based on SAPSO, thus improving the global search capability of traditional PSO (Da and Xiurun, 2005). In this paper, PSO is adopted to determine the DBN hyperparameters. Although it can, to a certain extent, avoid the disadvantages of artificially determining hyperparameters, it lacks the comparison of multiple methods (Shen et al., 2020; Kumar et al., 2022), which is worthy of further discussion.
This paper analyzes the accuracy of landslide susceptibility prediction based on PSO-DBN. The prediction results of the PSO-DBN model are obviously satisfactory. Table 6 shows that 87.8% of known landslide points are divided into the region with moderate landslide susceptibility by the PSO-DBN model. This model can accurately reflect the spatial distribution characteristics of landslide hazards. In terms of the selection of non-landslide points, it adopts random sampling in the region outside a certain buffer zone of positive samples, which ignores the spatial autocorrelation and regional heterogeneity of landslide hazards, and has high uncertainty. There is no unified selection standard for buffer distance. Therefore, the selection method of non-landslide points is worth further discussion.
In this paper, on the basis of the common DBN model, PSO is introduced to optimize its hyperparameters, and a prediction model for landslide susceptibility analysis based on the PSO-DBN model is constructed. The following conclusions can be obtained by comparing it with the common DBN model.
(1) In terms of performance evaluation indices, the accuracy, Kappa coefficient, and AUC of the model finally determined by the PSO-DBN model are 95.52%, 0.883 and 0.921 respectively, which are better than those of the LR and the common DBN models. This indicates that the PSO-DBN model is superior to the LR model and the common DBN model in terms of model performance, robustness, and stability.
(2) The best performing hyperparametric combinations are batch size (63), learning rate of neurons in the BP layer (0.28876), learning rate of neurons in the RBM layer (0.29937), number of epochs in the RBM layer (49), and number of epochs in the BP layer (565). At the same time, it can be seen that the convergence speed of the PSO-DBN model is rapid and that the optimal accuracy of the validation set reaches more than 95% in the third iteration. The sensitivity of the PSO-DBN model to the inertia factor is low and the average variation in the model’s accuracy (when the inertia factor changes by 0.1) is approximately 0.1%. This shows that the model has high stability.
(3) The present study selects eight influencing factors: terrain information entropy, distance to rivers, distance to faults, lithology, NDVI, distance to roads, PGA, and average annual rainfall. A prediction model for landslide susceptibility analysis based on the PSO-DBN model is constructed and the landslide susceptibility is classified as very high, high, moderate, and low using the natural breakpoint method; a landslide susceptibility map is then produced. The number of landslide points in the areas with low, moderate, high, and very high landslide susceptibility classes accounted for 12.2%, 16.1%, 34.2%, and 39.2% of the total number of landslide points respectively. Approximately 87.8% of known landslide points were classified by the PSO-DBN model into regions with moderate landslide susceptibility or above, which indicates that the model prediction results agree well with the spatial distribution of landslides.
The data analyzed in this study is subject to the following licenses/restrictions: Due to geolocation data involved, the data cannot be made public. Requests to access these datasets should be directed to XL, bHhrMDEwNjE2QDE2My5jb20=.
Conceptualization, SW and XL. Methodology, XL and XQ. Software, XQ and HL. Writing—original draft preparation, SW and XL. Writing—review and editing, JY. All authors contributed to manuscript revision, read, and approved the submitted version.
This research was funded by National College Students Innovation and Entrepreneur-ship Training Program, grant number 202110616034.
The authors declare that the research was conducted in the absence of any commercial or financial relationships that could be construed as a potential conflict of interest.
All claims expressed in this article are solely those of the authors and do not necessarily represent those of their affiliated organizations, or those of the publisher, the editors and the reviewers. Any product that may be evaluated in this article, or claim that may be made by its manufacturer, is not guaranteed or endorsed by the publisher.
Adeboye, N., Fagoyinbo, I., and Olatayo, T. (2014). Estimation of the effect of multicollinearity on the standard error for regression coefficients. IOSR J. Math. 10, 16–20. doi:10.9790/5728-10411620
Cai, X., Qiu, H., Gao, L., Jiang, C., and Shao, X. (2019). An efficient surrogate-assisted particle swarm optimization algorithm for high-dimensional expensive problems. Knowledge-Based Syst. 184, 104901. doi:10.1016/j.knosys.2019.104901
Chan, H.-C., Chen, P.-A., and Lee, J.-T. (2018). Rainfall-induced landslide susceptibility using a rainfall–runoff model and logistic regression. Water 10 (10), 1354. doi:10.3390/w10101354
Chen, X., Li, L., Wang, L., and Qi, L. (2019). The current situation and prevention and control countermeasures for typical dynamic disasters in kilometer-deep mines in China. Saf. Sci. 115, 229–236. doi:10.1016/j.ssci.2019.02.010
Choldun, I., Santoso, J., and Surendro, K. (2019). “Determining the number of hidden layers in neural network by using principal component analysis,” in Proceedings of SAI Intelligent Systems Conference, London, United Kingdom, September 05, 2019 (Springer), 490–500. doi:10.1007/978-3-030-29513-4_36
Chowdhuri, I., Pal, S. C., Arabameri, A., Ngo, P. T. T., Chakrabortty, R., Malik, S., et al. (2020). Ensemble approach to develop landslide susceptibility map in landslide dominated Sikkim Himalayan region, India. Environ. Earth Sci. 79 (20), 476–528. doi:10.1007/s12665-020-09227-5
Chu, J. L., and Krzyżak, A. (2014). The recognition of partially occluded objects with support vector machines, convolutional neural networks and deep belief networks. J. Artif. Intell. Soft Comput. Res. 4 (1), 5–19. doi:10.2478/jaiscr-2014-0021
Conoscenti, C., Ciaccio, M., Caraballo-Arias, N. A., Gómez-Gutiérrez, Á., Rotigliano, E., and Agnesi, V. (2015). Assessment of susceptibility to earth-flow landslide using logistic regression and multivariate adaptive regression splines: A case of the belice river basin (Western sicily, Italy). Geomorphology 242, 49–64. doi:10.1016/j.geomorph.2014.09.020
Cui, S., Pei, X., Jiang, Y., Wang, G., Fan, X., Yang, Q., et al. (2021). Liquefaction within a bedding fault: Understanding the initiation and movement of the Daguangbao landslide triggered by the 2008 Wenchuan Earthquake (Ms= 8.0). Eng. Geol. 295, 106455. doi:10.1016/j.enggeo.2021.106455
Da, Y., and Xiurun, G. (2005). An improved PSO-based ANN with simulated annealing technique. Neurocomputing 63, 527–533. doi:10.1016/j.neucom.2004.07.002
Elleuch, M., Tagougui, N., and Kherallah, M. (2017). Optimization of DBN using regularization methods applied for recognizing Arabic handwritten script. Procedia Comput. Sci. 108, 2292–2297. doi:10.1016/j.procs.2017.05.070
Fan, X., Scaringi, G., Korup, O., West, A. J., van Westen, C. J., Tanyas, H., et al. (2019). Earthquake‐induced chains of geologic hazards: Patterns, mechanisms, and impacts. Rev. Geophys. 57 (2), 421–503. doi:10.1029/2018RG000626
Gai, J., Zhong, K., Du, X., Yan, K., and Shen, J. (2021). Detection of gear fault severity based on parameter-optimized deep belief network using sparrow search algorithm. Measurement 185, 110079. doi:10.1016/j.measurement.2021.110079
Gorum, T., Fan, X., van Westen, C. J., Huang, R. Q., Xu, Q., Tang, C., et al. (2011). Distribution pattern of earthquake-induced landslides triggered by the 12 May 2008 Wenchuan earthquake. Geomorphology 133 (3-4), 152–167. doi:10.1016/j.geomorph.2010.12.030
Hua, Y., Guo, J., and Zhao, H. (2015). “Deep belief networks and deep learning,” in Proceedings of 2015 International Conference on Intelligent Computing and Internet of Things, Harbin, 17-18 January 2015 (IEEE), 1–4. doi:10.1109/ICAIOT.2015.7111524
Ilia, I., and Tsangaratos, P. (2016). Applying weight of evidence method and sensitivity analysis to produce a landslide susceptibility map. Landslides 13 (2), 379–397. doi:10.1007/s10346-015-0576-3
Jaafari, A., Najafi, A., Pourghasemi, H., Rezaeian, J., and Sattarian, A. (2014). GIS-based frequency ratio and index of entropy models for landslide susceptibility assessment in the Caspian forest, northern Iran. Int. J. Environ. Sci. Technol. (Tehran). 11 (4), 909–926. doi:10.1007/s13762-013-0464-0
Jang, H., Plis, S. M., Calhoun, V. D., and Lee, J.-H. (2017). Task-specific feature extraction and classification of fMRI volumes using a deep neural network initialized with a deep belief network: Evaluation using sensorimotor tasks. NeuroImage 145, 314–328. doi:10.1016/j.neuroimage.2016.04.003
Jia, H., Liu, J., Zhang, M., He, X., and Sun, W. (2021). Network intrusion detection based on IE-DBN model. Comput. Commun. 178, 131–140. doi:10.1016/j.comcom.2021.07.016
Jin, Z., He, D., and Wei, Z. (2022). Intelligent fault diagnosis of train axle box bearing based on parameter optimization VMD and improved DBN. Eng. Appl. Artif. Intell. 110, 104713. doi:10.1016/j.engappai.2022.104713
Jun, T., Gang, S., Liqiang, G., and Xinyu, W. (2020). Application of a PCA-DBN-based surrogate model to robust aerodynamic design optimization. Chin. J. Aeronautics 33 (6), 1573–1588. doi:10.1016/j.cja.2020.01.015
Jung, Y. (2018). Multiple predicting K-fold cross-validation for model selection. J. Nonparametric Statistics 30 (1), 197–215. doi:10.1080/10485252.2017.1404598
Katrutsa, A., and Strijov, V. (2017). Comprehensive study of feature selection methods to solve multicollinearity problem according to evaluation criteria. Expert Syst. Appl. 76, 1–11. doi:10.1016/j.eswa.2017.01.048
Kavzoglu, T., Sahin, E. K., and Colkesen, I. (2014). Landslide susceptibility mapping using GIS-based multi-criteria decision analysis, support vector machines, and logistic regression. Landslides 11 (3), 425–439. doi:10.1007/s10346-013-0391-7
Kumar, T. S., Arun, C., and Ezhumalai, P. (2022). An approach for brain tumor detection using optimal feature selection and optimized deep belief network. Biomed. Signal Process. Control 73, 103440. doi:10.1016/j.bspc.2021.103440
Li, H., Deng, J., Feng, P., Pu, C., Arachchige, D., and Cheng, Q. (2021a). Short-term nacelle orientation forecasting using bilinear transformation and ICEEMDAN framework. Front. Energy Res. 9, 780928. doi:10.3389/fenrg.2021.780928
Li, H., Deng, J., Yuan, S., Feng, P., and Arachchige, D. (2021b). Monitoring and identifying wind turbine generator bearing faults using deep belief network and EWMA control charts. Front. Energy Res. 9, 799039. doi:10.3389/fenrg.2021.799039
Li, H. (2022a). SCADA data based wind power interval prediction using LUBE-based deep residual networks. Front. Energy Res. 690. doi:10.3389/fenrg.2022.920837
Li, H. (2022b). Short-term wind power prediction via spatial temporal analysis and deep residual networks. Front. Energy Res. 662. doi:10.3389/fenrg.2022.920407
Ma, J., Chen, K., Xiao, L., and Wu, J. (2016). Classification on mixed disturbances of power quality based on restricted Boltzmann machine. J. Nanchang Univ. Nat. Sci. 40 (1), 30–34. doi:10.13764/j.cnki.ncdl.2016.01.006
Ma, S., and Xu, C. (2019). Assessment of co-seismic landslide hazard using the newmark model and statistical analyses: A case study of the 2013 lushan, China, Mw6. 6 earthquake. Nat. Hazards (Dordr). 96 (1), 389–412. doi:10.1007/s11069-018-3548-9
Ma, Z., and Mei, G. (2021). Deep learning for geological hazards analysis: Data, models, applications, and opportunities. Earth-Science Rev. 223, 103858. doi:10.1016/j.earscirev.2021.103858
Marini, F., and Walczak, B. (2015). Particle swarm optimization (PSO). A tutorial. Chemom. Intelligent Laboratory Syst. 149, 153–165. doi:10.1016/j.chemolab.2015.08.020
Mohamed, A.-r., Dahl, G. E., and Hinton, G. (2011). Acoustic modeling using deep belief networks. IEEE Trans. Audio Speech Lang. Process. 20 (1), 14–22. doi:10.1109/TASL.2011.2109382
Mohamed, A. R., Sainath, T. N., Dahl, G. E., Ramabhadran, B., and Picheny, M. A. (2009). “Deep Belief Networks using discriminative features for phone recognition,” in IEEE International Conference on Acoustics, Prague, Czech Republic, 22-27 May 2011. doi:10.1109/icassp.2011.5947494
Mohsenzadeh, Y., and Sheikhzadeh, H. (2014). Gaussian kernel width optimization for sparse Bayesian learning. IEEE Trans. Neural Netw. Learn. Syst. 26 (4), 709–719. doi:10.1109/TNNLS.2014.2321134
Osna, T., Sezer, E. A., and Akgun, A. (2014). GeoFIS: An integrated tool for the assessment of landslide susceptibility. Comput. Geosciences 66, 20–30. doi:10.1016/j.cageo.2013.12.016
Ozdemir, A., and Altural, T. (2013). A comparative study of frequency ratio, weights of evidence and logistic regression methods for landslide susceptibility mapping: Sultan Mountains, SW Turkey. J. Asian Earth Sci. 64, 180–197. doi:10.1016/j.jseaes.2012.12.014
Pardeshi, S. D., Autade, S. E., and Pardeshi, S. S. (2013). Landslide hazard assessment: Recent trends and techniques. SpringerPlus 2 (1), 523–611. doi:10.1186/2193-1801-2-523
Park, S., and Kwak, N. (2016). “Analysis on the dropout effect in convolutional neural networks,” in Asian conference on computer vision, Taipei, Taiwan, November 21, 2016–November 23, 2016 (Springer), 189–204. doi:10.1007/978-3-319-54184-6_12
Paronuzzi, P., Bolla, A., Pinto, D., Lenaz, D., and Soccal, M. (2021). The clays involved in the 1963 vajont landslide: Genesis and geomechanical implications. Eng. Geol. 294, 106376. doi:10.1016/j.enggeo.2021.106376
Perez-Melo, S., and Kibria, B. M. G. (2020). On some test statistics for testing the regression coefficients in presence of multicollinearity: A simulation study. Stats 3, 40–55. doi:10.3390/stats3010005
Pourghasemi, H. R., Mohammady, M., and Pradhan, B. (2012). Landslide susceptibility mapping using index of entropy and conditional probability models in GIS: Safarood Basin, Iran. Catena 97, 71–84. doi:10.1016/j.catena.2012.05.005
Regmi, A. D., Devkota, K. C., Yoshida, K., Pradhan, B., Pourghasemi, H. R., Kumamoto, T., et al. (2014). Application of frequency ratio, statistical index, and weights-of-evidence models and their comparison in landslide susceptibility mapping in Central Nepal Himalaya. Arab. J. Geosci. 7 (2), 725–742. doi:10.1007/s12517-012-0807-z
Safran, E. B., O'Connor, J. E., Ely, L. L., House, P., Grant, G., Harrity, K., et al. (2015). Plugs or flood-makers? The unstable landslide dams of eastern Oregon. Geomorphology 248, 237–251. doi:10.1016/j.geomorph.2015.06.040
Salakhutdinov, R., and Murray, I. (2008). “On the quantitative analysis of deep belief networks,” in Proceedings of the 25th international conference on Machine learning, Helsinki, Finland, July 5–July 9, 2008, 872–879. doi:10.1145/1390156.1390266
Shen, L., He, M., Shen, N., Yousefi, N., Wang, C., and Liu, G. (2020). Optimal breast tumor diagnosis using discrete wavelet transform and deep belief network based on improved sunflower optimization method flower optimization method. Biomed. Signal Process. Control 60, 101953. doi:10.1016/j.bspc.2020.101953
Tian, Y., Xu, C., Ma, S., Xu, X., Wang, S., and Zhang, H. (2019). Inventory and spatial distribution of landslides triggered by the 8th August 2017 MW 6.5 Jiuzhaigou earthquake, China. J. Earth Sci. 30 (1), 206–217. doi:10.1007/s12583-018-0869-2
Van Westen, C., Van Asch, T. W., and Soeters, R. (2006). Landslide hazard and risk zonation—Why is it still so difficult? Bull. Eng. Geol. Environ. 65 (2), 167–184. doi:10.1007/s10064-005-0023-0
Wang, B., Ding, S., Liu, X., Li, X., and Li, G. (2021). Predictive classification of ICU readmission using weight decay random forest. Future Gener. Comput. Syst. 124, 351–360. doi:10.1016/j.future.2021.06.011
Wang, D., Tan, D., and Liu, L. (2018). Particle swarm optimization algorithm: An overview. Soft Comput. 22 (2), 387–408. doi:10.1007/s00500-016-2474-6
Wang, L.-J., Guo, M., Sawada, K., Lin, J., and Zhang, J. (2016). A comparative study of landslide susceptibility maps using logistic regression, frequency ratio, decision tree, weights of evidence and artificial neural network. Geosci. J. 20 (1), 117–136. doi:10.1007/s12303-015-0026-1
Wang, W.-d., He, Z.-l., Han, Z., and Qian, Y. (2020a). Landslides susceptibility assessment basedon deep belief network. J. Northeast. Univ. Nat. Sci. 41 (5), 609. doi:10.12068/j.issn.1005-3026.2020.05.001
Wang, W., He, Z., Han, Z., Li, Y., Dou, J., and Huang, J. (2020b). Mapping the susceptibility to landslides based on the deep belief network: A case study in sichuan province, China. Nat. Hazards (Dordr). 103 (3), 3239–3261. doi:10.1007/s11069-020-04128-z
Wang, Y.-B., You, Z.-H., Li, X., Jiang, T.-H., Chen, X., Zhou, X., et al. (2017). Predicting protein–protein interactions from protein sequences by a stacked sparse autoencoder deep neural network. Mol. Biosyst. 13 (7), 1336–1344. doi:10.1039/c7mb00188f
Xie, S., Liang, Y., Zheng, Z., and Liu, H. (2017). Combined forecasting method of landslide deformation based on MEEMD, approximate entropy, and WLS-SVM. ISPRS Int. J. Geoinf. 6 (1), 5. doi:10.3390/ijgi6010005
Xu, C., Xu, X., Yao, Q., and Wang, Y. (2013). GIS-based bivariate statistical modelling for earthquake-triggered landslides susceptibility mapping related to the 2008 Wenchuan earthquake, China. Q. J. Eng. Geol. Hydrogeology 46 (2), 221–236. doi:10.1144/qjegh2012-006
Yang, Z.-h., Lan, H.-x., Gao, X., Li, L.-p., Meng, Y.-s., and Wu, Y.-m. (2015). Urgent landslide susceptibility assessment in the 2013 Lushan earthquake-impacted area, Sichuan Province, China. Nat. Hazards (Dordr). 75 (3), 2467–2487. doi:10.1007/s11069-014-1441-8
Yilmaz, I. (2009). Landslide susceptibility mapping using frequency ratio, logistic regression, artificial neural networks and their comparison: A case study from kat landslides (tokat—Turkey). Comput. Geosciences 35 (6), 1125–1138. doi:10.1016/j.cageo.2008.08.007
Youssef, A. M., Al-Kathery, M., and Pradhan, B. (2015). Landslide susceptibility mapping at Al-Hasher area, Jizan (Saudi Arabia) using GIS-based frequency ratio and index of entropy models. Geosci. J. 19 (1), 113–134. doi:10.1007/s12303-014-0032-8
Yu, X.-H., Chen, G.-A., and Cheng, S.-X. (1995). Dynamic learning rate optimization of the backpropagation algorithm. IEEE Trans. Neural Netw. 6 (3), 669–677. doi:10.1109/72.377972
Zhang, S., and Wu, G. (2019). Debris flow susceptibility and its reliability based on random forest and GIS. Earth Sci. 44 (9), 3115–3134. doi:10.3799/dqkx.2019.081
Zhang, W., Ma, J., Wang, L., and Jiang, F. (2022). Particle-swarm-optimization-based 2D output feedback robust constraint model predictive control for batch processes. IEEE Access 10, 8409–8423. doi:10.1109/ACCESS.2022.3143691
Keywords: AUC, deep belief network (DBN), PSO—particle swarm optimization, K-fold cross-validation method, landslide susceptibility
Citation: Wang S, Lin X, Qi X, Li H and Yang J (2022) Landslide susceptibility analysis based on a PSO-DBN prediction model in an earthquake-stricken area. Front. Environ. Sci. 10:912523. doi: 10.3389/fenvs.2022.912523
Received: 04 April 2022; Accepted: 11 July 2022;
Published: 24 August 2022.
Edited by:
Huajin Li, Chengdu University, ChinaCopyright © 2022 Wang, Lin, Qi, Li and Yang. This is an open-access article distributed under the terms of the Creative Commons Attribution License (CC BY). The use, distribution or reproduction in other forums is permitted, provided the original author(s) and the copyright owner(s) are credited and that the original publication in this journal is cited, in accordance with accepted academic practice. No use, distribution or reproduction is permitted which does not comply with these terms.
*Correspondence: Xiaokun Lin, bHhrMDEwNjE2QDE2My5jb20=; Xing Qi, cWl4aW5nMjAwOUAxNjMuY29t
Disclaimer: All claims expressed in this article are solely those of the authors and do not necessarily represent those of their affiliated organizations, or those of the publisher, the editors and the reviewers. Any product that may be evaluated in this article or claim that may be made by its manufacturer is not guaranteed or endorsed by the publisher.
Research integrity at Frontiers
Learn more about the work of our research integrity team to safeguard the quality of each article we publish.