 Nathan Obermaier
 Alberto Pistocchi
- 1German Environment Agency, Dessau, Germany
- 2European Commission, Joint Research Centre (JRC), Ispra, Italy
Microplastics (MP) are not well defined from an analytical point of view and their measurement in the environment is still challenging. At the same time, their increasingly widespread presence is raising concerns for human health and ecosystems. In this contribution, we present a preliminary European-scale assessment of the environmental input of MP through urban wastewater and urban runoff. We quantify the emissions associated with urban wastewater based on the range of observed concentrations in wastewater treatment plants (WWTPs) effluents, and the emissions from tire wear particles (TWP) by assuming that a percentage of the particles generated on roads eventually reaches surface waters. In spite of the large uncertainties entailed in the calculation, it is apparent that TWP dominate the input of total plastic loads into European surface waters. The management of urban runoff, road runoff, and combined sewer overflows (CSO) is essential to control the emissions of MP from urban areas. On the other hand, WWTPs retain the majority of MP in the sewage sludge. The spreading of sewage sludge onto soil therefore represents a potential pathway of MP from urban wastewater into the environment.
1 Introduction
Plastics is a term for various materials with very different properties that change with their chemical nature (the constituent polymer and the additives used). Europe-wide, the dominant types of plastics are high- and low-density polyethylene (PE) and polypropylene (PP), whose resin demand in 2021 was close to 1.5 × 10⁷ Mg and 1.0 × 10⁷ Mg respectively. Polyvinylchloride (PVC), Polyurethane (PUR) and Polyethylene terephthalate (PET) accounted for 1.3 × 10⁷ Mg, while all other types of MP accounted altogether for 1.2 × 10⁷ Mg (Plastics Europe & European Association of Plastics Recycling and Recovery Organisations, 2021). Fibres and tire wear particles (TWP) are not included in the resin demand masses and provide additional plastics sources.
Based on the initial product, its use, and its disposal, plastics may reach environmental media intentionally or unintentionally. Very small fragments of plastics are usually referred to as microplastics (MP). Urban wastewater (hereafter wastewater) coming from households and industries, and rainwater runoff (drained in combined or separate sewers) usually contain MP (European Commission, 2020). The current knowledge on specific sources of MP, their pathways, and sinks is rather limited, mass balances help to explore these and to specify monitoring needs (e.g. Kawecki and Nowack (2020)). In Europe, most of the collected wastewater is treated in wastewater treatment plants (WWTPs), removing considerable amounts of MP. WWTPs are mostly designed to remove particulate matter through sedimentation. With a decreasing size and a material density close to the density of water, the effectiveness of sedimentation decreases, and particulate matter (including MP) may be discharged with the WWTP effluent. The effluents of WWTPs may therefore discharge residual MP to the receiving water bodies.
Moreover, when retained, MP end up mainly in the sewage sludge resulting from treatment, and may return to the environment when the sewage sludge is used in agriculture or as compost. Finally, combined sewer overflows (CSO) discharge untreated sewage diluted by stormwater runoff, conveying additional MP to the receiving water bodies. Thus, the wastewater treatment system is a gateway for MP reaching the environment, and should be assessed accordingly.
In this contribution, we first review the existing literature on MP in wastewater and stormwater. Second, we use the gathered data as an input for a model, describing the wastewater-borne MP flow in Europe. Based on the finding of our review, we draw a provisional budget of MP in European wastewater, and highlight open issues of relevance for policy.
2 Overview of MP Measurements in Literature
2.1 General Remarks
MP are defined by norm ISO TR21960 as particles of plastics with a dimension between 1 and 1,000 µm. The mass balance and fate of MP in the environment is a relatively new research subject. Up to now, there is no widely accepted standard for the sampling, sample preparation, detection, and data analysis for MP, which hampers the generalization of observations, and requires extreme care in the comparison of data from different sources. Both the total number and the composition (share of the different polymers) of MP found in WWTPs varies substantially and there is no agreement on which polymers are being reported, nor the unit in which MP in the environment should be measured. Sun et al. (2019) and Gatidou et al. (2019) show that studies looking at MP in WWTP use different size ranges (e.g. the finest mesh size ranges from 0.7 to 250 µm)). Therefore, the term “microplastics” MP refers to small plastics particles, fibres, films etc. rather than to the size range defined by the ISO TR21960 norm.
Measuring MP usually includes sampling, sample preparation, and detection. All three steps have a significant influence on the measurements of MP.
Sampling is usually performed by either container collection (e.g. Murphy et al. (2016); Tagg et al. (2015)), autosampler collection (e.g. Michielssen et al. (2016)), pumping and filtration (e.g. Mason et al. (2016); Mintenig et al. (2017); Talvitie et al. (2015); Ziajahromi et al. (2017)) or surface filtration (e.g. Carr et al. (2016)). For MP in freshwaters, Watkins et al. (2021) show a strong correlation between sampling methods and the subsequent MP detection, which poses an issue when we compare different studies. Hildebrandt et al. (2021) analyse different sampling techniques and come to the conclusion that uncertainties due to lack of standardized analytical methods may override the variability of measurements among sampling stations reported in various monitoring, thus undermining any possibility to identify clear patterns in the data. A similar conclusion is made also by Rasmussen et al. (2021). Ben-David et al. (2021), comparing 24-h composite samples with large and small grab samples and analysing the respective coefficients of variation, report that sampling with a finer mesh size effectively doubled the number of MPs found. In a meta-analysis of different sampling methods Sun et al. (2019) highlight that differences in sampling duration, timing, frequency, and various other parameters may affect the comparability of samples collected with a range of methods.
Sample preparation depends on the detection method that must be subsequently applied, and on the complexity of the sample matrix, e.g. drinking water compared with sewage sludge (Sun et al., 2019; Hidalgo-Ruz et al., 2012). Spectroscopic methods require a removal of irrelevant particles (non-MP), while the effects of the organic matrix on the detection must be minimized in thermogravimetric methods. Sample preparation may influence the various polymers to a different extent. For instance, while potassium hydroxide completely destroys PET, it has only minor effects on PE (Al-Azzawi et al. (2020)).
For detection, the most common methods currently used are thermogravimetric (yielding polymer masses) and spectroscopic (yielding polymer numbers and shapes). Spectroscopic methods, including Fourier-transform-infrared-spectroscopy (FTIR) and Raman spectroscopy, cannot identify black-coloured MP like tire wear particles (TWP), but provide information about the MP shape. These methods introduce a significant conversion error when particle masses are calculated out of the 2D images provided by both methods (Primpke et al., 2020). The particle number and the resulting mass may differ significantly for a sample. Both methods have polymer-specific identification skills.
Primpke et al. (2020) also show that an FTIR mass calculation yield different polymer masses for the same sample analysed in comparison with thermogravimetric methods. The latter include pyrolysis-gas chromatography/mass spectrometry (Pyr-GC/MS) and thermal extraction desorption–gas chromatography/mass spectrometry (TED-GC/MS). Primpke et al. (2020) conclude that mass calculations based on FTIR particle counts must be considered critically.
In addition to the difficulties of sampling, sample preparation, and detection, contamination by MP during the analysis may also affect the results. Koelmans et al. (2019) assessed the quality of studies analysing MP in freshwater and drinking water, and found that less than 10% of the studies were meeting minimum quality control/quality assurance criteria in this respect. Failure to report key information on the analytical methods (e.g. polymer specific recovery rates as presented by Okoffo et al. (2021)) and on sampling (e.g. polymer specific sampling volumes, overview in Sun et al. (2019)) add to the overall uncertainty. Up to now, it remains unclear if the analytical procedures adopted in many studies deliver reproducible results.
2.2 MP Occurrence
2.2.1 Wastewater
MP are not included in standardized monitoring programmes, and there is no harmonized reporting of monitoring data as for other pollutants. Data available for MP consist only of spot measurements. These do not include time series, not even at coarse (e.g. yearly) time steps. With respect to spatial data, only few studies assess different locations and, to our knowledge, no study sampled the different stages of the treatment process (e.g. influent, screen, grease separator, primary clarifier, secondary clarifier, sand filtration, effluent) considering the hydraulic retention time (HRT) of the wastewater.
Samples of WWTP influents are not very common. Sun et al. (2019) review 73 measurement studies at WWTPs, of which only a few include the influent. These show MP contents ranging from 1 to 10,044 particles/L. by contrast, the effluent, where more samples are available, show contents of 0–447 particle/L.
The studies reviewed in Sun et al. (2019) and Gatidou et al. (2019) are based on spectroscopic methods, and only Simon et al. (2018) apply a mass conversion to the results. A few studies using thermo-analytical methods, the method of choice when it comes to MP masses, have been published more recently concerning MP in WWTPs (e.g. Elert et al. (2017); Bannick et al. (2019); Funck et al. (2021); Goedecke et al. (2022)).
Funck et al. (2021) calculate MP emissions with WWTP effluents as 1.2–2.1 mg/year per population equivalent (PE) and for WWTPs with sand filters and 4.1 mg/a/PE for a WWTP without. Goedecke et al. (2022) measured the MP mass of the studied WWTP effluent between 5 mg/m3 and 50 mg/m3. This corresponds to 365 mg/PE/year—3,650 mg/PE/year assuming a water discharge of 200 L/PE/day. Simon et al. (2018) calculate a MP effluent mass of 560 mg/PE/a based on the 2D FTIR images.
2.2.2 Retention in WWTPs
Drawing any conclusion on the effect of WWTPs based on these and similar studies is very difficult, due to the several challenges mentioned above. Particularly, it is difficult to test hypotheses concerning the change in MP retention with the level of wastewater treatment. Sun et al. (2019) argue that WWTPs with tertiary treatment processes to have a lower effluent concentration of MP than those with primary or secondary treatment, based on a study by Ziajahromi et al. (2017). However, the latter includes onlya a single WWTP with primary treatment.
In any case, the overall retention rate of MP in WWTPs is usually 90% or higher (e.g. Bayo et al. (2020); Edo et al. (2020)). Consistent retention rates emerge in spite of the high variability of influent and effluent content of MP among studies due to the use of different sampling and analytical methods. Sun et al. (2019) reviews three studies that use spectroscopic methods and measure both influent and effluent MP content, and find a retention rate always above 98% for particles larger than 100 µm (Magnusson & Norén, 2014), (Carr et al., 2016), (Lares et al., 2018). In line with the physical principles of sedimentation, data from Ben-David et al. (2021) and Funck et al. (2021) suggest that a smaller MP size also leads to a decreasing retention rate. Ben-David et al. (2021) calculate the retention rate of MP larger than 20 µm as 95.8% and of MP larger than 0.45 µm as 88.2% at a WWTP in Israel. Similarly, Rasmussen et al. (2021), calculate the MP retention rate as 99.6% for and 98.8% for particles larger and smaller than 500 μm, respectively, at a Swedish WWTP equipped with a disc filter. Magni et al. (2019) estimate a MP retention rate of 94%, 77% and 65% for particles above 500, below 500 and below 100 μm, respectively. For small MP, an advanced treatment based on filtration usually ensures a high MP retention. Talvitie et al. (2017) analysed a disc filter (DF), rapid sand filtration (RSF), dissolved air flotation (DAF), and a membrane bioreactor (MBR), for which they found removal efficiencies of 40%–99%, 97%, 95% and 99%, respectively. Ziajahromi et al. (2017) observed that the MP concentration reduced significantly after ultrafiltration and reverse osmosis.
In principle, the type of polymer may affect the retention of MP in WWTPs. Sun et al. (2019) review seven studies (Mintenig et al. (2017); Murphy et al. (2016); Ziajahromi et al. (2017); Lares et al. (2018); Talvitie et al. (2017); Li et al. (2018); Simon et al. (2018)) that distinguish the type of polymers involved. The most commonly analysed were polyester (PES, ∼28%–89%), PE (∼4%–51%), PET (∼4%–35%), and polyamide (PA, ∼3%–30%). PP is not commonly found in WWTPs in spite of its large production volumes. Funck et al. (2021) show that retention rates of a sand filtration stage may differ depending on the type of polymer. They calculate a removal of 94% ± 3% for PE, 87% ± 6% for PS, 87% ± 15% for PP, and 75% ± 8% for PET. However, even net of the analytical difficulties mentioned above, these differences result from a difference in MP size, shape, density and cannot be easily related to the polymer type alone.
The shape of MP seems to have an influence on their retention in WWTPs. MP in effluents of WWTPs show a higher share of fibres with respect to other MP shapes like e.g. particles or films (Ben-David et al. (2021); Lares et al. (2018); Leslie et al. (2017); Ziajahromi et al. (2017)), suggesting that fibres are retained less effectively in the treatment process.
2.2 3 Sludge
MP in wastewater undergoing treatment end up mostly in the sewage sludge (Rasmussen et al., 2021). This is stabilized before being landfilled, incinerated or used in agriculture, possibly after further treatment such as composting. Sewage sludge stabilization processes, such as liming or anaerobic digestion, do not seem to affect the MP content (Mahon et al. (2017)). While sewage sludge incineration and, to a lesser extent, landfilling minimize environmental discharges of MP, the use of sewage sludge in agriculture returns virtually all its MP content to the environment, even after composting.
This represents the largest share of the WWTP MP load entering the environment, exceeding the load through the discharge of effluents (Kay et al. (2018); Dris et al. (2015)). On the other hand, MP in sewage sludge are retained in a solid matrix to some extent (Weber et al., 2022), while those discharged with the effluents may reach the receiving waters immediately, hence cause potential impact on the ecosystem.
The sampling, sample preparation, and detection of MP in sewage sludge is more complex compared to water, due to the increased interference of the organic matrix. This leads to fewer studies compared to MP in water. Spectroscopic analyses are performed by Rolsky et al. (2020) reporting a minimum number of particles in the Netherlands with 0.45–0.2 MP/g sewage sludge and a maximum in Italy with 113–57 MP/g sewage sludge and Edo et al. (2020), who calculate 165 ± 37 MP/g sewage sludge respectively. However, there is no mass calculation out of the MP numbers. Using thermogravimetric methods, Okoffo et al. (2021) study multiple biosolids from Australia and the United Kingdom (United Kingdom) and calculate an averaged MP content of 6.275 mg/g dry sludge in the latest United Kingdom sample (from 2009). This MP mass in the biosolids should correlate to the difference between the WWTPs influent MP mass and the WWTPs effluent MP mass assuming there are no other MP sinks. In this way, the amount of MP in sewage sludge can be calculated from MP masses in the influent or effluent, assuming an appropriate retention rate.
2.2.4 Stormwater
While domestic sewage conveys MP originating from household products, stormwater and CSO convey materials washed off from surfaces during rain events. A significant share of these materials is from tire wear particles (TWP) (Wagner et al., 2018). The input of TWP depends on the interplay of factors such as rain events intensity and frequency, winds, street sweeping cycles etc., making quantification very complex. As a consequence, our understanding of the phenomenon is still rather poor (Liu et al., 2019). Sampling TWP has to be event-based, due to the intermittent nature of discharges. This is also true for the transport of MP in separate sewers or CSO. In spite of a few recent experimental studies (Werbowski,et al., 2021, Treiller et al., 2021, Liu et al. (2019), no comprehensive MP flow analysis has been attempted yet.
While MP reaching WWTPs are retained very effectively by WWTPs, stormwater and CSO may release virtually all the MP they convey without any treatment (Werbowski et al., 2021). Thus, they represent relevant environmental input pathways even though they occur occasionally. Kawecki and Nowack (2020) evaluate that CSO represent 80% of MP input to freshwater in Switzerland.
Focusing exclusively on TWP, Wagner et al. (2018) estimate that a mass of 1,327,000 Mg/a is generated in the European Union. TWP has not been analysed as much as other polymers, because it cannot be detected with spectroscopic methods due to its black colour. However, based on modelling, Wagner et al. (2018) suggest that TWP is one major source of MP in the environment. Only a fraction of the generated TWP ends up in the wastewater treatment system, while other fractions end up in stormwater discharges and CSO. For the Seine watershed, Unice et al. (2019) performed a detailed modelling study and conclude that around 2% of TWP generated reach the estuary. Unice et al. (2019) assume that 50% of the TWP is transported through road runoff, of which 75% reaches combined sewers. If treated in a WWTP, the removal efficiency is 95%. As TWP are possibly one of the largest MP inputs into the environment, their contribution to MP pollution cannot be ignored. However, unlike for the common MP actually measured at WWTPs, TWP can only be quantified based on the TWP generated in Europe.
3. A Preliminary European Budget of MP in Wastewater
Practically no consistent spatial-temporal dataset of measured MP occurrence in ambient water is available. Hence, even the most basic data required to calibrate and validate a predictive model are currently not available. Nevertheless, based on existing data, we can attempt a preliminary model for screening purposes. This model may serve the purpose of framing the problem of a mass balance of MP, and may help understand, by orders of magnitude, the scale of the problem. Our goal here is to formulate an initial and provisional proposal, necessarily calling for subsequent updates, as more data become available. The high variation of the polymer composition adds to the difficulty of comparisons and highlights the need for more data to refine any mass balance of MP. Even though there are obvious differences, data in literature are not yet sufficiently robust to enabling a differentiated assessment of the single types of polymers.
Our attempt to estimate a European MP mass balance and the total discharge of MP from urban areas into surface waters is represented by the following equation:
In the equation, L is the mass discharge of MP to the receiving surface water bodies depending on the following groups of variables:
1) descriptors of the wastewater and sewage sludge volumes entailed:
- n is the number of WWTPs.
- Pi the population equivalents (PE) treated in the ith WWTP.
- P0 the population equivalents that are discharged untreated.
- Q the total annual urban runoff volume.
-
-
-
- Si is the fraction of sewage sludge mass generated at the ith WWTP that is applied to soil.
2) descriptors of the removal and transfer processes of MP:
- β is the MP retention of urban runoff that is treated in the different WWTP levels (e.g. primary, secondary etc.).
- ηi is the retention rate for MP in the ith WWTP.
- k is the fraction of MP applied to soil with sewage sludge, that is transferred to receiving water bodies via mechanisms including erosion, runoff and leaching.
3) descriptors of the input of MP from the technosphere:
-
-
-
-
The assumptions concerning the descriptors of input and transfer are summarized in Table 1, while the assumed descriptors of wastewater and sewage sludge volumes are provided for each EU country in Table 2. In the following paragraphs, we illustrate the assumptions made for the calculation of the MP mass balance.
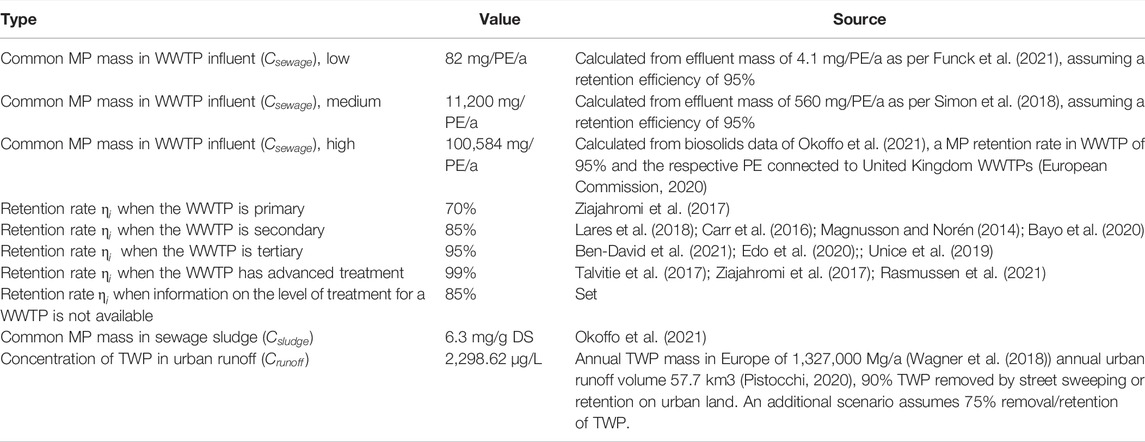
TABLE 1. Parameters taken from current literature refining the European MP flow model.
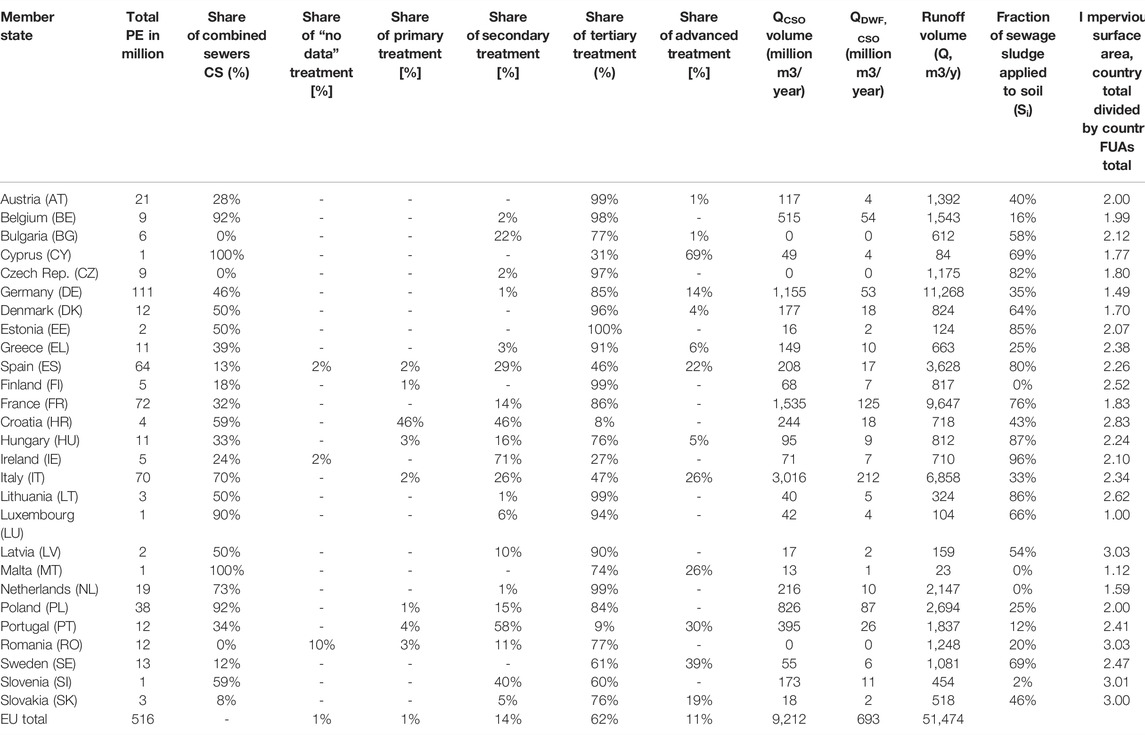
TABLE 2. Descriptors of the wastewater and sewage sludge volume. Data sources: see main text.
3.1 Descriptors of MP Input
The direct atmospheric deposition of MP on surface water bodies,
For the mass of MP in sewage,
In addition, Okoffo et al. (2021) analysed biosolids samples of the United Kingdom, finding an average concentration of 6.3 mg/g of dry solids (DS). This can be used to extrapolate a mass of the influent under the assumption that there are no additional sinks in WWTPs. The concentration of 6.3 mg/g DS in Okoffo et al., 2021 leads to a “high” estimate of 100,584 mg/PE/a using UK’s 70,913,918 PE (European Commission, 2020) and a total sewage sludge mass of 1,137,000 Mg/a (Eurostat, 2021). This approach is fundamentally different from the measurements in the WWTPs effluents but highlights the importance of precise MP mass balances at the WWTP level.
The three estimated discharges of MP with WWTP effluents range over five orders of magnitude. This reflects both the statistical uncertainty and the huge variability in influent parameters and the respective treatment systems. Estimates referred to WWTP influents are not available, due to the challenges of sampling, sample preparation and analytics. However, the MP masses of the effluents in Simon et al. (2018) and Funck et al. (2021) can be extrapolated to the MP mass of the influent assuming a retention rate for a tertiary WWTP of 95%, as WWTPs in both are described to have this level of treatment. In the following, we will refer to the estimation of
The measurements of MP in biosolids by Okoffo et al. (2021) are comparable to the theoretical studies and estimates from Nizzetto et al. (2016) and Bertling et al. (2021). For Germany, Nizzetto et al. (2016) calculate 7,000–10,000 Mg/a in sewage sludge, Bertling et al. (2021) 5,665 Mg/a—12,897 Mg/a and Okoffo et al. (2021) 5,960 Mg/a—9,223 Mg/a. This would suggest that the reported masses of both Funck et al. (2021) and Simon et al. (2018) and the retention rates shown in Table 1 are underestimating the mass of common MP in sewage sludge. Nevertheless, more data on MP in sewage sludge and WWTP effluents are needed to further assess this issue.
The removal efficiency η is assumed to be 70% (primary WWTPs), 85% (secondary WWTPs), 95% (tertiary WWTPs) and η = 99% (advanced WWTPs) respectively. The definition of the different WWTP systems is based on the available database (European Commission, 2020) using the respective classification of primary, secondary, and tertiary treatment. In addition, we define advanced treatment to include an installed sand filtration or a micro-filtration (e.g. micro screens, disc filters, ultra-filtration etc.), data that are also available in the database. In our case, advanced treatment does not imply an ozonation, a further treatment with activated carbon and other methods that are commonly associated with advanced treatment. With an advanced treatment installed, there was no differentiation between an advanced treatment on a secondary WWTP or a tertiary WWTP, even though there might be actual differences due to the different HRT in both systems. This difference in the HRT is reflected by the secondary WWTP having a retention of 85% and the tertiary WWTP having a retention of 95%. All retention rate estimates are rather conservative.
For what concerns
3.2 Descriptors of the Wastewater and Sewage Sludge Volume
For Pi, we used the data of the 10th implementation report of the UWWTD (European Commission, 2020). When information about the actual capacity of WWTPs was missing, the design capacity was used instead. When a WWTP did not specify the treatment, a treatment comparable to a secondary WWTP was assumed. Currently, the population still untreated, P0, is small and expected to be virtually all subject to some treatment in the future, based on the legislation already in place. Therefore, we assume P0 = 0.
For Q, we use the estimate provided in Pistocchi (2020).
For
The fraction of sewage sludge applied to agriculture, S, can be estimated on the basis of data from eurostat (2021).
3.3 Descriptors of the Removal and Transfer Processes of MP
For each MS, we estimate β. Therefore, we assume that a fraction of Q is drained by combined sewers, based on the fraction of population served by combined sewers (rCS) in the various countries (see Table 2). Of this, the volume
The fraction β is estimated as the removal efficiency for MP (including TWP), multiplied by
Where
The fraction of MP transferred from soil to water, k, is highly dependent on local conditions and is generally expected to be well below 1. However, we could not find solid evidence supporting its quantification.
3.4 Preliminary Mass Balance Results
We use the assumptions described previously to quantify the total load of MP to receiving water bodies through wastewater treatment effluents, CSO and separate runoff discharges in the EU. Figure 1 shows the results of the calculation. For the flows of TWP we consider two scenarios (scenarios 1 and 2, with 10% and 25% of the TWP generated being transported with runoff), while for common MP we consider three scenarios (low, medium and high MP content in wastewater) as discussed above. The results are presented for all combinations of scenarios.
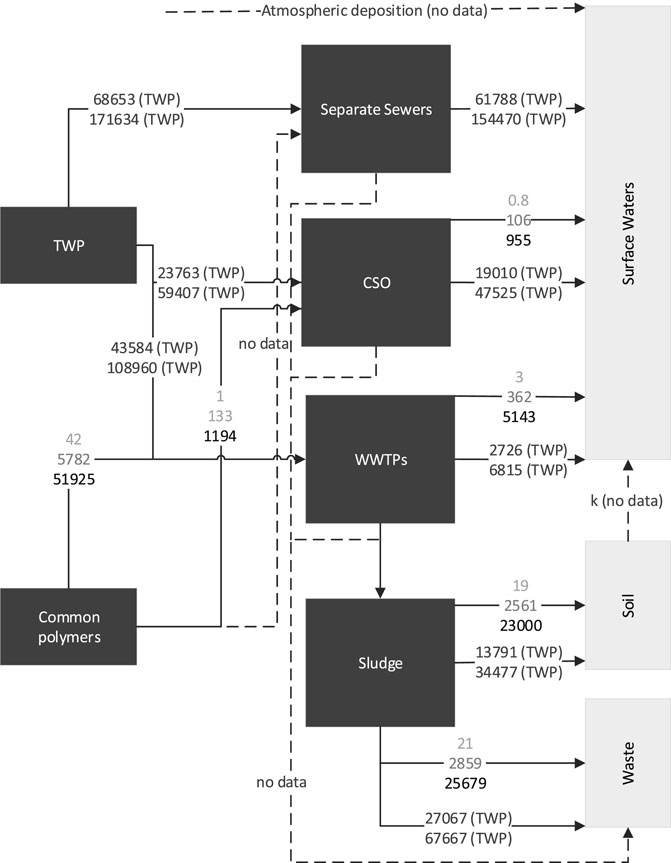
FIGURE 1. Preliminary mass balances of common MP (with scenarios of low, medium, and high estimates in different grey scales) and TWP in Europe (scenario 1 (upper number) and scenario 2 (lower number)) (all numbers are Mg/a). Dashed lines represent unquantified flows.
The largest MP pathway into the environment is the separate sewer system conveying TWP. The MP input through separate sewers (61,788 Mg/a for scenario 1, 154,470 Mg/a for scenario 2) are assumed to consist only of TWP, as to our knowledge, there is no comprehensive data on common MP in separate sewers. The flow of common MP in separate sewers must be updated when data become available.
CSO provide another relevant pathway for MP into the environment, combining dry weather flow (DWF) containing common MP, and runoff containing TWP, the latter accounting again for the majority of the MP inputs into the environment through this pathway. With 19,010 Mg/a (scenario 1) and 47,525 Mg/a (scenario 2), the mass is much higher than the mass of common MP with 0.8 Mg/a (low), 106 Mg/a (medium) and 955 Mg/a (high).
The TWP inputs through WWTP discharge are 2,726 Mg/a (scenario 1) and 6,815 Mg/a (scenario 2) based on the share of TWP in combined sewers that is treated within WWTPs. 3 Mg/a (low), 362 Mg/a (medium), and 3,247 Mg/a (high) of common MP are discharged from WWTPs respectively.
We subtracted the mass of common MP in the effluent from the mass of common MP in the influent to get the retained MP in sewage sludge (based on the effluent data from Funck et al. (2021), Simon et al. (2018), and the calculated data from Okoffo et al. (2021)). These are 40 Mg/a (low), 5,420 Mg/a (medium), and 48,678 Mg/a (high). Assuming a sewage sludge use of Table 2, common MP with a mass of 19 Mg/a (low), 2,561 Mg/a (medium), and 22,124 Mg/a (high) are spread onto soil by the agricultural use of sewage sludge and compost. To our knowledge, there is no data on TWP in sewage sludge. Using the estimated retention rates of Table 1, around 40,858 Mg/a (scenario 1) and 102,145 Mg/a (scenario 2) of TWP could end up in sewage sludge. Of that 13,791 Mg/a (scenario 1) and 34,477 Mg/a (scenario 2) enter the environment through sewage sludge.
While sewage sludge application to soil is a very significant input pathway for common MP, and TWP flowing through WWTPs, in the environment, we have limited information on the extent to which this pathway contributes directly to water pollution. The discharge of MP to the water compartment through this pathway is arguably much smaller.
Due to the fundamentally different bases for the estimation of common MP and TWP, we present an additional separate breakdown of sources for the two, for each MS.
Figure 2 shows that the overall environmental inputs of common MP vary significantly within Europe. In most MS, the spreading of sewage sludge after simple stabilization or after composting (low: 19 Mg/a, medium: 2,561 Mg/a, high: 23,000 Mg/a for Europe) leads to more common MP inputs into the environment (soil) than wastewater (low: 3 Mg/a, medium: 362 Mg/a, high: 3,247 Mg/a for Europe).
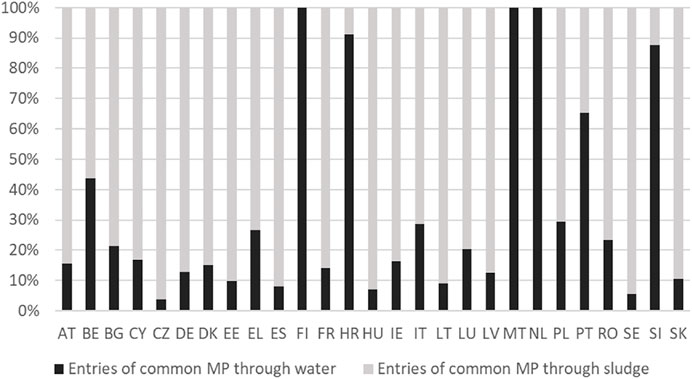
FIGURE 2. environmental inputs of common MP through sewage sludge and through water (some MS do not use sludge in agriculture, see Table 2). Labels on the x-axis refer to country codes (Table 2).
Our model distinguishes between MP entering the environment through WWTP effluent, separate sewers and CSO. With no data on separate sewers, common MP inputs through WWTP discharge and CSO are shown in Figure 3. In most MS, most MP inputs are due to WWTP discharges, and CSO contribute to 10%–35%. In 5 MS, CSO account for more than 35% of the MP inputs. Figure 3 also shows that the most efficient measures to reduce the input of MP may be different from MS to MS and depend largely on the existing infrastructure.
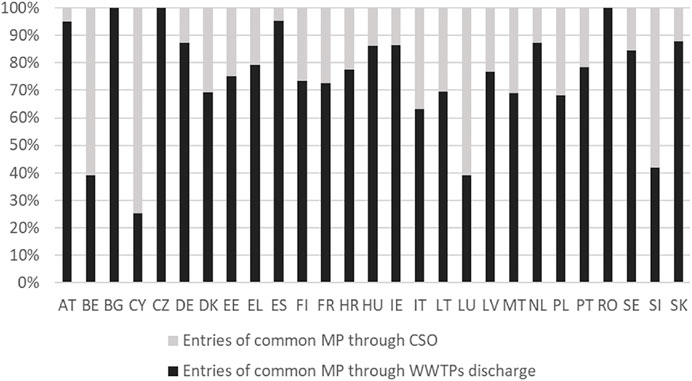
FIGURE 3. Share of WWTP discharge and CSO regarding the environmental input of common MP (some MS do not report plausible CSO data/CS ratio data). Labels on the x-axis refer to country codes (Table 2).
TWP are entering the environment through separate sewers, CSO and WWTPs (see Figure 4). In the majority of the MS, most TWP inputs are through separate sewers, with CSO being the second most common point of input. In most MS, TWP entering the environment through WWTPs only play a minor role (in most MS <10% of the inputs).
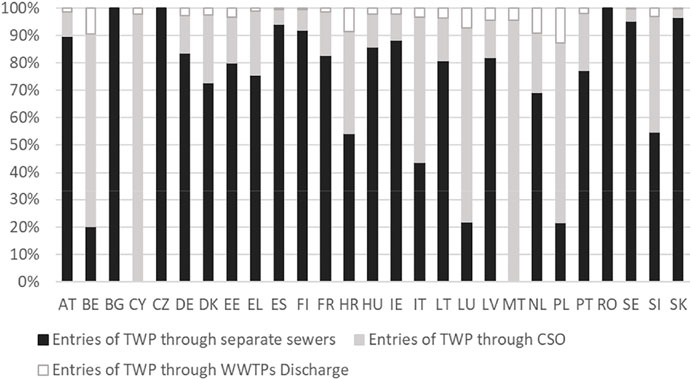
FIGURE 4. Share of separate sewers, CSO, and WWTPs discharge regarding the environmental input of TWP (some MS do not report plausible CSO data/CS ratio data). Labels on the x-axis refer to country codes (Table 2).
4 Concluding Remarks
The results of the MP mass balance presented in Figure 1 show that TWP inputs are significantly higher than common MP inputs. Within common MP, there is a large data variation. For TWP, separate sewers and CSO are the major pathways while WWTP contribute less than 10% to the environmental inputs. Figure 4 highlights that efficient measures for the reduction of TWP inputs must include specific solutions for each wastewater disposal system and the many other variables that define the amount of TWP reaching these systems. Nevertheless, CSO and runoff treatment in general provide important measures to reduce the inputs of TWP to waters.
WWTPs reduce the influent load of MP by approximately 1, 2 or 3 orders of magnitude (depending on whether advanced treatments such as sand filters, disk filters or membranes are added to conventional mechanical-biological processes) based on mass and commonly assessed particles. The performance is influenced by a variety of factors such as the content of rainwater in sewage, the ratio of industrial to domestic wastewater influent, and the urban or rural nature of the catchment.
Measures on WWTP to reduce MP inputs include improving current processes (e.g. Freeman et al. (2020); Rasmussen et al. (2021)). While an improved wastewater treatment transfers more MP from wastewater into sewage sludge, this additional mass is not expected to change the overall balance in the sludge significantly.
Measures to reduce MP in the effluents of WWTPs will not reduce the overall environmental inputs if the sewage sludge is subsequently used in agriculture, and sewage sludge management remains essential. Understanding how much MP are entering surface waters from sewage sludge use on adjacent soils remains an important question.
The reduction of common MP into the environment is specific for each region and specific for the polymer. As polymers define the sources, sinks, and pathways, further actions also have to be polymer-specific to be efficient. A focus on already known pathways (e.g., PET fibres through washing) could lead to a specialized, multi-stage approach that could reduce environmental inputs significantly.
Overall, the development of a sound monitoring system is necessary not only to increase the accuracy of our model but also to assess local differences and challenges. The monitoring should include measurements within WWTPs, sewage sludge, specific events (rain, CSO) and the necessary metadata.
Author Contributions
NO: research, manuscript preparation AP: research steering/coordination/review, manuscript preparation.
Conflict of Interest
The authors declare that the research was conducted in the absence of any commercial or financial relationships that could be construed as a potential conflict of interest.
Publisher’s Note
All claims expressed in this article are solely those of the authors and do not necessarily represent those of their affiliated organizations, or those of the publisher, the editors and the reviewers. Any product that may be evaluated in this article, or claim that may be made by its manufacturer, is not guaranteed or endorsed by the publisher.
References
Al-Azzawi, M. S. M., Kefer, S., Weißer, J., Reichel, J., Schwaller, C., Glas, K., et al. (2020). Validation of Sample Preparation Methods for Microplastic Analysis in Wastewater Matrices-Reproducibility and Standardization. Water 12 (9), 2445. doi:10.3390/w12092445
Bannick, C. G., Szewzyk, R., Ricking, M., Schniegler, S., Obermaier, N., Barthel, A. K., et al. (2019). Development and Testing of a Fractionated Filtration for Sampling of Microplastics in Water. Water Res. 149, 650–658. doi:10.1016/j.watres.2018.10.045
Bayo, J., Olmos, S., and López-Castellanos, J. (2020). Microplastics in an Urban Wastewater Treatment Plant: The Influence of Physicochemical Parameters and Environmental Factors. Chemosphere 238, 124593. doi:10.1016/j.chemosphere.2019.124593
Ben-David, E. A., Habibi, M., Haddad, E., Hasanin, M., Angel, D. L., Booth, A. M., et al. (2021). Microplastic Distributions in a Domestic Wastewater Treatment Plant: Removal Efficiency, Seasonal Variation and Influence of Sampling Technique. Sci. Total Environ. 752, 141880. 2021/01/15/. doi:10.1016/j.scitotenv.2020.141880
Bertling, J., Zimmermann, T., and Rödig, L. (2021). Kunststoffe in der Umwelt: Emissionen in landwirtschaftlich genutzte Böden. Germany: Fraunhofer UMSICHT. doi:10.24406/umsicht-n-633611
Carr, S. A., Liu, J., and Tesoro, A. G. (2016). Transport and Fate of Microplastic Particles in Wastewater Treatment Plants. Water Res. 91, 174–182. doi:10.1016/j.watres.2016.01.002
Dris, R., Gasperi, J., Rocher, V., Saad, M., Renault, N., and Tassin, B. (2015). Microplastic Contamination in an Urban Area: a Case Study in Greater Paris. Environ. Chem. 12 (5), 592–599. doi:10.1071/EN14167
Edo, C., González-Pleiter, M., Leganés, F., Fernández-Piñas, F., and Rosal, R. (2020). Fate of Microplastics in Wastewater Treatment Plants and Their Environmental Dispersion with Effluent and Sludge. Environ. Pollut. 259, 113837. 2020/04/01/. doi:10.1016/j.envpol.2019.113837
Elert, A. M., Becker, R., Duemichen, E., Eisentraut, P., Falkenhagen, J., Sturm, H., et al. (2017). Comparison of Different Methods for MP Detection: What Can We Learn from Them, and Why Asking the Right Question before Measurements Matters? Environ. Pollut. 231, 1256–1264. 2017/12/01/. doi:10.1016/j.envpol.2017.08.074
European Commission (2020). Urban Waste Water: 10th Report on Implementation. Europe: European Commision.
Eurostat (2021). Sewage Sludge Production and Disposal. The statistical office of the European Union. [env_ww_spd].
Freeman, S., Booth, A. M., Sabbah, I., Tiller, R., Dierking, J., Klun, K., et al. (2020). Between Source and Sea: The Role of Wastewater Treatment in Reducing Marine Microplastics. J. Environ. Manag. 266, 110642. 2020/07/15/. doi:10.1016/j.jenvman.2020.110642
Funck, M., Al-Azzawi, M. S. M., Yildirim, A., Knoop, O., Schmidt, T. C., Drewes, J. E., et al. (2021). Release of Microplastic Particles to the Aquatic Environment via Wastewater Treatment Plants: The Impact of Sand Filters as Tertiary Treatment. Chem. Eng. J. 426, 130933. 2021/12/15/. doi:10.1016/j.cej.2021.130933
Gatidou, G., Arvaniti, O. S., and Stasinakis, A. S. (2019). Review on the Occurrence and Fate of Microplastics in Sewage Treatment Plants. J. Hazard. Mater. 367, 504–512. 2019/04/05/. doi:10.1016/j.jhazmat.2018.12.081
Goedecke, C., Eisentraut, P., Altmann, K., Elert, A. M., Bannick, C. G., Ricking, M., et al. (2022). Development of a Routine Screening Method for the Microplastic Mass Content in a Wastewater Treatment Plant Effluent. Front. Environ. Chem. 3, 844633. doi:10.3389/fenvc.2022.844633
Hidalgo-Ruz, V., Gutow, L., Thompson, R. C., and Thiel, M. (2012). Microplastics in the Marine Environment: A Review of the Methods Used for Identification and Quantification. Environ. Sci. Technol. 46 (6), 3060–3075. 2021/07/15/. doi:10.1021/es2031505
Hildebrandt, L., Zimmermann, T., Primpke, S., Fischer, D., Gerdts, G., and Pröfrock, D. (2021). Comparison and Uncertainty Evaluation of Two Centrifugal Separators for Microplastic Sampling. J. Hazard. Mater. 414, 125482. 2021/07/15/. doi:10.1016/j.jhazmat.2021.125482
Kawecki, D., and Nowack, B. (2020). A Proxy-Based Approach to Predict Spatially Resolved Emissions of Macro- and Microplastic to the Environment. Sci. Total Environ. 748, 141137. 2020/12/15/. doi:10.1016/j.scitotenv.2020.141137
Kay, P., Hiscoe, R., Moberley, I., Bajic, L., and McKenna, N. (2018). Wastewater Treatment Plants as a Source of Microplastics in River Catchments. Environ. Sci. Pollut. Res. 25 (20), 20264–20267. 2018/07/01. doi:10.1007/s11356-018-2070-7
Koelmans, A. A., Mohamed Nor, N. H., Hermsen, E., Kooi, M., Mintenig, S. M., and De France, J. (2019). Microplastics in Freshwaters and Drinking Water: Critical Review and Assessment of Data Quality. Water Res. 155, 410–422. 2019/05/15/. doi:10.1016/j.watres.2019.02.054
Lares, M., Ncibi, M. C., Sillanpää, M., and Sillanpää, M. (2018). Occurrence, Identification and Removal of Microplastic Particles and Fibers in Conventional Activated Sludge Process and Advanced MBR Technology. Water Res. 133, 236–246. 2018/04/15/. doi:10.1016/j.watres.2018.01.049
Leslie, H. A., Brandsma, S. H., van Velzen, M. J. M., and Vethaak, A. D. (2017). Microplastics en route: Field measurements in the Dutch river delta and Amsterdam canals, wastewater treatment plants, North Sea sediments and biota. Environ. Int. 101, 133–142. 2017/04/01/. doi:10.1016/j.envint.2017.01.018
Li, X., Chen, L., Mei, Q., Dong, B., Dai, X., Ding, G., et al. (2018). Microplastics in Sewage Sludge from the Wastewater Treatment Plants in China. Water Res. 142, 75–85. 2018/10/01/. doi:10.1016/j.watres.2018.05.034
Liu, F., Olesen, K. B., Borregaard, A. R., and Vollertsen, J. (2019). Microplastics in Urban and Highway Stormwater Retention Ponds. Sci. Total Environ. 671, 992–1000. 2019/06/25/. doi:10.1016/j.scitotenv.2019.03.416
Magni, S., Binelli, A., Pittura, L., Avio, C. G., Della Torre, C., Parenti, C. C., et al. (2019). The Fate of Microplastics in an Italian Wastewater Treatment Plant. Sci. Total Environ. 652, 602–610. 2019/02/20/. doi:10.1016/j.scitotenv.2018.10.269
Magnusson, K., and Norén, F. (2014). Screening of Microplastic Particles in and Down-Stream a Wastewater Treatment Plant. Swedan: IVL Swedish Environmental Research Institute.
Mahon, A. M., O’Connell, B., Healy, M. G., O’Connor, I., Officer, R., Nash, R., et al. (2017). Microplastics in Sewage Sludge: Effects of Treatment. Environ. Sci. Technol. 51 (2), 810–818. 2017/01/17. doi:10.1021/acs.est.6b04048
Mason, S. A., Garneau, D., Sutton, R., Chu, Y., Ehmann, K., Barnes, J., et al. (2016). Microplastic Pollution Is Widely Detected in US Municipal Wastewater Treatment Plant Effluent. Environ. Pollut. 218, 1045–1054. 2016/11/01/. doi:10.1016/j.envpol.2016.08.056
Michielssen, M. R., Michielssen, E. R., Ni, J., and Duhaime, M. B. (2016). Fate of Microplastics and Other Small Anthropogenic Litter (SAL) in Wastewater Treatment Plants Depends on Unit Processes Employed. Environ. Sci. Water Res. Technol. 2 (6), 1064–1073. doi:10.1039/C6EW00207B
Mintenig, S. M., Int-Veen, I., Löder, M. G. J., Primpke, S., and Gerdts, G. (2017). Identification of Microplastic in Effluents of Waste Water Treatment Plants Using Focal Plane Array-Based Micro-Fourier-transform Infrared Imaging. Water Res. 108, 365–372. 2017/01/01/. doi:10.1016/j.watres.2016.11.015
Murphy, F., Ewins, C., Carbonnier, F., and Quinn, B. (2016). Wastewater Treatment Works (WwTW) as a Source of Microplastics in the Aquatic Environment. Environ. Sci. Technol. 50 (11), 5800–5808. doi:10.1021/acs.est.5b05416
Nizzetto, L., Futter, M., and Langaas, S. (2016). Are Agricultural Soils Dumps for Microplastics of Urban Origin? Environ. Sci. Technol. 50 (20), 10777–10779. 2016/10/18. doi:10.1021/acs.est.6b04140
Okoffo, E. D., Donner, E., McGrath, S. P., Tscharke, B. J., O'Brien, J. W., O'Brien, S., et al. (2021). Plastics in Biosolids from 1950 to 2016: A Function of Global Plastic Production and Consumption. Water Res. 201, 117367. 2021/08/01/. doi:10.1016/j.watres.2021.117367
Pistocchi, A. (2020). A Preliminary Pan-European Assessment of Pollution Loads from Urban Runoff. Environ. Res., 182, 109129. 2020/03/01/. doi:10.1016/j.envres.2020.109129
Plastics Europe, & European Association of Plastics Recycling and Recovery Organisations (2021). Plastics - the Facts 2021. Europe: Plastic Europe.
Primpke, S., Fischer, M., Lorenz, C., Gerdts, G., and Scholz-Böttcher, B. M. (2020). 2020/12/01Comparison of Pyrolysis Gas Chromatography/mass Spectrometry and Hyperspectral FTIR Imaging Spectroscopy for the Analysis of Microplastics. Anal. Bioanal. Chem. 412 (30), 8283–8298. doi:10.1007/s00216-020-02979-w
Quaranta, E., Dorati, C., and Pistocchi, A. (2021). Meta-models for Rapid Appraisal of the Benefits of Urban Greening in the European Context. J. Hydrology Regional Stud., 34, 100772. 2021/04/01/. doi:10.1016/j.ejrh.2021.100772
Rasmussen, L. A., Iordachescu, L., Tumlin, S., and Vollertsen, J. (2021). A Complete Mass Balance for Plastics in a Wastewater Treatment Plant - Macroplastics Contributes More Than Microplastics. Water Res. 201, 117307. 2021/08/01/. doi:10.1016/j.watres.2021.117307
Rolsky, C., Kelkar, V., Driver, E., and Halden, R. U. (2020). Municipal Sewage Sludge as a Source of Microplastics in the Environment. Curr. Opin. Environ. Sci. Health 14, 16–22. 2020/04/01/. doi:10.1016/j.coesh.2019.12.001
Simon, M., van Alst, N., and Vollertsen, J. (2018). Quantification of Microplastic Mass and Removal Rates at Wastewater Treatment Plants Applying Focal Plane Array (FPA)-based Fourier Transform Infrared (FT-IR) Imaging. Water Res. 142, 1–9. 2018/10/01/. doi:10.1016/j.watres.2018.05.019
Sun, J., Dai, X., Wang, Q., van Loosdrecht, M. C. M., and Ni, B.-J. (2019). Microplastics in Wastewater Treatment Plants: Detection, Occurrence and Removal. Water Res. 152, 21–37. 2019/04/01/. doi:10.1016/j.watres.2018.12.050
Tagg, A. S., Sapp, M., Harrison, J. P., and Ojeda, J. J. (2015). Identification and Quantification of Microplastics in Wastewater Using Focal Plane Array-Based Reflectance Micro-FT-IR Imaging. Anal. Chem. 87 (12), 6032–6040. doi:10.1021/acs.analchem.5b00495
Talvitie, J., Heinonen, M., Pääkkönen, J.-P., Vahtera, E., Mikola, A., Setälä, O., et al. (2015). Do wastewater Treatment Plants Act as a Potential Point Source of Microplastics? Preliminary Study in the Coastal Gulf of Finland, Baltic Sea. Water Sci. Technol. 72 (9), 1495–1504. doi:10.2166/wst.2015.360
Talvitie, J., Mikola, A., Setälä, O., Heinonen, M., and Koistinen, A. (2017). How Well Is Microlitter Purified from Wastewater? - A Detailed Study on the Stepwise Removal of Microlitter in a Tertiary Level Wastewater Treatment Plant. Water Res. 109, 164–172. 2017/02/01/. doi:10.1016/j.watres.2016.11.046
Treilles, R., Gasperi, J., Gallard, A., Saad, M., Dris, R., Partibane, C., et al. (2021). Microplastics and Microfibers in Urban Runoff from a Suburban Catchment of Greater Paris. Environ. Pollut. 287, 117352. doi:10.1016/j.envpol.2021.117352
Unice, K. M., Weeber, M. P., Abramson, M. M., Reid, R. C. D., van Gils, J. A. G., Markus, A. A., et al. (2019). Characterizing Export of Land-Based Microplastics to the Estuary - Part II: Sensitivity Analysis of an Integrated Geospatial Microplastic Transport Modeling Assessment of Tire and Road Wear Particles. Sci. Total Environ. 646, 1650–1659. 2019/01/01/. doi:10.1016/j.scitotenv.2018.08.301
Wagner, S., Hüffer, T., Klöckner, P., Wehrhahn, M., Hofmann, T., and Reemtsma, T. (2018). Tire Wear Particles in the Aquatic Environment - A Review on Generation, Analysis, Occurrence, Fate and Effects. Water Res. 139, 83–100. 2018/08/01/. doi:10.1016/j.watres.2018.03.051
Watkins, L., Sullivan, P. J., and Walter, M. T. (2021). What You Net Depends on if You Grab: A Meta-Analysis of Sampling Method's Impact on Measured Aquatic Microplastic ConcentrationWhat You Net Depends on if You Grab: A Meta-Analysis of Sampling Method’s Impact on Measured Aquatic Microplastic Concentration. Environ. Sci. Technol. 55 (19), 12930–12942. doi:10.1021/acs.est.1c03019
Weber, C. J., Santowski, A., and Chifflard, P. (2022). Investigating the Dispersal of Macro- and Microplastics on Agricultural Fields 30 Years after Sewage Sludge Application. Sci. Rep. 12 (1), 6401. 2022/04/16. doi:10.1038/s41598-022-10294-w
Werbowski, L. M., Gilbreath, A. N., Munno, K., Zhu, X., Grbic, J., Wu, T., et al. (2021). Urban Stormwater Runoff: A Major Pathway for Anthropogenic Particles, Black Rubbery Fragments, and Other Types of Microplastics to Urban Receiving Waters. ACS Est. Water 1 (6), 1420–1428. doi:10.1021/acsestwater.1c00017
Keywords: microplastics, wastewater, runoff, tire wear particles, microplastics flow model
Citation: Obermaier N and Pistocchi A (2022) A Preliminary European-Scale Assessment of Microplastics in Urban Wastewater. Front. Environ. Sci. 10:912323. doi: 10.3389/fenvs.2022.912323
Received: 04 April 2022; Accepted: 03 June 2022;
Published: 11 July 2022.
Edited by:
Arianna Azzellino, Politecnico di Milano, ItalyReviewed by:
Gianluigi Buttiglieri, Catalan Institute for Water Research, SpainRachel Leads, University of North Texas, United States
Copyright © 2022 Obermaier and Pistocchi. This is an open-access article distributed under the terms of the Creative Commons Attribution License (CC BY). The use, distribution or reproduction in other forums is permitted, provided the original author(s) and the copyright owner(s) are credited and that the original publication in this journal is cited, in accordance with accepted academic practice. No use, distribution or reproduction is permitted which does not comply with these terms.
*Correspondence: Alberto Pistocchi, YWxiZXJ0by5waXN0b2NjaGlAZWMuZXVyb3BhLmV1