 Zhihui Zhao
 Ruiyu Fu2
 Junjie Liu
 Licong Dai
 Xiaowei Guo
95% of researchers rate our articles as excellent or good
Learn more about the work of our research integrity team to safeguard the quality of each article we publish.
Find out more
ORIGINAL RESEARCH article
Front. Environ. Sci. , 14 July 2022
Sec. Atmosphere and Climate
Volume 10 - 2022 | https://doi.org/10.3389/fenvs.2022.912209
This article is part of the Research Topic The Impacts of Atmospheric and Environmental Changes of Urban Cities and Suburbs on The Tibetan Plateau and other northern Hemispheric Cryosphere View all 7 articles
The effects of climate change on permafrost have been well documented in many studies, whereas the effect of climate change on seasonally frozen ground (SFG) is still poorly understood. We used the observed daily freeze depth of SFG and environmental factors data from the period 2007–2016 to examine the seasonal and inter-annual variation of SFG. We quantitatively evaluated the effects of environmental factors on SFG using a boosted regression tree analysis. The results show that, on a seasonal scale, the lower layer soil frost starts freezing in mid-November, with the maximum freeze depth occurring in late March (209 cm), and then begins to thaw in both the lower and upper layers. We identified four stages of the freeze-thaw cycle: the non-frozen phase, initial freezing, deep freezing, and thawing. Furthermore, the thawing process of SFG mainly took place in the upper layer, but the freezing rate of the lower layer from mid-November to early February was similar to the thawing rate of late April to late June. On the inter-annual scale, the maximum freeze depth showed a significant increasing trend (p < 0.05). However, the freeze-thaw duration declined significantly (p < 0.05), which was correlated with the decrease in the period when surface soil temperature is below 0°C. The mean soil temperature and soil heat flux were the most important environmental indicators affecting seasonal variation of SFG depth, and the cumulative negative air and soil temperatures were the dominant factors affecting inter-annual variation of maximum freeze depth. Our results might provide insight into predicting hydrological and ecological responses to future climate change in frozen-ground regions.
Frozen ground is an important component of the cryosphere and mainly includes permafrost and seasonally frozen ground (SFG) (Peng et al., 2020). Freeze-thaw changes in frozen ground can alter the hydrothermal conditions and soil stability (Rafiei Sardooi et al., 2021), thereby affecting the surface energy, water, and carbon cycles in the Earth’s system. This results in changes in climate at both local and global scales, and alterations of hydrological and terrestrial ecosystems (Schmidt et al., 2011; Derksen et al., 2012; Rafiei Sardooi et al., 2021). Frozen ground is particularly sensitive to climatic changes due to its dependency on energy and mass exchange between the land and atmosphere (Wu et al., 2016). Studies show significant changes and degradation trends in the frozen ground in the regions at high altitudes and latitudes due to global warming (Guo and Wang, 2013; Chang et al., 2018). These environmental changes, induced by the degradation of frozen ground, challenge environmental, agricultural, and human security at a regional scale (Xu et al., 2022). Therefore, understanding the response of the frozen ground to the predicted intensification of climatic changes is, therefore, of great importance.
The Qinghai-Tibet Plateau (QTP) is the Earth’s ‘Third Pole.’ The Arctic, Antarctic, and Tibetan Plateau (TP) can be collectively referred to as the “three poles of the Earth” (Ran et al., 2018). As the dominant parts of the cryosphere, the QTP are pivotal and sensitive areas under global climate change. However, the QTP gets little attention compared with the Arctic or Antarctic, but it stores Earth’s largest ice. The store is melting fast in QTP compared with other regions; 82% of the plateau’s glaciers have retreated in the past half-century, and 10% of its permafrost has degraded in the past decade (Qiu, 2008). Several studies predict that nearly half of the QTP permafrost could degrade to SFG with the intensification of global warming and human activities (Chang et al., 2018; Wang et al., 2019b). A recent study found that the maximum freeze depth and duration of SFG have decreased over the past decades (Guo and Wang, 2013). Degradation of frozen ground can affect vegetation growth by altering soil water storage and impact runoff by increasing the surface water deficit (Genxu et al., 2009; Liljedahl et al., 2016), changing the water supply for billions of people and altering the atmospheric circulation over half the planet.
Freeze-thaw changes in SFG are an important indicator of climate change (Frauenfeld and Zhang, 2011; Yang et al., 2019), as soil heat, surface net radiation, and sensible, latent, and ground heat fluxes influence the freeze-thaw cycle (Luo et al., 2009; Fisher et al., 2016). Another study reports that surface temperature is the dominant factor causing the freeze-thaw changes in SFG (Wang et al., 2019a). In addition, it was observed that the beginning and end of soil freezing have been delayed. For instance, Wang et al. (2015) explored the changes in the timing and duration of the soil freeze-thaw cycle across China during 1956–2006 and found that the beginning was delayed by 5 days, the end date by about 7 days, and the duration of SFG decreased by about 10 days. Overall, changes in the timing and duration of the freeze-thaw cycle in response to climate change have been widely studied (Fisher et al., 2016; Shi et al., 2018). However, they mainly focused on permafrost, and a few studies focused on changes in SFG. One of the major obstacles in assessing the changes in SFG is the lack of long-term observations of the SFG response to climatic changes. Nonetheless, increasing evidence shows that SFG is more sensitive to climate change than permafrost because its freezing and thawing layers are closer to the surface (Luo et al., 2020). Warming of the climate could substantially affect the maximum freeze depth and duration of SFG (Wang et al., 2015). The freeze-thaw process of seasonal frozen ground impacts, in turn, the surface energy balance, hydrological processes, and ground-air-water heat exchange (Guo and Wang, 2013; Fisher et al., 2016). Therefore, identifying the key environmental factors that affect SFG could give insights into the future impact of climate change on SFG. In this study, we used the random forest analysis method to analyze the seasonal and inter-annual variation of SFG, using the observed daily freeze depth of SFG and environmental factors for the period 2007–2016. This method allowed us to quantitatively evaluate the effects of environmental factors on SFG. This study aimed to provide a theoretical basis for predicting the response of SFG to future climatic changes.
This study was carried out in Haibei Station, Qinghai Province, China (37° 37′ N, 101° 19′ E), in the northeastern Qinghai-Tibet Plateau (Figure 1) at an average elevation of 3,230 m. The site has a plateau continental monsoon climate with a mean annual air temperature of approximately −1.7°C, reaching a maximum in July (9.8°C) and a minimum in January (−14.80°C); the mean annual precipitation is 618 mm, which mainly falls in the growing season (early May to late September). The mean annual sunshine is 2,462.7 h, and the total annual radiation is 2,182.54 MJ m−2. The soil type in the study area is classified as Mollic Gryic Cambisols, based on the United States Department of Agriculture Soil Taxonomy. The thickness of the soil is approximately 50–60 cm, with abundant soil organic matter in the surface layer due to the unique Mattic Epipedon (Dai et al., 2019).
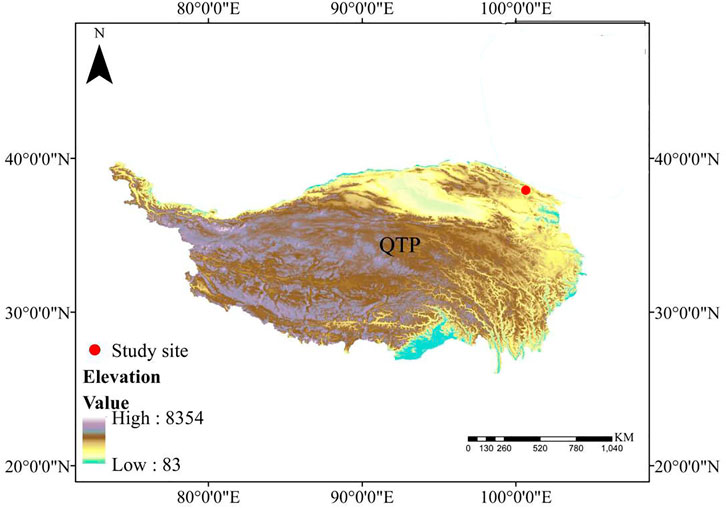
FIGURE 1. Location map of the study site in this study.
The environmental factors data was obtained from the meteorological observations from the Qinghai Haibei Station, including precipitation at 0.5 m (52203, RM Young, United States), net radiation of 1.5 m (CNR-1, Kipp & Zonen, Netherlands), 2 cm soil heat flux (HFT-3, Campbell Scientific, United States), air temperature measurements at 1.5 m (mean, maximum, minimum temperatures), wind speed, relative humidity (HMP45C, Vaisala, Finland), sunshine hours (Hydra Probe II, Stevens, United States), and soil temperatures at different soil layers. The mean soil temperature (MST) was obtained by calculating the mean of temperatures at soil depths of 0, 20, 40, 50, and 100 cm. The freeze depth of the soil was measured once per day (at 8:00 a.m. Beijing Time) by burying the standard frost tubes in the soil when the surface soil temperature was below 0°C. The maximum freeze depth is the maximum depth of freezing, and all the observed data is complete. In this study, a freeze year (hereafter referred to as a year) is from July 1st of the current year to June 31st of the following year. The actual number of freeze days (NF) was determined by counting the number of days when the daily freeze thickness was not zero (Wang et al., 2019b). We defined the soil freeze duration as the daily minimum temperature of surface soil below 0°C. The cumulative negative temperatures of soil and air were obtained by adding all temperatures below 0°C during the freezing year.
Strong collinearities and nonlinearities were observed among the meteorological variables. Consequently, our evaluation could not be based on the independent variable coefficient value in the multiple regression analysis or the general multiple of the linear regression. Thus, we used the boosted regression tree (BRT) analysis to quantitatively evaluate the effects of environmental factors on SFG. BRT analysis is a machine learning method that combines the algorithms of regression trees and boosting. Regression trees are built through recursive binary splits, and boosting is a numerical optimization technique that adds a new tree into each step to reduce the loss function and increase model accuracy (Zhang et al., 2021). The advantage of BRT is that it can handle different predictor variables, regardless of whether they are continuous, categorical, or binary, and it does not require the transformation of data and removal of outliers. In addition, the BRT method can deal with missing data using surrogates and fit complex nonlinear relationships (Elith et al., 2008). BRT had good performance in handling many predictor variables when performing well in cases where predictor variables display linear dependency with other variables, which is a great advantage compared to other methods. For our study, we performed the BRT analysis using the “gbm.step” function in the R “dismo” package, choosing the Gaussian response type to reduce the squared error (Hijmans et al., 2017). The “gbm.step” function in the R “dismo” package was to fit a gbm model to one or more response variables, using cross-validation to estimate the optimal number of trees. The detailed information of BRT model could be found in Elith et al. (2008). We evaluated the accuracy and reliability of the BRT model by observing the percentage of explained deviation (pseudo-R2 value) and the CV correlation between the observed and predicted values. All statistical analyses and plots were conducted using the open-source statistical software R (version: 3.6.2; R Development Core Team, 2019).
On the seasonal scale, environmental factors displayed a unimodal curve trend (Figure 2), increasing from January to July, then gradually decreasing, with the maximum in July. The average soil temperature (Ts), average air temperature (Ta), maximum air temperature (Tmax), and minimum air temperature (Tmin) were (15.55 ± 0.44)°C, (10.85 ± 0.27)°C, (18.50 ± 0.29)°C, and (4.00 ± 0.43)°C, respectively. The net radiation (Rn) and soil heat flux (G) also displayed a single peak curve trend, with the maximum values occurring in July (320.75 ± 11.24 MJ m−2) and May (28.87 ± 2.05 w m−2), respectively (Figure 2). On the annual scale, the mean air temperature (MAT) displayed an increasing trend, with an increase of 0.5°C per decade (Figure 3A), but the mean air temperature (MST) displayed no obvious trend (Figure 3B). In addition, the yearly G reduced significantly during 2007–2015, whereas the cumulative negative soil and air temperature showed an increasing trend (p < 0.05) (Figure 3).
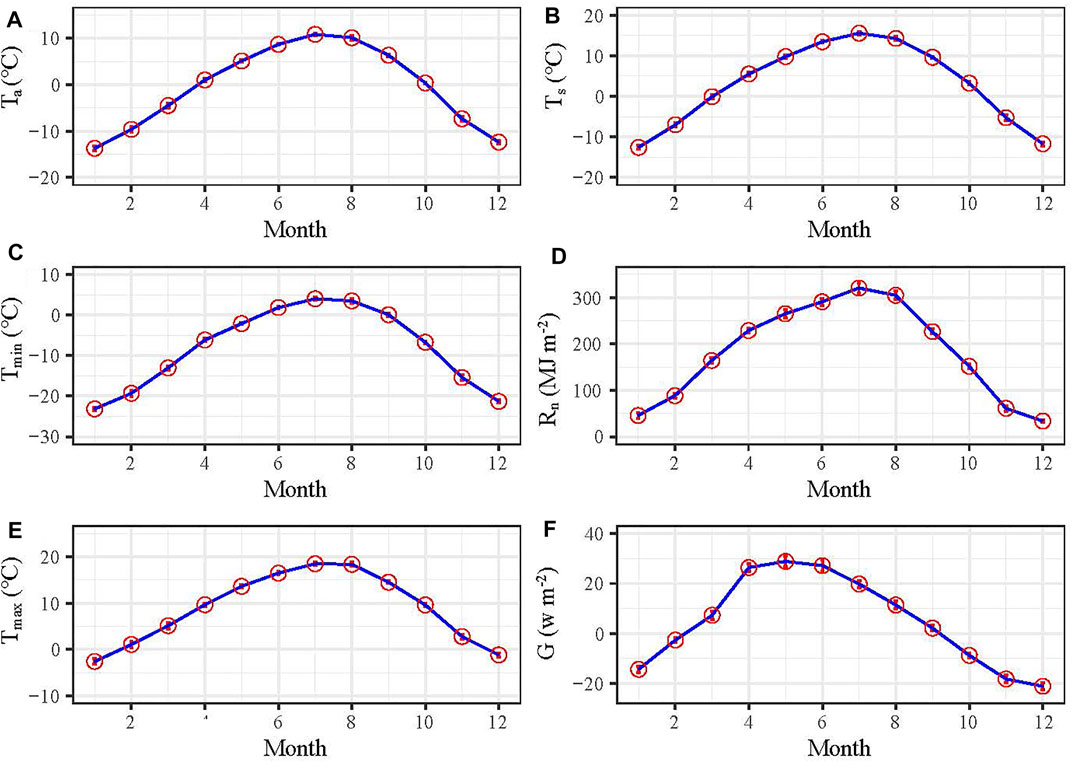
FIGURE 2. Seasonal variation of environmental factors, (A) average air temperature (Ta), (B) average soil temperature (Ts), (C) minimum air temperature (Tmin), (D) net radiance (Rn), (E) maximum air temperature (Tmax) and (F) soil heat flux (G).
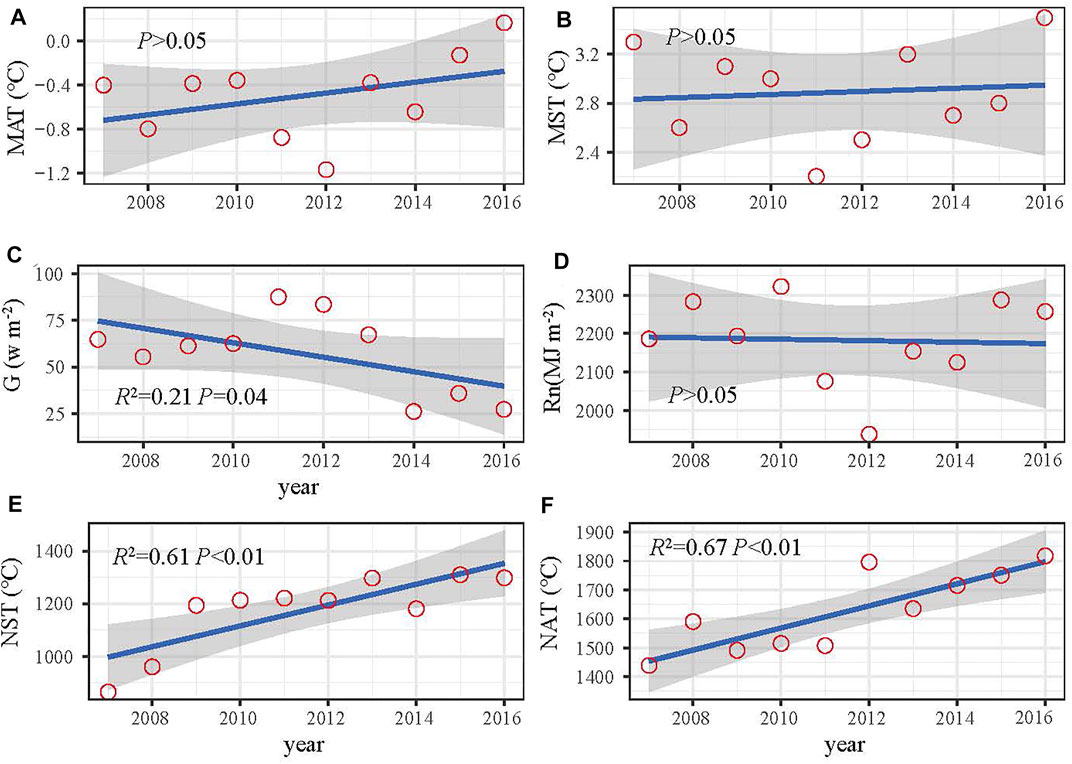
FIGURE 3. Inter-annual variation of environmental factors, (A) mean air temperature (MAT), (B) mean soil temperature (MST), (C) soil heat flux (G), (D) net radiance (Rn), (E) negative accumulated temperature of soil temperature (NST), and (F) negative accumulated temperature of air temperature (NAT).
On a seasonal scale, the lower layer of soil frost starts to freeze in mid-November, with the maximum freeze depth occurring in late March (209 cm), and then begins to thaw both at the lower and upper layer (Figure 4A). The freeze-thaw process can be roughly divided into four stages: non-frozen, initial freezing, deep freezing, and thawing phases. The non-frozen phase occurred from July to October of the following year the initial freezing from November to December; the deep freezing from January to March; and the thawing phase took place during April–June. Moreover, the thawing depth in the upper layer of soil frost was much higher than that in the lower layer of soil frost. However, the freezing depth of the lower layer of soil frost from mid-November to early February was very similar to the thawing rate from late April to late June, suggesting an equivalent thermal driver during the two stages at this site. On the annual scale, the maximum freeze depth showed a significant increasing trend (p < 0.05) (Figure 4B), which was consistent with the trend of negative accumulated temperature of MST and MAT (Figures 3E,F). NF has declined significantly (Figure 5B), which is consistent with the decrease in the soil freeze duration (Figure 5A).
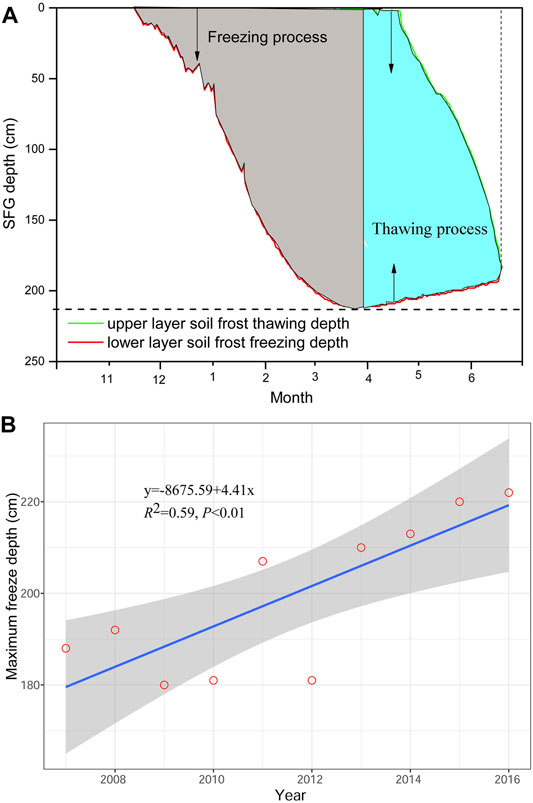
FIGURE 4. Seasonal (A) and inter-annual variation (B) of seasonally frozen ground (SFG) depth.
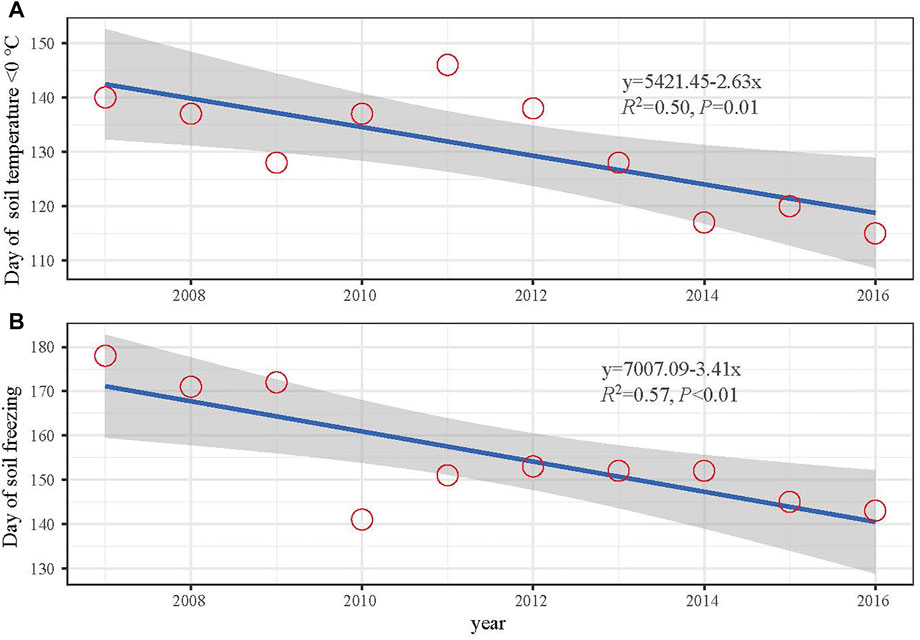
FIGURE 5. Inter-annual variation of day number of seasonal frozen (A) and averaged topsoil temperature below 0°C (B).
The soil temperature and water content changed considerably during the freeze-thaw process (Figure 6). The surface soil water content (0–20 cm) was reduced during both the initial and the deep freezing phases, whereas the middle soil water content (20–60 cm) showed a significant increase. In contrast, the surface soil water content (0–20 cm) increased during the thawing phase, whereas the middle soil water content (20–60 cm) slightly decreased. However, the deep soil water content (60–100 cm) stayed relatively stable during the freeze-thaw process. Besides, soil temperature declined with soil depth during the non-frozen phase but increased with soil depth during the initial and deep freezing phases.
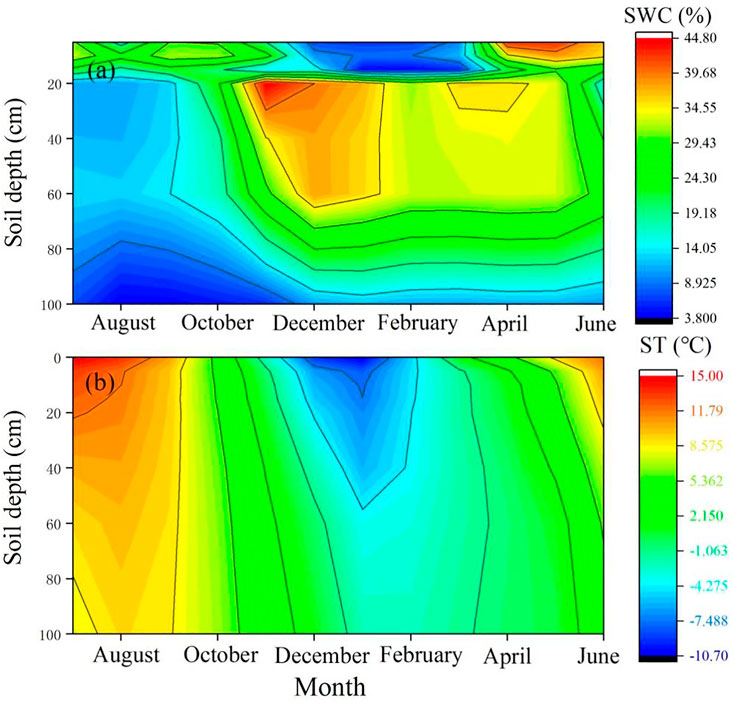
FIGURE 6. Seasonal variation of soil moisture (A) and soil temperature (B) across different soil layers.
BRT analysis identified the MST and the 2 cm soil heat flux as the key environmental factors affecting SFG, accounting for 88.8% of the total variation, followed by total net radiation (9.6%). Air temperature and wind speed had little impact on seasonal frozen soil depth (Figure 7A). Furthermore, we found that the effect of soil temperature depended on the depth, with temperature at 100 cm having the most impact, and a gradually decreasing impact from 50 to 20 cm (Figure 7B).
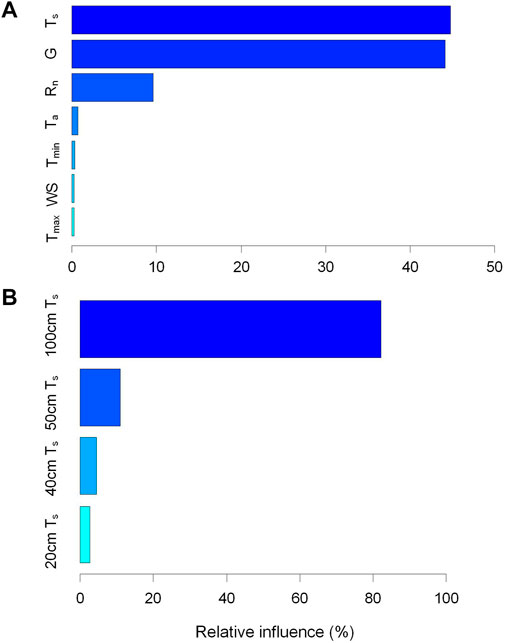
FIGURE 7. The relative importance of environmental factors (A) and different soil temperatures (B) on seasonally frozen ground depth.
Furthermore, we further examined the partial effects of environmental factors on SFG depth (Figure 8). We observed a negative relationship between SFG depth and MST; the SFG depth declined with increasing MST. The SFG depth showed a sharp increase in response to increasing soil heat flux and net radiation when the parameters were less than 0 w/m2 and 5 MJ m−2, respectively. By contrast, SFG depth begins to decrease when the daily net radiation is greater than 5 MJ m−2. In the relationship to air temperature, the SFG depth increased gradually with increasing temperature when the daily average and minimum temperatures were lower than 0°C and gradually decreased when the temperature rose above 0°C (Figure 8).
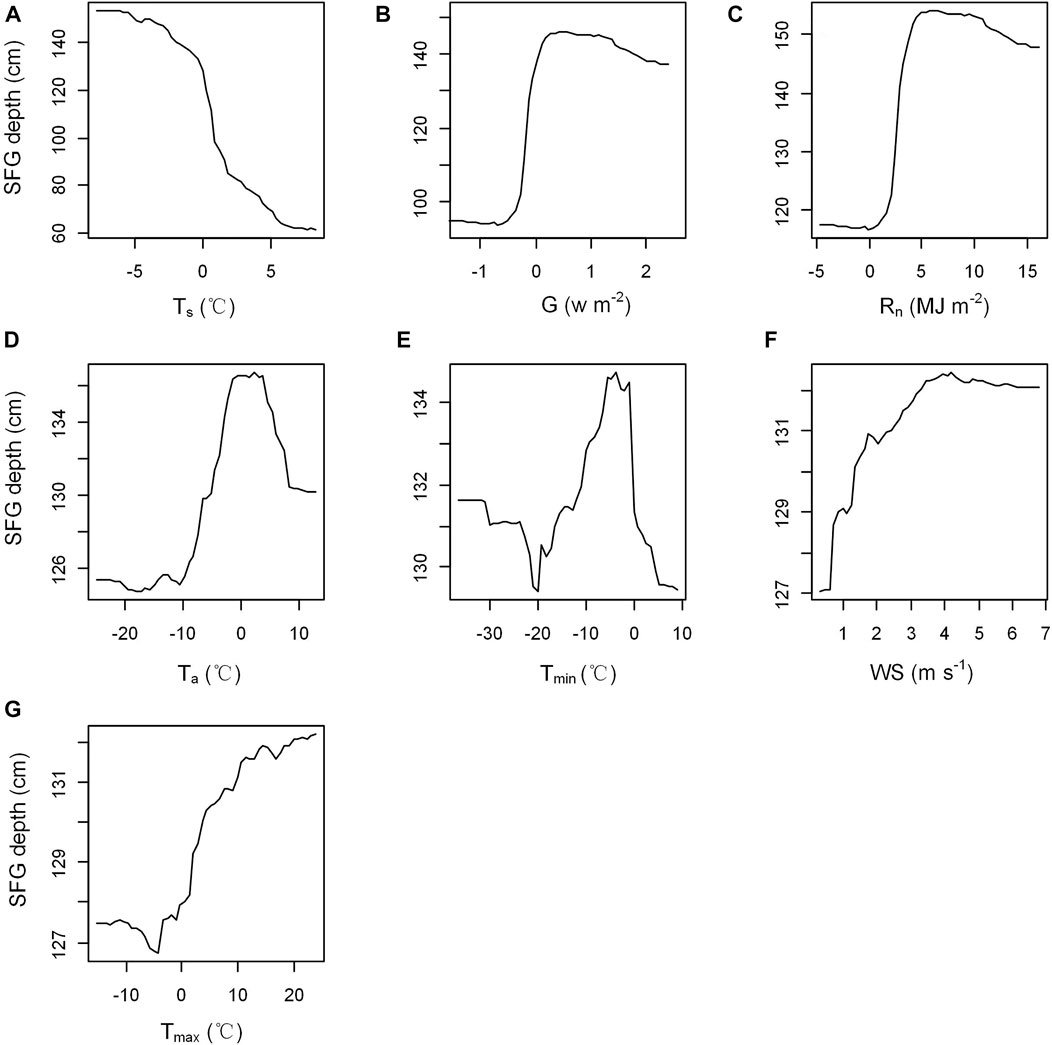
FIGURE 8. Partial effect of environmental factors on seasonally frozen ground depth, (A) average soil temperature, (B) soil heat flux, (C) net radiance, (D) average air temperature, (E) minimum air temperature, (F) average wind speed, and (G) maximum air temperature.
The freeze-thaw process of SFG is sensitive to climate change owing to energy and mass exchange between the ground surface and the atmosphere (Wu et al., 2016). Previous studies report that the soil freeze-thaw process is predominantly controlled by soil thermal conditions such as soil heat and moisture, thermal buffering of underlying soils, surface vegetation, and snow cover (Cao et al., 2017; Way and Lewkowicz, 2018). In our study, we identified a seasonal dynamic in SFG, roughly divided into four phases according to the soil freeze-thaw process: non-frozen, initial freezing, deep freezing, and thawing (Figure 4A). As a result of the freeze-thaw process of SFG being related to the earth–air hydrothermal cycle, previous studies have found that the process of soil freezing and thawing is sensitive to climate change and has a negative correlation with air temperature (Wei and Ran, 2018). However, we found that soil temperature is the main contributor to the seasonal variation of SFG, while air temperature has a weak effect. Our results are inconsistent with the study of the Eurasian high latitudes, which found that seasonal variation in SFG was mainly caused by air temperature (Frauenfeld and Zhang, 2011). Furthermore, we found that the freezing process of SFG was unidirectional from top to bottom, whereas the thawing process of SFG was bidirectional (upper and lower layer soil frost) (Figure 4A), which contrasts with the permafrost pattern. The unique freeze-thaw pattern of SFG was attributed to the surface soil temperature (Dai et al., 2019). For instance, when the MST falls below 0°C, the soil begins to freeze and the freezing depth gradually increases, with the maximum freeze depth occurring in March, in consistency with the seasonal dynamics of MST. MST was below 0°C before March (Figure 2A), thus the soil freezing depth gradually increased, reaching its peak in March. However, the thawing process of SFG was bidirectional and mainly determined by the thawing in the upper layer of soil frost, which might be related to the higher soil temperature in the upper layer compared with the lower layer during the thawing process.
Interestingly, there were some differences in the impact of different soil layer temperatures on SFG depth, and we found that deep soil temperature had a stronger impact on SFG depth compared with surface soil temperature. These discrepancies might be related to the difference in soil temperature at the soil profile, and we found that soil temperature increased with increasing soil depth during the freeze-thaw. Thus, the soil temperature in deeper soil layers was higher than the surface soil temperature, resulting in the deep soil temperature having a stronger effect on SFG depth. In addition to the soil temperature, Luo et al. (2020) also found that the increased soil heat flux might be the direct reason for the SFG freeze-thaw process on QTP and that soil heat flux is an important factor in regulating this process. Soil heat flux is a major physical parameter representing the energy exchange between land and air, and an important component distribution in the energy balance equation of the ecosystem, which could affect soil heat transfer at the land surface interface, thereby altering the freeze-thaw process of SFG. Net radiation also has a certain impact on the SFG depth by translating into sensible, latent, or ground heat flux (Luo et al., 2009; Fisher et al., 2016), thereby altering the SFG depth.
Long-term observation records have shown that the temperature has increased by 0.39 ± 0.15°C from 2007 to 2016 in the northern high latitudes (Biskaborn et al., 2019). This warming trend is also confirmed by the findings of this study, the mean annual temperature in SFG has increased by 0.5°C per year during 2007–2016. This warming trend could lead to a significant change in the maximum frozen depth and freeze-thaw duration in both the high-latitude and high-altitude regions (Chen et al., 2015; Park et al., 2016). For instance, Wang et al. (2019b) found that the maximum seasonally frozen depth decreased by 25 ± 5 cm at a rate of 0.46 ± 0.09 cm/year from the 1960s to the 2000s, furthermore, the number of freeze days experienced a significant decrease in the Qilian Mountains of the QTP. In this study, we found that the maximum frozen depth was increasing while NF declined significantly during 2007–2016. Our findings did not align with the results of previous studies, where both the maximum freeze depth and freeze-thaw duration in the QTP saw a steady decline over the past decades (Chen et al., 2015; Park et al., 2016), because the maximum frozen depth is mainly affected by NF, that is, the longer the freeze-thaw duration of SFG, the deeper the maximum frozen depth (Li et al., 2005). These discrepancies suggest that the maximum frozen depth was controlled by the mean air temperature and freeze-thaw duration. We related the decrease in NF to the reduced number of days when the surface soil temperature was below 0°C (Figure 5B), while the increase in the maximum frozen depth might be related to the increased cumulative negative soil temperature and decreased soil heat flux. Increasing evidence has shown that the maximum frozen depth is mainly affected by the negative accumulated temperature and heat flux of soil, that is, the greater the negative accumulated temperature of soil, the greater the maximum frozen depth. Therefore, the freeze-thaw duration could further decline in the context of global warming.
Of course, there are some uncertainties and limitations in our studies, and it should be noted that the controlling factors of maximum frozen depth are complex and are not only affected by the environmental factors but also by the topography, salt, and water content of the soil (Luo et al., 2020). For instance, Wang et al. (2019b) reported that elevation and topography strongly affect the freeze-thaw process of frozen ground through orographic effects on precipitation and solar radiation loading. Our study is based on only 10 years of observed data from one station in the region and is focused primarily on environmental factors. Therefore, to gain a better understanding of the response of SFG to future climatic changes, more factors and observation points should be considered.
Based on the observed daily freeze depth of SFG and environmental records of the period 2007–2016, we found that the SFG had an obvious daily dynamic roughly split into four phases of the soil freeze-thaw process: non-frozen, initial freezing, deep freezing, and thawing. Furthermore, we found that the freezing process of SFG was unidirectional from top to bottom, whereas the thawing process of SFG was bidirectional (upper and lower layer soil frost). Interestingly, we found that the maximum frozen soil depth showed a significant increasing trend in the context of global warming, which was attributed to the increase in the cumulative negative temperature. However, the freeze-thaw duration shows a decreasing trend owing to the significant decline in the soil freeze duration. Besides, the soil temperature and soil heat flux were the most important environmental factors affecting the daily dynamics of seasonal frozen soil depth, and the deep soil temperature had a greater impact on the frozen soil depth than the surface soil temperature. Therefore, the soil temperature and soil heat flux factors should be incorporated into freeze-thaw cycle models to have a better prediction of the response of SFG to future climate change in high altitudes and latitudes of the world.
The original contributions presented in the study are included in the article/supplementary material; further inquiries can be directed to the corresponding authors.
LD and XG performed the research, analyzed data, and wrote the paper; JL, RF, ZZ, YD, and ZH analyzed data; GC conducted the study.
This work was supported by the Hainan Provincial Natural Science Foundation of China (422QN264), the Natural Science Foundation of Qinghai (2021-HZ-811), and start-up funding from Hainan University [KYQD(ZR)-22085].
The authors declare that the research was conducted in the absence of any commercial or financial relationships that could be construed as a potential conflict of interest.
All claims expressed in this article are solely those of the authors and do not necessarily represent those of their affiliated organizations, or those of the publisher, the editors, and the reviewers. Any product that may be evaluated in this article, or claim that may be made by its manufacturer, is not guaranteed or endorsed by the publisher.
Biskaborn, B. K., Smith, S. L., Noetzli, J., Matthes, H., Vieira, G., Streletskiy, D. A., et al. (2019). Permafrost is Warming at a Global Scale. Nat. Commun. 10, 264–311. doi:10.1038/s41467-018-08240-4
Cao, B., Gruber, S., Zhang, T., Li, L., Peng, X., Wang, K., et al. (2017). Spatial Variability of Active Layer Thickness Detected by Ground‐penetrating Radar in the Qilian Mountains, Western China. J. Geophys. Res. Earth Surf. 122, 574–591. doi:10.1002/2016jf004018
Chang, Y., Lyu, S., Luo, S., Li, Z., Fang, X., Chen, B., et al. (2018). Estimation of Permafrost on the Tibetan Plateau under Current and Future Climate Conditions Using the CMIP5 Data. Int. J. Climatol. 38, 5659–5676. doi:10.1002/joc.5770
Chen, D., Xu, B., Yao, T., Guo, Z., Cui, P., Chen, F., et al. (2015). Assessment of Past, Present and Future Environmental Changes on the Tibetan Plateau. Chin. Sci. Bull. 60, 3025–3035. doi:10.1360/n972015-00849
Dai, L., Guo, X., Zhang, F., Du, Y., Ke, X., Li, Y., et al. (2019). Seasonal Dynamics and Controls of Deep Soil Water Infiltration in the Seasonally-Frozen Region of the Qinghai-Tibet Plateau. J. Hydrology 571, 740–748. doi:10.1016/j.jhydrol.2019.02.021
Derksen, C., Smith, S. L., Sharp, M., Brown, L., Howell, S., Copland, L., et al. (2012). Variability and Change in the Canadian Cryosphere. Clim. Change 115, 59–88. doi:10.1007/s10584-012-0470-0
Elith, J., Leathwick, J. R., and Hastie, T. (2008). A Working Guide to Boosted Regression Trees. J. Anim. Ecol. 77, 802–813. doi:10.1111/j.1365-2656.2008.01390.x
Fisher, J. P., Estop-Aragonés, C., Thierry, A., Charman, D. J., Wolfe, S. A., Hartley, I. P., et al. (2016). The Influence of Vegetation and Soil Characteristics on Active-Layer Thickness of Permafrost Soils in Boreal Forest. Glob. Change Biol. 22, 3127–3140. doi:10.1111/gcb.13248
Frauenfeld, O. W., and Zhang, T. (2011). An Observational 71-year History of Seasonally Frozen Ground Changes in the Eurasian High Latitudes. Environ. Res. Lett. 6, 044024. doi:10.1088/1748-9326/6/4/044024
Genxu, W., Shengnan, L., Hongchang, H., and Yuanshou, L. (2009). Water Regime Shifts in the Active Soil Layer of the Qinghai-Tibet Plateau Permafrost Region, under Different Levels of Vegetation. Geoderma 149, 280–289. doi:10.1016/j.geoderma.2008.12.008
Guo, D., and Wang, H. (2013). Simulation of Permafrost and Seasonally Frozen Ground Conditions on the Tibetan Plateau, 1981-2010. J. Geophys. Res. Atmos. 118, 5216–5230. doi:10.1002/jgrd.50457
Hijmans, R. J., Phillips, S., Leathwick, J., and Elith, J. (2017). Package ‘Dismo’. Circles 9 (1), 1–68.
Li, L., Zhu, X., Wang, Q., and Wang, Z. (2005). Mapping and Analyses of Permafrost Change in the Qinghai Plateau Using GIS. J. Glaciol. Geocryol. 27, 320–328.
Liljedahl, A. K., Boike, J., Daanen, R. P., Fedorov, A. N., Frost, G. V., Grosse, G., et al. (2016). Pan-Arctic Ice-Wedge Degradation in Warming Permafrost and its Influence on Tundra Hydrology. Nat. Geosci. 9, 312–318. doi:10.1038/ngeo2674
Luo, S., Lü, S., and Zhang, Y. (2009). Development and Validation of the Frozen Soil Parameterization Scheme in Common Land Model. Cold Regions Sci. Technol. 55, 130–140. doi:10.1016/j.coldregions.2008.07.009
Luo, S., Wang, J., Pomeroy, J. W., and Lyu, S. (2020). Freeze-Thaw Changes of Seasonally Frozen Ground on the Tibetan Plateau from 1960 to 2014. J. Clim. 33, 9427–9446. doi:10.1175/jcli-d-19-0923.1
Park, H., Kim, Y., and Kimball, J. S. (2016). Widespread Permafrost Vulnerability and Soil Active Layer Increases Over the High Northern Latitudes Inferred from Satellite Remote Sensing and Process Model Assessments. Remote Sens. Environ. 175, 349–358. doi:10.1016/j.rse.2015.12.046
Peng, X., Zhang, T., Frauenfeld, O. W., Du, R., Wei, Q., and Liang, B. (2020). Soil Freeze Depth Variability across Eurasia during 1850-2100. Clim. Change 158, 531–549. doi:10.1007/s10584-019-02586-4
Qiu, J. (2008). The Third Pole: Climate Change is Coming Fast and Furious to the Tibetan Plateau. Jane Qiu Reports on the Changes Atop the Roof of the World. Nature 454, 393–396. doi:10.1038/454393a
R Development Core Team (2019). R: A Language and Environment for Statistical Computing. Vienna: R foundation for statistical computing.
Rafiei Sardooi, E., Azareh, A., Mesbahzadeh, T., Soleimani Sardoo, F., Parteli, E. J. R., and Pradhan, B. (2021). A Hybrid Model Using Data Mining and Multi-Criteria Decision-Making Methods for Landslide Risk Mapping at Golestan Province, Iran. Environ. Earth Sci. 80, 487. doi:10.1007/s12665-021-09788-z
Ran, Y., Li, X., and Cheng, G. (2018). Climate Warming over the Past Half Century Has Led to Thermal Degradation of Permafrost on the Qinghai-Tibet Plateau. Cryosphere 12, 595–608. doi:10.5194/tc-12-595-2018
Schmidt, M. W. I., Torn, M. S., Abiven, S., Dittmar, T., Guggenberger, G., Janssens, I. A., et al. (2011). Persistence of Soil Organic Matter as an Ecosystem Property. Nature 478, 49–56. doi:10.1038/nature10386
Shi, Y., Niu, F., Yang, C., Che, T., Lin, Z., and Luo, J. (2018). Permafrost Presence/Absence Mapping of the Qinghai-Tibet Plateau Based on Multi-Source Remote Sensing Data. Remote Sens. 10, 309. doi:10.3390/rs10020309
Wang, K., Zhang, T., and Zhong, X. (2015). Changes in the Timing and Duration of the Near-Surface Soil Freeze/thaw Status from 1956 to 2006 across China. Cryosphere 9, 1321–1331. doi:10.5194/tc-9-1321-2015
Wang, X., Chen, R., Han, C., Yang, Y., Liu, J., Liu, Z., et al. (2019a). Response of Frozen Ground under Climate Change in the Qilian Mountains, China. Quat. Int. 523, 10–15. doi:10.1016/j.quaint.2019.06.006
Wang, X., Chen, R., Liu, G., Yang, Y., Song, Y., Liu, J., et al. (2019b). Spatial Distributions and Temporal Variations of the Near-Surface Soil Freeze State across China under Climate Change. Glob. Planet. Change 172, 150–158. doi:10.1016/j.gloplacha.2018.09.016
Way, R. G., and Lewkowicz, A. G. (2018). Environmental Controls on Ground Temperature and Permafrost in Labrador, Northeast Canada. Permafr. Periglac Process 29, 73–85. doi:10.1002/ppp.1972
Wei, Z., and Ran, J. (2018). Response of Maximum Seasonally Frozen Depth and Duration of Soil Frozen to Climate Change in Chaoyang Prefecture of Liaoning Province. J. Glaciol. Geocryol. 40, 18–25. doi:10.7522/j.issn.1000-0240.2018.0333
Wu, Q., Zhang, Z., Gao, S., and Ma, W. (2016). Thermal Impacts of Engineering Activities and Vegetation Layer on Permafrost in Different Alpine Ecosystems of the Qinghai-Tibet Plateau, China. Cryosphere 10, 1695–1706. doi:10.5194/tc-10-1695-2016
Xu, S., Liu, D., Li, T., Fu, Q., Liu, D., Hou, R., et al. (2022). Spatiotemporal Evolution of the Maximum Freezing Depth of Seasonally Frozen Ground and Permafrost Continuity in Historical and Future Periods in Heilongjiang Province, China. Atmos. Res. 274, 106195. doi:10.1016/j.atmosres.2022.106195
Yang, M., Wang, X., Pang, G., Wan, G., and Liu, Z. (2019). The Tibetan Plateau Cryosphere: Observations and Model Simulations for Current Status and Recent Changes. Earth-Sci. Rev. 190, 353–369. doi:10.1016/j.earscirev.2018.12.018
Keywords: Qinghai-Tibet plateau, seasonally frozen ground, random forest analysis, environmental factors, seasonal and inter-annual variation
Citation: Zhao Z, Fu R, Liu J, Dai L, Guo X, Du Y, Hu Z and Cao G (2022) Response of Seasonally Frozen Ground to Climate Changes in the Northeastern Qinghai-Tibet Plateau. Front. Environ. Sci. 10:912209. doi: 10.3389/fenvs.2022.912209
Received: 04 April 2022; Accepted: 27 May 2022;
Published: 14 July 2022.
Edited by:
Giovanni Baccolo, University of Milano-Bicocca, ItalyReviewed by:
Eric Josef Ribeiro Parteli, University of Duisburg-Essen, GermanyCopyright © 2022 Zhao, Fu, Liu, Dai, Guo, Du, Hu and Cao. This is an open-access article distributed under the terms of the Creative Commons Attribution License (CC BY). The use, distribution or reproduction in other forums is permitted, provided the original author(s) and the copyright owner(s) are credited and that the original publication in this journal is cited, in accordance with accepted academic practice. No use, distribution or reproduction is permitted which does not comply with these terms.
*Correspondence: Licong Dai, bGljb25nZGFpMTk5M0AxNjMuY29t; Xiaowei Guo, eHdndW8xMjA2QDE2My5jb20=
Disclaimer: All claims expressed in this article are solely those of the authors and do not necessarily represent those of their affiliated organizations, or those of the publisher, the editors and the reviewers. Any product that may be evaluated in this article or claim that may be made by its manufacturer is not guaranteed or endorsed by the publisher.
Research integrity at Frontiers
Learn more about the work of our research integrity team to safeguard the quality of each article we publish.