 Tiantian Jin
 Jie Gong
- Key Laboratory of Western China’s Environmental Systems (Ministry of Education), College of Earth and Environmental Sciences, Lanzhou University, Lanzhou, China
Scientists have paid attention to assessing the change in ecosystem service risk under human activities, yet few works have focused on the water yield risk induced by land-use and climate change. In this study, a framework combining water yield with ecological risk for service enhancement and human adaptation was established. The framework was applied to explore the spatiotemporal variation in water yield service and its ecological risk via land-use and climate change scenarios in the Ziwuling Mountainous Region (ZMR), China, using InVEST, CA–Markov, and TOPSIS models. The water yield service decreased from 69.19 mm in 1990 to 47.72 mm in 2017 in the ZMR. The water yield service in the southeast ZMR was larger than that in the northwest. The water yield service risk was high and increased first, then decreased from 1990 to 2017 in the ZMR. The high-risk and higher risk subareas were distributed in the middle and north of the ZMR. The water yield service is the highest under the EC126 scenario (48.09 mm in 2050 and 43.73 mm in 2100) and the lowest under the EP585 scenario (43.52 mm in 2050 and 40.62 mm in 2100). The water yield service risk of the EP558 scenario is the largest one, with an area ratio of the high risk of 83.95% in 2050 and 85.33% in 2100. We suggest developing water-saving agriculture and high-efficiency industrial systems, as well as ecological restoration and integrated forest social–ecological management for risk alleviation, service enhancement, and sustainable development.
1 Introduction
Global climate change, population explosion, and the unreasonable use of natural resources have caused intense pressure and risks to the self-regulation and restoration ability of the ecosystem, which will eventually lead to the loss and degradation of ecosystem services (ESs) (Zhou and Zhao, 2013; Li et al., 2019; Gacheno and Amare, 2021). Managing and avoiding ecological risks is an essential prerequisite for achieving harmonious development between humankind and nature (Chen F. et al., 2019). Ecosystem service and ecological risk assessment have become the focus of global environmental change and sustainable development (Chen T. et al., 2019; Leal Filho et al., 2021). It is helpful to ensure regional sustainable development by evaluating ecological risk scientifically and formulating management policy to protect/restore the environmental system.
Ecosystem services (ESs) are the natural conditions and functions on which the formation of the ecosystem and ecological process, and the maintenance of human survival depend (Millennium Ecosystem Assessment, 2005; Costanza et al., 2014). As a vital component of ESs, water yield service plays an essential role in maintaining ecosystem stability and human well-being to achieve the sustainable development goals (SDGs) by the United Nations (e.g., SDG6: Clean Water and Sanitation, SDG 15: Life on Land) (UN, 2015; Bai et al., 2019; Wang et al., 2019; Dai and Wang, 2020). On the one hand, water yield service directly affects human well-being by providing adequate water for production and living and plays a key role in its entertainment and esthetic values (Sánchez-Canales et al., 2012). On the other hand, the water yield service can indirectly affect the welfare of human beings and the SDGs through the trade-off and synergistic relationship with other services (UN, 2015; Ajaz et al., 2017). It is of great significance to explore the spatiotemporal change of water yield services and its influencing factors for rational water resource use and sustainable development of the ecosystem. The methods widely used for water yield service evaluation include the InVEST (Integrated Valuation of Ecosystem Services and Trade-offs Tools) model, the SCS (Soil Conservation Service) model, and the SWAT (Soil and Water Assessment Tool) model (Lv et al., 2015; Yang et al., 2020). All these methods have their own advantages and disadvantages. For example, the SCS model has a simple structure, requires fewer parameters, and takes a long time to apply (Liu et al., 2010; Zhang et al., 2021). However, it has only one parameter and does not consider the time variable, and the model accuracy is greatly affected by time variation. The SWAT model has great computing capability and can simulate continuously and efficiently (Choudhary and Athira, 2021). Still, it has high requirements on input parameters and has great uncertainty of parameters, and it is difficult to obtain long time-series data with low accuracy (Choudhary and Athira, 2021; Aragaw and Mishra, 2022). The InVEST model was widely used due to its advantages of few parameters needed, low data required, and a wide application range (Redhead et al., 2016; Yang et al., 2020). Moreover, the input and output data are spatial raster forms, which can show the spatial visualization of ESs (Liu Y. X. et al., 2021). Furthermore, the results are precise and can directly serve for natural resource protection and ecological management. For example, Guerry et al. (2012) found that the InVEST model is a useful tool to assess (i.e., map, model, and value) multiple services provided by marine ecosystems. Benra et al. (2021) found that the InVEST Seasonal Water Yield Model (SWYM) performed well on the annual scale rather than the monthly scale in southern Chile with a potential for water ES assessments. Terrado et al. (2014) found that the InVEST model could provide a more general picture of ESs with easy accessibility to nonexperts and in a spatially explicit manner in a humanized Lobregat River basin in NE Spain. Ding et al. (2022) found that the InVEST model worked well on water yield evaluation in the Qinghai Lake Basin, China, with the simulation results close to the real situation. Dai and Wang (2020) and Wang et al. (2020) simulated the spatial distribution of water yield via the InVEST model and conducted quantitative attribution analysis for various geomorphologic and climatic zones in the Hengduan Mountain Region via the geodetector method. All these studies showed that the InVEST model was an easy and a spatially explicit tool with high reliability in evaluating water yield and spatial heterogeneity (Sharp et al., 2020).
Ecological risk assessment evaluates the possibility of adverse environmental effects that may occur or are occurring of the exposed risk receptors (Liu et al., 2020). Previous ecological risk assessment was mostly explored via the ecological entity characteristics, such as point source threat and regional landscape pattern change, and ignored the factors related to human well-being (Chen F. et al., 2019). Moreover, the ecological risk assessment combined with ESs mostly focuses on theoretical analysis and conceptual models. There are few studies that documented the ecological risk change via ES evaluation, mainly due to the lack of risk characterization methods based on ESs. More and more studies have begun to integrate ESs into ecological risk evaluation and build an ecological risk assessment framework based on ESs, which has become one of the research hotspots (Gong et al., 2021; Qian et al., 2022).
Some studies have shown that water yield service is affected by climate change and land-use/cover change (LUCC) (Pan et al., 2013; Sun et al., 2015; Xu et al., 2015, Xu X et al., 2016; Mo et al., 2021; Pei et al., 2022). Climate change can affect water yield service by changing the precipitation and evapotranspiration (i.e., solar radiation, temperature, and precipitation) (Legesse et al., 2003; Pei et al., 2022). LUCC will influence the watershed water cycle, affect the evapotranspiration, infiltration process, and water-holding capacity, then impact the water yield service (Zhao et al., 2019; Ge et al., 2020; Sharp et al., 2020). The impacts of climate change and land use on the future water yield service can be simulated via scenario analysis of the ecological risks on the potential water yield to put forward targeted management and control suggestions for regional sustainable development. Currently, various methods are applied to simulate trends of growth and changes in the LUCC (Ghosh et al., 2017). Several studies have used traditional models, such as cellular automaton (CA) models and logistic regressions (Xu J. et al., 2016) to simulate and predict future changes. Other studies apply integrated models such as CA–Markov models (de Freitas et al., 2018) to obtain precise and realistic results. Due to the advantage of the integration of the geospatial and remote sensing data, and biophysical and socioeconomic data for the accurate simulation (Weng, 2002; Cunha et al., 2020), the CA–Markov model is widely used to simulate land-use changes (Hyandye and Martz, 2017; Maviza and Ahmed, 2020), including Zaria in Nigeria (Koko et al., 2020), Baiyangdian Basin (Gao et al., 2021) and the Gaborone Dam Catchment (Matlhodi et al., 2021), Hainan Island (Liu Q. et al., 2021), the Majang Forest Biosphere Reserves of Gambella, Southwestern Ethiopia (Tadese et al., 2021), and southwestern Iran (Marzieh et al., 2021). However, studies on LUCC prediction and impacts on water yield service in the Chinese Loess Plateau are still scarce and constrain its management application for water yield and human activities.
The Chinese Loess Plateau (CLP), a critical fragile ecological area with many environmental issues, has attracted much attention of scientists and governors. With the combined impacts of climate change and human socioeconomic activities, some environmental issues increasingly occurred in the CLP. For example, Zhang et al. (2022) found that the overall ecological vulnerability was moderate to high in the CLP from 2000 to 2015, and their area accounted for more than 60%. Fu et al. (2017) reported that some local soil erosion had been successfully controlled in the CLP, but the regional ecosystem remains fragile. Ensuring its water ecological security is of great significance for the sustainable development of the CLP. The Ziwuling Mountainous Region (ZMR), the only entirely preserved natural secondary forestry located in the hinterland of the CLP (Li et al., 2011), plays an essential role in soil retention, water conservation, and climate regulation. Meanwhile, intensive human activities and the fast recovery of forests and grassland have changed the local social–ecological systems in the last decades. However, there are still a few studies on the ecological risk of water yield service in the CLP. More efforts are needed to face these challenges and to pay for the harmonious development of humans and nature.
The main objective of this study was to propose and test a methodological framework for assessing the water yield service risk via scenario analysis of land-use and climate change. The spatial–temporal change in water yield and ecological risk and the potential trends were comprehensively analyzed using the ZMR in the CLP as an example. Specifically, we aimed to: 1) develop an ecological risk assessment framework by integrating water yield service, and land-use and climate change; 2) discern the spatial pattern and temporal change in water yield service, as well as the ecological risk; 3) simulate the potential change in the water yield service risk via land-use and climate change scenarios; and 4) put forward management suggestion for water yield service and human adaption to climate change.
2 Method and Study Area
2.1 Research Flowchart and Its Brief Introduction
Figure 1 shows the research flowchart of the method used in this study. Based on the land-use map, meteorological data, digital elevation model (DEM), and geographic vector data, the InVEST model is applied to evaluate water yield services in the ZMR. Then, the TOPSIS model is used to assess the ecological risks of water yield in the ZMR. The CA–Markov model was used here to set different land-use and climate scenarios, to compare the selected climate model data with the CMIP6 scenario model to predict the water yield services and its risk under different climate and land-use scenarios in the ZMR. Finally, we put forward some management suggestions to alleviate the water yield service risk in the future (Figure 1). Based on the CA–Markov module of the IDRISI Selva 17 software, this study set three different development scenarios of natural development, ecological protection, and economic construction to simulate the future land-use change. At the same time, this study applied two extreme climate scenarios, the high forcing unsustainable scenario (SSP5-8.5) and the sustainable low forcing scenario (SSP1-2.6), to obtain the possible climate change range. Finally, we predict the water yield service and their risk under different climate and land-use scenarios in the future and put forward some suggestions for water yield service risk control and management (Figure 1).
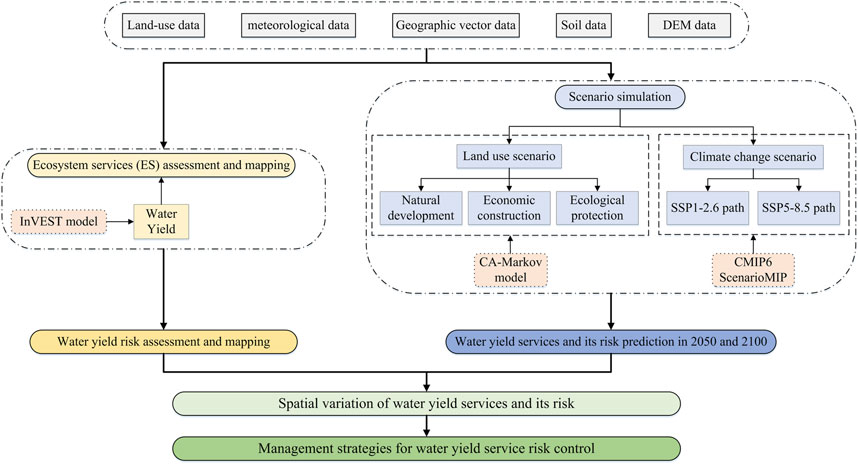
FIGURE 1. Research flowchart.
2.2 Research Area
The Ziwuling Mountainous Region (ZMR) (34°40′–37°25′N, 107°30′–110°20′E) is referred to the Ziwuling National Nature Reserve and its surrounding areas in this study (Figure 2). The ZMR is located in the hinterland of the CLP (Figure 2), including 16 counties/districts, such as Huachi, Heshui, Ningxian, Zhengning, Wuqi, Zhidan, Ansai, Baota, Ganquan, Fuxian, Huangling, Yijun, Wangyi, Yintai, Yaozhou, and Xunyi. The ZMR belongs to a temperate continental monsoon climate with an elevation of 534–1,856 m. The annual average temperature is about 7.4°C, and the average yearly precipitation is 587 mm. The rainfall mainly occurred from July to September, and the intensive rainstorm events often lead to water and soil loss disasters.
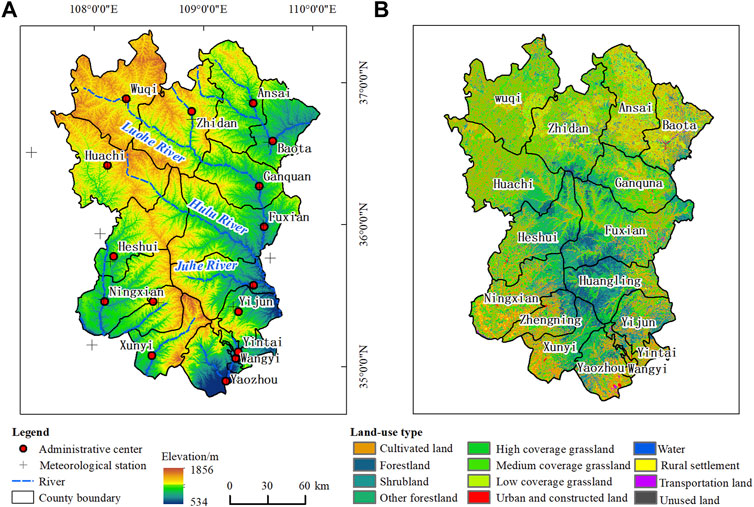
FIGURE 2. Location of the Ziwuling Mountainous Region (ZMR) (A) and land-use map in 2017 (B).
The ZMR has a long history of human activities. Since the Ming and Qing Dynasties, the vegetation has undergone a succession of destruction, restoration, destruction, and restoration cycle. The region is rich in natural resources (such as coal, oil, and gas) and cultural tourism, with great efforts in mining and development. Meanwhile, the population and economic density keep growing, with the expansion of urban and transportation construction land. Although economic growth was promoted, it also resulted in natural disturbance and environmental pressure. As the only entirely preserved natural secondary forest in the CLP (Li et al., 2011), the forest in the ZMR plays a vital role in water conservation, climate regulation, and biodiversity (Sun, 2018). Therefore, ensuring ecological security in the ZMR is of great significance to maintaining the sustainable development of the CLP.
2.3 Data Resource and Data Processing
The land-use maps of 1990, 2000, 2010, and 2017 with a 30-m spatial resolution were downloaded from the Chinese Academy of Sciences (https://www.resdc.cn/). Land-use types included farmland, forestland, grassland, water, constructed land, and unused land according to the “Chinese Classification Criteria of Current Land Use” (GB/T21010-2017). The overall accuracies in 1990, 2000, 2010, and 2017 were all greater than 88%, which is acceptable for land-use change analysis. The digital elevation model (DEM) data with a spatial resolution of 30 m were obtained from the Geospatial Data Cloud platform (http://www.gscloud.cn/), which was used to extract the vector boundary of watershed and subwatershed and obtain topographic factors. The data of meteorological stations were obtained from the China Meteorological Data Service Center (http://data.cma.cn/) and the Chinese Academy of Sciences (https://www.resdc.cn/). To avoid the impact of extreme meteorological events on the study results, the annual average values of meteorological data from 1981 to 1990, 1991 to2000, 2001 to 2010, and 2011 to 2017 were calculated, respectively. The Anuspline, one of the professional meteorological interpolation software, was used for spatial interpolation. The processed meteorological data were used to estimate rainfall erosivity factors and evapotranspiration potential. Solar radiation data were obtained from the global meteorological database (https://worldclim.org/data/). The data are monthly grid data with a resolution of 1 km. After downscaling and averaging, the annual-scale data with a 30-m resolution were obtained to calculate the evapotranspiration potential. Soil data were obtained from the Soil Information System of China (http://www.issas.ac.cn/kxcb/zgtrxxxt/) to estimate soil erodibility factor, soil depth, and maximum root restriction depth. The data of the Scenario Model Intercomparison Project (ScenarioMIP) in Coupled Model Intercomparison Project Phase 6 (CMIP6) were obtained from the website of the Earth System Grid Federation (ESGF) (https://esgf-node.llnl.gov/projects/esgf-llnl/). The prediction data were obtained from the National Climate Center (Beijing Climate Center Climate System Model version 1, BCC-CSM2-MR). More details on the data can be found in Section 2.5.3.
2.4 Main Methods
2.4.1 Water Yield Service
The water yield service was calculated via the InVEST module. The module integrates relevant parameters such as soil depth, soil permeability, and root depth in the calculation process and modifies them locally based on Budykoʼs hydrothermal coupling balance principle (Wu et al., 2017). The InVEST model has been widely used in water yield service studies of different scales and regions due to its minor limitations on data acquisition and strong visibility of results (Dai and Wang, 2020; Li et al., 2020; Liu J. et al., 2021; Yang et al., 2020). The calculation formulations are as follows:
where Yx, AETx, and Px are the annual water yield (mm), actual annual evapotranspiration (mm), and annual precipitation (mm) at pixel x, respectively. Rx, Kx, and ET0 are the dryness index, vegetation evapotranspiration coefficient, and evapotranspiration potential at pixel x, respectively. ωx is a linear function (dimensionless) affected by the precipitation and soil properties. Z is the seasonal constant, which is 4 in this study. AWCx is the available volumetric water content (mm) of plants, Max Soil Depthx, Root Depthx, and PAWCx are the maximum depth of soil, the maximum root depth of vegetation-covered land, and the available volumetric water content of the plants, respectively.
2.4.2 Ecological Risk Assessment Based on Ecosystem Services
The TOPSIS model (Technique for Order Preference by Similarity to an Ideal Solution) is a nonlinear evaluation method, and its evaluation value can reflect the advantages and disadvantages of the evaluation object (Yu et al., 2020). The TOPSIS model can effectively use the original data and accurately reflect the gap between the evaluated objects. As there are no special requirements for the data distribution, indicators, and sample number of evaluation indicators, the TOPSIS model is flexible and widely used, for example, in urban land resource evaluation, regional water resource assessment, and cost scheme decision-making (Dehdasht et al., 2020).
Based on the TOPSIS model, this study constructed an ecological risk assessment model based on ESs in the ZMR. The basic principles are as follows: Firstly, the sample units with the maximum and minimum ESs at grids or polygons in a certain space were selected as the positive ideal sample points and negative ideal sample points, respectively. The ES value at the positive ideal sample points was considered as the risk threshold. The Euclidean distance of the positive and negative sample points was used to represent the maximum loss of regional ESs. Then, the ecological risk index was calculated, which is the ratio between the Euclidean distance of the positive ideal sample point and the maximum loss of ESs at each unit in space. More details on the ecological risk assessment are shown below.
(1) Normalization of the ecosystem services: The maximum and minimum normalization method was used to linearly transform the original values of various ESs to eliminate the impact of data dimension and magnitude on the data.
where rij is the normalized value of j ecosystem service at pixel i, ESij is the value of j ecosystem service at pixel i, and ESmax j and ESmin j are the maximum and the minimum pixels of j ecosystem service.
(2) Identification of the positive ideal sample points and negative ideal sample points:
where y+ is the set of positive ideal samples, which are the sample units with the normalized maximum value of various ESs; y- is the set of negative ideal samples, which are the sample units with the normalized minimum value of various ESs; and rmax j and rmin j are the normalized maximum value and the normalized minimum value of j ES in the study area.
(3) Calculation of the degree of ecosystem service loss:
where Si+ is the Euclidean distance between pixel i and the positive ideal sample, and the larger its value, the larger the ecological risk; and S+max is the Euclidean distance between the positive ideal sample and the negative ideal sample, indicating the loss of ESs in a certain area.
(4) Calculation of ecological risk index:
where ESRi is the comprehensive ecological risk index at pixel i, and its value is between 0 and 1. The value 1 represents the maximum relative loss of ESs and the highest ecological risk, and the value 0 represents the minimum relative loss of ESs and the lowest ecological risk.
(5) Ecological risk grade classification: Considering the fairness of the ecological risk time-series analysis process and the consistency of risk classification standards, the equal interval classification method was applied to classify the ecological risk in different periods. The ecological risk in the study area was divided into five levels: the low risk (0–0.2), lower risk (0.2–0.4), medium risk (0.4–0.6), higher risk (0.6–0.8), and high risk (0.8–1).
2.5 Scenario Simulation of the Land-Use and Climate Change
The CA–Markov model and Scenario Model Intercomparison Project (ScenarioMIP) were used to set different scenarios on climate and land-use change to predict the ecological risk of the ZMR in 2050 and 2100, respectively.
2.5.1 Land-Use Scenario Simulation Based on the CA–Markov Model
Based on the CA–Markov module of the IDRISI Selva 17 software, this study set three different scenarios of natural development, ecological protection, and economic development (Table 1) to simulate future land-use change. A brief introduction of the three scenarios on land-use simulation is shown in Table 1.
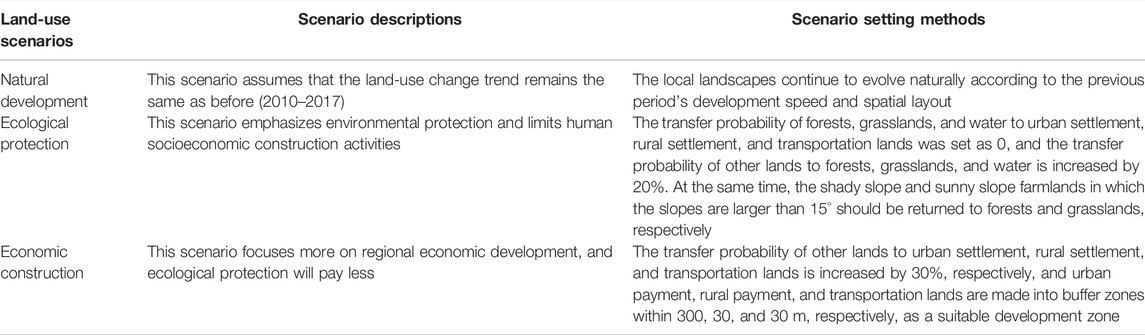
TABLE 1. Brief introduction of the three scenarios on land-use simulation.
2.5.2 Accuracy Test of Land-Use Simulation Results
The simulated and the actual land-use maps in the study area were cross-checked, and the accuracy of the simulation results was obtained. Using the CROSSTAB tool under IDRISI Selva 17 software in GIS analysis, the simulated land-use raster map and the actual land-use map in 2017 were input to test and calculate the kappa coefficients and the overall kappa of the land-use types, respectively. The kappa value is calculated using the following formula:
where n is the total number of land-use pixels, n1 is the number of correct pixels for the simulation, N is the number of all land-use types, Po is the proportion of correct pixels for the simulation, Pc is the proportion of pixels expected to be simulated correctly, and Pp is the proportion of correct pixels for the simulation under the ideal conditions. The kappa coefficient of all land-use types was greater than 0.5, and the overall simulation accuracy was high, with a Kappa coefficient of 0.937.
2.5.3 Climate Scenario Simulation Based on the CMIP6
Based on the climate model data of the Scenario Model Intercomparison Project (ScenarioMIP) in the Coupled Model Intercomparison Project Phase 6 (CMIP6), this study simulated and forecasted the future climate in the ZMR. The climate prediction scenario of the ScenarioMIP is a rectangular combination of different SSPs and the radiative forcing (representative concentration pathway, RCP) (Zhang et al., 2019). SSPs (the shared social–economic pathways) described the possible development of society in the future without the impact of climate change or climate policies, including SSP1, SSP2, SSP3, SSP4, and SSP5, which represented five different paths of sustainable development, moderate development, local development, unbalanced development, and conventional development, respectively (Fujimori et al., 2014; Weng et al., 2020). In CMIP5, there were four emission scenarios, including the RCP2.6, RCP4.5, RCP6.0, and RCP8.5. It meant that the radiation forcing would be stable at about 2.6 W/m2, 4.5W/m2, 6.0 W/m2, and 8.5 W/m2, respectively, by 2100. On this basis, the CMIP6 added three new RCPs, including RCP7.0, RCP3.4, and RCPs below 2.6 to fill the gap between CMIP5 RCPs. A new climate prediction scenario based on the integrated assessment model (IAM) (Chen, 2021), the SSP1-2.6 updated RCP2.6 scenario, shows the combined effects of the low radiation forcing, low vulnerability, and low mitigation pressure. This scenario predicted that by 2100, the multimode average value of global warming would be significantly lower than 2°C. By analogy, SSP2-4.5, SSP3-7.0, and SSP5-8.5, respectively, represented medium, medium to high, and high levels of development, with medium, higher, and high levels of radiation forcing and vulnerability.
In this study, two extreme climate scenarios, the high forcing unsustainable scenario (SSP5-8.5) and the sustainable low forcing scenario (SSP1-2.6), were used to obtain the possible climate change range in the ZMR, to clarify the possible impact range of climate change on ESs.
The panoply software provided by NASAʼs official website (http://www.giss.nasa.gov/tools/panoply) was to read file metadata information and was run in the MATLAB software to decompress and read the NC file. Finally, we obtained the required meteorological data through a series of grid calculations and correlation analysis in the ArcGIS software. As the resolution of the obtained data is only 100 km, referring to relevant studies (Martinez-Harms et al., 2017; Lv, 2019), the change values of various climate elements in the study area from 2017 to 2050 and 2017 to 2100 under the high forcing unsustainable scenarios (SSP5-8.5) and sustainable low forcing scenarios (SSP1-2.6) were calculated, respectively. Then, based on the actual meteorological data of the ZMR in 2017, the change values of climate elements in the ZMR in 2050 and 2100 were obtained (Table 2).
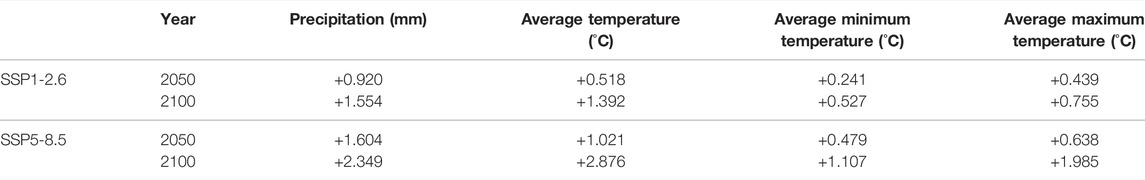
TABLE 2. Change values of climate elements in the ZMR under SSP1-2.6 and SSP5-8.5 scenarios in 2050 and 2100.
2.5.4 Land-Use and Climate Scenario Setting
Based on the CA–Markov module of the IDRISI selva17 software, this study set three scenarios of natural development, ecological protection, and economic construction to simulate the future land-use change in the ZMR. Six development scenarios were generated based on three land-use change scenarios and the two climate paths SSP1-2.6 and SSP5-8.5 of the CMIP6 ScenarioMIP to assess the ecological risks in the ZMR under different scenarios (Table 3).
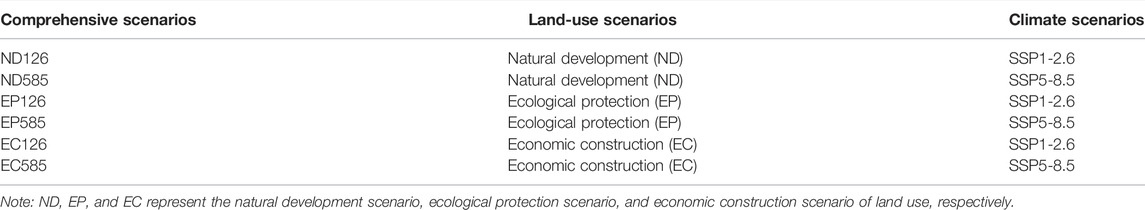
TABLE 3. Land-use and climate scenario settings.
3 Results
3.1 Spatiotemporal Variation in Water Yield Service in the ZMR From 1990 to 2017
The water yield service in the ZMR decreased from 1990 to 2017 (Figure 3), with an average annual rate of -0.79 mm. Water yield service in the ZMR was 69.19 mm in 1990, the highest one in the study period, mainly affected by precipitation and evapotranspiration potential. The average rainfall was high (562.85 mm), and the evapotranspiration potential was the lowest (828.04 mm) in 1990. Water yield service in the ZMR was 19.98, 31.32, and 47.72 mm in 2000, 2010, and 2017, showing an increasing trend. The precipitation in 2000 was the lowest (502.34 mm), and the evapotranspiration potential was the highest (1016.25 mm), and the actual water yield service decreased in 2000. Then, the water yield service increased after 2000.
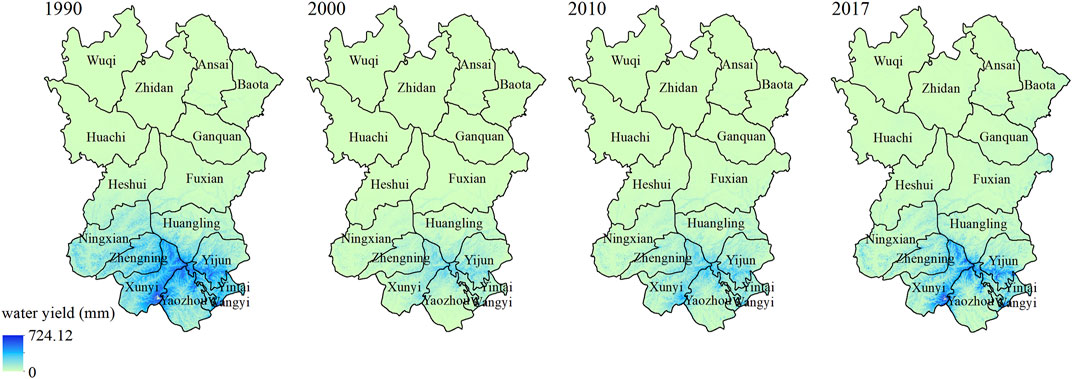
FIGURE 3. Spatiotemporal variation in water yield service in the ZMR from 1990 to 2017.
The water yield service in the southeast ZMR was larger than that in the northwest. The subareas with high value were mainly located in the southeast ZMR, especially in Huangling, Yijun, Yintai, Wangyi, Yaozhou, Xunyi, and Zhengning, with more precipitation, lower evapotranspiration, more water surplus, and higher water yield service. The subareas with low value were mainly located in the northwest ZMR, especially in Wuqi, Zhidan, Ansai, and Huachi (Figure 3), with a drier climate, greater evaporation, and less water yield service.
3.2 Spatiotemporal Variation in the Water Yield Service Risk in the ZMR From 1990 to 2017
The risk level of water yield service in the ZMR first increased and then decreased from 1990 to 2017, mainly belonging to the high-risk level (Figure 4). The areal ratio of the high-risk subareas in the ZMR was the largest one in 1990, 2000, 2010, and 2017, accounting for 72.70%, 86.65%, 83.06%, and 83.01%, respectively (Figure 4). The areal ratio of the low-risk subareas was the smallest one (Figure 4), accounting for 2.36%, 0.27%, 0.41%, and 0.83%, respectively. The areal ratios of the lower, medium, and higher risk subareas of water yield service in the ZMR were 5.20%, 10.42%, and 9.32% in 1990. Compared with 1990, the areal ratios of the lower, medium, and higher risk subareas of water yield service in the ZMR decreased in 2000, increased in 2010, and then increased in 2017.
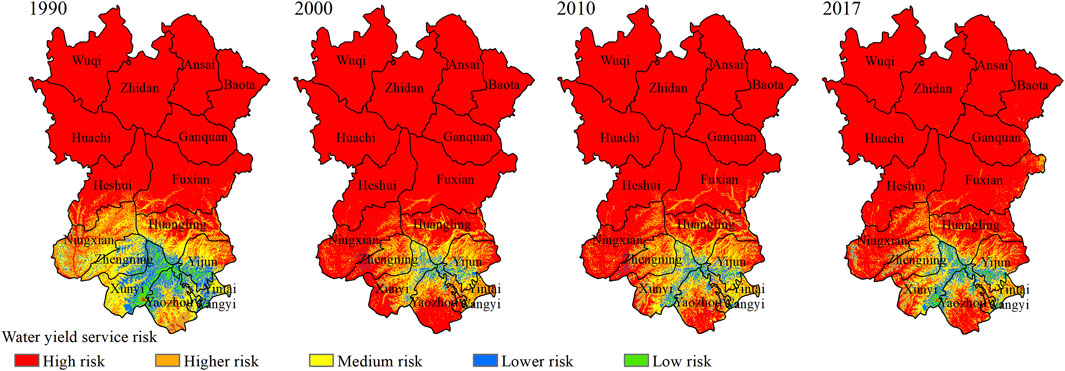
FIGURE 4. Spatiotemporal variation in the water yield service risk in the ZMR from 1990 to 2017.
The spatial distribution pattern of water yield service risk in the ZMR was found to have no apparent changes during the study period (Figure 4). However, the subareas with high and higher risk were mainly concentrated in the middle and north ZMR, especially in Wuqi, Zhidan, Ansai, Baota, Huachi, Ganquan, Heshui, and Fuxian. The spatial distribution of the subareas of the lower and low risk was mainly located in the southern ZMR, such as Huangling, Xunyi, Yaozhou, Yintai, and Yijun. The subareas of high risk of water yield service were expanded to the south ZMR, and the subareas of low risk continued to decrease from 1990 to 2017.
3.3 Scenario Simulations of the Water Yield Service Risk Based on Land-Use and Climate Change
3.3.1 Spatial Variation in Water Yield Service in the ZMR Under Different Scenarios in 2050 and 2100
There are apparent differences in water yield service in the ZMR under different land-use and climate scenarios (Figure 5). The water yield service in 2100 under different land-use and climate scenarios is lower than in 2050, with a similar overall pattern (Figure 5). Under the SSP1-2.6 climate scenario, the water yield service in the ZMR was 48.09 mm, 47.31 mm, and 46.46 mm under economic construction (EC), natural development (ND), and ecological protection (EP) land-use scenarios in 2050, respectively (Figures 5A–C), and it was 43.73 mm, 42.86 mm, and 41.91 mm under EC, ND, and EP, in 2100, respectively (Figures 5G–I). Under the SSP5-8.5 climate scenario, the water yield service in the ZMR was 45.11 mm (EC), 44.36 mm (ND), and 43.52 mm (EP) in 2050 (Figures 5D–F), and it was 42.41 mm (EC), 41.57 mm (ND), and 40.62 mm (EP) in 2100 (Figures 5J–L). In conclusion, the variation pattern of water yield service under different climate scenarios is the EP scenario > the ND scenario > the EC scenario. The water yield service is the highest one of the EC126 (48.09 mm in 2050 and 43.73 mm in 2100) and the lowest of the EP585 (43.52 mm in 2050 and 40.62 mm in 2100). Under the same land-use scenario, the water yield service of the SSP1-2.6 climate scenario is higher than that of SSP5-8.5.
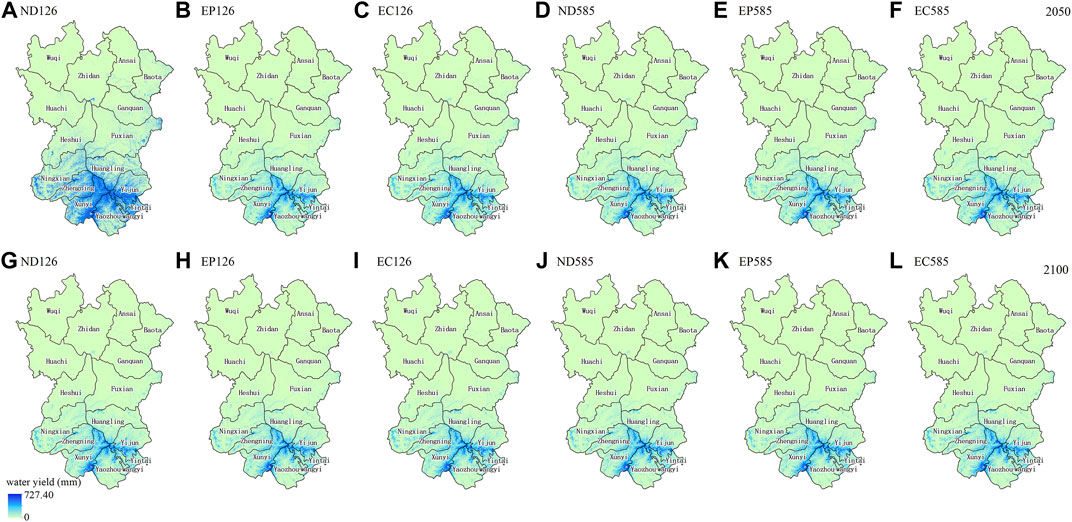
FIGURE 5. Spatial variation in water yield service in the ZMR under different scenarios in 2050 (A–F) and 2100 (G–L). Note: ND-the natural development scenario of land use, EP-the ecological protection scenario of land use, EC-the economic construction scenario of land use, 126-climate paths SSP1-2.6, 585-climate paths SSP5-8.5.
The spatial distribution pattern of water yield service under different scenarios decreases from the southeast to the northwest in the ZMR in 2050 and 2100 (Figure 5). The water yield service in the ZMR is generally low except for a small part of the ZMR, with apparent spatial distribution differences. The subareas with a high value are mainly located in the southeast of the ZMR, such as Huangling, Yijun, Yintai, Wangyi, Yaozhou, Xunyi, and Zhengning. The subareas with a low value are mainly located in the northwest of the ZMR, such as Wuqi, Zhidan, Ansai, and Huachi (Figure 5).
3.3.2 Spatial Variation in Water Yield Service Risk in the ZMR Under Different Scenarios in 2050 and 2100
The water yield service risk in the ZMR in 2100 is larger than in 2050. Under the SSP1-2.6 climate scenario in 2050 and 2100, the areal ratio of the high-risk subareas of water yield service in the ZMR accounts for 83% and 84%, respectively, followed by the higher and medium-risk, the lower risk, and low-risk subareas (Figure 6A–C, G–I). Under the EP scenario, the areal ratio of the high-risk and higher risk subareas is 90.86% and 91.73% of the ZMR, respectively (Figures 6B,H). Under the ND scenario, the areal ratio of the high-risk and higher risk subareas is 90.77% and 91.68%, respectively (Figures 6A,G). Under the EC scenario, the areal ratio of the high-risk and higher risk subareas is 90.57% and 91.49%, respectively (Figures 6C,I). On the contrary, the areal ratio of the low-risk and lower risk subareas is the largest one, 3.74% in 2050 and 3.10% in 2100 under the EC scenario, followed by the ND scenario (3.65% in 2050 and 3.04% in 2100) and the EP scenario (3.62% in 2050 and 3.03% in 2100).
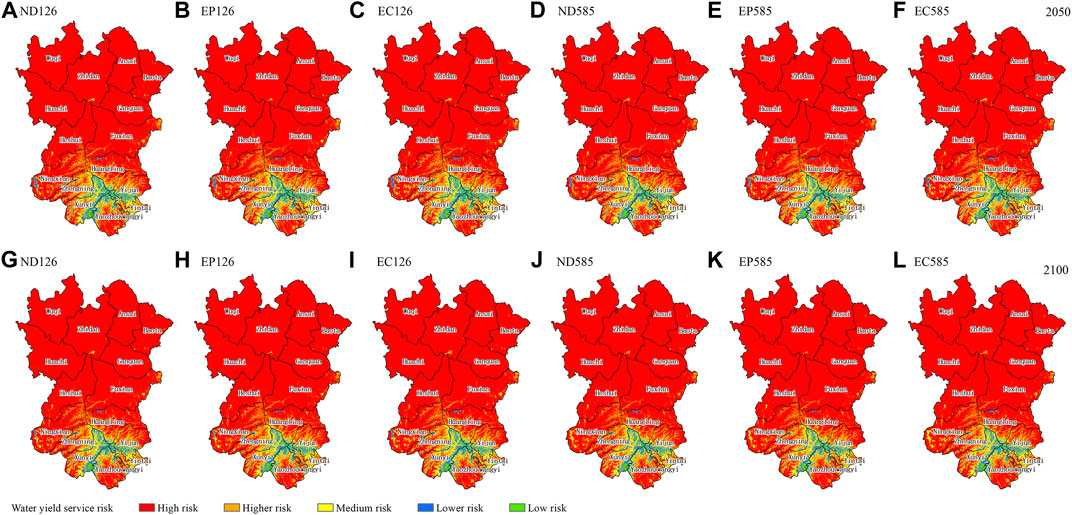
FIGURE 6. Spatial variation in the water yield service risk in the ZMR under different scenarios in 2050 (A–F) and 2100 (G–L). Note: ND-the natural development scenario of land use, EP-the ecological protection scenario of land use, EC-the economic construction scenario of land use, 126-climate paths SSP1-2.6, 585-climate paths SSP5-8.5.
The water yield service risk of the ZMR under the SSP5-8.5 climate scenario in 2050 and 2100 is slightly higher than that under the SSP1-2.6 climate scenario (Figure 6). Under the EP scenario, the areal ratio of high-risk and higher risk subareas is 91.48% and 92.04% of the ZMR, respectively (Figures 6E,K). Under the ND scenario, the areal ratio of high-risk and higher risk subareas is 91.39% and 91.99%, respectively (Figures 6D,J). Under the EC scenario, the water yield service risk is the lowest one, and the areal ratio of high-risk and higher risk subareas is 91.19% and 91.81%, respectively (Figure 6F,L). On the contrary, the areal ratio of the low-risk and lower risk subareas is the largest one (3.29% in 2050 and 2.92% in 2100) under the EC scenario, followed by the NP scenario (3.20% in 2050 and 2.88% in 2100) and the EP scenario (3.18% in 2050 and 2.87% in 2100).
The variation in the water yield service risk under the SSP5-8.5 and SSP1-2.6 climate scenarios is the same in 2050 and 2100, the EC scenario < the ND scenario < the EP scenario. The water yield service risk is the lowest of the EC126 scenario, the areal ratio of the high-risk subareas is the largest one (82.78% in 2050 and 84.22% in 2100), and the areal ratio of the low-risk and lower risk subareas is 3.74% and 3.10%, respectively. The water yield service risk is the largest of the EP558 scenario, the areal ratio of the high-risk subareas is the largest one (83.95% in 2050 and 85.33% in 2100), and the areal ratio of the low-risk and lower risk is 3.18% and 2.87%, respectively (Figure 6). The spatial distribution pattern of the water yield service risk in the ZMR is almost the same in 2050 and 2100 (Figure 6). The subareas with high-risk and higher risk are mainly located in the middle and north of the ZMR, such as Wuqi, Zhidan, Ansai, Baota, Huachi, Ganquan, Heshui, and Fuxian. The spatial distribution with the low-risk and lower risk subareas is mainly distributed in the intersection of Huangling, Xunyi, Yaozhou, Yintai, and Yijun in the south ZMR (Figure 6).
4 Discussion
4.1 Spatiotemporal Variation in Water Yield Service in the ZMR
This study found that the water yield service in the ZMR decreased from 1990 to 2017 with a water yield of 69.19, 19.98, 31.32, and 47.72 mm, in 1990, 2000, 2010, and 2017, respectively. The results are consistent with Zhuang (2020) findings on the Loess Plateau; for example, Zhuang (2020) found that the water yield service on the Loess Plateau in 1990, 2000, 2010, and 2015 was 122.41, 68.55, 87.59, and 95.85 mm, respectively, among which the water yield service in 1990 was the highest one. Meanwhile, water yield service is affected by climate change and land-use/cover change (Pan et al., 2013; Sun et al., 2015; Xu et al., 2015, Xu X et al., 2016; Mo et al., 2021; Pei et al., 2022). Climate change can affect water yield service by changing rainfall and evapotranspiration potential (Legesse et al., 2003; Pei et al., 2022). Co-affected by the precipitation and evapotranspiration potential, the average precipitation in the ZMR was high (562.85 mm), and the evapotranspiration potential was the lowest (828.04 mm) in 1990. The precipitation was the lowest (502.34 mm), the evapotranspiration potential was the highest (1016.25 mm), and the actual water yield service decreased in 2000. Moreover, Gao et al. (2016) found that increasing constructed land will increase water yield. Constructed land expansion often increases the area of impervious water surface, changes the water balance, reduces precipitation infiltration, increases runoff, and improves the regional water yield (Lang et al., 2017; Pei et al., 2022). Furthermore, Dou et al. (2019) found that the water yield of the constructed land and farmland is higher due to the impact of climate change and land-use/cover change, while the water yield of forests, shrubs, and grasslands is lower. The evapotranspiration of farmland is similar to that of forest and grassland, but the water infiltration is less than that of forests and grasslands, so the water yield in farmland is higher than that of forest and grassland. Forests and grasslands trap more surface runoff, increase soil infiltration and evapotranspiration, and control precipitation regulation, resulting in lower water yield (Pei et al., 2022). Thus, returning farmlands to forests and grasslands will reduce water yield service.
Our study found that the area of the building land, forest, and grassland in the ZMR increased by 181.84, 549.28, and 785.53 km2, respectively, while farmland decreased by 1520.32 km2 from 1990 to 2017. Meanwhile, the decrease in farmland area and the increase in forest and grassland caused the reduction in water yield service in the ZMR. The simulation of water yield service in the ZMR under different land-use and climate scenarios showed that under the SSP1-2.6 climate scenario in 2050 and 2100, the water yield service in the ZMR was 48.09 and 43.73 mm (EC), 47.31 and 42.86 mm (ND), and 46.46 and 41.91 mm (EP). Under the SSP5-8.5 climate scenario in 2050 and 2100, the water yield service in the ZMR was 45.11 and 42.41 mm (EC), 43.52 and 41.57 mm (ND), and 46.46 and 40.62 mm (EP). The variation pattern of water yield under different climate scenarios was consistent as the EC scenario > the ND scenario > the EP scenario. The water yield service was the highest under the EC126 scenario (48.09 mm in 2050 and 43.73 mm in 2100) and the lowest under the EP585 scenario (43.52 mm in 2050 and 40.62 mm in 2100). This may be due to the change in land-use types in the EP scenario; that is, compared with the ND scenario and EC scenario, the conversion probability of other lands into forests and grasslands has increased by 20%, which increases the evapotranspiration, and results in water yield service reduction in the ZMR.
4.2 Spatiotemporal Variation in the Water Yield Service Risk and Its Management Strategies for Ecological Risk Alleviation
Water yield risk in the ZMR increased first and then decreased from 1990 to 2017. The areal ratio of high-risk subareas in the ZMR was the largest. The simulation of different land-use and climate scenarios indicated that the risk of water yield service in the ZMR is higher in 2050 than that under the SSP1-2.6 climate scenarios in 2100, and they mainly belong to high-risk areas. The spatial distribution pattern of water yield service risk in the ZMR was found to have no apparent differences in 2050 and 2100. The high-risk and higher risk subareas were mainly distributed in the middle and north ZMR, especially in Wuqi, Zhidan, Ansai, Baota, Huachi, Ganquan, Heshui, and Fuxian, with oil and gas exploitation in the north ZMR. Therefore, the following methods on “open source” and “reduce expenditure” should be applied to reduce the water resource gap and develop a water-saving society in the ZMR: strengthen the protection of the water sources of the Ju River, Malian River, Silang River, Malan River, and Shichuan River in the ZMR, strictly prevent pollution and the excessive use of water sources, and prevent further degradation of water sources. Moreover, the following water-saving production methods and industrial modes are recommended to avoid unnecessary drainage and overflow to increase the recycling of the limited water resources: enhance and improve the construction of sewage treatment infrastructure. Regional environmental protection should strengthen the supervision and punishment of industrial sewage discharge and purification treatment, to promote the recycling of water resources; make reasonable planning to harvest water and regulate flood, to achieve the storage and backflow of rainwater to reduce evaporation loss, and to develop modern and high-efficient agriculture; optimize the planting structure and selection of the water-saving crops of wheat, corn, millet, beans, and buckwheat, to adopt water-saving irrigation methods such drip, sprinkler, and under-film irrigation for high water efficiency in agricultural production; carry out environmental education consistently to enhance residents’ awareness of water conservation and ecological protection. Only if these suggestions and management strategies have been well implemented, the risk of water yield would decrease and the ecological quality and ecosystem service would be enhanced and improved for the human well-being and sustainable development in the Chinese Loess Plateau and other similar mountainous areas.
4.3 Limitations and Outlook
Our work would be of value for regional ES risk control and human governance, such as the analytical framework, method and data, scenario simulation, risk management, and human adaptation. However, although major progress in ecological risk assessment, water yield valuation, and technology has been made recently, ES risk mapping and forecast, especially by using the land-use change model (i.e., CA–Markov model) and climate change models (i.e., the Scenario Model Intercomparison Project, ScenarioMIP; and the Coupled Model Intercomparison Project Phase 6, CMIP6), are still facing significant challenges due to data quality, availability, completeness, and uniformity (Yan, 2021; Gong et al., 2022), especially for the poor and fragile areas that lack basic and monitoring data. These factors will result in some errors and uncertainty. Therefore, the methods need to be further modified as experience and applications increase (Yan, 2021; Gong et al., 2022). In addition, the InVEST model is widely used for service evaluation and mapping with the advantages of few parameters, low data requirements and spatial visualization (Redhead et al., 2016; Yang et al., 2020; Liu J. et al., 2021). The results are precise and focused, and they can directly serve the local natural resource protection and ecological management. However, there are great differences in natural systems such as the temperature and precipitation, as well as human activities, due to the large north–south span of the ZMR. The water yield service risk was based on the maximum loss threshold of ESs, which may enlarge the risk level of low-value subareas of water yield service. More efforts are needed to calibrate the model parameters (i.e., the InVEST, TOPSIS, CA–Markov, and the ScenarioMIP) based on the natural ecological and socioeconomic conditions to improve the assessment accuracy. Meanwhile, this study does not consider the trade-off or synergy between water production services and other ESs, which may improve or reduce the risk level of this service. In future research, more efforts are suggested to analyze a variety of ESs and comprehensively evaluate the ecological risk level of the study area.
5 Conclusions
Ecological risk assessment and management are of great significance for human well-being and sustainable development. In this study, we established a framework combining water yield with ecological risk for service enhancement and human adaptation. The spatiotemporal variation in water yield service and its ecological risk was explored via land-use and climate change simulations using InVEST, CA–Markov, and TOPSIS models. The analytical framework can comprehensively evaluate water yield service risk of land-use planning and climate change scenarios on the complex forest social–ecological systems, and services for risk control and service improvement.
The water yield service in the ZMR decreased from 1990 to 2017, with an average annual rate of -0.79 mm. Water yield service in the ZMR was 69.19, 19.98, 31.32, and 47.72 mm in 1990, 2000, 2010, and 2017, respectively. Water yield service value was the highest in 1990 and the lowest in 2000, and it differed significantly between 1990 and 2000. Water yield service in the southeast ZMR was larger than that in the northwest. Water yield service risk increased first, then decreased from 1990 to 2017 in the ZMR, mainly belonging to a high ecological risk level. The subareas of high and higher risk were mainly concentrated in the middle and north ZMR.
There are differences in water yield service under different land-use and climate scenarios in the ZMR. The water yield service in 2100 under different land-use and climate scenarios is lower than in 2050. The water yield service is the highest of the EC126 (48.09 mm in 2050 and 43.73 mm in 2100) and the lowest of the EP585 (43.52 mm in 2050 and 40.62 mm in 2100). Under the same land-use scenario, the water yield service of the SSP1-2.6 climate scenario is higher than that of the SSP5-8.5 climate scenario. Under different scenarios, the water yield service will decrease from the southeast to the northwest, and the subareas of high water yield service were mainly located in the southeast of the ZMR in 2050 and 2100. The water yield service risk in the ZMR in 2100 is larger than in 2050. The variation pattern of water yield service risk under SSP5-8.5 and SSP1-2.6 in 2050 and 2100 is the EC scenario < the ND scenario < the EP scenario. The water yield service risk of the EC126 scenario is the lowest one, and the SP558 scenario is the largest one in 2050 and 2100. The subareas of the high and higher risk are mainly located in the middle and north ZMR in 2050 and 2100. Developing water-saving agriculture and high-efficiency industrial systems, as well as ecological restoration and integrated forest landscape management, will be helpful for risk control and service enhancement, especially in mountainous areas with fragile environments and limited water resources.
Data Availability Statement
The original contributions presented in the study are included in the article/Supplementary Material; further inquiries can be directed to the corresponding author.
Author Contributions
JG conceptualized the study, acquired funding, administered the project, supervised the study, wrote the original draft, and wrote, reviewed, and edited the manuscript. TJ conceptualized the study, designed the methodology and software, performed the data curation, investigated, supervised, and visualized the study, provided resources, wrote the original draft, and wrote, reviewed, and edited the manuscript. LY conceptualized the study, performed the data curation, investigated, validated, and supervised the study, designed the methodology and software, provided resources, and performed the formal analysis. SW designed the software, performed the formal analysis, provided resources, and validated and visualized the study.
Funding
This work was supported by the Major Program of the National Natural Science Foundation of China (grant numbers 4179420015).
Conflict of Interest
The authors declare that the research was conducted in the absence of any commercial or financial relationships that could be construed as a potential conflict of interest.
Publisher’s Note
All claims expressed in this article are solely those of the authors and do not necessarily represent those of their affiliated organizations, or those of the publisher, the editors, and the reviewers. Any product that may be evaluated in this article, or claim that may be made by its manufacturer, is not guaranteed or endorsed by the publisher.
References
Ajaz, M. A., Abd-Elrahman, A., Escobedo, F. J., Cropper, W. P., Martin, T. A., and Timilsina, N. (2017). Spatially-explicit Modeling of Multi-Scale Drivers of Aboveground Forest Biomass and Water Yield in Watersheds of the Southeastern United States. J. Environ. Manag. 199, 158–171. doi:10.1016/j.jenvman.2017.05.013
Aragaw, H. M., and Mishra, S. K. (2022). Multi-Site Multi-Objective Calibration of SWAT Model Using a Large Dataset for Improved Performance in Ethiopia. Arab. J. Geosci. 15 (4), 1–18. doi:10.1007/S12517-022-09602-5
Bai, Y., Ochuodho, T. O., and Yang, J. (2019). Impact of Land Use and Climate Change on Water-Related Ecosystem Services in Kentucky, USA, USA. Ecol. Indic. 102, 51–64. doi:10.1016/j.ecolind.2019.01.079
Benra, F., De Frutos, A., Gaglio, M., Álvarez-Garretón, C., Felipe-Lucia, M., and Bonn, A. (2021). Mapping Water Ecosystem Services: Evaluating InVEST Model Predictions in Data Scarce Regions. Environ. Model. Softw. 138, 104982. doi:10.1016/J.ENVSOFT.2021.104982
Chen, F., Li, H. B., and Zhang, A. L. (2019). Ecological Risk Assessment Based on Terrestrial Ecosystem Services in China. Acta Geogr. Sin. 74 (03), 432–445.
Chen, T., Bao, A. M., Guo, H., Zheng, G. X., Yuan, Y., and Yu, T. (2019). Ecological Vulnerability Assessment for a Transboundary Basin in Central Asia and its Spatiotemporal Characteristics Analysis: Taking Amu Darya River Basin as an Example. J. Nat. Resour. 34 (12), 2643–2657.
Chen, L. Q. (2021). Spatiotemporal Variations and its Impact of Drought in China Based on CMIP6 Multi Model. [dissertation/master’s Thesis]. [Nanjing]: Nanjing University of Information Science and Technology.
Choudhary, R., and Athira, P. (2021). Effect of Root Zone Soil Moisture on the SWAT Model Simulation of Surface and Subsurface Hydrological Fluxes. Environ. Earth Sci. 80, 1–16. doi:10.1007/S12665-021-09912-Z
Costanza, R., de Groot, R., Sutton, P., van der Ploeg, S., Anderson, S. J., Kubiszewski, I., et al. (2014). Changes in the Global Value of Ecosystem Services. Glob. Environ. Change 26, 152–158. doi:10.1016/j.gloenvcha.2014.04.002
Cunha, E. R. d., Santos, C. A. G., Silva, R. M. d., Bacani, V. M., and Pott, A. (2021). Future Scenarios Based on a CA-Markov Land Use and Land Cover Simulation Model for a Tropical Humid Basin in the Cerrado/Atlantic Forest Ecotone of Brazil. Land Use Policy 101, 105141. doi:10.1016/j.landusepol.2020.105141
Dai, E. F., and Wang, Y. H. (2020). Spatial Heterogeneity and Driving Mechanisms of Water Yield Service in Hengduan Mountain Region. Acta Geogr. Sin. 75 (03), 607–619.
de Freitas, M. W. D., Muñoz, P., dos Santos, J. R., and Alves, D. S. (2018). Land Use and Cover Change Modelling and Scenarios in the Upper Uruguay Basin (Brazil). Ecol. Model. 384, 128–144. doi:10.1016/j.ecolmodel.2018.06.009
Dehdasht, G., Ferwati, M. S., Zin, R. M., and Abidin, N. Z. (2020). A Hybrid Approach Using Entropy and TOPSIS to Select Key Drivers for a Successful and Sustainable Lean Construction Implementation. PLoS One 15 (2), e0228746. doi:10.1371/journal.pone.0228746
Ding, J. B., Zhang, F. P., Zhang, Y., Ning, Y. Y., and Zeng, P. R. (2022). Temporal and Spatial Variations in Water Yield of the Qinghai Lake Water System under Climate and Land Use Changes. J. Lanzhou Univ. Nat. Sci. 58 (01), 47–56. doi:10.13885/j.issn.0455-2059.2022.01.006
Dou, P. F., Zuo, S. Z., Ren, Y., Dai, S. Q., and Yun, G. L. (2019). The Impacts of Climate and Land Use/land Cover Changes on Water Yield Service in Ningbo Region. Acta Sci. Circumstantiae 39 (07), 2398–2409. doi:10.13671/j.hjkxxb.2019.0122
Fu, B., Wang, S., Liu, Y., Liu, J., Liang, W., and Miao, C. (2017). Hydrogeomorphic Ecosystem Responses to Natural and Anthropogenic Changes in the Loess Plateau of China. Annu. Rev. Earth Planet. Sci. 45 (01), 223–243. doi:10.1146/annurev-earth-063016-020552
Fujimori, S., Kainuma, M., Masui, T., Hasegawa, T., and Dai, H. (2014). The Effectiveness of Energy Service Demand Reduction: a Scenario Analysis of Global Climate Change Mitigation. Energy policy 75, 379–391. doi:10.1016/j.enpol.2014.09.015
Gacheno, D., and Amare, G. (2021). Review of Impact of Climate Change on Ecosystem Services-A Review. Ijfsa 5 (03), 363–369. doi:10.26855/IJFSA.2021.09.004
Gao, J., Li, F., Gao, H., Zhou, C. B., and Zhang, X. L. (2016). The Impact of Land-Use Changes on Water-Related Ecosystem Services: a Study of the Guishui River Basin, Beijing, China. J. Clean. Prod. 163, S148–S155. doi:10.1016/j.jclepro.2016.01.049
Gao, X., Yang, L. W. Q., Li, C. X., Song, Z. Y., and Wang, J. (2021). Land Use Change and Ecosystem Service Value Measurement in Baiyangdian Basin under Simulated Multiple Scenarios. Acta Ecol. Sin. 41 (20), 7974–7988. doi:10.5846/stxb202012243264
Ge, J., Pitman, A. J., Guo, W., Zan, B., and Fu, C. (2020). Impact of Revegetation of the Loess Plateau of China on the Regional Growing Season Water Balance. Hydrol. Earth Syst. Sci. 24 (02), 515–533. doi:10.5194/hess-24-515-2020
Ghosh, P., Mukhopadhyay, A., Chanda, A., Mondal, P., Akhand, A., Mukherjee, S., et al. (2017). Application of Cellular Automata and Markov-Chain Model in Geospatial Environmental Modeling- A Review. Remote Sens. Appl. Soc. Environ. 5, 64–77. doi:10.1016/j.rsase.2017.01.005
Gong, J., Cao, E., Xie, Y., Xu, C., Li, H., and Yan, L. (2021). Integrating Ecosystem Services and Landscape Ecological Risk into Adaptive Management: Insights from a Western Mountain-Basin Area, China. J. Environ. Manag. 281, 111817. doi:10.1016/j.jenvman.2020.111817
Gong, J., Jin, T., Liu, D., Zhu, Y., and Yan, L. (2022). Are Ecosystem Service Bundles Useful for Mountainous Landscape Function Zoning and Management? A Case Study of Bailongjiang Watershed in Western China. Ecol. Indic. 134, 108495. doi:10.1016/J.ECOLIND.2021.108495
Guerry, A. D., Ruckelshaus, M. H., Arkema, K. K., Bernhardt, J. R., Guannel, G., Kim, C.-K., et al. (2012). Modeling Benefits from Nature: Using Ecosystem Services to Inform Coastal and Marine Spatial Planning. Int. J. Biodivers. Sci. Ecosyst. Serv. Manag. 8, 107–121. doi:10.1080/21513732.2011.647835
Hyandye, C., and Martz, L. W. (2017). A Markovian and Cellular Automata Land-Use Change Predictive Model of the Usangu Catchment. Int. J. Remote. Sens. 38 (01), 64–81. doi:10.1080/01431161.2016.1259675
Koko, A. F., Yue, W., Abubakar, G. A., Hamed, R., and Alabsi, A. A. N. (2020). Monitoring and Predicting Spatio-Temporal Land Use/land Cover Changes in Zaria City, Nigeria, through an Integrated Cellular Automata and Markov Chain Model (CA-Markov). Sustainability 12 (24), 10452. doi:10.3390/su122410452
Lang, Y., Song, W., and Zhang, Y. (2017). Responses of the Water-Yield Ecosystem Service to Climate and Land Use Change in Sancha River Basin, China. Phys. Chem. Earth, Parts A/B/C 101, 102–111. doi:10.1016/j.pce.2017.06.003
Leal Filho, W., Azeiteiro, U. M., Balogun, A.-L., Setti, A. F. F., Mucova, S. A. R., Ayal, D., et al. (2021). The Influence of Ecosystems Services Depletion to Climate Change Adaptation Efforts in Africa. Sci. Total Environ. 779, 146414. doi:10.1016/J.SCITOTENV.2021.146414
Legesse, D., Vallet-Coulomb, C., and Gasse, F. (2003). Hydrological Response of a Catchment to Climate and Land Use Changes in Tropical Africa: Case Study South Central Ethiopia. J. Hydrol. 275 (1), 67–85. doi:10.1016/S0022-1694(03)00019-2
Li, L. B., Tu, C. L., Zhao, Z. Q., Cui, L. F., and Liu, W. H. (2011). Distribution Characteristics of Soil Organic Carbon and its Isotopic Composition for Soil Profiles of Loess Plateau under Different Vegetation Condition. S. Earth Environ. 39 (4), 441–449. doi:10.14050/j.cnki.1672-9250.2011.04.001
Li, Z., Jiang, W., Wang, W. J., Lv, J. X., and Deng, Y. (2019). Study on the Wetland Leading Service Function of Jing-Jin-Ji Urban Agglomeration Based on the Ecosystem Services Value. J. Nat. Resour. 34 (08), 1654–1665. doi:10.31497/zrzyxb.20190807
Li, Y. Y., Fan, J. H., and Liao, Y. (2020). Analysis of Spatial and Temporal Differences in Water Conservation Function in Zhangjiakou Based on the InVEST Model. Pratacultural Sci. 37 (07), 1313–1324. doi:10.11829/j.issn.1001-0629.2020-0090
Liu, J. F., Jiang, W. G., Zhan, W. F., and Zhou, j. (2010). Processes of SCS Model for Hydrological Simulation: a Review. Res. Soil Water Conservation 17 (02), 120–124.
Liu, Z. H., Zhang, G. J., and Fu, F. J. (2020). Assessing Landscape Ecological Risk Based on Landscape Pattern and Services in Guangzhou during 1990-2015. Acta Ecol. Sin. 40 (10), 3295–3302. doi:10.5846/stxb201903060425
Liu, Y. X., Shi, X. L., and Shi, W. J. (2021). Evaluation of Water Retention Services of Forest Ecosystem in Fujian Province: Comparison between Results from the InVEST Model and Meta-Analysis. Acta Ecol. Sin. 41 (04), 1349–1361. doi:10.5846/stxb202003210632
Liu, Q., Yang, Z. Y., Chen, Y. Q., Lei, J. R., Chen, Z. Z., and Chen, X. H. (2021). Multi-scenario Simulation of Land Use Change and its Eco-Environmental Effect in Hainan Island Based on CA-Markov Model. Ecol. Environ. Sci. 30 (07), 1522–1531. doi:10.16258/j.cnki.1674-5906.2021.07.021
Liu, J., Lang, X. D., Su, J. R., Liu, W. D., Liu, H. Y., and Tian, Y. (2021). Evaluation of Water Conservation Function in the Dry-Hot Valley Area of Jinsha River Basin Based on InVEST Model. Acta Eco Sin. 41 (20), 8099–8111. doi:10.5846/stxb202101050035
Lv, Y. H., Hu, J., Sun, F. F., and Zhang, L. W. (2015). Water Retention and Hydrological Regulation: Harmony but Not the Same in Terrestrial Hydrological Ecosystem Services. Acta Ecol. Sin. 35 (15), 5191–5196.
Lv, R. F. (2019). Spatial-temporal Associations Among Ecosystem Services and Their Driving Mechanism: A Case Study in the City Belt along the Yellow River in Ningxia [dissertation/master’s Thesis]. Lanzhou: Lanzhou University.
Martinez-Harms, M. J., Bryan, B. A., Figueroa, E., Pliscoff, P., Runting, R. K., and Wilson, K. A. (2017). Scenarios for Land Use and Ecosystem Services under Global Change. Ecosyst. Serv. 25, 56–68. doi:10.1016/j.ecoser.2017.03.021
Mokarram, M., Pourghasemi, H. R., Hu, M., and Zhang, H. (2021). Determining and Forecasting Drought Susceptibility in Southwestern Iran Using Multi-Criteria Decision-Making (MCDM) Coupled with CA-Markov Model. Sci. Total Environ. 781, 146703. doi:10.1016/J.SCITOTENV.2021.146703
Matlhodi, B., Kenabatho, P. K., Parida, B. P., and Maphanyane, J. G. (2021). Analysis of the Future Land Use Land Cover Changes in the Gaborone Dam Catchment Using CA-Markov Model: Implications on Water Resources. Remote Sens. 13 (13), 2427. doi:10.3390/rs13132427
Maviza, A., and Ahmed, F. (2020). Analysis of Past and Future Multi-Temporal Land Use and Land Cover Changes in the Semi-arid Upper-Mzingwane Sub-catchment in the Matabeleland South Province of Zimbabwe. Int. J. Remote Sens. 41 (14), 5206–5227. doi:10.1080/01431161.2020.1731001
Millennium Ecosystem Assessment (MA) (2005). Millennium Ecosystem Assessment Synthesis Report. Washington, D.C: Island Press.
Mo, W., Zhao, Y., Yang, N., Xu, Z., Zhao, W., and Li, F. (2021). Effects of Climate and Land Use/Land Cover Changes on Water Yield Services in the Dongjiang Lake Basin. ISPRS Int. J. Geo-Inf. 10 (07), 466. doi:10.3390/ijgi10070466
Pan, T., Wu, S. H., Dai, E. F., and Liu, Y. J. (2013). Spatiotemporal Variation of Water Source Supply Service in Three Rivers Source Area of China Based on InVEST Model. Ying Yong Sheng Tai Xue Bao 24 (01), 183–189. doi:10.13287/j.1001-9332.2013.0140
Pei, H. W., Liu, M. Z., Shen, Y. J., Xu, K., Zhang, H. J., Li, Y. L., et al. (2022). Quantifying Impacts of Climate Dynamics and Land-Use Changes on Water Yield Service in the Agro-Pastoral Ecotone of Northern China. Sci. Total Environ. 809, 151153. doi:10.1016/J.SCITOTENV.2021.151153
Qian, Y., Dong, Z., Yan, Y., and Tang, L. (2022). Ecological Risk Assessment Models for Simulating Impacts of Land Use and Landscape Pattern on Ecosystem Services. Sci. Total Environ. 833, 155218. doi:10.1016/j.scitotenv.2022.155218
Redhead, J. W., Stratford, C., Sharps, K., Jones, L., Ziv, G., Clarke, D., et al. (2016). Empirical Validation of the InVEST Water Yield Ecosystem Service Model at a National Scale. Sci. Total Environ. 569-570, 1418–1426. doi:10.1016/j.scitotenv.2016.06.227
Sánchez-Canales, M., López Benito, A., Passuello, A., Terrado, G., Acuña, V., Schuhmacher, M., et al. (2012). Sensitivity Analysis of Ecosystem Service Valuation in a Mediterranean Watershed. Sci. Total Environ. 440 (1), 140–153. doi:10.1016/j.scitotenv.2012.07.071
Sharp, R., Douglass, J., Wolny, S., Arkema, K., Bernhardt, J., Bierbower, W., et al. (2020). InVEST 3.8.7 User’s Guide. The Natural Capital Project, Stanford University, University of Minnesota, The Nature Conservancy, and World Wildlife Fund.
Sun, S. L., Ge, S., Caldwell, P., McNulty, S., Cohen, E., Xiao, J. F., et al. (2015). Drought Impacts on Ecosystem Functions of the U.S. National Forests and Grasslands: Part II Assessment Results and Management Implications. For. Ecol. Manage 353, 269. doi:10.1016/j.foreco.2015.04.002
Sun, L. P. (2018). Effect Processes and Mechanisms of Natural Restoration Process of the Quercus Liaotungensis Communities on Soil Characteristics in the Ziwuling Area. [dissertation/master’s Thesis]. Yangling: Northwest A & F University.
Tadese, S., Soromessa, T., Bekele, T., and Abbas, S. (2021). Analysis of the Current and Future Prediction of Land Use/land Cover Change Using Remote Sensing and the CA-Markov Model in Majang Forest Biosphere Reserves of Gambella, Southwestern Ethiopia. Sci. World J. 2021, 6685045. doi:10.1155/2021/6685045
Terrado, M., Acuña, V., Ennaanay, D., Tallis, H., and Sabater, S. (2014). Impact of Climate Extremes on Hydrological Ecosystem Services in a Heavily Humanized Mediterranean Basin. Ecol. Indic. 37, 199–209. doi:10.1016/j.ecolind.2013.01.016
UN (United Nations) (2015). Transforming Our World: the 2030 Agenda for Sustainable Development United Nations Sustainable Knowledge Platform, Sustainable Development Goals. Available at: https://sustainabledevelopment.un.org/post2015/transformingourworld.
Wang, Y., Zhao, J., Fu, J., and Wei, W. (2019). Effects of the Grain for Green Program on the Water Ecosystem Services in an Arid Area of China-Using the Shiyang River Basin as an Example. Ecol. Indic. 104, 659–668. doi:10.1016/j.ecolind.2019.05.045
Wang, Y. H., Dai, E. F., Ma, L., and Y, L. (2020). Spatiotemporal and Influencing Factors Analysis of Water Yield in the Hengduan Mountain Region. J. Nat. Resour. 35 (02), 371–386.
Weng, Y. W., Cai, W. J., and Wang, C. (2020). The Application and Future Directions of Shared Socioeconomic Pathways (SSPs). Clim. Change Res. 16 (02), 215–222.
Weng, Q. (2002). Land Use Change Analysis in the Zhujiang Delta of China Using Satellite Remote Sensing, GIS and Stochastic Modelling. J. Environ. Manage. 64 (03), 273–284. doi:10.1006/jema.2001.0509
Wu, R., Liu, G. H., and Wen, Y. H. (2017). Spatiotemporal Variations of Water Yield and Water Quality Purification Service Functions in Guanting Reservoir Basin Based on InVEST Model. Res. Environ. Sci. 30 (03), 406–414. doi:10.13198/j.issn.1001-6929.2017.01.73
Xu, J., Xiao, Y., Li, N., and Wang, H. (2015). Spatial and Temporal Patterns of Supply and Demand Balance of Water Supply Services in the Dongjiang Lake Basin and its Beneficiary Areas. J. Resour. Ecol. 6 (06), 386–396.
Xu, X., Du, Z., and Zhang, H. (2016). Integrating the System Dynamic and Cellular Automata Models to Predict Land Use and Land Cover Change. Int. J. Appl. Earth Observation Geoinformation 52, 568–579. doi:10.1016/j.jag.2016.07.022
Xu, J., Xiao, Y., Xie, G. D., Wang, S., and Zhu, W. B. (2016). Spatiotemporal Analysis of Water Supply Service in Dongjiang Lake Basin. Acta Ecol. Sin. 58 (15), 4892–4906.
Yan, L. L. (2021). Spatiotemporal Variation of Ecological Risks and its Management Strategies Based on Ecosystem Services of the Tableland in Loess Plateau: A Case Study of Ziwuling Area. [dissertation/master’s Thesis]. [Lanzhou]: Lanzhou University.
Yang, J., Xie, B. P., and Zhang, D. G. (2020). Spatio-temporal Variation of Water Yield and its Response to Precipitation and Land Use Change in the Yellow River Basin Based on InVEST Model. Ying Yong Sheng Tai Xue Bao 31 (08), 2731–2739. doi:10.13287/j.1001-9332.202008.015
Yu, L. P., Song, X. Y., and Wang, Z. G. (2020). Study on the Influence of Evaluation Standardization and Evaluation Methods on Academic Evaluation: Taking TOPSIS Evaluation Method as an Example. Inf. Stud. Theory & Appl. 43 (02), 15–20+54. doi:10.16353/j.cnki.1000-7490.2020.02.003
Zhang, L. X., Chen, X. L., and Xin, X. G. (2019). Short Commentary on CMIP6 Scenario Model Intercomparison Project (ScenarioMIP). Clim. Change Res. 15 (05), 519–525.
Zhang, T., Zi, L., Yang, W. F., and Wang, J. H. (2021). Applicability of SCS Model in Flash Flood Forecasting and Early Warning. J. Yangtze River Sci. Res. Inst. 38 (09), 71–76. doi:10.11988/ckyyb.20200721
Zhang, L. X., Fan, J. W., Zhang, H. Y., and Zhou, D. C. (2022). Spatial-temporal Variations and Their Driving Factors of the Ecological Vulnerability in the Loess Plateau. Environ. Sci., 1–18. In press. doi:10.13227/j.hjkx.202110220
Zhao, Y. R., Zhou, J. J., Lei, L., Xiang, J., Huang, M. H., Feng, W., et al. (2019). Identification of Drivers for Water Yield in the Upstream of Shiyang River Based on InVEST Model. Chin. J. Ecol. 38 (12), 3789–3799. doi:10.13292/j.1000-4890.201912.017
Zhou, N. Q., and Zhao, S. (2013). Urbanization Process and Induced Environmental Geological Hazards in China. Nat. Hazards 67 (2), 797–810. doi:10.1007/s11069-013-0606-1
Keywords: water yield, spatiotemporal change, ecological risk, scenario analysis, InVEST model, TOPSIS model
Citation: Jin T, Yan L, Wang S and Gong J (2022) Spatiotemporal Variation in Ecological Risk on Water Yield Service via Land-Use and Climate Change Simulations: A Case Study of the Ziwuling Mountainous Region, China. Front. Environ. Sci. 10:908057. doi: 10.3389/fenvs.2022.908057
Received: 30 March 2022; Accepted: 02 May 2022;
Published: 13 June 2022.
Edited by:
Shiliang Liu, Beijing Normal University, ChinaReviewed by:
Yanxu Liu, Beijing Normal University, ChinaTao Lu, Chengdu Institute of Biology (CAS), China
Copyright © 2022 Jin, Yan, Wang and Gong. This is an open-access article distributed under the terms of the Creative Commons Attribution License (CC BY). The use, distribution or reproduction in other forums is permitted, provided the original author(s) and the copyright owner(s) are credited and that the original publication in this journal is cited, in accordance with accepted academic practice. No use, distribution or reproduction is permitted which does not comply with these terms.
*Correspondence: Jie Gong, amdvbmdAbHp1LmVkdS5jbg==