 Junping Lu
 Tingxi Liu*
- Water Resources Protection and Utilization Key Laboratory, Water Conservancy and Civil Engineering College, Inner Mongolia Agricultural University, Hohhot, China
To clarify the influence of the changes in the overlying water environment on the internal nitrogen release from reservoir sediments in different seasons, the quantitative linear relationship between the intensity of the nitrogen release from the sediment and the environmental factors of the overlying water was established, and their contribution rate to the nitrogen pollution of the reservoir during different storage periods was investigated. In this study, the sediment samples were collected from the Dahekou Reservoir in the Xilingol League, and the orthogonal simulation experiments were conducted in the laboratory. The mathematical model, which was established using multiple linear regression methods, revealed the following. The order of the significance of the influences of the environmental factors on the nitrogen release from the sediments in the Dahekou Reservoir is water temperature (T) > dissolved oxygen (DO) > pH value > hydrodynamic force (K). The total nitrogen release flux from the sediments in the Dahekou Reservoir was 14.278 t/a in 2018, accounting for 27.91% of the total nitrogen (TN) pollution load input during the same period. In particular, in winter, the contribution rate of the nitrogen released from the sediments reached the highest level (57.06–63.26%), which was significantly higher than the river’s contribution to the total nitrogen pollution load of the reservoir. The nitrogen released from the sediments became the main source of nitrogen nutrients in the reservoir in the ice-sealed period.
1 Introduction
Eutrophication of water has been a concern since the early 20th century. The eutrophication of water bodies was first studied in the Great Lakes region of North America. According to the survey results of Davis (1964) for Lake Erie in North America, the number of phytoplankton’s in the lake continued to increase, reaching the maximum in spring and autumn and lasting for an increasingly long time. Subsequently, Beeton’s (1965) research confirmed that the acceleration of the Lake Erie eutrophication was caused by human activities. In addition to the United States, Japan (Okino and Kato, 1987), Germany (Hartman and Nümann, 1977), Sweden (Gelin, 1975), Australia (Hammer et al., 1973), and other countries have also conducted studies on lake eutrophication. Since eutrophication was first discovered in the 1930s, 30–40% of the world’s lakes and reservoirs have been affected by eutrophication to varying degrees. Taking effective measures to control the input of exogenous nitrogen and phosphorus nutrients into the upper reaches of reservoirs has become a common measure for the prevention and control of water eutrophication. However, the internal pollution caused by the release of nitrogen and phosphorus from sediments has been neglected. In this study, the term sediment generally refers to river and lake sediments, which is a common accumulation of particles. A variety of pollutants and numerous types of pollutant degradation, adsorption, desorption, and other biological and ecological effects lead to a variety of pollutant and natural material interactions after the combined effects of these factors have prevailed for a long period of time. Throughout the entire water system, material circulation serves the important roles of confluence and source (Yang et al., 2018). Previous studies have shown that the migration and transformation of nutrients at the mud-water interface are affected and restricted by various environmental factors such as water temperature (Zhong et al., 2008), pH (Bocrs and Istvanovics, 1991), water disturbance (Pang et al., 2008; Yan et al., 2008), and dissolved oxygen (Zhang et al., 2012). The released form, release time, and released quantity of the nutrient salts in the sediments have been found to be random (Hartman and Nümann, 1977; Okino and Kato, 1987; Xue and Lu, 2015). Under the gradual and effective control of the exogenous input, the release of nutrients from sediments becomes an important cause of the deterioration and eutrophication of the lake water quality (Mayer et al., 2005). Therefore, the secondary pollution caused by the internal release of nutrients from sediments has attracted the attention of many scholars (Ni and Wang, 2015; Gu et al., 2016). In the 1970s, Schindler (1974) conducted long-term large-scale experiments on a lake, and Schelske et al. (1974) investigated and studied the phosphorus and silicon dioxide in Lake Michigan, both of which revealed that phosphorus was the main limiting factor in the eutrophication of freshwater lakes. Therefore, phosphorus load reduction has become the main strategy for lake management in North America and Europe. Subsequently, research on lakes Apopka, George, and Okeechobee in the United States, East Lake in China, and Xiupu Lake in Japan have confirmed that using only this method of controlling the phosphorus input fails to control the eutrophication of the water body (Conley et al., 2002). The contribution of nitrogen to water eutrophication has increased significant interest among scientists, and a large number of studies have confirmed that nitrogen is another key limiting factor in the water eutrophication of freshwater lakes (Han et al., 2014; Shan et al., 2015). At present, most scholars have mainly focused on the influences of the lake water body sediment nitrogen composition, occurrence forms, spatial distribution, diffusion flux, and interface structure on the contribution to the water environment (Pennuto et al., 2014; Yang et al., 2017). Conversely, little research has been conducted on the nitrogen release from sediments, which is affected by changes in the overlying water environment. Most previous studies were conducted in the laboratory under static conditions to simulate the impact of changes in a single environmental factor on the release characteristics of the internal nitrogen in sediments, and few studies have investigated the impacts of the synergistic effects of various environmental factors on the release characteristics of the internal nitrogen in sediments. In addition, most studies on sediment nitrogen nutrient release are still in the qualitative stage, so it is urgent to further analyze and quantitatively discuss and estimate the sediment internal nitrogen release load and the pollution contribution rate to the overlying water body. Studies of the contribution of the exogenous input and internal release under the influence of seasonal changes, river runoff, and the water quality upstream of the reservoir will have a significant impact on the formulation of pollution prevention plans and measures for the reservoir.
The Dahekou Reservoir is in a cold and dry area with strong sand movement. The water quality exhibits a eutrophication level that has increased year by year. During winter and spring replacement and the freezing and thawing of the reservoir, the water temperature stratification and inversion influence the release of the nitrogen and nutrient salts in the sediments. Wind and reservoir water drainage disturb the reservoir sediments at the bottom, resulting in sediment suspension and nitrogen redistribution at the interface between the sediments and water (Xiang et al., 2015). Some nutrients can be released from sediments into the upper water, increasing the nutrient load (Holdren and Armstrong, 1980). Therefore, the temperature, pH, dissolved oxygen, hydraulic disturbance, and sediment mathematical model of the internal nitrogen release strength (lake) were considered when simulating the reservoir conditions at the soil interface under environmental changes to estimate the deposited silt sediment nitrogen release flux, to control the water source pollution, to prevent eutrophication, and to ensure the reservoir and downstream water supply function.
2 Materials and Methods
2.1 Survey of Study Areas
The Dahekou Reservoir (42°13′19.17″N, 116°38′4.00″E) is located on the main stream of the Luanhe River in Duolun County, Xilingol League, Inner Mongolia. It was built in August 1995, and it has a maximum water depth of 18.1 m, a designed reservoir capacity of 26 million m3, an area of 8684.54 km2 above the dam site, an average monthly area of 2.14–2.87 km2, and a water level of 1213.39–1215.13 m. The maximum water temperature for many years is 23.3°C, and the average water temperature under the ice during the ice period is 0.4°C. The water level, area, and depth of the reservoir vary with the storage and discharge of the Datang Duolun Hydropower Station at the mouth of the dam. It is a medium-sized narrow reservoir, and water supply and power generation are its main purposes, as well as comprehensive utilization of flood control, agricultural irrigation, and aquaculture. It is mainly recharged by the surface runoff of the Tuligen River in the east and Luanhe River in the west. For many years, due to the influence of sewage discharge from the sewage treatment plant in the upper reaches of Duolun County and the fishery culture in the reservoir, the organic matter (e.g., humus) in the sediments of the reservoir rot, and the nitrogen and phosphorus contents increase year by year. The eutrophication of the reservoir water has not been effectively controlled under these conditions although the external pollution sources are constantly being rectified and reduced. The eutrophication of the reservoir water has adversely affected the water quality of the lower reaches of the Luanhe River and has threatened the safety of the drinking water of the Tianjin residents in the lower reaches of the Luanhe River (Liu et al., 2010).
2.2 Sample Collection
Based on the Chinese water environment and the lake wetland survey norms, according to the distribution of the pollution sources, reservoir area, and water surface width of the Dahekou Reservoir, the reservoir was divided into five sections in the order of (A, B, C, etc.). A total of 18 water quality monitoring points were arranged (Figure 1).
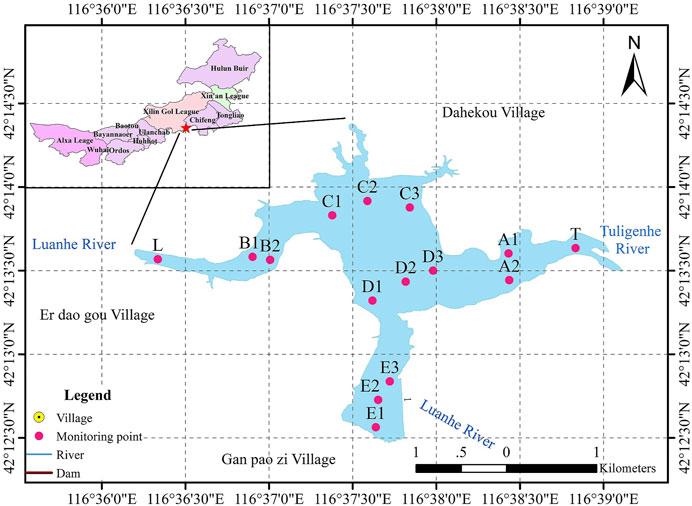
FIGURE 1. Layout of the monitoring points in the Dahekou Reservoir.
From March 2018 to February 2019, each month, we traveled by hovercraft to the monitoring points using Global Positioning System (GPS) navigation. At each monitoring point, we measured the water depth (using a long-line portable LOWRANCE X-4 Pro water depth meter), the bottom water temperature, the dissolved oxygen content (using a YSI550A dissolved oxygen meter), the pH (using an HACH HQ30D instrument), and the flow rate (using a rotary cup flow meter). We measured the average value of the water temperature, the dissolved oxygen, and the pH at the bottom of each monitoring point as the basic physical and chemical index parameters for estimating the nitrogen release load of the sediments.
2.3 Subject Material
2.3.1 Sediment
The sediment samples collected from the bottom of the Dahekou Reservoir at a depth of 15 cm were packed in cloth bags, which were labeled and transported back to the laboratory in a cryogenic sealing device. The physical and chemical indexes of the sediment were determined to be as follows: a pH of 7.63, an organic matter content of 4.2%, and a total nitrogen (TN) content of 2246 mg/kg. The sediment samples were used as orthogonal simulation test samples to investigate the nitrogen release from the sediments.
2.3.2 Overlying Water
Samples of the water overlying the sediments at each sampling point were collected in polyethylene bottles and were transported back to the laboratory refrigerator (4°C) for storage. The TN concentration of the overlying water at the sampling point was 2.1 mg/L.
2.4 Test Scheme
2.4.1 Selection of the Factors Influencing the Orthogonal Test of the Total Nitrogen Exchange Flux in the Sediments
The sediment nitrogen release test method was conducted according to the “Lake Eutrophication Survey Specification.” An orthogonal simulation test of the sediment-overlying water total nitrogen exchange was performed by selecting environmental factors, such as the temperature, pH, dissolved oxygen (DO), and hydrodynamics, which have significant effects on the sediment release.
1) Temperature: Na2CO3 and (1 + 5) H2SO4 solutions with 1 M concentrations were used to adjust the pH to 7.0. The TN concentration of the overlying water was measured in three triangular conical bottles placed in a biochemical incubator at 48-h interval under three ambient temperature conditions, that is, 5, 20, and 35°C.
2) pH: Na2CO3 and (1 + 5) H2SO4 solutions with 1 M concentrations were used to adjust the initial pH values of the overlying water samples to 6.0, 7.5, and 9.0. The TN concentrations of the overlying water samples were measured at 48-h interval in three simulated reactors.
3) DO: Na2CO3 and (1 + 5) H2SO4 solutions with 1 M concentrations were used to adjust the pH to 7.0. The DO concentration of the overlying water was maintained at 2.0 mg/L (N2), 4.0 mg/L, and 6.0 mg/L by controlling the air or nitrogen aeration of the gas rotor flowmeter. The TN concentration of the overlying water was measured at 48-h interval in three reactors.
4) Hydrodynamic conditions: A biochemical incubator was used to control the ambient temperature at 25°C. Na2CO3 and (1 + 5) H2SO4 solutions with 1 M concentrations were used to adjust the pH of the overburden water of the reactor to 7.0. Three different hydrodynamic conditions (i.e., 0 r/min, 30 r/min, and 60 r/min) were set using an infinitely variable speed agitator. The TN concentration of the overlying water was measured at 48 h intervals in three reactors.
2.4.2 Orthogonal Experimental Design of the Nitrogen Release From Sediments
According to the orthogonal experimental design method, which has four factors and three levels [L9 (34)], three groups of experimental designs, including nine schemes, were set up (Table 1). The orthogonal test device is shown in Figure 2.
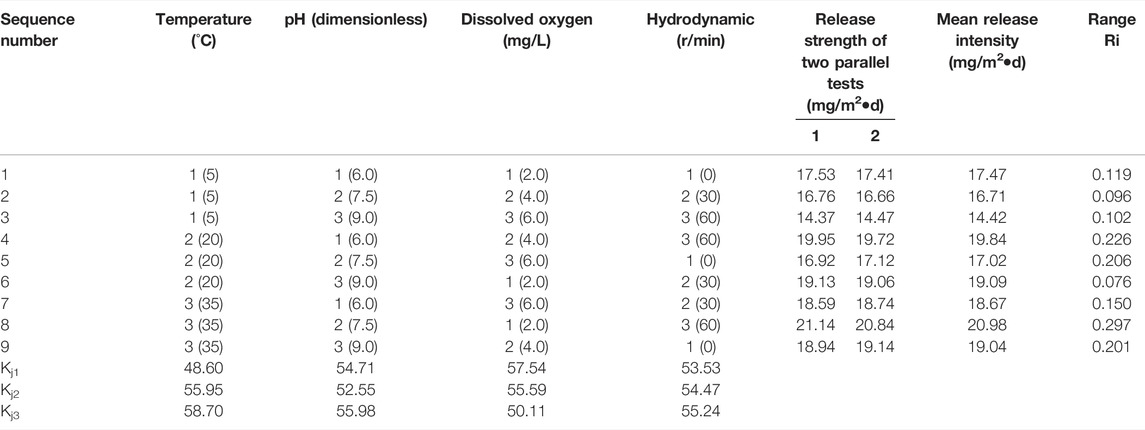
TABLE 1. Statistics of the total nitrogen released from the sediments of the Dahekou Reservoir in the orthogonal experiment.
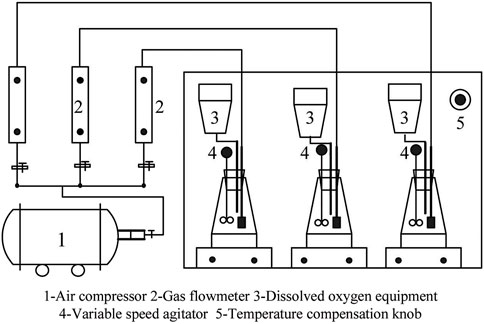
FIGURE 2. Equipment used to test the nitrogen release from the sediments.
2.5 Estimation of the Internal Nitrogen Release Pollution Load in the Sediments
Three groups of experiments were designed. Each group was run continuously for 14 days, and the sampling frequency was 1 time every 2 days. At the beginning of each experiment, 10 g of reservoir sediments were placed in glass bottles with plugs. Then, they were slowly injected into 500 ml of overlying water from the original reservoir, sealed with plugs, connected by pipelines, and placed in a biochemical constant temperature incubator.
Four factors including temperature, pH, DO, and water disturbance were selected as the influencing factors for the orthogonal simulation test of the total nitrogen exchange flux in the sediments. After the start of the experiment, every 2 days, 10 ml of the water overlying the sediment samples was taken using a pipette to determine the TN concentration. At the same time, the original calibration of the glass bottle was supplemented with 10 ml of surface water from the original reservoir. To ensure the rationality and reliability of the test data, two parallel tests were conducted for each test scheme (the error of the results of the two analyses was less than 5%), and the mean value of the results of the two tests was taken. The intensity of the total nitrogen release from the sediments was calculated using the following equation:
where R is the intensity of the nitrogen release (mg/m2); V is the water sample’s volume (L); Cn is the TN concentration of the water overlying the sediment for each sampling site (mg/L); C0 is the initial TN concentration (mg/L); Vi is the volume of each sample (L); Ci−1 is the TN concentration (mg/L); Ca is the TN concentration of the water added (mg/L); and A is the surface area of the sediment in contact with the water (m2).
3 Results and Discussion
3.1 Establishing and Testing the Model of the Intensity of the Nitrogen Release From the Sediments
3.1.1 Establishing a Mathematical Model of the Intensity of the Nitrogen Release From the Sediments in the Reservoir
According to the orthogonal simulation test results for the intensity of the total nitrogen release from the sediments, the release intensity from the sediments was calculated, and the statistics and range analysis were conducted (Table 1).
Based on the analysis of the data from the aforementioned nine orthogonal test schemes for investigating the intensity of the nitrogen release from the sediments, the relationship between the four environmental factors (i.e., temperature, pH, DO, and hydrodynamic conditions) and the intensity of the nitrogen release from the sediments was obtained using the multiple linear regression method:
where R is the intensity of the nitrogen release from the sediments (mg/m2•d); T is the water temperature (°C), 5 < T < 35°C; pH is the pH of the water, 6 < pH < 9; DO is the dissolved oxygen content (mg/L), 0 < DO < 6 mg/L; and K is the speed of the stepless speed regulating agitator (r/min), 0 < K < 60.
3.1.2 Testing the Mathematical Model of the Intensity of the Nitrogen Release From the Sediments
The significance test for a multiple linear regression equation that is generally used to judge the overall significance of the regression model is the F test. If the statistical variable F is selected, then given the significance level a, the check F critical value is f1−2 = (k, n−k−1). If the statistical value F> f1−2 is obtained from the sample calculation, the regression model is considered to be significant. Otherwise, the regression model is not significant (Growns et al., 2003).
1) Significance test of the regression equation of the intensity of the nitrogen release from the sediments.
The significance of the regression equation of the mathematical model of the intensity of the nitrogen release from the sediments is tested: H0:β1 = β2 = β3 = β4 = 0. The sum of the squared deviations of each factor is as follows:
where
For a significance level α = 0.05, F1−α (4, 13) = 3.18, F > F1−α, and the rejection of H0, the regression equation of the mathematical model of the intensity of the nitrogen release from the sediments was significant.
2) Significance test of the regression coefficient of the intensity of the nitrogen release from the sediments.
MATLAB 21.0 was used to test the significance of the regression coefficient of the model equation of the intensity of the nitrogen release from the sediments in the Dahekou Reservoir. The test results are presented in Table 2.
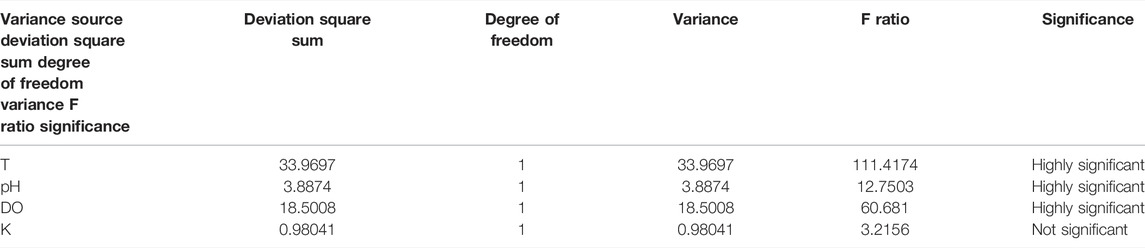
TABLE 2. Significant test results of the multiple linear regression coefficients of the TN release strength from the sediments.
As can be seen from Table 2, the regression coefficients of the environmental factors T, pH, and DO in the regression equation of the mathematical model are highly significant, while the regression coefficients of the environmental factor K are not significant.
3.1.3 Comparison of the Significance Levels of the Factors Influencing the Intensity of the Nitrogen Release From the Sediments
A comparison of the significance levels of the various environmental factors affecting the nitrogen release from the sediments was carried out (Figure 3).
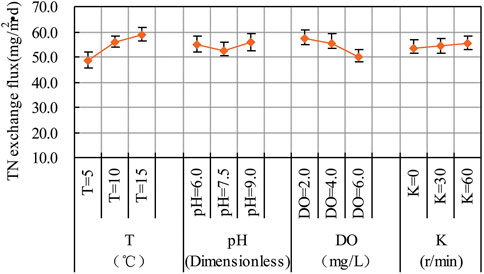
FIGURE 3. Square deviation analysis of the total nitrogen released from the Dahekou sediments during the orthogonal experiments.
As is shown in Figure 3, as the temperature increased, the intensity of the nitrogen release from sediment increases obviously, and the sediments increased significantly. The increase in temperature accelerated the decomposition of the organic nitrogen in the sediments, and thus, the amount of organic nitrogen released into the overlying water increased. In addition, as the dissolved oxygen content decreased, the intensity of the nitrogen release from the sediments increased. This is because the surface layer and the water overlying the sediments are in an anoxic or anaerobic state when the dissolved oxygen content is low, so the release level of ammonia nitrogen, nitrate, and nitrite from sediments is significantly reduced, and the release intensity is much higher than 2–8 times the release rate under aerobic conditions (Zhao et al., 2018.). Ammonium nitrogen is the main form of internal nitrogen released, and its release degree is negatively correlated with the dissolved oxygen content, while it is positively correlated with temperature (Wang et al., 2011). The intensity of the nitrogen release from the sediments initially decreased and then increased as the pH changed from acidic to alkaline. This is attributed to the fact that when the pH of the solution was acidic, H+ competed with NH4+ for adsorption positions on the colloidal particles of the sediments, leading to a significant increase in the intensity of the nitrogen release from the sediments. When the solution was close to neutral, the exchange capacity of NH4+ decreased correspondingly, and the intensity of the nitrogen release from the sediments was weakened. When the pH of the water was alkaline, NH4+ in the water reacted with OH− to form molecular ammonia compounds, which escaped and increased the intensity of the nitrogen release from the sediments (Liu et al., 2014). As the hydrodynamic strength of the intensity of the nitrogen release from the sediments increased, the water disturbance not only resuspended the particle nitrogen in the sediments, but it also accelerated the nitrogen diffusion in interstitial water in the sediments, which increased the material exchange between the overlying water and the sediments, effectively promoting the release of nitrogen from the sediments.
To compare the order of the influences of the various environmental factors on the intensity of the nitrogen release from the sediments, range analysis was conducted on the orthogonal test data for the nitrogen release from the sediments, and the results are as follows:
Temperature:
In the formula, Kj1, Kj2, and Kj3 are the sums of test values under various levels; a1, a2.....a9 is the value of the total nitrogen release intensity; and SjA, SjB, SjC, and SjD are the standard variances under the environmental conditions of temperature, pH, DO, and K, respectively.
In the same way:
The results of the range analysis of the data show that within the range of values specified for the various environmental factors, there is a relationship of SjA2>SjC2>SjB2>SjD2. In other words, the significance of the four environmental factors on the release of nitrogen from the sediments in the Dahekou Reservoir is ranked as follows: water temperature (T) > dissolved oxygen (DO) > pH value > hydrodynamic (K).
3.2 Estimation and Variation Analysis of the Internal Nitrogen Release Pollution Load in the Sediments
According to the monitoring data for the actual physical and chemical indexes, such as water temperature, pH, and dissolved oxygen, at the bottom of the Dahekou Reservoir in 2018, the intensity of the nitrogen release from the reservoir sediments during different time periods was estimated using the mathematical equation:
where W is the internal nitrogen release pollution load of the reservoir sediments (t); Ri is the nitrogen exchange flux under ice conditions [mg/(m2•d)]; ΔTi is the corresponding time period under ice conditions (d); and A is the corresponding reservoir area at different time periods (m2).
The Dahekou Reservoir is located in a windy and sandy area, with an average annual wind speed of >3.3 m/s. The kinetic energy generated by the wind-wave disturbances and the scouring effect of the discharged water on the sediments during power generation is transferred to the sediment-water interface, from the sediment-water interface to the sediments, and the sediments are resuspended, which has an important effect on the migration and transformation of phosphorus nutrient salt between the sediment and the water (Schelske et al., 1974). The wave hydraulic effect of the reservoir sediment disturbance intensity is currently not directly measurable using the currently available experimental instruments. Therefore, in this study, a Nanjing south water LB70-1 c cup type current meter was used to determine the value for the reservoir. Based on the relationship between the flow velocity and the spin cup speed, the hydraulic disturbance intensity was indirectly determined using the established mathematical model of the sediment nitrogen release for the pollution load estimation. The results are presented in Table 3.
where v is the flow rate (m/s); a is the current meter constant (0.0067 m) (m/s); b is the hydraulic pitch of the rotary cup (0.7432 m) (m); and n is the rotor velocity of the current meter (s−1).
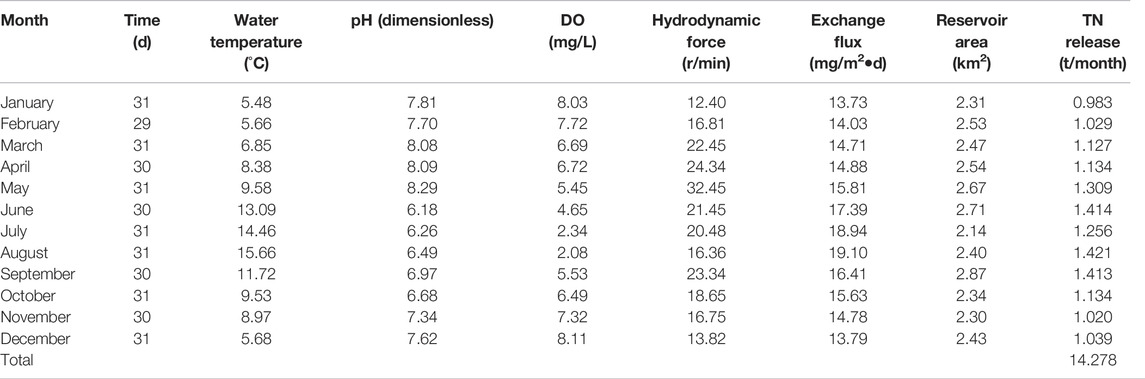
TABLE 3. Estimation of the TN release pollution load from the sediments in the Dahekou Reservoir.
As can be seen from Tables 3, 4, the amount of TN released from the sediments in the Dahekou Reservoir was 14.278 t/a in 2018, among which the amount of TN released during the wet season (from June to September) was 5.504 t, accounting for 38.55% of the annual amount of TN released. From February to May, the total nitrogen released from the sediments was 4.599 t, accounting for 32.21% of the total nitrogen released throughout the year. During the dry season (October to January), the total nitrogen released from the sediments was 4.176 t, accounting for 29.25% of the total nitrogen released throughout the year. The annual amount of total nitrogen released from the sediments in the reservoir was the largest in the wet season and the smallest in the dry season, which is consistent with the results reported by Liu et al. (2006). Based on the comprehensive analysis of the water temperature, pH, DO, and the hydrodynamic conditions, the various physical, chemical, and biological reaction conditions (e.g., diffusion and organic matter degradation) during the wet season are conducive to promoting and accelerating the decomposition of the organic nitrogen in the sediments (Wang et al., 2013; Zhu et al., 2017), which leads to an increase in the amount released into the overlying water. The level period after the reservoir freezes is influenced by reservoir fisheries and power stations and by human activities, such as water disturbances. This can cause sediment resuspension and the particulate nitrogen in the accelerated interstitial diffusion of nitrogen from the sediment into the water, which increases the material exchange capacity between overlying water and sediment, effectively promoting the release of nitrogen from the sediments (Nowlin et al., 2005). However, the level period also includes algae growth, photosynthesis, and increase in pH, which is beneficial to sediment nitrogen adsorption by the upper water, so the plentiful release of nitrogen from the sediment is not very obvious (Wu and Hua, 2014). During the dry, deep freeze period, the water temperature is much lower than at other times throughout the year. The use of NO2−-N by water algae microorganisms or dormant microorganisms (Robarts and Zohary, 1987; Cao et al., 2008) and the mud microbial activities near the weak interface is slow, and thus, the mud nutrient exchange flux is tiny at the interface, and the nitrogen release from the sediments is not significant (Nowlin et al., 2005; Cheng et al., 2015). As a result, the nitrogen release intensity reaches a minimum for the year during this period, and for the sediments in the reservoir, the contribution rate of the nitrogen nutrient released is smaller.
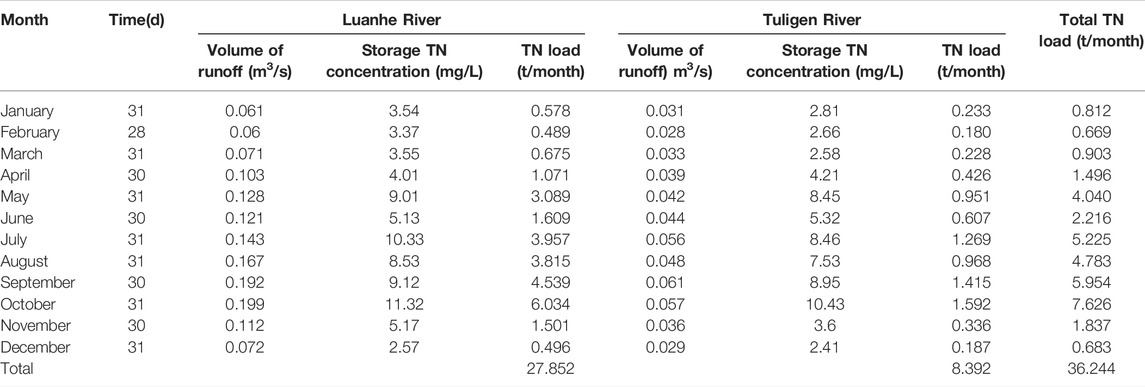
TABLE 4. Estimations of the reservoir’s TN pollution load from runoff.
3.3 Identification of the Contribution of Nitrogen Pollution From the Sediments in the Reservoir
To identify the contribution rate of the internal nitrogen input to reservoir eutrophication, based on the 2018 storage in the Luanhe River mouth section, the water quality monitoring data for the spit storage root river mouth section, the Duolun county big mouth spit force provided by the river, and the data for the incoming runoff at the Luanhe River reservoir management stations, the same period for the contribution of the rivers to the TN pollution load was estimated using the following equation (Table 4):
where M is the monthly TN pollution load of the river runoff input into the storage area (t/month); Qi is the monthly river inflow cross-section flow (m3/s); and Ni is the number of days per month (d).
As can be seen from Tables 3, 4, the Dahekou Reservoir’s TN input pollution load was 36.244 t in 2018, and the internal nitrogen released from the sediment into the nitrogen load was 14.278 t, accounting for 28.26% of the reservoir TN pollution load. In the similarly eutrophic Lake Taihu, China, based on the relationship between the sediment resuspension flux and the wind speed, Pang et al. (2008) estimated the amount of internal nitrogen released from the Taihu lake sediments and determined that it accounted for 25.7% of the total exogenous nitrogen input.
To determine the contribution rate of the sediment to the TN pollution of the Dahekou Reservoir, the calculation results for the sediment pollution load and the TN pollution load of the river runoff into the reservoir were plotted (Figure 4) to compare their contributions.
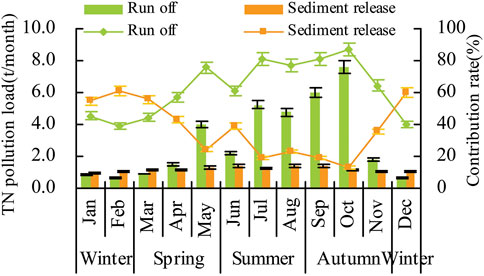
FIGURE 4. Monthly variations in the reservoir’s TN contribution rate from two sources.
As is shown in Figure 4, the contributions of the nitrogen released from the sediments and that input by the river runoff to the total nitrogen pollution load exhibit regular trends. In spring (March–May), when the reservoir is unblocked, the water temperature is affected by stratification and inversion, and the nitrogen nutrients in the sediment have significant release characteristics (Wang et al., 2019), which leads to the significant release, adsorption, and desorption of the nitrogen and phosphorus in the sediments, including suspended solids (Gao et al., 2013; Testa et al., 2013). Therefore, the nutritional level of the overlying water body is increased, and it is affected by biological activities, such as algae and zooplankton growth and the double impact of the hydropower generation discharge of the Datang International Duolun Hydropower Station on the disturbance of the reservoir sediment. In summer (June–August), the temperature and rainfall intensity increase sharply, and the reservoir river runoff also increases soaring. Because the reservoir is surrounded by fertilized farmland and the rainfall surface runoff from this farmland flows into the Luanhe River and thus into the reservoir, the contribution rate of the total nitrogen pollution load increased to 61.05–80.62%, the river runoff nitrogen nutrient transport has become the main input to the reservoir in the summer, and the total nitrogen content increased. In autumn (September–November), because of the increase in rainfall in the areas upstream of the reservoir, especially in October, the river input increased rapidly, the inflow of surface runoff reached a peak for the year, the water level rose significantly, and the rivers’ total nitrogen pollutant load input to the TN storage reached the maximum value of 7.626 t/month, accounting for 87.05% of the monthly total nitrogen storage load. For the nitrogen released from the sediments in the reservoir, the contribution rate of the total nitrogen reached the annual minimum, and the contribution of the river runoff nitrogen nutrient transport to the reservoir’s water quality and eutrophication level played a key role. In winter (December–February), the reservoir entered the ice sealing period, the runoff from the Luanhe and the Tuligen rivers into the reservoir system reached the lowest level for the year. Furthermore, the point source and non-point source pollution along the rivers were reduced, and the water quality improved significantly, resulting in the reduction of the contribution rate of the total nitrogen pollution into the reservoir. Under the influence of the lower water temperature and higher dissolved oxygen content, the activity of microorganisms also decreased further, and the rate of nitrification and denitrification reached the lowest of the year; thus the intensity of the nitrogen release from the sediments reached the lowest for the year. Because the ice sealing period occurred in the dry season, the area of the reservoir was reduced, and the total nitrogen pollution load released from the sediments was lower than the total nitrogen pollution load at other times of the year. However, owing to the huge decrease in the river runoff in the dry season, the contribution rate of the total nitrogen released from the sediments to the total reservoir pollution load was higher than in other seasons, reaching the highest level (54.76–60.60%), which is higher than the total nitrogen pollution load the rivers contribute to the reservoir. The total nitrogen released from the sediments becomes an important source of nitrogen nutrition when the reservoir is frozen.
4 Conclusion
Nitrogen release from the sediments in a reservoir (lake) is a very complex dynamic process, which is influenced by multiple factors. To determine the factors influencing the nitrogen release from the sediment, the intensity of the internal nitrogen release and its contribution to the pollution of the reservoir were estimated. An orthogonal test of nitrogen release from sediments for four factors and three factors [L9 (34)] were designed, laboratory simulation tests of the influences of the four factors (i.e., T, pH, DO, and K) were conducted, and the test results were analyzed. The following conclusions were drawn.
1) The mathematical model equation [R = 20.938 + 0.122 (T)−0.379 (pH)−0.621 (DO) + 0.010 (K)] for the nitrogen release from the sediments for the ranges of the specified environmental variables was established based on the results of laboratory orthogonal simulation experiments, and the significance of the model was determined using the F test. The results revealed that the regression equation of the mathematical model of the intensity of the nitrogen release from the sediments is significant, and the regression coefficients of the environmental factors T, pH, and DO were highly significant, but that of K was not.
2) In 2018, the TN release load of the sediments in the Dahekou reservoir was 14.278 t/a, of which the total nitrogen released from the sediments in the wet season (from June to September) was 5.504 t, accounting for 38.55% of the total nitrogen released throughout the year. The total nitrogen released from the sediments in the horizontal period (from February to may) was 4.599 t, accounting for 32.21% of the total nitrogen releases throughout the year. During the dry season (October to January), the total nitrogen released from the sediment was 4.176 t, accounting for 29.25% of the total nitrogen released throughout the year.
3) In spring, the contribution rate of the nitrogen released from the sediments and that of the river runoff to the nitrogen and nutrients in the reservoir were relatively close, so they were the main sources of nutrients for the reservoir water during this season. In summer and autumn, although the environmental conditions were conducive to the release of nitrogen nutrients from the sediments into the overlying water, the contribution rate of the nitrogen released from the sediments into the overlying water decreased to 19.38–38.95% due to the increased contribution of the runoff pollution from the rivers upstream. The contribution rate of the nitrogen released from the sediments reached the lowest level at this time, and the input of nitrogen nutrients by the upstream river was the main cause of the eutrophication of the reservoir. During the frozen period, the contribution rate of the nitrogen released from the sediments into the overlying water reached the highest level (54.76–60.60%), and it was one of the main sources of nitrogen nutrients in the water.
Data Availability Statement
The original contributions presented in the study are included in the article/supplementary material; further inquiries can be directed to the corresponding authors.
Author Contributions
JL conceived of the presented idea and developed the theory and performed the computations. XS verified the analytical methods. TL supervised the findings of this work. All authors discussed the results and contributed to the final manuscript.
Funding
This study was funded by the Key Laboratory of Water Resource Protection and Utilization in the Inner Mongolia Autonomous Region, the National Natural Science Foundation of China (51669023 and 51869021), and the National Key Research and Development Program of China (2019YFC0609204).
Conflict of Interest
The authors declare that the research was conducted in the absence of any commercial or financial relationships that could be construed as a potential conflict of interest.
Publisher’s Note
All claims expressed in this article are solely those of the authors and do not necessarily represent those of their affiliated organizations, or those of the publisher, the editors, and the reviewers. Any product that may be evaluated in this article, or claim that may be made by its manufacturer, is not guaranteed or endorsed by the publisher.
References
Beeton, A. M. (1965). Eutrophication of the St. Lawrence Great Lakes1. Limnol. Oceanogr. 10 (2), 240–254. doi:10.4319/lo.1965.10.2.0240
Bocrs, P. C. M., and Istvanovics, V. (1991). The Influence of pH on Phosphate Release from Lake Sediments. Water Res. 25 (3), 309–311. doi:10.1016/0043-1354(91)90010-N
Cao, H.-S., Tao, Y., Kong, F.-X., and Yang, Z. (2008). Relationship between Temperature and Cyanobacterial Recruitment from Sediments in Laboratory and Field Studies. J. Freshw. Ecol. 23 (3), 405–412. doi:10.1080/02705060.2008.9664217
Cheng, X., Hou, L., Liu, M., Zheng, Y., Yin, G., Li, X., et al. (2015). Inorganic Nitrogen Exchange across the Sediment-Water Interface in the Eastern Chongming Tidal Flat of the Yangtze Estuary. Environ. Earth Sci. 74 (3), 2173–2184. doi:10.1007/s12665-015-4207-z
Conley, D. J., Humborg, C., Rahm, L., Savchuk, O. P., and Wulff, F. (2002). Hypoxia in the Baltic Sea and Basin-Scale Changes in Phosphorus Biogeochemistry. Environ. Sci. Technol. 36 (24), 5315–5320. doi:10.1021/es025763w
Davis, C. C. (1964). Evidence for the Eutrophication of Lake Erie from Phytoplankton Records. Limnol. Oceanogr. 9 (3), 275–283. doi:10.4319/lo.1964.9.3.0275
Gao, L. I., Zhang, L., Hou, J., Wei, Q., Fu, F., Shao, H., et al. (2013). Decomposition of Macroalgal Blooms Influences Phosphorus Release from the Sediments and Implications for Coastal Restoration in Swan Lake, Shandong, China. Ecol. Eng. 60 (6), 19–28. doi:10.1016/j.ecoleng.2013.07.055
Gelin, C. (1975). Nutrients, Biomass and Primary Productivity of Nannoplankton in Eutrophic Lake Vombsjön, Sweden. Oikos 26, 121–139. doi:10.2307/3543701
Growns, I., Gehrke, P. C., Astles, K. L., and Pollard, D. A. (2003). A Comparison of Fish Assemblages Associated with Different Riparian Vegetation Types in the Hawkesbury-Nepean River System. Fish. Manag. Ecol. 10 (4), 209–220. doi:10.1046/j.1365-2400.2003.00337.x
Gu, X.-z., Chen, K.-n., Zhang, L., and Fan, C.-x. (2016). Preliminary Evidence of Nutrients Release from Sediment in Response to Oxygen across Benthic Oxidation Layer by a Long-Term Field Trial. Environ. Pollut. 219, 656–662. doi:10.1016/j.envpol.2016.06.044
Hammer, U., Walker, K., and Williams, W. (1973). Derivation of Daily Phytoplankton Production Estimates from Short-Term Experiments in Some Shallow, Eutrophic Australian Saline Lakes. Mar. Freshw. Res. 24 (3), 259–266. doi:10.1071/mf9730259
Han, H., Lu, X., Burger, D. F., Joshi, U. M., and Zhang, L. (2014). Nitrogen Dynamics at the Sediment-Water Interface in a Tropical Reservoir. Ecol. Eng. 73, 146–153. doi:10.1016/j.ecoleng.2014.09.016
Hartmann, J., and Nümann, W. (1977). Percids of Lake Constance, a Lake Undergoing Eutrophication. J. Fish. Res. Bd. Can. 34 (10), 1670–1677. doi:10.1139/f77-231
Holdren, G. C., and Armstrong, D. E. (1980). Factors Affecting Phosphorus Release from Intact Lake Sediment Cores. Environ. Sci. Technol. 14 (1), 79–87. doi:10.1021/es60161a014
Liu, Y., Zhang, Z., and Duan, X. J. (2006). Prediction Model and the Control of Nitrogen Releasing from Sediment of Lakes, China. J. Agro-environment Sci. 25 (6), 1603–1606.
Liu, J., Chen, Q., and Li, Y. (2010). Ecological Risk Assessment of Water Environment for Luanhe River Basin Based on Relative Risk Model. Ecotoxicology 19 (8), 1400–1415. doi:10.1007/s10646-010-0525-9
Liu, X., Xian, P., Wen, Z. W., Xiang, T., Yang, L. H., and Guo, M. F. (2014). “Research on the Influence of Overlying Water pH to the Sediment Release,” in Environmental Technology and Resource Utilization Ii. Editor L. Zhangs (Trans Tech Publications Ltd Stafa-Zurich), 556–562.
Mayer, T., Rosa, F., and Charlton, M. (2005). Effect of Sediment Geochemistry on the Nutrient Release Rates in Cootes Paradise Marsh, Ontario, Canada. Aquatic Ecosyst. Health & Manag. 8 (2), 133–145. doi:10.1080/14634980590954986
Ni, Z., and Wang, S. (2015). Historical Accumulation and Environmental Risk of Nitrogen and Phosphorus in Sediments of Erhai Lake, Southwest China. Ecol. Eng. 79, 42–53. doi:10.1016/j.ecoleng.2015.03.005
Nowlin, W. H., Evarts, J. L., and Vanni, M. J. (2005). Release Rates and Potential Fates of Nitrogen and Phosphorus from Sediments in a Eutrophic Reservoir. Fresh Water Biol. 50 (2), 301–322. doi:10.1111/j.1365-2427.2004.01316.x
Okino, T., and Kato, K. (1987). Lake Suwa-Eutrophication and its Partial Recent Recovery. Geo J. 14 (3), 373–375. doi:10.1007/bf00208212
Pang, Y., Yan, R. R., Yu, Z. B., Li, Y. P., and Li, R. L. (2008). Suspension-sedimentation of Sediment and Release Amount of Internal Load in Lake Taihu Affected by Wind. Huan Jing Ke Xue 29 (9), 2456–2464.
Pennuto, C. M., Burlakova, L. E., Karatayev, A. Y., Kramer, J., Fischer, A., and Mayer, C. (2014). Spatiotemporal Characteristics of Nitrogen and Phosphorus in the Benthos of Nearshore Lake Erie. J. Gt. Lakes. Res. 40 (3), 541–549. doi:10.1016/j.jglr.2014.02.013
Robarts, R. D., and Zohary, T. (1987). Temperature Effects on Photosynthetic Capacity, Respiration, and Growth Rates of Bloom‐forming Cyanobacteria. N. Z. J. Mar. Freshw. Res. 21 (3), 391–399. doi:10.1080/00288330.1987.9516235
Schelske, C. L., Rothman, E. D., Stoermer, E. F., and Santiago, M. A. (1974). Responses of Phosphorus Limited Lake Michigan Phytoplankton to Factorial Enrichments with Nitrogen and Phosphorus1. Limnol. Oceanogr. 19 (3), 409–419. doi:10.4319/lo.1974.19.3.0409
Schindler, D. W. (1974). Eutrophication and Recovery in Experimental Lakes: Implications for Lake Management. Science 184 (4139), 897–899. doi:10.1126/science.184.4139.897
Shan, L., He, Y., Chen, J., Huang, Q., Lian, X., Wang, H., et al. (2015). Nitrogen Surface Runoff Losses from a Chinese Cabbage Field under Different Nitrogen Treatments in the Taihu Lake Basin, China. Agric. Water Manag. 159, 255–263. doi:10.1016/j.agwat.2015.06.008
Testa, J. M., Brady, D. C., Di Toro, D. M., Boynton, W. R., Cornwell, J. C., and Kemp, W. M. (2013). Sediment Flux Modeling: Simulating Nitrogen, Phosphorus, and Silica Cycles. Estuar. Coast. Shelf Sci. 131, 245–263. doi:10.1016/j.ecss.2013.06.014
Wang, Z., Zhao, L., Li, X., Ma, K., Huang, X., Feng, Z., et al. (2011). The Factors Affecting the Intensity of Lake Endogenous Nitrogen Release under the Conditions of Different Time Scales, China. J. Agro-Environment Sci. 30 (12), 2542–2547.
Wang, P., Shen, X., Wang, S., and Hao, S. (2013). Remobilization of Phosphorus from Sediments of Taihu Lake during Periods of Simulated Resuspension. Water Environ. Res. 85 (11), 2209–2215. doi:10.2175/106143013x13736496909590
Wang, Y. M., Li, K. F., Liang, R., Han, S., and Li, Y. (2019). Distribution and Release Characteristics of Phosphorus in a Reservoir in Southwest China. Int. J. Environ. Res. Public Health 16 (3), 12. doi:10.3390/ijerph16030303
Wu, D., and Hua, Z. (2014). The Effect of Vegetation on Sediment Resuspension and Phosphorus Release under Hydrodynamic Disturbance in Shallow Lakes. Ecol. Eng. 69, 55–62. doi:10.1016/j.ecoleng.2014.03.059
Xiang, S., Nie, F., Wu, D., and Liu, X. (2015). Nitrogen Distribution and Diffusive Fluxes in Sediment Interstitial Water of Poyang Lake. Environ. Earth Sci. 74 (3), 2609–2615. doi:10.1007/s12665-015-4281-2
Xue, W., and Lu, S-Y. (2015). Effects of Inactivation Agents and Temperature on Phosphorus Release from Sediment in Dianchi Lake, China. Environ. Earth Sci. 74 (5), 3857–3865. doi:10.1007/s12665-014-3910-5
Yan, R. R., Pang, Y., Chen, X. F., Zhao, W., and Ma, J. (2008). Effect of Disturbance on Growth of Microcystis Aeruginosa in Different Nutrient Levels. Huan Jing Ke Xue 29 (10), 2749–2753.
Yang, W.-Q., Xiao, H., Li, Y., and Miao, D.-R. (2017). Vertical Distribution and Release Characteristics of Nitrogen Fractions in Sediments in the Estuaries of Dianchi Lake, China. Chem. Speciat. Bioavailab. 29 (1), 110–119. doi:10.1080/09542299.2017.1352460
Yang, J.-F., Xu, P., Wu, S.-L., Liu, Z.-P., He, M., Zheng, L.-Y., et al. (2018). Distribution, Sources and Ecological Risk Assessment of Heavy Metals in the Surface Sediments of Lake Liuye and its Adjacent Waters, China. J. Radioanal. Nucl. Chem. 318 (2), 1131–1142. doi:10.1007/s10967-018-6091-y
Zhang, K., Cheng, P.-d., Zhong, B.-c., and Wang, D.-z. (2012). Total Phosphorus Release from Bottom Sediments in Flowing Water. J. Hydrodyn. 24 (4), 589–594. doi:10.1016/s1001-6058(11)60281-3
Zhao, H., Zhang, L., Wang, S., and Jiao, L. (2018). Features and Influencing Factors of Nitrogen and Phosphorus Diffusive Fluxes at the Sediment-Water Interface of Erhai Lake. Environ. Sci. Pollut. Res. 25 (2), 1933–1942. doi:10.1007/s11356-017-0556-3
Zhong, J.-C., You, B.-S., Fan, C.-X., Li, B., Zhang, L., and Ding, S.-M. (2008). Influence of Sediment Dredging on Chemical Forms and Release of Phosphorus. Pedosphere 18 (1), 34–44. doi:10.1016/s1002-0160(07)60100-3
Keywords: northern cold area, Dahekou Reservoir, endogenous pollution, sediment, nitrogen release model, contribution rate
Citation: Lu J, Liu T, Shi XH, Sun B and Zhao S (2022) Characteristics and Pollution Contribution of the Internal Nitrogen Release From the Sediments in the Dahekou Reservoir in Inner Mongolia. Front. Environ. Sci. 10:907769. doi: 10.3389/fenvs.2022.907769
Received: 30 March 2022; Accepted: 13 June 2022;
Published: 18 July 2022.
Edited by:
Zhenzhong Zeng, Southern University of Science and Technology, ChinaReviewed by:
Changhui Wang, Nanjing Institute of Geography and Limnology (CAS), ChinaGuoqing Wang, Nanjing Hydraulic Research Institute, China
Copyright © 2022 Lu, Liu, Shi, Sun and Zhao. This is an open-access article distributed under the terms of the Creative Commons Attribution License (CC BY). The use, distribution or reproduction in other forums is permitted, provided the original author(s) and the copyright owner(s) are credited and that the original publication in this journal is cited, in accordance with accepted academic practice. No use, distribution or reproduction is permitted which does not comply with these terms.
*Correspondence: Junping Lu, anVucGluZzUxNkAxNjMuY29t; Tingxi Liu, dHhsaXUxOTk2QDE2My5jb20=