
94% of researchers rate our articles as excellent or good
Learn more about the work of our research integrity team to safeguard the quality of each article we publish.
Find out more
ORIGINAL RESEARCH article
Front. Environ. Sci., 14 July 2022
Sec. Environmental Economics and Management
Volume 10 - 2022 | https://doi.org/10.3389/fenvs.2022.905933
This article is part of the Research TopicCircular Economy Business Models for Sustainable ProductionView all 5 articles
 Guangcheng Ma*
 Jianhua Cao
At present, green energy transformation and climate policy are increasingly connected. The need to improve national competitiveness and implement climate and energy strategies means that an energy-consuming country like China must rapidly enhance its green energy efficiency (GEE) and energy consumption structure. The following paper contributes to the existing literature by analyzing the effects of bilateral FDI on GEE from the perspective of spatial correlation. Based on data from 30 Chinese provinces between 2003 and 2020, this paper uses multiple undesired output indicators covering eight pollutants to measure GEE and then uses the coupling function to measure the coordinated development level of bilateral FDI (CDFDI). According to the Panel Vector Autoregression model, there is a coupling relationship between bilateral FDI. Both the global Moran index and the local Moran scatter plot shows that GEE and CDFDI are characterized by spatial aggregation. This paper adopts the dynamic Spatial Dubin Model for empirical analysis. Our results reveal a significant positive impact of CDFDI on GEE in local and nearby regions. The impact of CDFDI on GEE is moderated by technological diffusion, nationalization, and environmental regulation, resulting in differential impacts on GEE in local and nearby regions. Furthermore, CDFDI with different investment motives has a boosting effect on local GEE. Among them, the mutual investment portfolio between China and developed countries has a negative impact on the local GEE. By contrast, the complementary investment motivation portfolio can boost GEE in local and adjoining regions in any period. This is the first paper to study the spatial effects of green energy efficiency and the heterogeneity of investment incentives to help Chinese international investment policymakers better understand the contribution of CDFDI to improving GEE and inform supportive policies. To improve green energy efficiency, the government must strengthen the implementation of the opening-up policy and create international capital flows suitable for local needs.
Energy efficiency significantly affects the world economy, as well as regional and national energy balances (Hong et al., 2022). Energy is one of the economic lifelines of a country and its consumption has a strong adverse impact on climate change (Lucas and Mendes-Da-Silva, 2018; Cabeça et al., 2021; Campagnolo and De Cian, 2022). China, in particular, has been the world’s largest energy consumer since 2007.1 In the past, China adopted a high input, high consumption, low output, and low efficiency, which increased energy-related pollutant emissions (e.g., CO2, SO2, PM 2.5) and caused a series of severe environmental and public health problems, such as climate change and negative health externalities (Hosseini-Fashami et al., 2019; Meng and Qu, 2022). In 2021, the Chinese government proposed plans to transform all economic and social development aspects into a green model, including green energy efficiency (GEE). In China’s energy consumption structure, we can find that primary energy sources such as coal and oil consumption occupy the first position globally, and the resulting carbon emissions are also the first in the world. This fact also reflects that China plays a pivotal role in the world’s energy consumption and greenhouse gas emissions. Suppose China can develop clean energy as soon as possible and improve GEE, such as nuclear power, hydropower, wind power, solar energy, biomass energy and geothermal energy efficiency. In that case, it will contribute to the content of the Paris Agreement and the Glasgow Conference. Therefore, we focus on China’s GEE in this study, which incorporates environmental constraints into energy efficiency studies.
In the case of China, major economic strategies such as Made in China 2025 and the Belt and Road Initiative (BRI) have increased global energy flows. However, the country’s energy efficiency decreases while its energy sources are rapidly depleted. Currently, the total efficiency of power generation and heating stations from 2008 to 2017 (42.92%) was less than half that of coking (95.35%) and oil refining (97.26%) (Liu T. et al., 2021). At the 75th UN General Assembly, President Xi Jinping announced that China aimed to reach its CO2 emissions peak before 2030 and achieve carbon neutrality before 2060.2 In October 2021, the Central Committee of the Communist Party of China and the State Council set specific goals and requirements in the Working Guidance for Carbon Dioxide Peaking and Carbon Neutrality in Full and Faithful Implementation of the New Development Philosophy, which stated that the energy consumption per unit of GDP in 2025 would be 13.5% less than that of 2020 and the proportion of non-fossil energy consumption in 2030 would be about 25% of that in 2020.3 Under the constraints of the impossible triangle of energy, the direct and indirect costs of clean energy are far greater than those of traditional energy. By the end of 2021, some cities had already implemented dual-energy depletion control under the dual carbon constraints and had also implemented restrictions such as power outages,4 production restrictions,5 and even one-size-fits-all shutdowns for high-energy-consuming industries. Zhou et al. (2017) stated that improving energy efficiency has been widely regarded as one of the most cost-effective ways to reduce dependence on fossil energy, guarantee energy security, tackle global climate change and environmental pollution, and promote low-carbon development. Improving green energy efficiency (GEE) has become the key to China’s economic transformation and development. Therefore, reasonable ways to improve GEE have become a very critical issue among the public, academia, and political circles.
Inward foreign direct investment (IFDI) is one of the fundamental driving forces of China’s economic growth and provides a sustainable impetus for economic development. However, while promoting economic growth, IFDI may also be accompanied by environmental and energy consumption problems. Some scholars have suggested that IFDI may be inseparable from the current deteriorating energy consumption and environmental conditions in China (Zhang and Fu, 2008). Studies of these problems have not yet reached a consensus. The “Pollution Haven” and “Pollution Halo” hypotheses have occupied dominant positions in many current studies (Copeland and Taylor, 1994). The former hypothesis argues that developed countries tend to transfer their high-polluting and energy-intensive industries to developing countries, which are negatively affected and become pollution havens because of the vastly increased levels of pollutant emissions and energy consumption (Eskeland and Harrison, 2003; Baek, 2016; Muhammad et al., 2020; Wang Y. et al., 2022). Zarsky (1999) put forward the latter hypothesis, which argues that the IFDI has brought in more advanced management methods and efficient technologies, which have improved energy efficiency in the host countries (Shao, 2018; Demena and Afesorgbor, 2020).
Outward foreign direct investment (OFDI) in China’s response to curbing environmental pollution and enhancing GEE cannot be overlooked. Hao et al. (2020a) stated that OFDI would determine the scale, technical, and composition effects on China’s environmental pollution. Specifically, OFDI affects the home country’s green and low-carbon technology innovation capability and industrial structure by adopting cleaner production technologies and green production processes, thereby improving environmental quality and green energy efficiency. Research on the relationship between energy depletion and OFDI can be traced to the “Environmental Kuznets Curve (EKC) Hypothesis.” The EKC hypothesis was developed by Grossman and Krueger (1991), who found an inverted U-shaped relationship between income and pollution levels when studying the environmental impact of NAFTA. They point out that pollution levels rise with per capita GDP at lower income levels, and at higher income levels, pollution levels fall with GDP growth. Specifically, the EKC describes the trade-off between the need for material improvement through income growth and the quality of life represented by environmental variables (Chang et al., 2021). According to the EKC, with the continuous improvement of the economic level, the relationship between environmental pollution and economic development has an inverted U-shaped. OFDI also promotes the improvement of per capita income, so there is an inverted U-shaped relationship between OFDI and environmental pollution logically. That is, OFDI may affect GEE (Hao et al., 2018).
Most previous studies have studied the effects of IFDI and OFDI on GEE and the environment separately. As evidenced by the literature review, no comprehensive and wide-ranging research on how bilateral FDI affects GEE has been conducted. China’s IFDI and OFDI have shown sustained and rapid growth in recent years. As its going out and bringing in strategy continue, China plays an essential role in the international capital arena with the dual role of an investor and a host country. With its IFDI growing from 56.14 billion dollars in 2003 to 144.37 billion dollars in 2020, 6 China had the second-largest IFDI inflow in the world. Meanwhile, since the inception of BRI in 2013, the pace of Chinese OFDI has increased by 30% in the BRI region, ranking as the second-largest OFDI investor after the United States. Figure 1 reports China’s average per capita energy consumption trend, as well as IFDI and OFDI flows. These three factors have continuously grown during 2003–2019. However, China’s energy efficiency lags far behind OECD countries and similar developing countries such as India and Brazil (Binbin, 2020). Wang et al. (2019) pointed out that deviations from China’s balanced strategy to coordinate the development of IFDI and OFDI would harm both economic development and the environment. The increasing levels of international investments in China bring economic growth but aggravate the environmental burdens. Hence, it is imperative for academia to explore the effects of bilateral FDI on China’s energy efficiency, which has far-reaching implications for the world. Consequently, our research questions were formulated as follows: 1) Is there a causal link between China’s bilateral FDI and GEE? 2) Does bilateral FDI improve GEE? 3) What is the mechanism by which bilateral FDI affects GEE?

FIGURE 1. Average per capita energy consumption, IFDI and OFDI flows in the China.
China has been devoting more efforts to attracting IFDI and OFDI, whose spatial distributions are unbalanced. As of 2020, China’s IFDI and OFDI have amounted to 380.81 and 89.02 billion dollars, respectively, of which 68.62 and 80.58%, respectively, were estimated for the country’s eastern region, 22.18 and 10.98%, respectively, for the central region, and only 9.20 and 8.43%, respectively, for the western region. This suggests that IFDI and OFDI have been concentrated in the eastern region but have had almost no distribution in the western region, thus leading to unbalanced development. In addition, many scholars have found significant differences in the GEE among these regions (Xia and Xu, 2020; Yuan et al., 2020; Tang and He, 2021; Chen and Wang, 2022). Therefore, both GEE and bilateral FDI may have spatial agglomerations. Figure 2 shows roughly similar spatial distributions of GEE and the bilateral FDI coupling degree at the provincial level from 2003 to 2020. The two images in the first row of Figure 2 illustrate that while most cities have improved GEE, those with relatively low GEE are primarily concentrated in the eastern region. The two images in the second row of Figure 2 demonstrate that the spatial agglomeration of the bilateral FDI coupling degree is concentrated in the Bohai Rim and Yangtze River Delta Economic Zones, as well as the Pearl River Delta Region. However, cities with relatively higher GEE and bilateral FDI coupling degrees overlap in 2020, raising the following questions: 4) Why does GEE show such an uneven spatial distribution? 5) Is this unevenness affected by the spatial agglomeration of bilateral FDI? The visual evidence also shows that this unevenness requires any empirical analysis to incorporate spatial spillovers.
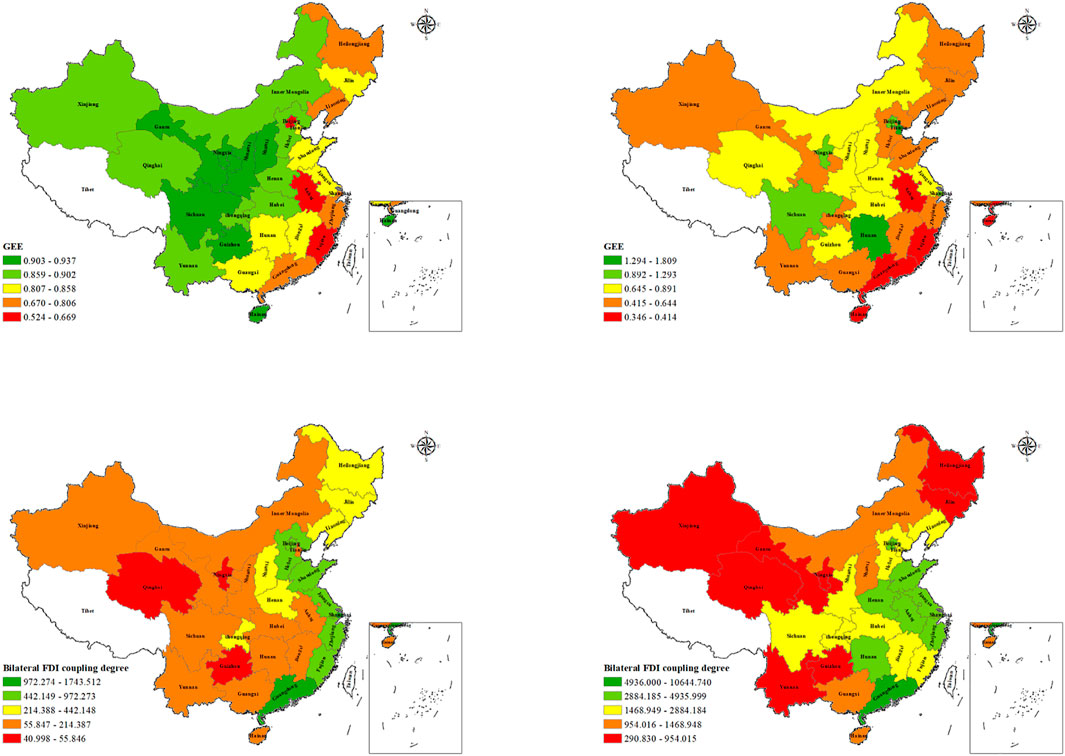
FIGURE 2. Comparison of the spatial distribution of green energy efficiency and bilateral FDI coupling degree in 2004 and 2020. Note: The two images in the first row show the distribution of GEE in China in 2004 (left) and 2020 (right). The two images in the second row show the distribution of bilateral FDI coupling degree in china between 2004 (left) and 2020 (right).
Differences in host and investor countries’ economic development and resource endowments tend to lead to different motivations for IFDI and OFDI. (Dunning and Lundan, 2008). Driffield et al. (2021) pointed out that analyses distinguishing between these motivations are limited. According to Dunning and Lundan (2008) definition, investment motivations can be divided into market seeking, efficiency-seeking, resource-seeking, and strategic-asset-seeking. Resource-seeking investments create local bases for mining or refining natural resources in foreign countries. Hence, such resource-seeking investments may strategically complement domestic energy consumption decisions, resulting in increased energy efficiency. However, Franco et al. (2008) pointed out that much research on international investment has tended to disregard this essential motivating factor. Therefore, the following question regarding the different investment motives was formulated: 6) Do the investment motives produce heterogeneity when influencing GEE in China?
The original motivation of this paper is based on the realistic background that China has experienced power outages in many places under the dual carbon constraints at the end of 2021. Energy efficiency has always been one of the issues facing China’s national development strategy. Promoting the development of clean and green energy such as nuclear power, hydropower, or wind power and how to improve the efficiency of such green energy has received extensive attention from the public and the government after the blackout event. At the same time, an economic activity closely related to the energy sector is international capital flows. In the past, foreign direct investment (IFDI) in China was mainly resource-seeking, which exacerbated China’s traditional energy consumption. Since China proposed the Belt and Road initiative, the scale of China’s outward foreign direct investment (OFDI) has also exploded. There is much literature discussing the impact of IFDI and OFDI on the environment and energy efficiency from various aspects. However, the effects of any economic phenomenon are not independent. Such a large-scale IFDI and OFDI in China may also have a coordinated development relationship, which scholars in the previous literature have observed. To our knowledge, there is currently no literature discussing the impact of coordinated development of bilateral FDI on green energy efficiency using spatial econometric estimation methods. Moreover, we also use a more comprehensive metric to measure GEE. To answer the above questions, we applied theoretical models, tools, and methods, such as the Granger causality test, impulse response function, coupling function, global Malmquist–Luenberger productivity index, and global Moran index, to perform several analyses, such as a spillover effect analysis based on the spatial weight matrix and spatial econometric model. The relationships among IFDI, OFDI, and GEE have been extensively examined from different perspectives. For example, IFDI and OFDI are correlated with green productivity (Tao et al., 2017; Xin and Zhang, 2020; Ahmad et al., 2021; Luo et al., 2021a), international investment concentration and the intensity of pollution (Stack et al., 2017; Zhou et al., 2019), technology spillover (Haider and Mishra, 2021), and dirty industry transfer (List and Co, 2000; Hao et al., 2020b). The main contributions of our research can be divided into theoretical and practical aspects. In terms of theoretical contributions, We constructed a theoretical model to explore how bilateral FDI affects GEE through spatial spillover effects, thereby supplementing the current literature on the effects of bilateral FDI on energy efficiency. Second, the SDM model is introduced according to the theoretical model, and the impact of CDFDI on the GEE in the local and surrounding areas is estimated using spatial measurement to provide more comprehensive evidence for the existing theories. In terms of practical contributions, firstly, the coupling function is used to measure the level of the coordination of IFDI and OFDI based on the interactive development of bilateral FDI. Second, to avoid measurement errors caused by selecting a single pollutant, we utilize multiple undesired output indicators covering eight pollutants of industrial wastewater, industrial solid waste, industrial soot and dust, CO2, COD, NOX, SO2, and PM 2.5. More importantly, this study contributes to energy firms’ economic and policy orientations by investigating the moderation effects of technological diffusion, nationalization, and environmental regulation in the relationship between bilateral FDI and GEE, demonstrating the similarities and differences between these mechanisms. Finally, given the diversity of motivations for bilateral FDI, we identified its various drivers by conducting a heterogeneity analysis to analyze bilateral FDI’s effects on GEE comprehensively.
The remainder of the study is organized as follows. In Section 2, the literature review is presented. Section 3 constructs a theoretical model and develops testable hypotheses. This is followed by a discussion of data and methodology in Section 4. The empirical results and discussion are shown in Section 5. We finally conclude this study and clarify the research policy recommendations in Section 6.
There are three separate but intertwined strands of research related to this paper: firstly, the literature on green energy efficiency; secondly, the literature on the impacts of IFDI and OFDI on green energy efficiency; thirdly, the literature on the interactions between IFDI and OFDI, particularly bilateral FDI with different motivations bringing about the heterogeneous effects.
According to the input and output factors, energy efficiency can be divided into single energy efficiency and total factor energy efficiency (Zhu and Zheng, 2019). For the definition of the single energy efficiency, energy efficiency has been explained by the services produced per unit of energy input (Sills and Briggs, 2009). Most of the current research on energy efficiency considers desired output from an economic point of view and does not consider undesired output such as environmental pollution, so the measurement results overestimate energy efficiency (Wu et al., 2020). Some scholars have introduced the undesirable output from energy consumption into the efficiency measurement called green energy efficiency or total factor energy efficiency (Tang and He, 2021; Meng and Qu, 2022). This paper defines green energy efficiency according to the output method, which refers to maximizing the output achievable after comprehensively considering energy input and environmental damage in production activities. Green energy efficiency considers both economic and environmental benefits, which well reflects the sustainable development capacity of the economy.
At present, most of the studies related to green energy efficiency concentrate on two issues: First, how to measure green energy efficiency. Li and Lin (2017) pointed out that energy intensity is the most common indicator because this method is easy to calculate and has high data availability. Hu and Wang (2006) were the first to propose an analytical framework for total factor energy efficiency measurement. However, it ignores the rigid constraints of natural resources and does not consider the environmental pollution caused by energy consumption, so it is difficult to accurately reveal the actual situation of green energy efficiency (Tang and Li, 2019). Thus, it was gradually replaced by more reasonable methods. The provincial energy efficiency estimation methods mainly include stochastic Frontier analysis (SFA) and data envelopment analysis (DEA). SFA assumes that deviations from the decision-making units (DMU) Frontier combine random interference and technical inefficiencies. The advantage of SFA is that it considers the specific production process and the effect of random errors on efficiency (Ghosh and Kathuria, 2016). However, SAF lacks rigorous theoretical support due to strict constraints on random error distribution and the subjectivity of production function assumptions. SFA can only measure the technical efficiency of a single output and cannot handle the technical efficiency of multiple outputs (Luo et al., 2019). DEA is a good way to measure productivity (Wang and Chen, 2020). DEA can evaluate the relative effectiveness of DMU with multiple inputs and multiple outputs. However, the DEA method is static. It can only analyze time series or data of the same period and cannot solve the problem of multi-period efficiency evaluation. Tone (2001) proposed a Slack-based model (SBM). SBM is an essential innovation in DEA efficiency analysis, but it still has its limitations: DMU with efficiency values greater than 1 are indistinguishable. Some studies recommend that the undesired energy consumption output be considered when calculating energy efficiency to avoid deviation (Chang, 2013; Song et al., 2016; Xiao and You, 2021). This method is also the mainstream academic research framework for measuring energy efficiency (Chang, 2013; Tang and He, 2021). As an improvement over SBM, Super-SBM incorporates the undesired output into the efficiency measure, performing a secondary evaluation of the DEA effective DMU. It is convenient to distinguish the difference in efficiency value, evaluate its actual efficiency level, and then perform a more accurate sorting. In recent years, the Super-SBM model has been successfully applied to measure the efficiency of DMU with complex input-output metrics (Guo and Liu, 2022). Given this advantage, this study adopts Super-SBM for efficiency measurement.
Second, recent studies have been devoted to studying the influencing factors when considering the driving forces of green energy efficiency. Witajewski-Baltvilks et al. (2017) measured the impact of induced technological change on the improvement of energy efficiency based on the general equilibrium model. Furthermore, Jia et al. (2018) and Zhang and Kong (2022) studied the effect of energy-biased technological progress on energy efficiency. Wu et al. (2020) and Hao et al. (2020a) evaluated the impact of specific socioeconomic, environmental changes and environmental regulations on green energy efficiency in different regions. Other researchers focused on the green energy efficiencies of China’s industrial sectors. Chen et al. (2018) used the global Malmquist-Luenberger index to ascertain the determinants of green productivity from the perspectives of institutions and industrial structures but focused on industry sectors. Chen and Duffie (2021) divides infrastructure development into transportation and power infrastructure and analyzes its impact on China’s inter-provincial green total factor energy efficiency gap in manufacturing. Despite the remarkable phenomenon of pollution agglomeration in China (Fetscherin et al., 2010), the above studies have treated each region and sector as an isolated entity and ignored the role of spatial dependence. Given this, this research concentrated on the level of China’s regional green energy efficiency and its temporal and geographical spatial distribution.
In the existing literature, the relationship between international trade, environmental pollution, and green energy efficiency has been a hot topic in discussions (Dong et al., 2019). After Copeland and Taylor (1994) constructed a static model of North-South trade to study the relationship between income, environmental pollution, and international trade, researchers mainly discussed the effect of capital factor flow on the environment and energy from the one-way perspective of IFDI and OFDI. Following the “Pollution Haven Hypothesis” and the “Pollution Halo Hypothesis,” many articles have discussed the relationship between IFDI and green energy efficiency. They have provided inconclusive evidence on the effect of IFDI on green energy efficiency. For instance, Ren et al. (2014) and Haider and Mishra (2021) show that IFDI is one cause of China’s increased non-fossil fuel in primary energy consumption, leading to carbon emissions and environmental pollution. Bu et al. (2019) and Pan et al. (2020a) also found that IFDI could negatively affect green energy efficiency. By contrast, Zhang et al. (2020) uses provincial data from 2009 to 2017 to find that IFDI has a pollution halo effect in China. The positive effect of IFDI on green energy efficiency is also validated by Zhou et al. (2020) and Luo et al. (2021a).
In recent years, with the deepening of the BRI and international production capacity cooperation, scholars have also begun to investigate the effect of OFDI on green energy efficiency. Generally, the majority of the studies have examined the reverse green spillover effects of the OFDI. Pradhan and Singh (2008) found that reverse technology spillovers from India’s OFDI have an expected favorable impact on R&D intensity. Li L. et al. (2017) suggested that the potential reverse technology spillovers from OFDI could boost domestic innovation in China. Then, Mahadevan and Sun (2020) deduced that this could be related to low-carbon technology development. However, OFDI will increase environmental pollution and energy depletion in the short term due to crowding-out effects caused by large-scale investment (Hao et al., 2018; Luo et al., 2021b).
In addition, some scholars have introduced the spatial model to analyze the spatial correlation in the context of pollution and energy depletion. According to Jiang et al. (2014) and Yu D. et al. (2021), energy intensity and international investment have a strong spatial spillover effect across the regions. Even though some pieces of literature have investigated the spatial effect between IFDI, OFDI, environmental pollution, and carbon productivity (Pan et al., 2020b; Yu P. et al., 2021; Wang F. et al., 2022), the spatial dependence has been largely ignored in the research on the impact of green energy efficiency. Furthermore, there is also a lack of convincing evidence for the spatial spillover effect.
Prior research has found that OFDI in emerging market MNE (EMNE) is driven by the presence of IFDI (Li H. et al., 2017). Hertenstein et al. (2017) argues that the strong presence of business networks developed through prior IFDI constitutes a substantial home country effect, influencing the OFDI strategies of China. Chen et al. (2020) also provide insights into the complex effect of IFDI on OFDI from a contingent and dynamic perspective. However, the above studies focus on the effects of IFDI and OFDI. Only a few pieces of literature have examined the environmental impacts of bilateral FDI. Wang et al. (2019) combine IFDI and OFDI to measure bilateral FDI coordinated development. They found that bilateral FDI coordinated development has presented a significant braking effect on carbon emissions.
Investment motivation is an essential factor influencing IFDI and OFDI’s quality (Franco et al., 2008). Although it has been many years since Dunning and Lundan (2008) highlighted that various motivations underlie FDI, analyses that differentiate between them are pretty limited and fail to account for this heterogeneity fully (Lv et al., 2021). Zhang and Roelfsema (2014) found that Chinese OFDI in developing countries was mainly motivated by a desire to exploit regional markets and secure natural resources, whereas, in developed economies, motivations were more related to exploiting network linkages and acquiring strategic resources. For example, Chinese natural and strategic resource investments are more likely to attract industries with a higher resource intensity. However, it is not sufficiently widely presented in energy efficiency studies.
Overall, the subject matter discussed in this paper is fully justified, and the perspectives, theoretical models, and applied research methods constitute a new and original approach to studying bilateral FDI and green energy efficiency in the region of China.
This paper starts from the regional production function, constructs a spatial expansion model, and proves the spatial relationship between bilateral FDI and green energy efficiency. For simplicity, we suppose that the final green energy output Yi(t) of province i, produced under perfect competition by labor Li(t) and a continuum of intermediate inputs x. We follow Broda et al. (2017) by writing the production function as:
where Ai(t) is a productivity parameter, α ∈ [0, 1], 1 − α represents the share of labor input in the output, Qi(t) is our measure of product variety, θ ∈ [0, 1] is the elasticity of substitution of intermediate energy goods xi,θ, with a higher θ corresponding to more substitutable inputs. For the convenience of analysis, suppose that all xi,θ enter the production function in equal proportions and xi,θ have the same price, that is, xi = xi,θ. Using this fact, Eq. 1 can be simplified to:
Furthermore, we assume that each energy xi,θ is produced one for one by using the final energy good as an input. That is, the aggregate capital stock is given by Ki(t) = Qi(t)xi(t). Using this fact, we can rewrite Eq. 2 as:
From Eq. 3, we can specify the green energy efficiency as follows:
Plugging Eq. 3 into Eq. 4 yields:
In Eq. 5, the source of green energy efficiency is decomposed into two parts: the green technological innovation component embodied in the term in Ai(t)1−α and the diversification component captured by the term in Qi(t)(1−θ)α/θ. In order to capture the green technological innovation component, we draw on Cem and Wilfried (2011) by defining Ai(t)1−α as:
where τ ∈ [0, 1] represents the degree of green technological diffusion. We suppose that the technical level of xi,θ is a negative function of the technological gap of province i with respect to its technological Frontier, which is defined in this paper as the geometric mean of the technological level of all provinces denoted by Gj(t), for j = 1, 2, … , N. Moreover, we assume that the interaction term τwij are non-negative, finite and non-random, indicating that the degree of green technological diffusion increases as the distance between regions decreases. Putting Eq. 6 into Eq. 5 yields:
As the follower, we assume that Chinese province j with IFDI and OFDI has absorbed the advanced green energy technology from the host country with technological Frontier (Luo et al., 2021a; Xiao and You, 2021). Meanwhile, province j’s level of green energy productivity will be related to the number of contacts that the intermediate goods trade and cross-regional investment activities in neighboring province i. Explicitly, we have:
where δ > 0 and ϕ > 0 are the elasticities of coupling development of bilateral FDI (CDFDI) and green energy technology level (T). The reason why the elasticity is greater than 0 is that international capital flow, as an important channel of international technology spillover, can not only solve the dilemma of the host country’s lack of funds, accelerate the industrialization of the host country but also improve production efficiency through the effect of technology diffusion (Ren et al., 2022). Regarding the technology diffusion effect, some scholars have pointed out that overseas subsidiaries can promote GEE after acquiring foreign technology through the demonstration effect, competition effect, and industrial linkage effect (Zhou et al., 2019; Hao et al., 2020b). In addition, MNCs with market-seeking motives will choose to establish subsidiaries directly in the host country for production and sales. The host country has developed mature products and production processes, which have played a good role in demonstrating local production. Employees continue to accumulate production experience through learning by doing (Liu et al., 2022). wij ∈ [0, 1] is the distance weight between province i and j, reflecting the degree of spatial correlation between provinces. When i ≠ j,
Taking Eq. 9 in logarithm form and arranging the terms, we obtain:
It can be seen that the closer τ is to 1, the more significant the impact of bilateral FDI coupling development and green technology progress on green energy efficiency. The above proofs show that bilateral FDI coupling development has a technological spillover, which will promote the improvement of local technological capabilities. Such technological progress will promote the growth of green energy efficiency in the region and improve the green energy efficiency of adjacent regions through the spatial spillover mechanism. Therefore, we propose the following hypotheses:
Hypothesis 1. There is a spatial spillover effect between bilateral FDI and green energy efficiency.
Hypothesis 2. Bilateral FDI can help improve green energy efficiency in the provinces where international investment is made.
Hypothesis 3. Bilateral FDI not only helps to promote the improvement of green energy efficiency in the region but also improves the neighboring provinces’ green energy efficiency through the technological diffusion effect.
The impacts of institutional attributes embedded in developing countries on China’s international investment strategy have been proved in previous studies (Ramamurti and Hillemann, 2017). Among these characteristics, a firm’s ownership difference is the most pronounced (Yu P. et al., 2021). Some state-owned firms prioritize diplomatic mission and policy orientation over economic orientation when making an investment decision. Consequently, Eq. 6 can be rewritten as:
where ς > 0. Compared with non-state-owned enterprises, state-owned enterprises usually have convenient OFDI, technology, and skilled labor channels due to their scale advantages and unique ties with the government. When facing stricter energy cost constraints, they can make them more likely to improve efficiency (Yu P. et al., 2021). Some studies suggest that state-owned ownership can promote the internationalization of enterprises, arguing that the government can provide support to make up for the competitive disadvantage of enterprises in foreign markets. This support takes various forms, including financing support such as grants, loans, and equity financing from governments (Bai et al., 2021). On the other hand, countries worldwide are increasingly emphasizing green concepts in foreign investment and cooperation. As an essential means to guide the green development of China’s economy, the green credit policy can influence the overseas investment decisions of Chinese enterprises and improve the efficiency of enterprises’ overseas investment, especially for state-owned enterprises (Zhang et al., 2022). Then, we follow the above calculation process and obtain:
where ψ > 0 is the elasticities of the regional nationalization (S). Then, we repeat the calculation process:
Equation 13 shows that (δ/1 + ς) > 0, (ψ/1 + ς) > 0, (ςδ/1 + ς) > 0 and (ςψ/1 + ς) > 0 when ψ > 0. Therefore, we propose the following hypothesis:
Hypothesis 4. Bilateral FDI is moderated by nationalization to improve local and nearby regions’ green energy efficiency.
Meanwhile, environmental regulation can significantly affect a company’s investment strategies and the diffusion of green technology (Zhang et al., 2020; Luo et al., 2021b). Many scholars believe that stringent command-and-control environmental regulations can improve the entry barriers of IFDI and transfer energy-intensive industries to other countries through OFDI. Thus, we can also rewrite Eq. 6 as:
where ξ > 0. Then, we follow the above calculation process and obtain:
where Φ is the elasticities of environmental regulation (E). The neoclassical approach argues that increasing environmental regulations could lead to additional compliance costs, crowd out R&D investment, and limit progress in green technology innovation (Liu L. et al., 2021). Secondly, when local governments implement the command-and-control environmental regulation policies formulated by the central government, they may adopt selective, symbolic, and passive enforcement of environmental regulation, which makes environmental regulation appear execution deviation, which in turn leads to differences in the intensity of environmental regulation enforcement in different regions. The effect of command-and-control environmental regulation depends mainly on the strictness of the implementation of environmental administrative agencies. The deviation of command-and-control environmental regulation implementation is the main reason for the unsatisfactory implementation of environmental regulation policy and the existence of environmental pollution problems. Moreover, since China’s environmental governance mainly uses catalytic combustion to treat waste gas and waste, this will increase CO2 emissions, thereby reducing green energy efficiency (Hao et al., 2020b). Most energy-intensive enterprises belong to capital-intensive industries with a high proportion of investment in fixed assets, and the related environmental technology or pollution control costs are relatively high. Therefore, energy-intensive enterprises have a higher tolerance for the intensity of command-and-control environmental regulation than cleaner production enterprises. Enterprises that do not implement environmental regulatory policies can also bear punitive environmental taxes and environmental governance costs. Hence Φ < 0. Equation 15 shows that (δ/1 + ξ) > 0, (Φ/1 + ξ) < 0, (ξδ/1 + ξ) > 0 and (ξΦ/1 + ξ) < 0 when Φ < 0. It can be seen that the stricter the environmental regulation, the greater the inhibitory effect of the coupled development of bilateral FDI on green energy efficiency. Therefore, we propose the following hypothesis:
Hypothesis 5. Bilateral FDI is more likely to hinder green energy efficiency when command-and-control environmental regulation is more stringent.
All the analyses carried out in this paper were based on panel data from 30 provinces (except Tibet, Hong Kong, Macao, and Taiwan due to data availability) from 2003 to 2020. The study period was determined because the Ministry of Commerce of China began to publish data on foreign direct investment in various provinces in 2003, and the latest statistical yearbook is up to 2020. Therefore, this paper selects the period from 2003 to 2020 as the research period. All data are extracted from the China Statistical Yearbook, China Energy Statistical Yearbook, China Environment Yearbook, China Statistical Yearbook on Science and Technology, CNIPA (China National Intellectual Property Administration) database and Statistical Bulletin of China’s Outward Foreign Direct Investment. The data was deflated accordingly in the calculation process, and the missing years were filled with the average method.
To examine the effect of bilateral FDI on the green energy efficiency, we included other variables that may affect the latter an estimated the following equation by ordinary least squares (OLS):
where, i = 1, 2, … , N. denotes the province, t = 1, 2, … , T denotes the time period, GEEit denotes the green energy efficiency, CDFDIit is the coordinated development levels of IFDI and OFDI calculated by the coupling function. Zit, ηi, γt, and ɛit represent the control variables, individual effect, time effect and the random error term, respectively.
Given the existence of spatial correlation, either strong or weak, conventional econometric techniques, such as ordinary least squares (OLS), would be less efficient. To correct this bias, we extend Eq. 16 with a general nesting spatial:
where ρ is the spatial autocorrelation coefficient, Wij are the elements in an N × N spatial weight matrix describing the spatial arrangement of the provincial units. If ρ = 0, β1 = 0 and λ = 0, Eq. 17 is just Eq. 16. If ρ = 0, β1 = 0 and λ ≠ 0, Eq. 17 is a Spatial Error Model (SEM). If ρ ≠ 0, β1 = 0 and λ = 0, Eq. 17 is a Spatial Auto Regression Model (SAR). If ρ ≠ 0, β1 = 0 and λ ≠ 0, Eq. 17 is a Spatial Auto Correlation Model (SAC). If ρ ≠ 0, β1 ≠ 0 and λ = 0, Eq. 17 is a Spatial Dubin Model (SDM). This paper’s selected model mainly verifies the corresponding model parameters through the spatial regression of several models, including the Lratio test, Wald test, AIC, and BIC criterion.
However, a mutual causality between the dependent and independent variables exists due to the spatial lag term being included in the model, which leads to endogeneity problems (Wang et al., 2019). In addition, numerous factors affect green energy efficiency. Endogenous problems can also arise due to the omission of significant independent variables. Hence, endogenous problems should be comprehensively considered in the empirical analysis. According to Arellano and Bond (1991) present a system generalized method of moments (SYS-GMM) estimation, we suggest using the lagging term of the endogenous independent variable as the instrumental variable of different terms to control the endogeneity since it satisfies the conditions of strictly exogenous and highly correlated with endogenous variables.
Considering the interaction mechanisms of technological diffusion, nationalization, environmental regulation, and bilateral FDI on affecting green energy efficiency, Eq. 17 can be extended to Eq. 18 according to Eqs. 10, 13, 15:
where lnMij as moderating variable, including technological diffusion, nationalization, and environmental regulation.
Before regression analysis, we need to test the spatial correlation between bilateral FDI and green energy efficiency. Moran’s I index can test the positive or negative spatial correlation between adjacent provinces (Moran, 1950; Yu D. et al., 2021). The specific calculation formula is as follows:
where I ∈ [ − 1, 1] is the Moran’s I index, if it is greater than 0, it indicates that there is a positive spatial correlation, that is, provinces with high (low) green energy efficiency are clustered together with provinces with high (low) green energy efficiency, and vice versa; if it is equal to 0, it indicates that provinces with high (low) green energy efficiency are randomly distributed without spatial clustering. Wij is the element of the spatial weight matrix, whose definition is similar to that in Eq. 17. xi and xj are the green energy efficiency or coordinated development levels of bilateral FDI of provinces i and j, respectively, and N is the number of provinces. Since the geographic distance weight matrix reflects the relationship between individuals regarding geospatial. The interaction frequency between the two provinces decreases as their distance increases. Thus, we set the spatial weight matrix of geographic distances in the nested form:
Green energy efficiency (GEE). The dependent variable in this paper is green energy efficiency. Unlike traditional energy measurement, GEE considers traditional input-output variables and incorporates energy consumption and environmental costs into the production efficiency measurement framework. Because pollution emissions mainly come from energy use in production and life. Although the use of energy and other elements will create output, due to technical or management reasons, it will lead to low energy utilization efficiency or incomplete energy utilization, eventually leading to pollution emissions (Meng and Qu, 2022). Therefore, not only the desirable output of the production process but also the undesirable output of the production result is taken into account when measuring GEE. The most popular methodology to measure GEE is to use the Super-SBM directional distance function to calculate the Global Malmquist-Luenberger index (GML) to estimate GEE considering energy input and pollutant emissions (Tang and He, 2021). This paper selects three input variables: energy, labor, and capital. And two output variables, including GDP as the desirable output variable and eight pollutants as the undesirable output variable. The detailed measurement of the method is as follows.
Energy. This paper uses total energy consumption as the indicator for energy in our study. Total energy consumption refers to the consumption of energy of various kinds by the production sectors in the province in a given period. It includes coal, coke, gasoline, kerosene, diesel, fuel oil, crude oil, natural gas, and electricity.
Labor. Considering the effective labor force that actually participates in the production process, this research selects year-end employees in each province region as the labor input variable.
Capital. This paper uses the perpetual inventory method to calculate capital stock. The formula is as follows: kt = (1 − Ω)kt−1 + ct/pt, where kt and kt−1 represent the capital stock of each province in years t and t − 1. Ω is the depreciation rate with set to 9.6%. ct is the fixed assets investment of period t. pt is the fixed assets deflator. The base period capital stock is k0 = c0/(Ω + g), where g is replaced by the average growth rate of expenditures of various provinces from 2003 to 2020, which could be calculated by
Desirable output. We want to maximize output using the inputs of energy, labor, and capital resources. According to the method of Meng and Qu (2022), this paper uses real GDP (calculated by provincial nominal value and price index) as the desired output.
Undesirable outputs. Since traditional analysis only considers the desirable good output (e.g., the production process) while ignoring the possible undesired bad output (e.g., environmental pollution). When improving green energy efficiency, we want to maximize expected output while minimizing undesired output, i.e., considering an increase in good output and a decrease in bad output. At present, the consideration of environmental pollution caused by energy consumption is limited to one or several aspects such as CO2, SO2, industrial wastewater, solid waste and other aspects of the comprehensive environment are less involved. According to the Bulletin on the Second National Census of Pollution Sources, China has many pollution classifications, and they are different from each other. Chemical oxygen demand (COD) and total nitrogen emissions are the highest among them. The sources of these water pollution emissions are mostly energy-intensive enterprises. If these are not accounted for in undesired outputs, measurement bias will result. Meanwhile, a single pollutant could hardly reflect the real situation of undesired output in the overall green energy performance of the region, given the enormous regional dispersions in industrial structure, resource endowment, and geographic features. Therefore, this paper incorporates eight environmental pollutants as an undesirable output in the framework used to calculate the green energy efficiency, including industrial wastewater, industrial solid waste, industrial soot and dust, CO2, COD, NOX, SO2, and PM 2.5.
Coordinated development of bilateral FDI (CDFDI). The bilateral FDI has a similar feedback mechanism to the physical capacity coupling system (Wang et al., 2019). Therefore, this paper uses the capacity coupling system model in physics to express the coupling degree of bilateral FDI as follows:
where CDit is the coupling value, IFDIit and OFDIit represent the IFDI flow and OFDI flow in province i, respectively. α and β are specific weights. We believe that IFDI and OFDI are complementary and equally important. Therefore, both α and β are set to be 0.5. ν is the adjustment parameter in the coupled system model, and its’ value range is ν ∈ [2, 5]. We set ν to be 2 drawing on Wang et al. (2019). Due to the difference between IFDI and OFDI, there will be a result that the value of the bilateral FDI is low and the coupling degree is high. Therefore, the degree of coordination based on coupling needs to be considered. In this paper, the degree of coupling coordination means that IFDI and OFDI have a high level and have excellent complementarity. Thus, this paper introduces coordinated development indicators as follows:
Technological diffusion (TD). Technological diffusion refers to the positive spillover effects of environmentally friendly technologies via bilateral FDI. In other words, enterprises can obtain advanced technology and resources through bilateral FDI, thereby gradually realizing the dissemination of advanced green technology from the host country to the home country. The specific manifestation of technological diffusion is the transfer of advanced environmental technologies through innovative collaboration and international exchanges (Hao et al., 2020b). Therefore, we use the amount of patent authorization to measure technological diffusion.
Nationalization (SOE). In China, state-owned enterprises and private enterprises are the main economic part. Despite the economic reform initiated in 1978, state-owned enterprises are still the dominant economic power in China. We calculate their share in total industrial enterprise assets to reflect their importance in the Chinese economy, i.e., SOE is measured by the share of state-owned enterprises in total industrial assets.
Environmental regulation (ER). Environmental protection laws are more direct and effective environmental regulations (Kang et al., 2021). China’s environmental regulation involves the central government, local governments, industries, and enterprises. Specific measures include command and control, market incentives, and public participation. Among them, the command and control policy has been the primary means of environmental protection in recent years (Zhang et al., 2021), and the government’s coercive force implements it, the transmission is fast, and the implementation effect can be determined. Therefore, this paper uses text analysis to collect the cumulative number of local environmental protection laws, regulations, and standards promulgated in the year from the government websites of various provinces and cities in China as a proxy variable for environmental regulation.
Based on previous studies, we design the following control variables that may affect the relationship among our independent, moderating, and dependent variables to enhance the accuracy of empirical results. 1) Industrial structure (STR). If the industrial composition is dominated by pollution and energy-intensive industries, the energy consumption will be enormous. Given the characteristics of the industrial structure, the secondary industry is dominated by the industrial sector, which is characterized as resource-intensive. Therefore, STR is denoted by the proportion of the secondary industry’s value-added to GDP (Hao et al., 2020b). 2) Infrastructure (INF). The allocation of infrastructure construction (e.g., public transportation, shared bicycles) may produce agglomeration effects, thereby reducing energy consumption (Muhammad et al., 2020). We use the road mileage to measure INF. 3) Trade (TRA). Following Razzaq et al. (2021), we use the ratio of imports plus exports to GDP to measure TRA. 4) Energy price (EP). The energy market’s supply and demand conditions are driving forces behind energy pricing, production, and consumption. Higher energy prices will lead to lower energy consumption and reflect a degree of high energy scarcity (Ebaid et al., 2022). Since the price data by energy type in most Chinese provinces are not counted, raw materials and fuel price indexes are selected to represent the EP. 5) Energy structure (ES). Since China’s energy structure largely determines its energy consumption, ES is measured by the ratio of coal consumption and coke consumption to total energy consumption.
Descriptive statistics for key variables are present in Table 1. This paper presents the mean, median, standard deviation, minimum and maximum values of each variable used in the analysis. In addition, all the variables are in logarithmic form to reduce the impact of potential heteroscedasticity.

TABLE 1. Descriptive statistics for key variables.
Based on empirical strategy, a study was conducted, the results of which are represented in this section with a breakdown into several stages.
Figure 3 reports the distribution of green energy efficiency in different provinces during the period 2004–2020.7 It is evident that distinct differences exist between provinces-for example, Beijing and Tianjin with higher GEE for nearly 16 years and Shanghai, Jiangsu, and Hainan followed. These provinces had the greatest considerable distribution difference in GEE, meaning that their green energy efficiency achieved leapfrog development. In contrast, the distributions of GEE in Jilin, Jiangxi, Guizhou, and Yunnan were the most concentrated, which means slow development of green energy efficiency. More than half of the provinces’ medians were greater than 1 in the sample period, except Hebei, Shanxi, Inner Mongolia, Jilin, Heilongjiang, Fujian, Shandong, Guangdong, Guangxi, Gansu, Ningxia, and Xinjiang, which are almost in the central and western regions (central including Shanxi, Jilin, Heilongjiang, Anhui, Jiangxi, Henan, Hubei, and Hunan; western including Inner Mongolia, Guangxi, Chongqing, Sichuan, Guizhou, Yunnan, Shaanxi, Gansu, Qinghai, Ningxia, Xinjiang). In particular, the provinces with a significant difference between the 25th and 75th percentile are Beijing, Tianjin, Hebei, Shanxi, Liaoning, Shanghai, Jiangsu, Fujian, Hubei, Hunan, Guangdong, Hainan, Sichuan, and Qinghai, of which nine provinces are in the east region (including Beijing, Tianjin, Hebei, Liaoning, Shanghai, Jiangsu, Zhejiang, Fujian, Shandong, Guangdong, and Hainan). It can be shown that the GEE in the eastern is significantly higher than that in the central and western regions. The possible reasons for this may be attributed to the higher level of economic development, the closer attention paid by local governments, and the application of energy-saving technologies. In addition, it can also be seen that the GEE in regions shows a trend of convergence, which indicates that there may be spatial correlations in GEE.
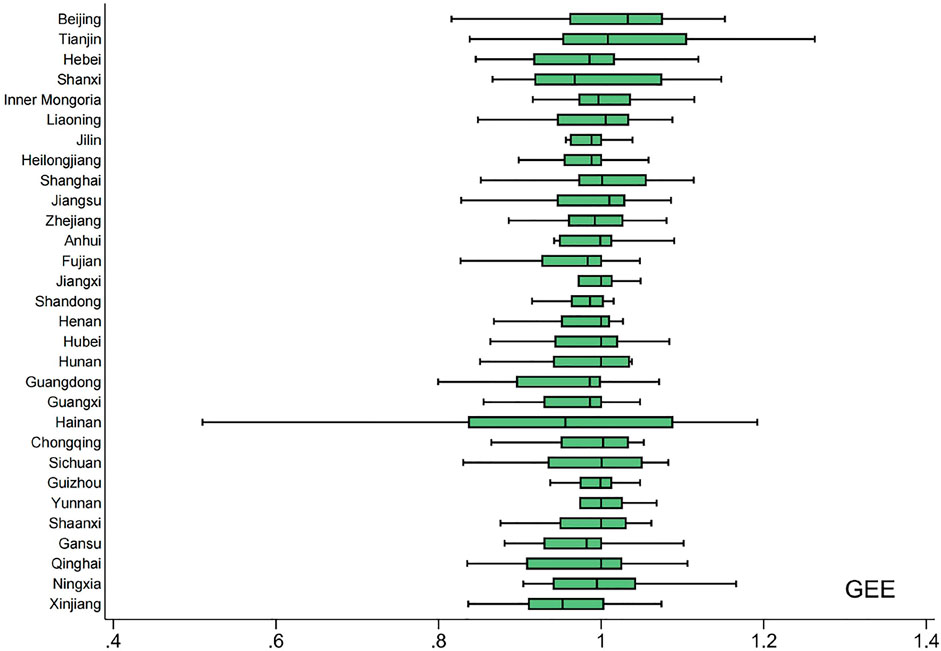
FIGURE 3. Distribution of GEE for each province between 2004 and 2020.
In order to comprehensively explore the characteristics of time evolution and clarify the driving force of China’s GEE, this paper studies the changing trend and driving force of GEE from 2004 to 2020 based on GML index decomposition, as shown in Figure 4. On a time scale, GEE has generally developed well in China, showing a trend of cyclical fluctuations. Among them, the drastic changes in 2009 were affected by the external financial crisis, and the fluctuations in 2013 and 2017 were affected by changes in the domestic economic structure and development model. From the perspective of decomposition components, technological progress (GTECH) is consistent with the changing trend of GEE. In contrast, technical efficiency (GEFFCH) is opposite to the change of GEE, which shows that GTECH has a stronger role in promoting GEE than GEFFCH (Yu D. et al., 2021), i.e., GTECH plays a leading role in developing China’s green energy efficiency. It is worth noting that GEE and GTECH declined to a certain extent in 2017, and the movements of GEE and GEFFCH have converged since 2017, indicating that slower GTECH mainly caused the decline in GEE and the potential impact of GEFFCH was gradually emerging. It also indicates that the Chinese government should not only continue to focus on GTECH but also stimulate the development potential of green energy technological efficiency and make extra efforts in green energy development to improve GEE further.

FIGURE 4. Time evolution and driving force decomposition of GEE in China.
Since the impulse response function can describe the dynamic effect of one variable on another variable by exogenous shocks, the coordination effect between IFDI and OFDI is investigated by the impulse response function. This paper uses Akaike’s information criterion (AIC), Schwartz’s Bayesian information criterion (BIC), or Hannan and Quinn information criterion (HQIC) to select the lag order. According to Table 2, the optimal lag order is 1.
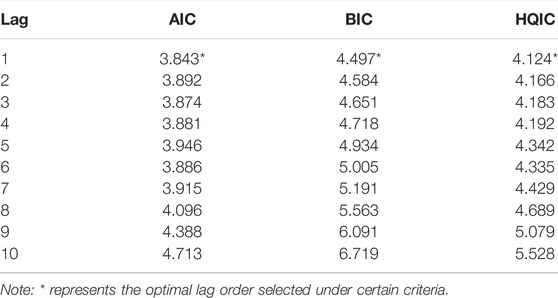
TABLE 2. Selection order criteria for panel VAR.
This paper considers the endogeneity of variables, individual effects, and time effects. The parameters are estimated using the generalized moments of the system, and the fixed effects are eliminated through the forward difference Hermlet transform in the estimation process. Through Monte Carlo simulations 999 times, the impulse response function graphs of IFDI and OFDI are obtained, as shown in Figure 5. It can be seen from Figure 5 that under an exogenous shock of one standard deviation, the change in IFDI will stimulate OFDI to show a significant positive change in the first period, and this positive impulse response gradually converges to 0 after the fifth period. Likewise, the shock effect of OFDI on IFDI is the same as above. In order to verify whether there is a coordination effect between IFDI and OFDI, this paper estimates whether there is a Granger causality between IFDI and OFDI by estimating the fixed effect model of PVAR and using the coefficient of the Wald test. According to Table 3, it can be seen that there exists a Granger causal relationship between IFDI and OFDI, which further indicates that there is a significant dynamic coordination effect between them. To sum up, IFDI can promote OFDI, and OFDI is also beneficial to increasing IFDI.
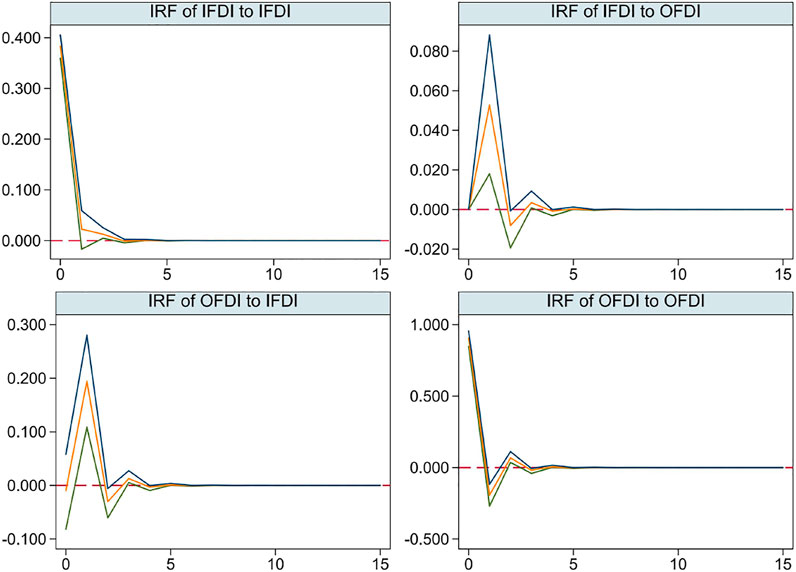
FIGURE 5. Impulse-responses for 1 lag VAR of IFDI and OFDI.
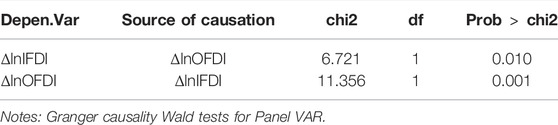
TABLE 3. Results of Granger causality test.
Before estimating spatial econometric models, it is essential to test for spatial effects in our sample. Besides the visual evidence (see Figure 2), this paper also implements the spatial autocorrelation Moran’s I test for provincial GEE and the coordinated development of bilateral FDI (Moran, 1950). Under the null hypothesis of Moran’s I tests, the distributions of GEE and the coordinated development of bilateral FDI in different provinces are spatially independent. Table 4 summarizes the test results. From the perspective of the global correlation test, most Moran index of CDFDI and GEE was significantly greater than 0 and rejected the null hypotheses of no spatial effects, indicating the existence of spatial correlation in our sample.
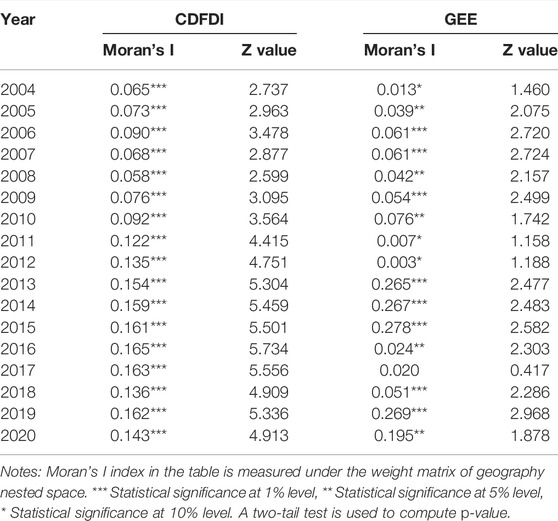
TABLE 4. Global spatial correlation between CDFDI and GEE in 2004–2020.
Furthermore, this paper draws the Moran scatter diagram of the local correlation test. For simplicity, this paper only shows Moran scatter plots for 2005, 2010, 2015, and 2020, as shown in Figure 6. There are four quadrants in the Moran scatter diagram, and they correspond to four types of agglomeration, including high-high, low-high, low-low, and high-low. For example, high-high refers to a high-value agglomeration province in the first quadrant. Other corresponding high-value provinces surround a province with a high GEE. According to Figure 6, the Moran values of GEE were significantly greater than 0, indicating that they were significantly positively spatially correlated. In addition, most provinces are located in the first and third quadrants, demonstrating that GEE presents the high–high and low–low agglomeration phenomenon. The spatial econometric model will be used for empirical analysis in the next. So far, Hypothesis 1 of this paper has been verified, i.e., there exists a spatial spillover effect between bilateral FDI and green energy efficiency.
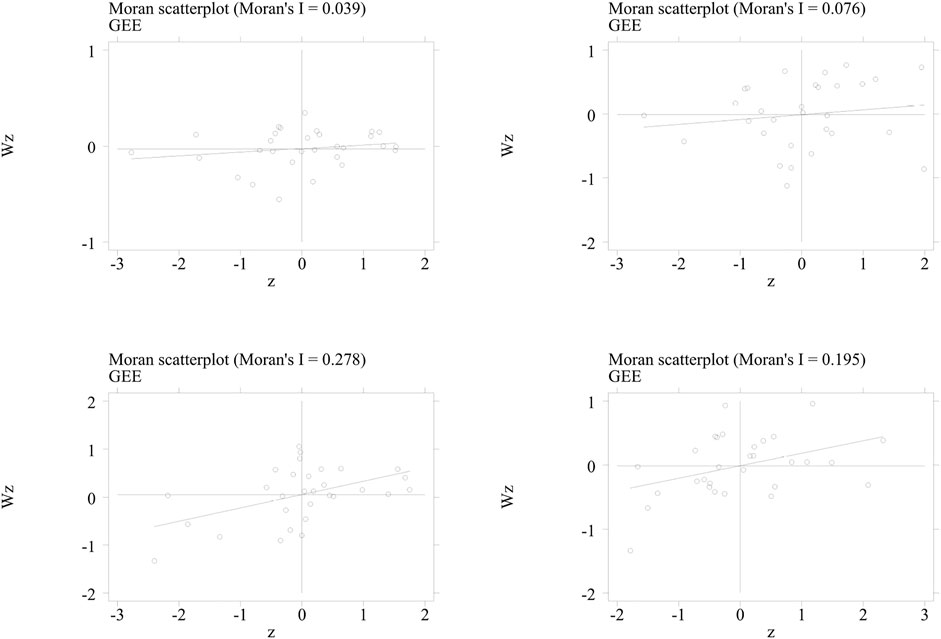
FIGURE 6. Moran scatter plot of GEE for China in 2005, 2010, 2015 and 2020.
A series of tests in this paper are carried out to select an appropriate econometric model. The first step in the model specification is to estimate a non-spatial model and use the Lagrange Multiplier (LM-Lag and LM-Error) and robust Lagrange Multiplier test to determine whether to establish a spatial lag regression model or a spatial error model in Eq. 17. The LM test and robust LM test results reported in Table 5 reject the null hypothesis of no spatial lag and no error dependence, indicating that an SDM specification should be adopted to analyze the association of GEE with CDFDI. Secondly, since SDM is a general spatial model, which, in a restricted form, can be interpreted as a SAR or SEM, we further perform the Wald test and Lratio test to determine the appropriate form of SDM.8 The Wald test and the Lratio test are carried out with SDM as a parent. The results show that the Wald and Lratio test’s chi-square values are 4.52 and 3.36, which means that “SDM and SAR or SEM are not substantially different in setting form” is rejected at the 10% level of significance. In addition, the AIC and BIC values of the SDM model are smaller than those of the SAC model, indicating that the SDM model is the most suitable spatial model for data sample fitting and that spatial econometric modeling is scientific.
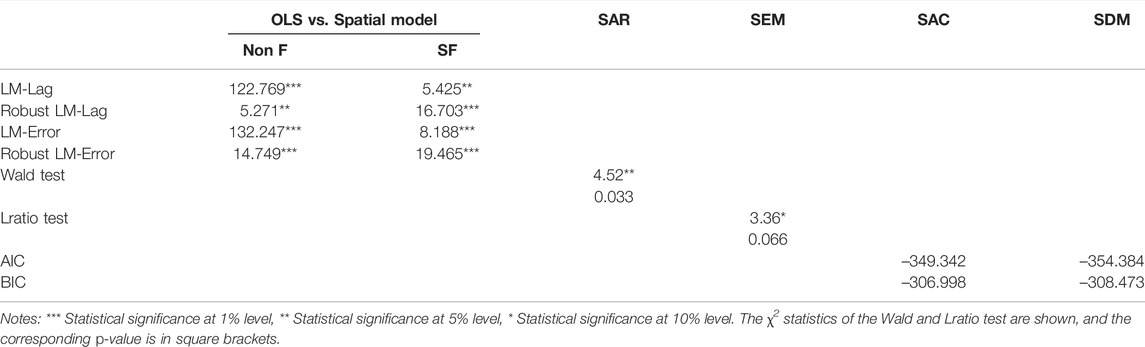
TABLE 5. Spatial econometric model screening results.
The estimation results of Eq. 17 are shown in Table 6. The critical estimation results of dynamic SDM are given in column (6). For comparison, columns (1) and (2) represent the estimation results of the no fixed and fixed effects without considering a spatial effect, respectively. We also present estimation results of SAR, SAC, and static SDM in columns (3) to (5) for robustness analysis. The fixed-effect model should include four types: no fixed effect, individual fixed effect, time fixed effect, and individual and time double fixed effect, but this paper only reports the first and last one, mainly because the second and third statistics are not significant in the LM test, and the significance of the econometric regression results is also poor. The p-value of the Hausman test in Table 6 is 0.000, which indicates that the sample regression is more suitable for the fixed effect (SF) model. According to Table 6, in terms of the goodness-of-fit, the Log-likelihood values of the model are significantly improved compared with the previous ones after considering the spatial effect, which indicates that the SDM is used to estimate more reasonably. In order to prevent endogenous or missing variables from emerging, this paper selected GEEt−1 to represent the time terms and used a more common estimation method of the spatial dynamic SDM panel (see column (6) in Table 6), from which the following conclusions can be drawn.
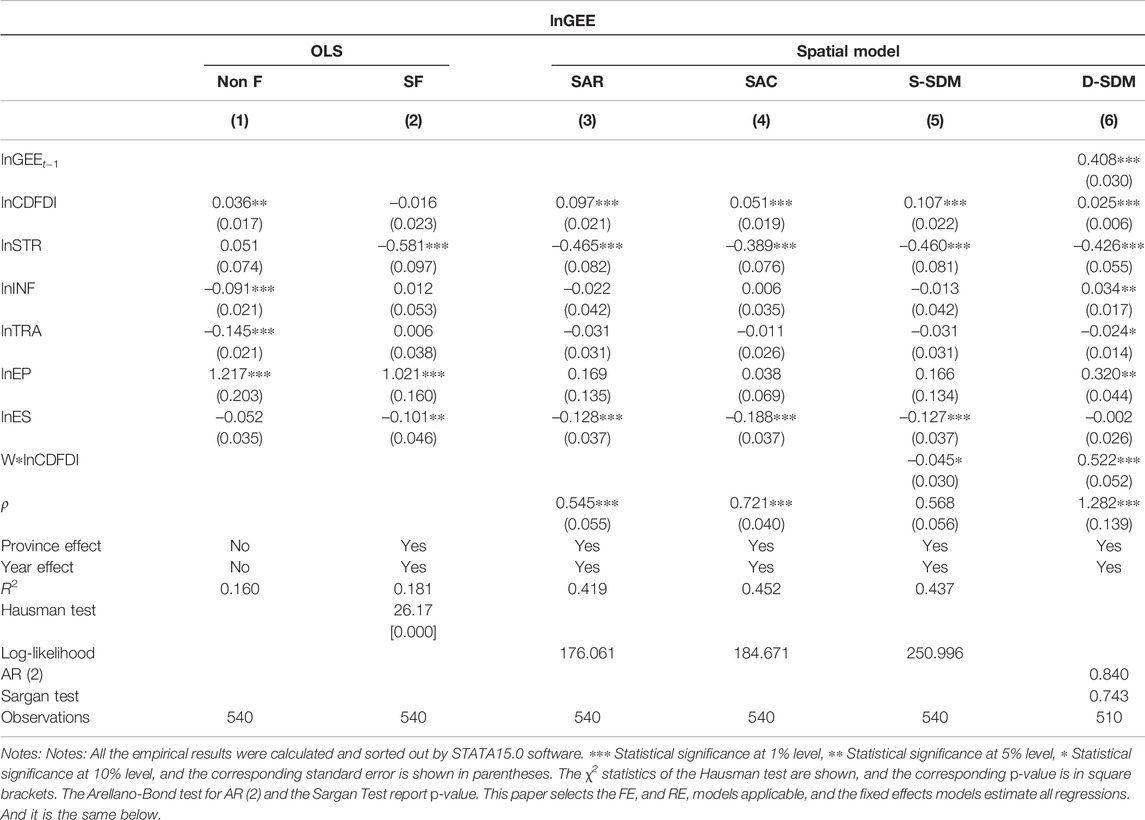
TABLE 6. The spatial benchmark regression results.
First of all, the lag coefficient in column (6) is significantly positive with a value of 0.408, further proving that GEE has a positive spatial spillover effect and a 1% increase in the last period of GEE will result in a 0.408% increase in the current period GEE. Second-order autocorrelations of random error terms of the difference and level equations do not exist. The Sargan test shows that the instrumental variable is effective. Moreover, the spatial autocorrelation coefficient (ρ) in Table 6 is most significantly positive at the level of 1%, indicating that the GEE of Chinese provinces features significant spatial clustering. In other words, the GEE of a province is geographically closely related to the GEE of an adjacent province, again confirming Hypothesis 1.
Secondly, the regression coefficients of lnCDFDI in columns (1)–(6) and W*lnCDFDI are most positive, indicating that the CDFDI has a positive effect on GEE in both local and nearby regions. Importantly, in column (6), the coefficient of lnCDFDI is positive and significant with an estimated value of 0.025, and the coefficient of W*lnCDFDI is positive and significant with an estimated value of 0.522. That is to say, every 1% increase in lnCDFDI will result in a 0.025% increase in local GEE and a 0.522% increase in nearby GEE. In addition, compared with the regression results under the spatial matrix, OLS regression results indicate the overestimated impact of CDFDI on GEE when neglecting the positive spatial spillover effect of the adjacent province. This result also demonstrates the theoretical model in this paper that IFDI and OFDI have a particular coupling effect in influencing GEE, and the interaction of both of them has a promotion effect on GEE. Thus, Hypothesis 2 is confirmed. The reason behind this may be that under the BRI, half of China’s global investment was in the energy sector (e.g., mining, manufacturing, and power plants and dams), and the energy and power sectors still occupy the top positions in the target list of China’s mergers and acquisitions (Mahadevan and Sun, 2020). Moreover, when a province obtains the advanced management methods and more efficient technologies brought by IFDI (Shao, 2018; Demena and Afesorgbor, 2020), it can also actively carry out OFDI, which can efficiently use funds to carry out R&D of green energy and environmental protection technologies, thereby improving energy efficiency. For instance, Guangzhou, as the most active province of IFDI and OFDI, has implemented the Cleaner Production Partnership Programme through IFDI from Hong Kong in the early stages and OFDI in Hong Kong in the latter stages, enabling Hong Kong-owned enterprises in the Pearl River Delta region to adopt several energy-saving technologies to reduce pollution emissions (Jiao et al., 2020). When both the IFDI and OFDI exist simultaneously, increasing the coupling coordination level will significantly promote GEE. This finding means that China should adhere to both the strategies of “going out” and “bringing in” strategies to promote the benign interaction of bilateral FDI.
Thirdly, the regression coefficients of other control variables are not substantially different among these models, directly verifying that the above spatial regression model is reliable. Specifically, the coefficient of industrial structure is significantly negative in the D-SDM, which indicates that industrial development has inhibited the improvement of GEE, which is possible because some regions have wild developed industries at the expense of energy (Hao et al., 2020b). The coefficient of infrastructure is significantly positive, indicating that infrastructure plays an essential role in promoting GEE, which is possible because the development of public transportation reduces the fossil energy consumption of private cars, thereby increasing GEE. The estimated coefficient of the trade is significantly negative, indicating that import and export trade has inhibited the improvement of GEE, which is possible because China’s past international trade was mainly based on processing trade. China’s deep processing of imported intermediate products was linked with high resource consumption. The effect of the energy price on GEE is significantly positive, which is consistent with the conclusion of Xin-gang and Shu-ran (2020). The energy price reflects the supply and demand conditions in the energy market. Consequently, higher energy prices will lower energy consumption and improve energy efficiency. The coefficient of energy structure is negative, which indicates that the energy structure dominated by coal and coke will exacerbate the deterioration of green energy efficiency. The possible reason is that if the proportion of traditional energy in the consumption structure continues to rise, it cannot enable the development of more new energy (such as solar, wind, and biomass energy) under the given coal equivalent.
Table 7 exposes the CDFDI and GEE relationship considering the moderation effect of technological diffusion, nationalization, and environmental regulation.
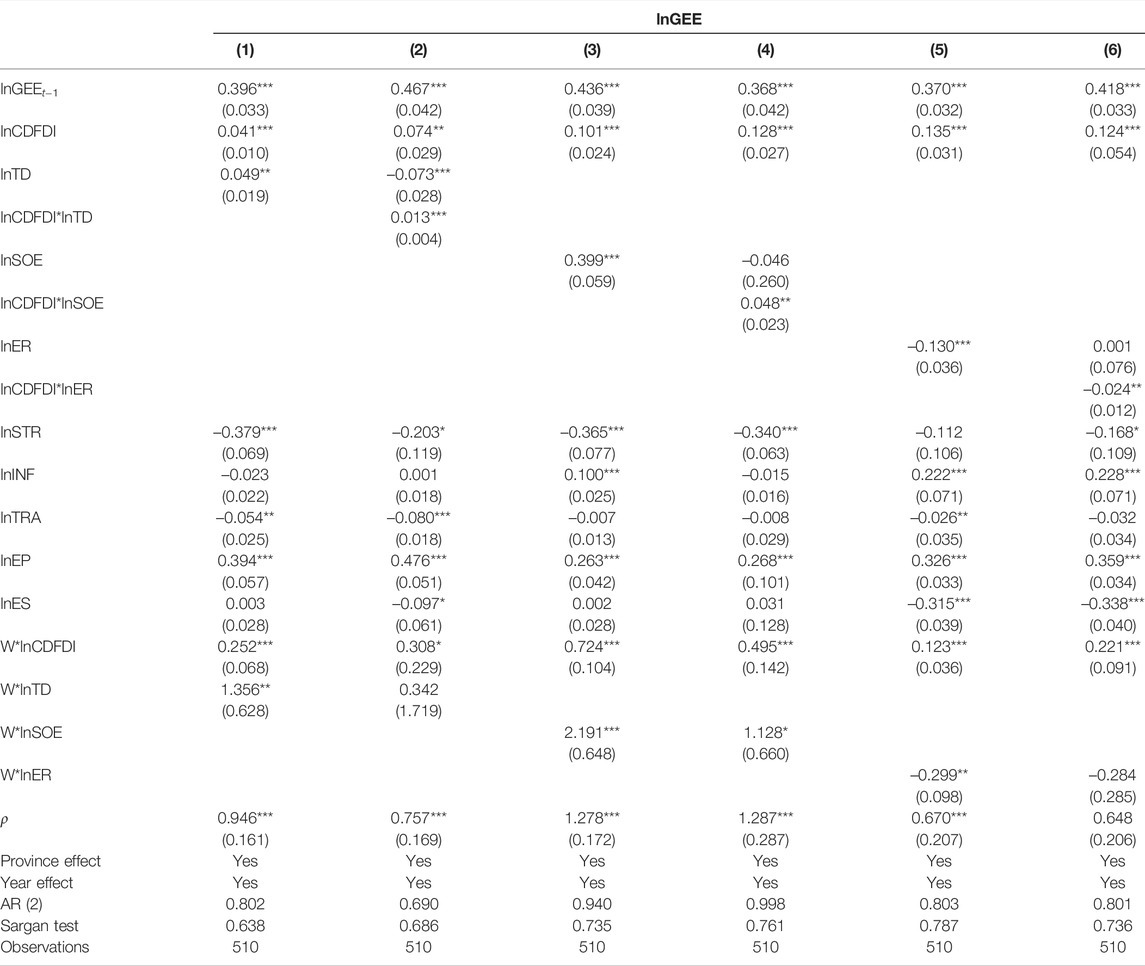
TABLE 7. Impact of CDFDI’s interaction terms on GEE.
In column (1), the coefficient of lnTD is positive and statistically significant at the 5% level, suggesting that technological diffusion in China plays a role in improving regional GEE. It shows that locals with a higher degree of technological diffusion have more green energy technology to devote to energy efficiency improvements. The interaction term of lnCDFDI and lnTD is positive and statistically significant in the regression of columns (2), indicating that the promotion of GEE by CDFDI varies with technological diffusion. Furthermore, the coefficients of W*lnCDFDI and W*lnTD are positive, with an estimated value of 0.308 and 0.342. Therefore, Hypothesis 3 is proved. As shown in column (2), with the moderating effect of technological diffusion, for one standard deviation increase in lnCDFDI (SD = 1.097, refer to Table 1), the average GEE will increase by (0.074 + 0.013×lnTD)×1.097. With the minimum value (4.248) and the maximum value (13.176) of lnTD, one standard deviation in lnCDFDI increases the average lnGEE from 0.142 to 0.269. These results strongly imply that higher technological diffusion can guide enterprises to develop green patents and low-energy products. The reason is that, as mentioned above, the green technology brought by bilateral FDI has the characteristics of spillover and reverse spillover (Wang et al., 2019), thus promoting the improvement of green energy efficiency.
As shown in column (3) of Table 7, the elasticity of nationalization to GEE is 0.399. This result suggests that a 1% increase in nationalization will result in a 0.399% increase in GEE. The interaction term of lnCDFDI and lnSOE is positive and statistically significant in column (4), indicating that the promotion of GEE by CDFDI varies with nationalization. Specifically, with one SD increase in lnCDFDI and the moderating effect of nationalization, the average GEE will increase by (0.128 + 0.048×lnSOE)×1.097. In addition, the coefficients of W*lnCDFDI and W*lnSOE are positive and significant, with an estimated value of 0.495 and 1.128 in column (4), which is the same as inferred from Eq. 13. It indicates that bilateral FDI is moderated by the degree of nationalization to increase local GEE but negatively impacts the neighborhood. Therefore, Hypothesis 4 is also proved accordingly. State ownership is a typical characteristic of the Chinese market and multinational corporations. Compared with previous eras, China’s foreign policy stance has changed dramatically over the past few years, especially after the BRI, which has become more aggressive in terms of foreign investment and regional connectivity. State ownership is a typical characteristic of the Chinese market and multinational corporations. As state-owned enterprises can obtain unique country-specific advantages in their home country (e.g., financial resources, greater market access, and government support), they can take advantage of domestic resources to dispose of remaining resources and improve energy efficiency (Ramamurti and Hillemann, 2017; Yu D. et al., 2021).
In column (5) of Table 7, it can be found that the coefficient of lnER is negative at a 1% significance level. Moreover, the coefficient of W*lnCDFDI is positive and significant in column (5), and the coefficient of W*lnER is negative and significant, which are the same as inferred from Eq. 15. These results imply that mandatory environmental regulation cannot guide enterprises to develop green patents and low-energy products. Hypothesis 5 is verified. Concerning the moderation effect of environmental regulation, column (6) in Table 7 reports the impacts of interaction terms of lnCDFDI and lnER on green energy efficiency. The interaction term coefficient is significantly negative, indicating that command-and-control environmental regulation has a negative moderating effect on bilateral FDI. The above results suggest that under the moderating effect of environmental regulation, stronger command-and-control environmental regulation is not conducive to improving GEE in surrounding regions. The reason is that local governments impose strict restrictions on pollutant emissions from industrial enterprises, which will prompt the cessation or transfer of pollution-intensive enterprises that do not meet emission standards. Such an approach does not promote GEE. Second, the Chinese local government has set many policy barriers to prevent industrial capital outflow for economic growth. China’s OFDI cannot transfer industries with high pollution to other countries with weakened environmental regulations (Luo et al., 2021a). Meanwhile, since the green energy efficiency in this paper is a comprehensive indicator covering eight pollutants, China’s environmental governance investment is mainly used to reduce the three wastes. Handling the waste gas waste residue by adopting the method of catalytic combustion will increase when the CO2 emissions (Hao et al., 2020b), resulting in increased investment in environmental governance and having a negative effect on the surrounding regions’ energy efficiency.
There exists a considerable variation in China’s IFDI and OFDI flows and stocks by country. China’s IFDI mainly comes from developed countries, while the flow and stock of OFDI are divided between developed and developing countries. Hence, it is crucial to conduct a heterogeneity analysis to overcome the problem of investment motivation heterogeneity. Due to the difficulty of accurately distinguishing between IFDI and OFDI among the four investment motives, Zhang and Roelfsema (2014) found that China’s OFDI in less advanced countries was mainly motivated by the desire to exploit regional markets and secure natural resources, whereas, in advanced economies, motivations were more related to acquiring strategic resources. Based on their findings, this paper defines the developed countries’ IFDI to China as efficiency-seeking and resource-seeking, and developing countries’ IFDI to China as market-seeking and strategic-asset-seeking.9 On the other hand, China’s OFDI to developed countries is defined as strategic-asset-seeking and market-seeking. In contrast, China’s OFDI to developing countries is defined as resource-seeking and efficiency-seeking.10 We use Eq. 22 to recalculate the CDFDI of different investment motive portfolios.
In Table 8, the lnCDFDI coefficients in columns (1), (3) and (4) are all positive at the 10% level, consistent with the overall sample results. This finding suggests that international capital flows for these three investment motive combinations can improve local green energy efficiency. Interestingly, they do not have the same impact on the surrounding regions’ GEE. The regression coefficients of W*lnCDFDI in columns (1) and (3) are negative but not significant, indicating that the CDFDI may have a negative effect on GEE in nearby regions. However, the coefficients of W*lnCDFDI are positive and significant in columns (2) and (4), suggesting that this investment motivation portfolio (i.e., IFDI from any country and China’s OFDI in developing countries) can not only promote local GEE improvement but also promote the GEE improvement of surrounding regions. Since China entered the New Normal development stage after 2012,11 we divide the sample period into two stages, 2003–2011 and 2012–2020, to study the heterogeneous impact of investment motivation.
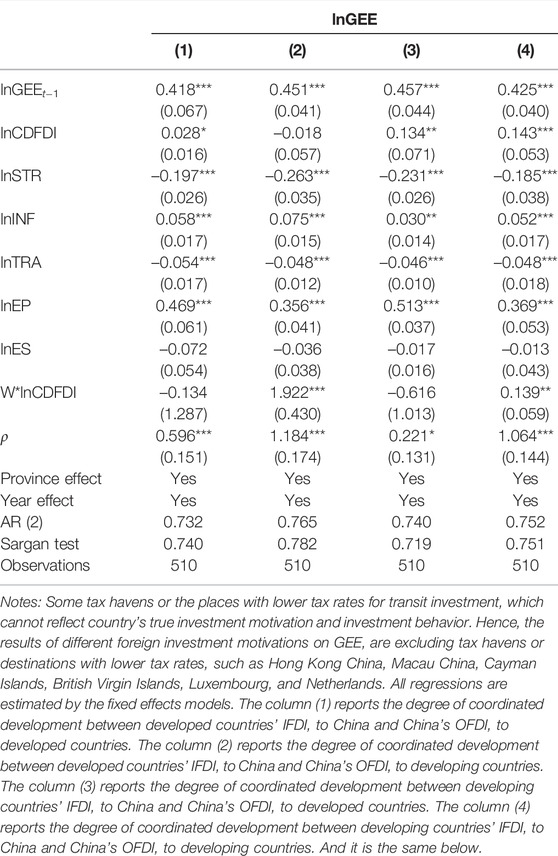
TABLE 8. Impact of different foreign investment motivations on GEE.
First of all, it can be seen from Table 9 after dividing the period, the coefficient signs of different investment motive portfolios are significantly different from those in Table 8. At the same time, Figure 7 also shows the heterogeneity of investment motivation in different periods for the convenience of intuitive feeling. Specifically, in the period of uneven economic development (2003–2011), the IFDI from developed countries and China’s OFDI to developed countries had a significant negative impact on GEE (see columns (1) in Table 9). However, it significantly promoted GEE in surrounding areas, and the coefficient is much larger than the former. In contrast, in the New Normal development stage (2012–2020), the coefficient of lnCDFDI is negative but not significant, and the coefficient of W*lnCDFDI is significantly positive (see columns (5) in Table 9). We believe that this may be that developed countries’ foreign investment in China is more resource-seeking, which leads to the inflow of foreign capital into resource-intensive and labor-intensive industries. Economic development is China’s top priority in the stage of uneven economic development because it is a developing country. It is unrealistic to maintain the same energy consumption level while maintaining the same economic growth rate. The “Pollution Haven Hypothesis” (Muhammad et al., 2020) has been verified in this case. However, in the stage of the New Normal development, the Chinese government has set a higher entry threshold for foreign investment. Higher environmental regulation standards make resource-seeking investment no longer have a significant inhibitory effect on local GEE. On the other hand, according to the Porter hypothesis, FDI can introduce new technologies that consume less energy. Through inter-provincial interactions, the spillover effect of such green technologies will lead to inter-provincial dissemination of green knowledge and technologies across provinces (Pan et al., 2020b), indirectly increasing the GEE of neighboring provinces.
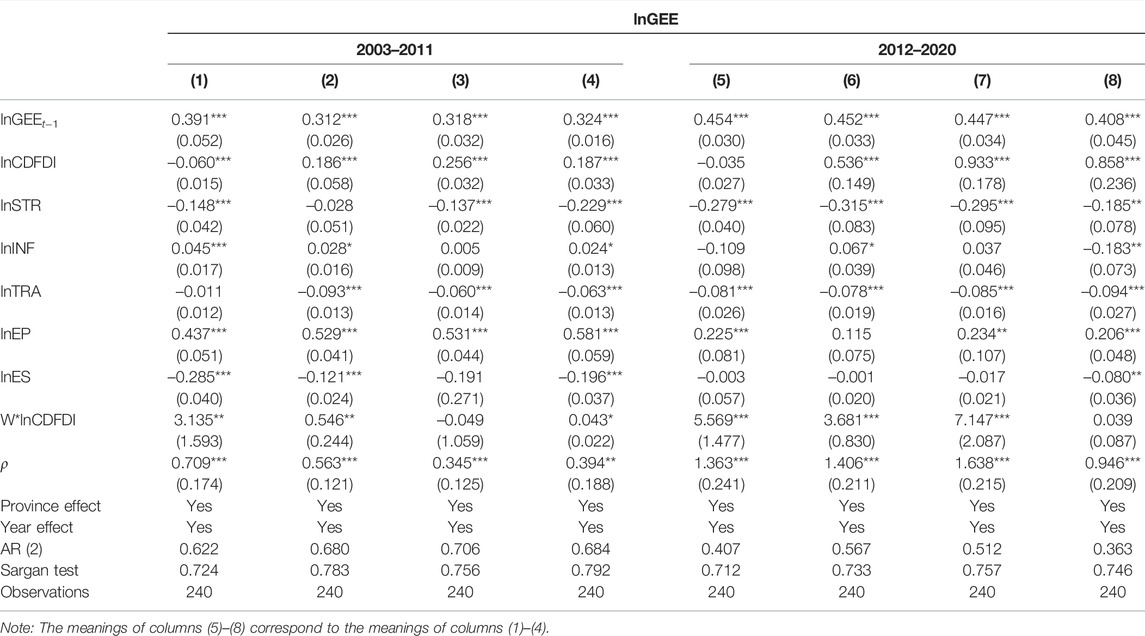
TABLE 9. Impact of different foreign investment motivations on GEE in different time periods.
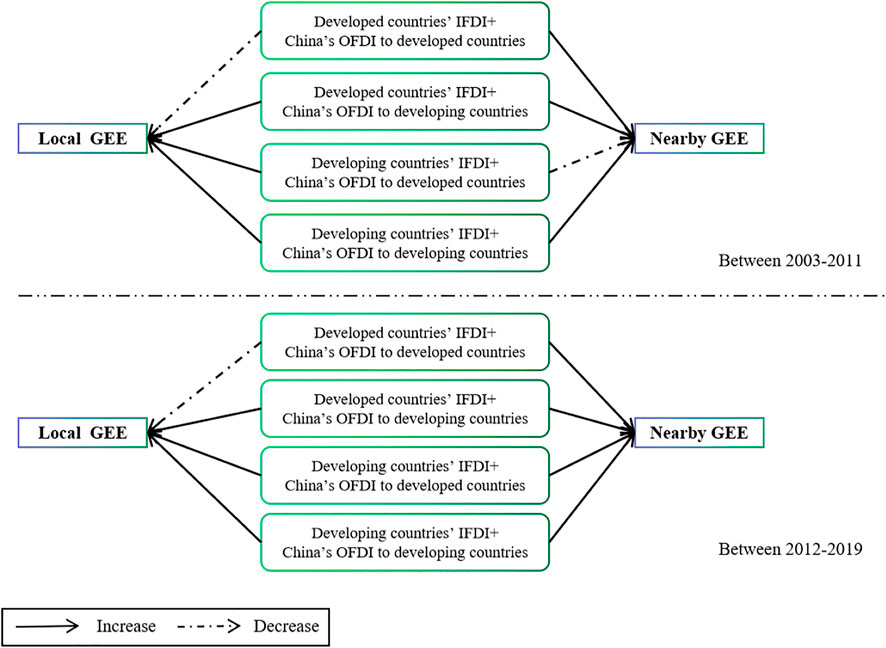
FIGURE 7. Impact of different foreign investment motivations on GEE in different time periods.
Secondly, the coefficients of lnCDFDI in columns (2) and (6) are all positive at the 1% level, contrary to the overall sample results. Furthermore, the coefficients of W*lnCDFDI are also positive and significant, which is consistent with column (2) in Table 8. On the other hand, the coefficients of lnCDFDI in columns (3) and (7) are positive at the 1% level. The coefficient of W*lnCDFDI is negative and insignificant during 2003–2011 but significantly positive during 2012–2020. This finding suggests that complementary portfolios of investment incentives significantly contribute to both local and nearby GEE. The reason may be that this bilateral FDI with complementary motivations can enable China to first make up for the actual savings and foreign exchange gap through resource and efficiency-seeking investment from developed countries and solve the problem of capital accumulation (Hertenstein et al., 2017). Then, the economic prosperity brought by IFDI will further promote China’s OFDI to developing countries. Through channels such as R&D cost-sharing and peripheral R&D stripping (Li H. et al., 2017; Haider and Mishra, 2021), the relatively disadvantaged “marginal industries” will be stripped outward (Hao et al., 2020b). Although it can bring about the improvement of local GEE, due to the spatial dependence of pollution and energy efficiency (Fetscherin et al., 2010; Zhang and Kong, 2022), China’s embedding of high energy-consuming production into processing links in the uneven development stage will inevitably lead to a decline in green energy efficiency in surrounding regions. On the other hand, with the high-quality development of the economy and the deepening of China’s integration into the global value chain, when IFDI seeking markets and OFDI seeking resource efficiency meet domestic capital needs, production has higher environmental requirements, and some relatively low-end and high energy consumption links will be rearranged (Demena and Afesorgbor, 2020). While expanding international market share overseas, optimizing the scale effect has promoted the GEE improvement in local and neighboring regions to a certain extent.
Finally, bilateral FDI between China and developing countries can boost GEE in local and surrounding areas. Especially in the New Normal period, the coefficient value of lnCDFDI is more considerable, but the coefficient of W*lnCDFDI is positive but not significant. The reason behind this is that since the launch of the BRI in 2013, the BRI has increased China’s direct investment outflows to countries along the Belt and Road routes, which are characterized by China’s overcapacity and pollution problems, thus promoting the local GEE boost. However, due to the small technological gap between China and developing countries, the opportunities for domestic enterprises to improve energy efficiency by imitating and introducing foreign advanced technologies are more negligible (Elliott et al., 2013), resulting in more minor inter-provincial spatial spillover effects at home.
In order to ensure the effectiveness and credibility of the above conclusions, this paper also carries out a robustness test from two aspects:
First, the spatial correlation between regions may also come from the economic behavior of individuals. On the other hand, liberalization of government policies was seen as necessary to ensure that nations may keep pace with other countries. Institutional changes have enabled capital to move over country boundaries freely. Institutional is the initial barrier to international capital flows. Institutional changes have founded a basis for expanding the market economy and included greater privatization (Bevan et al., 2004). Therefore, this paper uses the economic distance (Weco)12 (see columns (1) to (2) in Table 10) and institutional distance matrix (Wins)13 as the spatial weight matrices, respectively, to estimate the dynamic SDM (see columns (3) to (4) in Table 10). The results still indicate that the dynamic SDM is still the most suitable under different space weight matrices, and the coordinated development of bilateral FDI has a significantly positive effect on GEE. The significance and direction of the regression coefficient in Table 10 are consistent with those in Table 6.
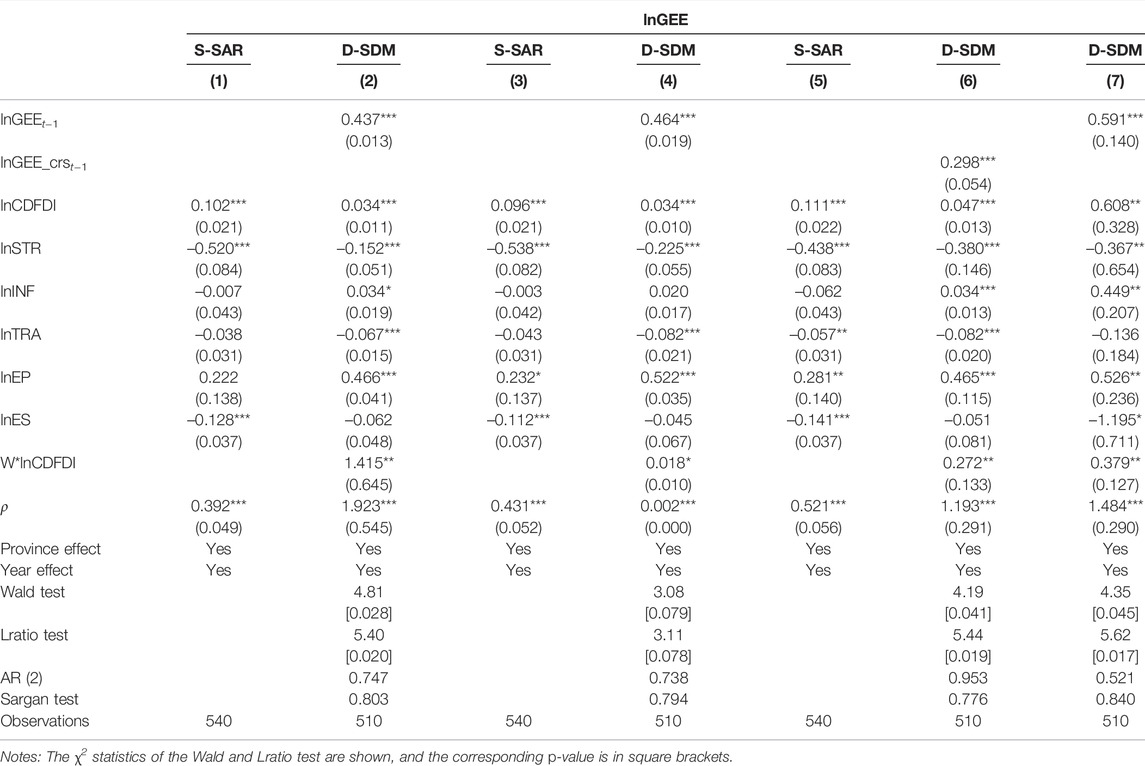
TABLE 10. Robustness regressions.
Second, change the dependent variable. The key dependent variable in the previous empirical model is green energy efficiency. In a robustness check, we first obtain the dependent variable by remeasurement of GEE under constant returns to scale (lnGEEcrs) (see columns (5) to (6) in Table 10). The results show that the effect of bilateral FDI is consistent with the results in Table 6. On the other hand, many articles argue that the depreciation rates should vary by province and city and that different depreciation rates may lead to different GEE results and thus affect the estimation results. To this end, we recalculated the provincial depreciation rates for robustness analysis. Our specific approach is to estimate the capital stock over time and by province based on the proportion of investment. The variable depreciation rate that changes with the province and time is obtained by using the actual depreciation amount data by the province (Chow, 1993). The specific results are shown in column (7) of Table 10. Judging from the estimated results, the GEE regression results obtained from the depreciation rates of different provinces are consistent with the benchmark results, indicating that the conclusions of this paper are robust. These results confirmed the validity of the previous estimation method.
Although the Chinese government has attempted to build a green development mode since 2011, China has been the world’s largest energy consumer, and its green energy efficiency issues are particularly prominent. Meanwhile, China plays an essential role in the international capital arena with the dual identity of an investor and a host country. Since the sole purpose of international capital flow is to maximize profits, it not only has a positive impact on economic growth but will also have other impacts on China, the most important of which are energy depletion and environmental pollution. Even though several studies have focused on this subject, they failed to draw a unanimous conclusion. Depart from the prior research on this subject, the current paper explores the spatial spillover effects of the coordinated development of bilateral FDI on green energy efficiency during 2003–2020. The second distinguishing feature of the current paper is that the interactive relationship between technological diffusion, nationalization, environmental regulation, and bilateral FDI in influencing green energy efficiency in local and nearby regions is examined, extending previous research. Finally, this paper examines and compares the impact of heterogeneous investment motives on green energy efficiency, which has previously often been ignored. All of this provided new information and knowledge regarding the green energy efficiency of China.
Using data for 30 Chinese provinces over the 2003–2020 period, the most critical conclusions resulting from this research are as follows:
1) Between 2003 and 2020, the green energy efficiency of Chinese provinces shows a positive and significant spatial correlation, i.e., a province with a high GEE is surrounded by other corresponding high-value provinces. At the same time, green technological progress plays a leading role in developing China’s green energy efficiency. However, the potential impact of green technological efficiency has been gradually emerging since 2017.
2) According to the PVAR model, the change in IFDI will stimulate OFDI to show a significant positive change in the first period, and this positive impulse response gradually converges to zero after the fifth period. The shock effect of OFDI on IFDI is the same. The Granger causality test shows that IFDI can promote OFDI and that OFDI is also beneficial to increasing IFDI. There is a coupling relationship between IFDI and OFDI.
3) Both the global Moran index and the local Moran scatter plot shows that GEE and CDFDI are characterized by spatial aggregation. The benchmark regression results’ positive and significant spatial-temporal lag coefficient show that the GEE is affected by neighboring provinces. CDFDI has a positive effect on GEE in both local and nearby regions, indicating that GEE is closely related to the spatial agglomeration of CDFDI on the scale of geography. Thus, it validates the “Pollution Halo Hypothesis” in China.
4) The CDFDI affects GEE in three ways: Firstly, FDI mainly promotes GEE through technological diffusion, which brings about positive technological spillover. Under the moderating effect of technological diffusion, one standard deviation in CDFDI increases average GEE from 0.142 to 0.269. Secondly, the effect of increasing CDFDI on GEE varies with nationalization. Bilateral FDI is moderated by the degree of nationalization to increase local and nearby GEE. Thirdly, the promotion of GEE by CDFDI varies with environmental regulation. Due to China’s environmental regulation characteristics, it has a negative effect on the surrounding regions’ energy efficiency.
5) Regarding the different investment motivations of CDFDI, any motivation-driven international capital flow can significantly contribute to nearby GEE improvements in any period. However, the investment motivation portfolio of IFDI from developed countries and OFDI in developed countries has a negative effect on GEE in local regions. The “Pollution Haven Hypothesis” has been verified in this case. By contrast, the complementary investment motivation portfolio can not only promote local GEE improvement but also promote the GEE improvement of surrounding regions. It can be seen that when the heterogeneity of investment motivation is considered, the impact of international capital flows on energy and the environment will be uncertain.
The following policy recommendations can be obtained from this paper:
First, from the decomposition results of GEE driving forces, China should change the way of improving green energy efficiency based on green technology progress in the past, stimulate the development potential of green energy technological efficiency and make extra efforts in green energy development to improve green energy efficiency further.
Secondly, according to the results of PVAR, it is verified that there is an interaction effect in China’s two-way FDI. This result shows that China should accurately judge its current position in the international investment process and make targeted strategic adjustments. The bilateral FDI flow is highly related to its economic development level. When the economic level is low, it will receive more FDI inflows, and as the economic level increases, more FDI will be exported. At present, the scale of China’s bilateral FDI is at the forefront of the world, and it has the dual identities of host country and investor country at the same time. In this context, China must clarify the development strategy and positioning of bilateral FDI and rationally arrange the flow of bilateral FDI.
Third, according to the estimated results of CDFDI, China should further strengthen its opening to the outside world, take into account the bilateral strategy of going out and bringing in, and promote dual circulation at home and abroad. Especially since the Sino-US trade friction and the COVID-19, the current international environment is full of uncertainties, and there are views and trends of anti-globalization, and the environmental problems brought about by foreign investment are gradually exposed. In fact, for China, during the economic transition period, per capita bilateral FDI is still a gap between it and developed countries. In this context, China must pay attention to and guide the rational layout of bilateral FDI flows and accelerate the transformation of the investment attraction model from the past wide entry and strict exit, passive and passive to restricted entry and exit, active and active. The coordinated development of bilateral FDI has a significant green energy efficiency improvement effect, and it should be actively promoted to make it another path choice to promote China’s green energy efficiency improvement.
Fourth, technological diffusion, nationalization, and environmental regulation are the channels through which bilateral FDI affects green energy efficiency. Therefore, while promoting the coordinated development of bilateral FDI, China should formulate policies to encourage domestic enterprises to invest in high-tech industries abroad to play the role of technological diffusion channels better. China should also give full play to its institutional advantages to guide high-energy-consuming enterprises to relocate abroad while introducing green and cleaner production processes. In addition, China should also adjust the command-and-control environmental regulation means, gradually change the treatment means of exchanging high carbon emissions for low three wastes and ensure the effective implementation of environmental protection policies.
Finally, since bilateral FDI with different motivations has heterogeneous impacts on green energy efficiency, it is necessary to change the previous investment promotion policies and develop a high-quality opening-up strategy. China should actively build a regional value chain and an international industrial chain based on the Belt and Road initiative and strengthen international capacity cooperation. When going out, China should not only invest in developing countries and transfer excess capacity through efficiency-seeking and resource-seeking investment but also establish a high-quality OFDI focusing on green energy technology and place investment in the technology-intensive country. When bringing in, foreign investment with different motivations should be distinguished. China should screen IFDI and comprehensively consider whether the technology, equipment, production input, and other factors attached to IFDI are compatible with local economic, social, and environmental development.
Although this paper quantitatively analyses the dynamic spatial relationship between bilateral FDI and GEE, some problems are worthy of further study. First, although the SDM model is used in this paper to reduce the endogeneity problem caused by spatial correlation, the endogeneity problem may also arise from measurement errors and omitted variables, which the spatial econometric model cannot avoid. Second, due to the limited size of the sample, an unavoidable limitation is the lack of a detailed analysis of the data. For example, the data of OFDI is only at the provincial level, while the data of IFDI is already at the city level. Therefore, our study can only focus on the provincial level, which will cause estimation error to a certain extent. Thus, future research can be studied at the enterprise level. In addition, although we distinguish bilateral FDI with different investment motives, this classification standard is relatively rough. Future research can conduct a more detailed discussion on the division of investment motives to verify whether the results of this paper are accurate.
Publicly available datasets were analyzed in this study. This data can be found here: https://www.ceads.net.cn/, http://english.cnipa.gov.cn/ and https://data.cnki.net/.
GM is responsible for data processing and first draft of the study. JC is responsible for the design and literature collection.
This paper was supported by the National Social Science Fund (No. 21FJYB057) and the Shanghai Social Science Planning Annual Project (No. 2021BJB003).
The authors declare that the research was conducted in the absence of any commercial or financial relationships that could be construed as a potential conflict of interest.
All claims expressed in this article are solely those of the authors and do not necessarily represent those of their affiliated organizations, or those of the publisher, the editors and the reviewers. Any product that may be evaluated in this article, or claim that may be made by its manufacturer, is not guaranteed or endorsed by the publisher.
We sincerely thank the reviewers for their helpful comments and suggestions about our manuscript.
1Statistical BP, 2021. Review of world energy. http://www.bp.com/statisticalreview.
2State Council of the People’s Republic of China, 2020. Xi sums up lessons from pandemic, calls for joining hands.
3State Council of the People’s Republic of China, 2021. China maps path to carbon peak, neutrality under new development philosophy.
4Power outages on high-carbon industries in Chinese cities: Liaoning: 14 cities including Shenyang and Dalian; Jilin: 9 cities including Changchun and Jilin; Jiangsu: 7 cities including Xuzhou and Huaian; Guangdong: 4 cities including Dongguan and Foshan; Shandong: Yantai, Zibo; Zhejiang: Hangzhou, Shaoxing; Anhui: Fuyang; Xinjiang: Changji.
5Production restrictions on high-carbon industries in China: Hebei/Guangdong: Implement staggered peak production for essential steel rolling enterprises in Tangshan, Foshan, and other places; Guangxi: Some iron and steel enterprises have restricted or stopped production, all high-carbon ferrochromium local enterprises have been shut down, and alumina enterprises have restricted production; Jiangsu: In September and October 2021, iron and steel enterprises will limit production in an all-round way, and cement enterprises will entirely suspend or limit production from September 16; Anhui: Steel, secondary lead, copper processing and other enterprises in some regions have restricted production; Guizhou/Yunnan: Cement production in some regions was significantly restricted, and some high-carbon ferrochromium smelters were shut down; Ningxia: Some high-energy-consuming enterprises suspend production for 1 month.
6Data Sources: https://data.stats.gov.cn/english/easyquery.htm?cn=C01.
7Since the Global Malmquist-Luenberger Index represents the rate of change in green energy efficiency in the current year relative to the previous year, it still needs to be processed and transformed. According to Yu D. et al. (2021) method, we take 2003 as the base period and set the GEE of the province under investigation as 1 in the calculation process. Then the GEE in 2004 is the 2003 value multiplied by the GML index. And so on to calculate GEE values for other years. Since the GEE value of 2003 was 1, 2003 was excluded from the analysis in this part of the analysis, and only the data from 2004 to 2020 was reported.
8The null hypothesis of the Wald test is H0: β1 = 0, the null hypothesis of the Lratio test is H0: β1 = −ρα1.
9According to the definition of the United Nations Development Programme (UNDP), developed countries include the United States, Canada, Australia, New Zealand, Japan, South Korea, Israel, Singapore, Cyprus, Austria, Belgium, Czech, Denmark, Estonia, Finland, France, Germany, Greece, Iceland, Ireland, Italy, Latvia, Lithuania, Malta, Norway, Portugal, San Marino, Slovakia, Slovenia, Spain, Sweden, Switzerland, United Kingdom, Hungary, and Poland. Source. We exclude Luxembourg and Netherlands as tax havens or destinations with lower tax rates.
10Due to constraints on the availability of Chinese OFDI data, we select China’s OFDI data for 14 developed and remaining developing countries to classify different motivations. The 14 countries include the United Kingdom, France, United States, Germany, Australia, Canada, Singapore, South Korea, Japan, Italy, Sweden, Switzerland, Spain, and Norway. The reason for this is because, according to the 2020 Statistical Bulletin of China’s Outward Foreign Direct Investment, China’s OFDI stock in 14 developed countries accounts for about 93.6% of the total investment stock in all developed countries, which can well reflect China’s OFDI in developed countries.
11As China’s economy shifts from the stage of high-speed growth to the stage of high-quality development, more and more firms choose to conduct technology-seeking investment (Kong et al., 2021). Therefore, after this stage, the motives of international capital flowing into mainland China may be quite different.
12The reciprocal of the absolute value of the difference between the annual average value of real per capita GDP of provinces i and j are used to construct the spatial weight matrix of economic distance. Therefore, the interaction frequency between the two provinces increases as economic distance increases.
13This paper uses (GDP-governments expenditure)/GDP to reflect the importance of the government in the market economy and constructs an institutional weight matrix based on this.
Ahmad, M., Jabeen, G., and Wu, Y. (2021). Heterogeneity of Pollution Haven/halo Hypothesis and Environmental Kuznets Curve Hypothesis across Development Levels of Chinese Provinces. J. Clean. Prod. 285, 124898. doi:10.1016/j.jclepro.2020.124898
Arellano, M., and Bond, S. (1991). Some Tests of Specification for Panel Data: Monte Carlo Evidence and an Application to Employment Equations. Rev. Econ. Stud. 58, 277. doi:10.2307/2297968
Baek, J. (2016). A New Look at the Fdi–Income–Energy–Environment Nexus: Dynamic Panel Data Analysis of Asean. Energy Policy 91, 22–27. doi:10.1016/j.enpol.2015.12.045
Bai, T., Chen, S., and Xu, Y. (2021). Formal and Informal Influences of the State on Ofdi of Hybrid State-Owned Enterprises in china. Int. Bus. Rev. 30, 101864. doi:10.1016/j.ibusrev.2021.101864
Bevan, A., Estrin, S., and Meyer, K. (2004). Foreign Investment Location and Institutional Development in Transition Economies. Int. Bus. Rev. 13, 43–64. doi:10.1016/j.ibusrev.2003.05.005
Binbin, Y. (2020). Industrial Structure, Technological Innovation, and Total-Factor Energy Efficiency in china. Environ. Sci. Pollut. Res. 27, 8371–8385. doi:10.1007/s11356-019-07363-5
Broda, C., Greenfield, J., and Weinstein, D. E. (2017). From Groundnuts to Globalization: A Structural Estimate of Trade and Growth. Res. Econ. 71, 759–783. doi:10.1016/j.rie.2017.10.001
Bu, M., Li, S., and Jiang, L. (2019). Foreign Direct Investment and Energy Intensity in china: Firm-Level Evidence. Energy Econ. 80, 366–376. doi:10.1016/j.eneco.2019.01.003
Cabeça, A. S., Henriques, C. O., Figueira, J. R., and Silva, C. S. (2021). A Multicriteria Classification Approach for Assessing the Current Governance Capacities on Energy Efficiency in the european union. Energy Policy 148, 111946. doi:10.1016/j.enpol.2020.111946
Campagnolo, L., and De Cian, E. (2022). Distributional Consequences of Climate Change Impacts on Residential Energy Demand across Italian Households. Energy Econ. 110, 106020. doi:10.1016/j.eneco.2022.106020
Cem, E., and Wilfried, K. (2011). A Contribution to the Theory and Empirics of Schumpeterian Growth with Worldwide Interactions. J. Econ. GrowthBost. 16, 215–255. doi:10.1007/s10887-011-9067-0
Chang, H.-Y., Wang, W., and Yu, J. (2021). Revisiting the Environmental Kuznets Curve in china: A Spatial Dynamic Panel Data Approach. Energy Econ. 104, 105600. doi:10.1016/j.eneco.2021.105600
Chang, M.-C. (2013). A Comment on the Calculation of the Total-Factor Energy Efficiency (Tfee) Index. Energy Policy 53, 500–504. doi:10.1016/j.enpol.2012.10.025
Chen, C., Lan, Q., Gao, M., and Sun, Y. (2018). Green Total Factor Productivity Growth and its Determinants in china’s Industrial Economy. Sustainability 10, 1052. doi:10.3390/su10041052
Chen, D., and Duffie, D. (2021). Market Fragmentation. Am. Econ. Rev. 111, 2247–2274. doi:10.1257/aer.20200829
Chen, J., Zhan, W., Tong, Z., and Kumar, V. (2020). The Effect of Inward Fdi on Outward Fdi over Time in china: A Contingent and Dynamic Perspective. Int. Bus. Rev. 29, 101734. doi:10.1016/j.ibusrev.2020.101734
Chen, L., and Wang, K. (2022). The Spatial Spillover Effect of Low-Carbon City Pilot Scheme on Green Efficiency in china’s Cities: Evidence from a Quasi-Natural Experiment. Energy Econ. 110, 106018. doi:10.1016/j.eneco.2022.106018
Chow, G. C. (1993). Capital Formation and Economic Growth in china. Q. J. Econ. 108, 809–842. doi:10.2307/2118409
Copeland, B. R., and Taylor, M. S. (1994). North-south Trade and the Environment. Q. J. Econ. 109, 755–787. doi:10.2307/2118421
Demena, B. A., and Afesorgbor, S. K. (2020). The Effect of Fdi on Environmental Emissions: Evidence from a Meta-Analysis. Energy Policy 138, 111192. doi:10.1016/j.enpol.2019.111192
Dong, Y., Shao, S., and Zhang, Y. (2019). Does Fdi Have Energy-Saving Spillover Effect in china? a Perspective of Energy-Biased Technical Change. J. Clean. Prod. 234, 436–450. doi:10.1016/j.jclepro.2019.06.133
Driffield, N., Jones, C., Kim, J.-Y., and Temouri, Y. (2021). Fdi Motives and the Use of Tax Havens: Evidence from south korea. J. Bus. Res. 135, 644–662. doi:10.1016/j.jbusres.2021.06.061
Dunning, J. H., and Lundan, S. M. (2008). Multinational Enterprises and the Global Economy. Edward Elgar Publishing. Second Edition. No. 3215 in Books.
Ebaid, A., Lean, H. H., and Al-Mulali, U. (2022). Do oil Price Shocks Matter for Environmental Degradation? Evidence of the Environmental Kuznets Curve in Gcc Countries. Front. Environ. Sci. 10. doi:10.3389/fenvs.2022.860942
Elliott, R. J., Sun, P., and Chen, S. (2013). Energy Intensity and Foreign Direct Investment: A Chinese City-Level Study. Energy Econ. 40, 484–494. doi:10.1016/j.eneco.2013.08.004
Eskeland, G. S., and Harrison, A. E. (2003). Moving to Greener Pastures? Multinationals and the Pollution Haven Hypothesis. J. Dev. Econ. 70, 1–23. doi:10.1016/S0304-3878(02)00084-6
Fetscherin, M., Voss, H., and Gugler, P. (2010). 30 Years of Foreign Direct Investment to china: An Interdisciplinary Literature Review. Int. Bus. Rev. 19, 235–246. doi:10.1016/j.ibusrev.2009.12.002
Franco, C., Rentocchini, F., and Marzetti, G. V. (2008). Why Do Firms Invest Abroad? an Analysis of the Motives Underlying Foreign Direct Investments. Italia: Department of Economics Working Papers 0817, Department of Economics, University of Trento.
Ghosh, R., and Kathuria, V. (2016). The Effect of Regulatory Governance on Efficiency of Thermal Power Generation in india: A Stochastic Frontier Analysis. Energy Policy 89, 11–24. doi:10.1016/j.enpol.2015.11.011
Grossman, G. M., and Krueger, A. B. (1991). Environmental Impacts of a North American Free Trade Agreement. Working Paper 3914. National Bureau of Economic Research. doi:10.3386/w3914
Guo, W., and Liu, X. (2022). Market Fragmentation of Energy Resource Prices and Green Total Factor Energy Efficiency in china. Resour. Policy 76, 102580. doi:10.1016/j.resourpol.2022.102580
Haider, S., and Mishra, P. P. (2021). Does Innovative Capability Enhance the Energy Efficiency of Indian Iron and Steel Firms? a Bayesian Stochastic Frontier Analysis. Energy Econ. 95, 105128. doi:10.1016/j.eneco.2021.105128
Hao, Y., Deng, Y., Lu, Z.-N., and Chen, H. (2018). Is Environmental Regulation Effective in china? Evidence from City-Level Panel Data. J. Clean. Prod. 188, 966–976. doi:10.1016/j.jclepro.2018.04.003
Hao, Y., Gai, Z., and Wu, H. (2020a). How Do Resource Misallocation and Government Corruption Affect Green Total Factor Energy Efficiency? Evidence from china. Energy Policy 143, 111562. doi:10.1016/j.enpol.2020.111562
Hao, Y., Guo, Y., Guo, Y., Wu, H., and Ren, S. (2020b). Does Outward Foreign Direct Investment (Ofdi) Affect the Home Country’s Environmental Quality? the Case of china. Struct. Change Econ. Dyn. 52, 109–119. doi:10.1016/j.strueco.2019.08.012
Hertenstein, P., Sutherland, D., and Anderson, J. (2017). Internationalization within Networks: Exploring the Relationship between Inward and Outward FDI in China’s Auto Components Industry. Asia Pac. J. Manag. 34, 69–96. doi:10.1007/s10490-015-9422-3
Hong, Q., Cui, L., and Hong, P. (2022). The Impact of Carbon Emissions Trading on Energy Efficiency: Evidence from Quasi-Experiment in china’s Carbon Emissions Trading Pilot. Energy Econ. 110, 106025. doi:10.1016/j.eneco.2022.106025
Hosseini-Fashami, F., Motevali, A., Nabavi-Pelesaraei, A., Hashemi, S. J., and wing Chau, K. (2019). Energy-life Cycle Assessment on Applying Solar Technologies for Greenhouse Strawberry Production. Renew. Sustain. Energy Rev. 116, 109411. doi:10.1016/j.rser.2019.109411
Hu, J.-L., and Wang, S.-C. (2006). Total-factor Energy Efficiency of Regions in china. Energy Policy 34, 3206–3217. doi:10.1016/j.enpol.2005.06.015
Jia, P., Li, K., and Shao, S. (2018). Choice of Technological Change for china’s Low-Carbon Development: Evidence from Three Urban Agglomerations. J. Environ. Manag. 206, 1308–1319. doi:10.1016/j.jenvman.2017.08.052
Jiang, L., Folmer, H., and Ji, M. (2014). The Drivers of Energy Intensity in china: A Spatial Panel Data Approach. China Econ. Rev. 31, 351–360. doi:10.1016/j.chieco.2014.10.003
Jiao, Y., Ji, C., Yang, S., Yang, G., Su, M., Fan, H., et al. (2020). Home Governments Facilitate Cleaner Operations of Outward Foreign Direct Investment: A Case Study of a Cleaner Production Partnership Programme. J. Clean. Prod. 265, 121914. doi:10.1016/j.jclepro.2020.121914
Kang, A., Ren, L., Hua, C., Song, H., Dong, M., Fang, Z., et al. (2021). Environmental Management Strategy in Response to Covid-19 in china: Based on Text Mining of Government Open Information. Sci. Total Environ. 769, 145158. doi:10.1016/j.scitotenv.2021.145158
Kong, Q., Peng, D., Ni, Y., Jiang, X., and Wang, Z. (2021). Trade Openness and Economic Growth Quality of china: Empirical Analysis Using Ardl Model. Finance Res. Lett. 38, 101488. doi:10.1016/j.frl.2020.101488
Li, H., Yi, X., and Cui, G. (2017a). Emerging Market Firms’ Internationalization: How Do Firms’ Inward Activities Affect Their Outward Activities? Strateg. Manag. J. 38, 2704–2725. doi:10.1002/smj.2679
Li, J., and Lin, B. (2017). Ecological Total-Factor Energy Efficiency of china’s Heavy and Light Industries: Which Performs Better? Renew. Sustain. Energy Rev. 72, 83–94. doi:10.1016/j.rser.2017.01.044
Li, L., Liu, X., Yuan, D., and Yu, M. (2017b). Does Outward Fdi Generate Higher Productivity for Emerging Economy Mnes? – Micro-level Evidence from Chinese Manufacturing Firms. Int. Bus. Rev. 26, 839–854. doi:10.1016/j.ibusrev.2017.02.003
List, J. A., and Co, C. Y. (2000). The Effects of Environmental Regulations on Foreign Direct Investment. J. Environ. Econ. Manag. 40, 1–20. doi:10.1006/jeem.1999.1095
Liu, H., Peng, C., and Chen, L. (2022). The Impact of Ofdi on the Energy Efficiency in Chinese Provinces: Based on Pvar Model. Energy Rep. 8, 84–96. doi:10.1016/j.egyr.2022.01.150
Liu, L., Zhao, Z., Zhang, M., Zhou, C., and Zhou, D. (2021a). The Effects of Environmental Regulation on Outward Foreign Direct Investment’s Reverse Green Technology Spillover: Crowding Out or Facilitation? J. Clean. Prod. 284, 124689. doi:10.1016/j.jclepro.2020.124689
Liu, T., Song, Y., Xing, X., Zhu, Y., and Qu, Z. (2021b). Bridging Production Factors Allocation and Environmental Performance of china’s Heavy-Polluting Energy Firms: The Moderation Effect of Financing and Internationalization. Energy 222, 119943. doi:10.1016/j.energy.2021.119943
Lucas, E. C., and Mendes-Da-Silva, W. (2018). Impact of Climate on Firm Value: Evidence from the Electric Power Industry in brazil. Energy 153, 359–368. doi:10.1016/j.energy.2018.04.024
Luo, Q., Miao, C., Sun, L., Meng, X., and Duan, M. (2019). Efficiency Evaluation of Green Technology Innovation of china’s Strategic Emerging Industries: An Empirical Analysis Based on Malmquist-Data Envelopment Analysis Index. J. Clean. Prod. 238, 117782. doi:10.1016/j.jclepro.2019.117782
Luo, Y., Lu, Z., Muhammad, S., and Yang, H. (2021a). The Heterogeneous Effects of Different Technological Innovations on Eco-Efficiency: Evidence from 30 china’s Provinces. Ecol. Indic. 127, 107802. doi:10.1016/j.ecolind.2021.107802
Luo, Y., Salman, M., and Lu, Z. (2021b). Heterogeneous Impacts of Environmental Regulations and Foreign Direct Investment on Green Innovation across Different Regions in china. Sci. Total Environ. 759, 143744. doi:10.1016/j.scitotenv.2020.143744
Lv, P., Curran, L., Spigarelli, F., and Barbieri, E. (2021). One Country, Many Industries: Heterogeneity of Chinese Ofdi Motivations at Meso Level. China Econ. Rev. 69, 101672. doi:10.1016/j.chieco.2021.101672
Mahadevan, R., and Sun, Y. (2020). Effects of Foreign Direct Investment on Carbon Emissions: Evidence from china and its Belt and Road Countries. J. Environ. Manag. 276, 111321. doi:10.1016/j.jenvman.2020.111321
Meng, M., and Qu, D. (2022). Understanding the Green Energy Efficiencies of Provinces in china: A Super-sbm and Gml Analysis. Energy 239, 121912. doi:10.1016/j.energy.2021.121912
Moran, P. A. P. (1950). Notes on Continuous Stochastic Phenomena. Biometrika 37, 17–23. doi:10.1093/biomet/37.1-2.17
Muhammad, S., Long, X., Salman, M., and Dauda, L. (2020). Effect of Urbanization and International Trade on Co2 Emissions across 65 Belt and Road Initiative Countries. Energy 196, 117102. doi:10.1016/j.energy.2020.117102
Pan, X., Guo, S., Han, C., Wang, M., Song, J., Liao, X., et al. (2020a). Influence of Fdi Quality on Energy Efficiency in china Based on Seemingly Unrelated Regression Method. Energy 192, 116463. doi:10.1016/j.energy.2019.116463
Pan, X., Li, M., Wang, M., Chu, J., and Bo, H. (2020b). The Effects of Outward Foreign Direct Investment and Reverse Technology Spillover on china’s Carbon Productivity. Energy Policy 145, 111730. doi:10.1016/j.enpol.2020.111730
Pradhan, J. P., and Singh, N. (2008). Outward Fdi and Knowledge Flows: A Study of the Indian Automotive Sector. Int. J. Institutions Econ. 1, 155–186.
Ramamurti, R., and Hillemann, J. (2017). What Is “Chinese” about Chinese Multinationals? J. Int. Bus. Stud. 49, 34–48. doi:10.1057/s41267-017-0128-2
Razzaq, A., An, H., and Delpachitra, S. (2021). Does Technology Gap Increase Fdi Spillovers on Productivity Growth? Evidence from Chinese Outward Fdi in Belt and Road Host Countries. Technol. Forecast. Soc. Change 172, 121050. doi:10.1016/j.techfore.2021.121050
Ren, S., Hao, Y., and Wu, H. (2022). The Role of Outward Foreign Direct Investment (Ofdi) on Green Total Factor Energy Efficiency: Does Institutional Quality Matters? Evidence from china. Resour. Policy 76, 102587. doi:10.1016/j.resourpol.2022.102587
Ren, S., Yuan, B., Ma, X., and Chen, X. (2014). International Trade, Fdi (Foreign Direct Investment) and Embodied Co2 Emissions: A Case Study of Chinas Industrial Sectors. China Econ. Rev. 28, 123–134. doi:10.1016/j.chieco.2014.01.003
Shao, Y. (2018). Does FDI Affect Carbon Intensity? New Evidence from Dynamic Panel Analysis. Int. J. Clim. Chang. Strateg. Manag. 10, 27–42. doi:10.1108/IJCCSM-03-2017-0062
Sills, J., and Briggs, M. S. (2009). Energy Strategies and Efficiency. Science 325, 812. doi:10.1126/science.325_812b
Song, M., Zheng, W., and Wang, Z. (2016). Environmental Efficiency and Energy Consumption of Highway Transportation Systems in china. Int. J. Prod. Econ. 181, 441–449. doi:10.1016/j.ijpe.2015.09.030
Stack, M. M., Ravishankar, G., and Pentecost, E. (2017). Foreign Direct Investment in the Eastern European Countries: Determinants and Performance. Struct. Change Econ. Dyn. 41, 86–97. doi:10.1016/j.strueco.2017.04.005
Tang, L., and He, G. (2021). How to Improve Total Factor Energy Efficiency? an Empirical Analysis of the Yangtze River Economic Belt of china. Energy 235, 121375. doi:10.1016/j.energy.2021.121375
Tang, L., and Li, K. (2019). A Comparative Analysis on Energy-Saving and Emissions-Reduction Performance of Three Urban Agglomerations in china. J. Clean. Prod. 220, 953–964. doi:10.1016/j.jclepro.2019.02.202
Tao, F., Zhang, H., Hu, Y., and Duncan, A. A. (2017). Growth of Green Total Factor Productivity and its Determinants of Cities in china: A Spatial Econometric Approach. Emerg. Mark. Finance Trade 53, 2123–2140. doi:10.1080/1540496X.2016.1258359
Tone, K. (2001). A Slacks-Based Measure of Efficiency in Data Envelopment Analysis. Eur. J. Operational Res. 130, 498–509. doi:10.1016/S0377-2217(99)00407-5
Wang, F., He, J., and Niu, Y. (2022a). Role of Foreign Direct Investment and Fiscal Decentralization on Urban Haze Pollution in china. J. Environ. Manag. 305, 114287. doi:10.1016/j.jenvman.2021.114287
Wang, Y., and Chen, X. (2020). Natural Resource Endowment and Ecological Efficiency in china: Revisiting Resource Curse in the Context of Ecological Efficiency. Resour. Policy 66, 101610. doi:10.1016/j.resourpol.2020.101610
Wang, Y., Liao, M., Wang, Y., Malik, A., and Xu, L. (2019). Carbon Emission Effects of the Coordinated Development of Two-Way Foreign Direct Investment in china. Sustainability 11, 2428. doi:10.3390/su11082428
Wang, Y., You, Y., and Teng, Y. (2022b). Optimized Variables for Environmental Dynamics: China’s Renewable Energy Policy. Front. Environ. Sci. 10. doi:10.3389/fenvs.2022.862714
Witajewski-Baltvilks, J., Verdolini, E., and Tavoni, M. (2017). Induced Technological Change and Energy Efficiency Improvements. Energy Econ. 68, 17–32. doi:10.1016/j.eneco.2017.10.032
Wu, H., Hao, Y., and Ren, S. (2020). How Do Environmental Regulation and Environmental Decentralization Affect Green Total Factor Energy Efficiency: Evidence from china. Energy Econ. 91, 104880. doi:10.1016/j.eneco.2020.104880
Xia, F., and Xu, J. (2020). Green Total Factor Productivity: A Re-examination of Quality of Growth for Provinces in china. China Econ. Rev. 62, 101454. doi:10.1016/j.chieco.2020.101454
Xiao, H., and You, J. (2021). The Heterogeneous Impacts of Human Capital on Green Total Factor Productivity: Regional Diversity Perspective. Front. Environ. Sci. 9, 713562. doi:10.3389/fenvs.2021.713562
Xin, D., and Zhang, Y. (2020). Threshold Effect of Ofdi on china’s Provincial Environmental Pollution. J. Clean. Prod. 258, 120608. doi:10.1016/j.jclepro.2020.120608
Xin-gang, Z., and Shu-ran, H. (2020). Does Market-Based Electricity Price Affect china’s Energy Efficiency? Energy Econ. 91, 104909. doi:10.1016/j.eneco.2020.104909
Yu, D., Li, X., Yu, J., and Li, H. (2021a). The Impact of the Spatial Agglomeration of Foreign Direct Investment on Green Total Factor Productivity of Chinese Cities. J. Environ. Manag. 290, 112666. doi:10.1016/j.jenvman.2021.112666
Yu, P., Cai, Z., and Sun, Y. (2021b). Does the Emissions Trading System in Developing Countries Accelerate Carbon Leakage through Ofdi? Evidence from china. Energy Econ. 101, 105397. doi:10.1016/j.eneco.2021.105397
Yuan, H., Feng, Y., Lee, C.-C., and Cen, Y. (2020). How Does Manufacturing Agglomeration Affect Green Economic Efficiency? Energy Econ. 92, 104944. doi:10.1016/j.eneco.2020.104944
Zarsky, L. (1999). Havens, Halos and Spaghetti: Untangling the Evidence about Foreign Direct Investment and the Environment. Foreign Direct Invest. Environ. 8, 47–74.
Zhang, D., and Kong, Q. (2022). Green Energy Transition and Sustainable Development of Energy Firms: An Assessment of Renewable Energy Policy. Energy Econ. 111, 106060. doi:10.1016/j.eneco.2022.106060
Zhang, G., Jia, Y., Su, B., and Xiu, J. (2021). Environmental Regulation, Economic Development and Air Pollution in the Cities of china: Spatial Econometric Analysis Based on Policy Scoring and Satellite Data. J. Clean. Prod. 328, 129496. doi:10.1016/j.jclepro.2021.129496
Zhang, J., and Fu, X. (2008). Fdi and Environmental Regulations in china. J. Asia Pac. Econ. 13, 332–353. doi:10.1080/13547860802131326
Zhang, J., Luo, Y., and Ding, X. (2022). Can Green Credit Policy Improve the Overseas Investment Efficiency of Enterprises in china? J. Clean. Prod. 340, 130785. doi:10.1016/j.jclepro.2022.130785
Zhang, W., Li, G., Uddin, M. K., and Guo, S. (2020). Environmental Regulation, Foreign Investment Behavior, and Carbon Emissions for 30 Provinces in china. J. Clean. Prod. 248, 119208. doi:10.1016/j.jclepro.2019.119208
Zhang, Y., and Roelfsema, H. (2014). Unravelling the Complex Motivations behind china’s Outward Fdi. J. Asia Pac. Econ. 19, 89–100. doi:10.1080/13547860.2013.803843
Zhou, P., Wu, F., and Zhou, D. Q. (2017). Total-factor Energy Efficiency with Congestion. Ann. Oper. Res. 255, 241–256. doi:10.1007/s10479-015-2053-8
Zhou, Y., Jiang, J., Ye, B., and Hou, B. (2019). Green Spillovers of Outward Foreign Direct Investment on Home Countries: Evidence from china’s Province-Level Data. J. Clean. Prod. 215, 829–844. doi:10.1016/j.jclepro.2019.01.042
Zhou, Y., Kong, Y., Wang, H., and Luo, F. (2020). The Impact of Population Urbanization Lag on Eco-Efficiency: A Panel Quantile Approach. J. Clean. Prod. 244, 118664. doi:10.1016/j.jclepro.2019.118664
Keywords: green energy efficiency, bilateral FDI, spatial effect, dynamic spatial dubin model, heterogeneous investment motivation
Citation: Ma G and Cao J (2022) Spatial Heterogeneity Impacts of Bilateral Foreign Direct Investment on Green Energy Efficiency in China. Front. Environ. Sci. 10:905933. doi: 10.3389/fenvs.2022.905933
Received: 28 March 2022; Accepted: 20 June 2022;
Published: 14 July 2022.
Edited by:
Faik Bilgili, Erciyes University, TurkeyReviewed by:
Sevda Kuşkaya, Erciyes University, TurkeyCopyright © 2022 Ma and Cao. This is an open-access article distributed under the terms of the Creative Commons Attribution License (CC BY). The use, distribution or reproduction in other forums is permitted, provided the original author(s) and the copyright owner(s) are credited and that the original publication in this journal is cited, in accordance with accepted academic practice. No use, distribution or reproduction is permitted which does not comply with these terms.
*Correspondence: Guangcheng Ma, bWdjQDE2My5zdWZlLmVkdS5jbg==
Disclaimer: All claims expressed in this article are solely those of the authors and do not necessarily represent those of their affiliated organizations, or those of the publisher, the editors and the reviewers. Any product that may be evaluated in this article or claim that may be made by its manufacturer is not guaranteed or endorsed by the publisher.
Research integrity at Frontiers
Learn more about the work of our research integrity team to safeguard the quality of each article we publish.