
95% of researchers rate our articles as excellent or good
Learn more about the work of our research integrity team to safeguard the quality of each article we publish.
Find out more
ORIGINAL RESEARCH article
Front. Environ. Sci. , 28 November 2022
Sec. Drylands
Volume 10 - 2022 | https://doi.org/10.3389/fenvs.2022.902687
This article is part of the Research Topic Ecological Restoration in Drylands: Towards Land Degradation Neutrality View all 19 articles
 Farhad Zolfaghari1*
 Hossein Azarnivand2
 Hasan Khosravi2Gholamreza Zehtabian2Shahram Khalighi Sigaroudi2
Monitoring degradation in arid and semi-arid areas is one of the main concerns for governments, given the growing degradation trend. Meanwhile, detecting the areas subjected to degradation requiring management in the shortest time and at the lowest cost is a necessity, especially in border areas such as Hamoun Wetland, located between Iran and Afghanistan. Albedo and normalized difference vegetation index (NDVI) were calculated using remote sensing technology to monitor the degradation intensity in different periods (August 1999, 2009, 2015, and 2020). Change vector analysis in brightness and greenness indices for 1999 and 2020 was used to determine the changes in intensity. Linear regression was run between albedo and NDVI. Finally, degradation intensity (DI) map was developed to monitor degradation intensity. A confusion matrix was created between the change vector analysis (CVA) and the albedo–NDVI model to evaluate the accuracy of the map obtained from this model for 1,476 pixels of different classes. The linear regression between NDVI and albedo showed a negative correlation between indices (R = −0.849). The results showed an increase for the regions with null, low, and medium degradation intensity, while an expansion was observed for the regions with severe and extreme degradation. The confusion matrix results indicated the high accuracy (0.705) of the degradation intensity model for the study area. These changes were about 52.01% from 1999 to 2009, 7.07% from 2009 to 2015, 56.26% from 1999 to 2015, and 55.15% from 2015 to 2020. Additionally, the average rate of changes in degradation intensity between 1999 and 2020 was 13.11%.
Vegetation changes are closely related to desertification. Thus, vegetation index is one of the main factors in recognizing desertification processes. On the other hand, a decrease in vegetation cover and biomass is correlated with soil degradation, leading to increased surface albedo (Cordeiro et al., 2015). Changes in vegetation affect the level of surface albedo (Myhre and Myhre, 2003), and different vegetation covers represent different albedo values (Kang and Hong, 2008). Albedo has the potential to monitor ecosystem performance changes in arid regions and provides warning of the beginning of desertification (Zhao et al., 2018). Meanwhile, surface albedo is one of the most important components causing surface radiation balance (BdaS et al., 2016). Albedo determines the energy budget in micrometeorological conditions, including temperature and aridity of a land (Goudei and Middleton, 2006). Increasing land surface albedo implies degradation of land quality (Piña et al., 2016), and vegetation can be considered one of the most important key components in reducing the effects of erosion and desertification in arid areas. Desertification development and vegetation cover change are among the factors causing changes in albedo. Surface albedo is defined as the ratio of the total radiation from the Earth’s surface to total incoming solar radiation, which often has a wavelength range of 0.3–3 μm. It is one of the most important factors controlling the energy available throughout the day with surface change processes (Houldcroft et al., 2009). Therefore, it can be said that the change in vegetation affects the surface albedo and desertification occurs with the destruction of vegetation, and the surface albedo increases in the degraded areas (Zhao et al., 2018). Zongyi et al. (2011) presented the albedo–NDVI model for monitoring desertification (Zongyi et al., 2011). They showed that albedo and NDVI could well reflect the desertification intensity. Vegetation, the combination of water and heat and their changes, and desertified areas could be easily detected using multi-spectral remote sensing information. Remote sensing-based vegetation indices and land surface albedo are two preferable indicators for monitoring the degradation process (Zhao et al., 2018).
Pan and Li (2013) selected three different groups, namely, vegetation, water, and bare soil, based on the spectral mixture analysis model (Pan and Li, 2013). They assessed the status of desertification based on the temporal–spectral feature of vegetation and surface albedo components derived from Landsat satellite images. Karnieli et al. (2014) examined the changes in NDVI and albedo indices for four periods using the change vector analysis (CVA) technique to understand the spatial–temporal dynamics of the environmental processes (Karnieli et al., 2014). They used four different Landsat images and showed the changes for each time step during the studied period. Cordeiro et al. (2015) estimated the indices affecting desertification in Natal County using the SEBAL algorithm, albedo, vegetation cover, and surface temperature indices with the help of remote sensing technology (Cordeiro et al., 2015). Lamchin et al. (2016) developed a quantitative model on a local scale using remote sensing data to evaluate land cover changes and desertification (Lamchin et al., 2016). They examined the land surface status for vegetation biomass, landscape pattern, and micrometeorology using NDVI, the Topsoil Grain Size Index (TGSI), and the albedo index. Pina et al. (2016) extracted NDVI, BSI, and the albedo index from Landsat satellite images using remote sensing (Piña et al., 2016). They applied the CVA model to define the direction and value of these indices for determining either degradation or progress of land surface status in different periods. Additionally, they determined the desertification rate index based on the relationship between NDVI and albedo.
Han et al. (2015) calculated the MSAVI, FVC, and TVDI, and land surface temperature plus surface albedo to evaluate desertification using Landsat images by applying the geographic information system (Han et al., 2015). They used these indices to analyze the spatiotemporal pattern of desertification in different periods. Querino et al. (2016) analyzed the spatiotemporal dynamics of the normalized difference vegetation index (NDVI), leaf area index (LAI), surface albedo, and temperature in two different vegetation covers, preserved and deforested areas (Querino et al., 2016). They showed that the forest conversion implies a decreased NDVI and LAI and an increased surface albedo plus surface temperature.
Different methods have been presented to assess and classify desertification intensity levels in Hamoun International Wetland (Fozuni, 2007; Mohammad Ghasemi et al., 2008; Parvariasl et al., 2010; Zolfaghari et al., 2011; Eftekhari et al., 2015). Most of them have suffered many problems such as high costs, expansive areas, and lack of access to areas beyond the political boundaries of Iran due to political and security issues. On the other hand, previous studies have been based on the NDVI or other vegetation indices. The relationship between vegetation changes and albedo has been neglected or sparsely studied with regard to desertification in this region and other areas in Iran. With an area of about 15,197 km2, Hamoun International Wetland is located in the southeastern part of Iran, extending as a belt around the Sistan region with more than 400,000 people. Dried Hamoun Lake contains large amounts of erodible sediment, conducive to wind erosion and dust (Choobari et al., 2014). For ecological risk control of degradation in larger arid and semi-arid areas, using remote sensing with the extraction of the albedo and vegetation index is appropriate (Wei et al., 2020). The indices are simple and easy to obtain, which is conducive for quantitative analysis, evaluation, and monitoring of degradation rate (Wu et al., 2019).
Thus, it is necessary to use inexpensive and quick methods to monitor this area’s degradation and land cover changes. Detecting degradation areas for implementing appropriate management plans with the minimum cost and within the shortest time is of priority for governments and communities involved. To achieve this goal and identify the degradation areas in different periods, albedo indices and NDVI can be used to monitor and prepare degradation intensity maps. Because of its simplicity in detecting damaged areas within the shortest time with the lowest cost, this model, as a simple and innovative method, can serve as an alternative to the many methods presented for identifying desert areas that require extensive field operations, especially in large border areas located between countries and where field access to the areas is not safe. Despite the importance of Hamoun Wetland, most field studies on the status of this particular geographical area are difficult and rare due to its location between Iran and Afghanistan and the conflicts in Afghanistan (UNEP, 2002; FAO, 2015). Therefore, most studies have focused on the Iranian part of the wetland, and parts of the wetland located in Afghanistan have been less studied. Less has been studied about degraded areas in Hamoun International Wetland due to recent droughts and lack of access to a part of the wetland in Afghanistan. Degradation intensity was evaluated during different periods based on remote sensing technology in this study.
With about 15,197 km2, Hamoun International Wetland is situated in southeast Iran. The area of Hamoun International Wetland in Iran is 62,095 ha, while it is 66,478 ha in Afghanistan (Kariminazar et al., 2010) (Figure 1). The area is characterized by even topography occurring between 30° 5' _ 31° 28′ N and 60° 15' _ 61° 50′ E (Kariminazar et al., 2010). Hamoun International Wetland is one of the most ecologically valuable areas in Iran (Scott and Smart, 1992). According to the long-term statistics of the Zabol synoptic station, the mean long-term rainfall in this region is 61.1 mm, about 44% occurring in winter. The mean long-term temperature is 26.6°C, and the mean monthly temperatures of the warmest (July) and coldest months (January) are 41.4°C and 2.4°C, respectively. Based on long-term data, the maximum mean wind speed occurs in June, July, August, and September, while the lowest mean wind speed happens in December (Zolfaghari et al., 2011).
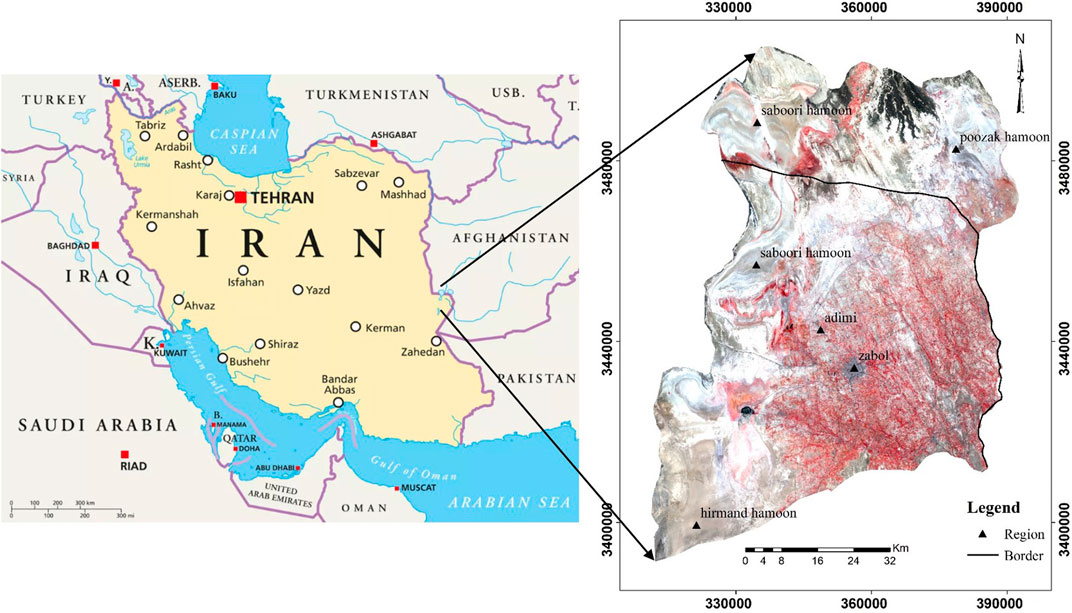
FIGURE 1. Location of the study area.
In this study, the steps to monitor degradation in the Hamoun International Wetland were as follows:
Step 1: Satellite images were prepared, and image preparation processes were performed.
Step 2: NDVI was calculated using reflectance bands and albedo index based on the SEBAL algorithm.
Step 3: The area’s degradation equation and degradation intensity map were prepared.
Step 4: Brightness and greenness indices for 16 August 1999 and 17 August 2020 were calculated to determine the intensity changes using vector analysis.
Step 5: The precision of the prepared map was assessed by controlling the points obtained from step 4, and a confusion matrix was formed.
In step 1, satellite data related to Landsat 8, OLI sensor, on 17 August 2020, 20 August 2015, and Landsat Thematic Mapper 5 (TM) for 16 August 1999, and 19 August 2009 (Path 157-Row 38 and Path 157-Row 39), with a completely clear sky, were downloaded from http: earthexplorer.usgs.gov/.
For proper image efficiency and reduction of sensor error and to increase the image quality before calculating the required indices, first, the DN value for each band must be converted into spectral radiance and then to spectral reflectance (Lamchin et al., 2016). This operation was carried out according to Landsat 8 manual (Landsat 8, 2015). The flowchart and different steps of determining the intensity of degradation based on the albedo–NDVI model and change vector analysis are shown in Figure 2. In this study, summer season (August) was selected to reduce the error caused by surface soil moisture. Another reason was the absence of annual plant species in this season since the soil surface is dry and contains only permanent species that play a very important role in soil stability and protection.
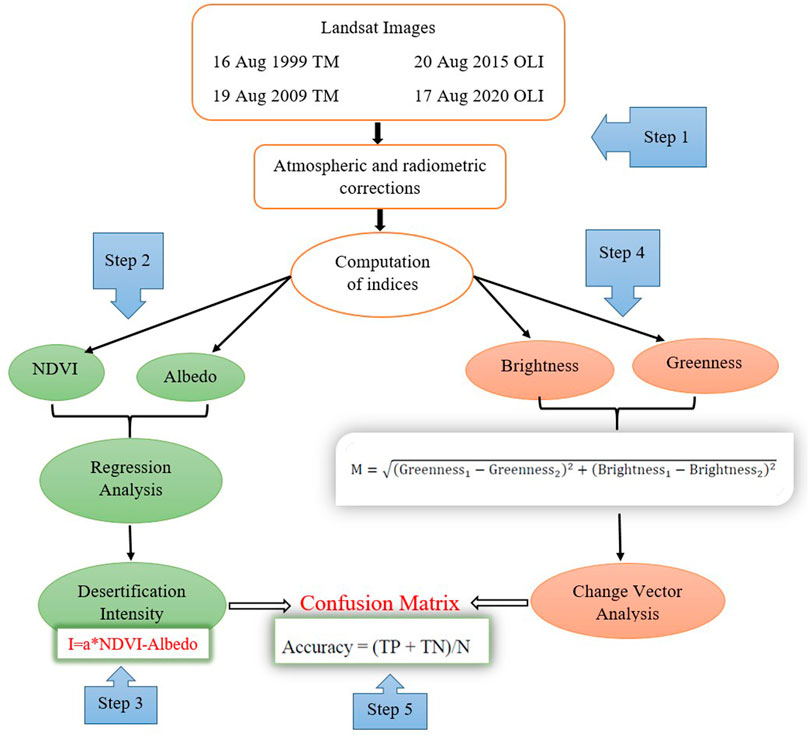
FIGURE 2. Steps in determining the intensity of degradation based on the albedo–NDVI model. N, condition negative; TP, true positive; TN, true negative; M, magnitude of change; I, intensity of degradation; greenness 1, 2, DN values of greenness from 1999 and 2020; brightness 1, 2, DN values of brightness from 1999 and 2020.
Normalized difference vegetation index (NDVI) are among the most important indicators, defined as the ratio of reflectivity measured in visible red radiation (red band) to near-infrared reflectance (NIR band). Since NDVI are highly affected by chlorophyll absorption in evergreen leafy cover and vegetation density and the contrast between vegetation and soil is highest in red and near-infrared bands, NDVI were selected (Cai et al., 2010; Khosravi et al., 2017). This index was estimated according to Eq. 1.
where NIR is the near-infrared band and R is the red band.
In this study, for the calculation of the water index, we used MNDWI (Modified Normalized Difference Water Index) to distinguish water bodies (Wu et al., 2019). The MNDWI was calculated using Equation 2.
where green is the green band and NIR is the near-infrared band.
Another important index is surface albedo, defined as the ratio of the reflected radiation to the incident shortwave radiation. The surface albedo was calculated using Eq. 3 (Allen et al., 2002).
where
αpath-radiance is the average portion of the incoming solar radiation across all bands which is back-scattered to the satellite before it reaches the earth’s surface, with the values for αpath-radiance ranging between 0.025 and 0.04 according to the SEBAL model; its value was set at 0.03 in this study (Allen et al., 2002).
αtoa is the above-atmospheric albedo and is calculated through Eq. 4 (Allen et al., 2002).
where
ωλ is the weighted coefficients for non-thermal bands and
ρλ is the spectral reflectivity of each band.
The weighted coefficients for non-thermal bands can be calculated from Eq. 5 (Allen et al., 2002).
where ESUNλ is the solar exo-atmospheric irradiance for each band.
τsw is the atmospheric transitivity, which is a part of the incident radiation transmitted by the atmosphere, and represents the effects of the atmosphere. Given that this effect exists for both incoming and outgoing radiation, its square is used to calculate the surface albedo. For a clear and dry sky, it is calculated using Eq. 6 (Allen et al., 2002).
where Z is elevation above sea level (m).
In step 3, to develop a degradation map, the NDVI and albedo indices were normalized. For processing normalization data, the maximum and minimum values of NDVI and albedo in the study area were found, they were used for data normalization processing based on Eqs 7 and 8, and then a linear regression was taken between these two indices (Zongyi et al., 2011; Han et al., 2015).
The slope coefficient of the regression line between NDVI and albedo indices was calculated to achieve the degradation intensity equation, and the resulting equation was applied to determine the degradation intensity. The relationship obtained from the linear regression between NDVI and albedo is given as Eq. 9:
To evaluate the degradation intensity of the study area, Eq. 10 was used (Zongyi et al., 2011; Lamchin et al., 2016):
In this equation, DI represents the degradation intensity, and the
The change vector analysis model was applied to multi-temporal data to compare the differences in intensity of change in times (Ali Baig et al., 2014). The tasseled cap greenness and brightness were used for two successive periods 1999 and 2020.
The magnitude of change was calculated by Eq. 11 to evaluate the intensity of change between 1999 and 2020.
The coefficient used for Landsat 8 (OLI) and Landsat 5 (TM) to evaluate the greenness and brightness of the study area is shown in Supplementary Tables S1, S2 (Khosravi et al., 2017).
Eventually, 1,476 pixels of different classes were selected randomly (Table 1), and a confusion matrix was created between the map prepared by the NDVI–albedo model and the change vector analysis derived from brightness and greenness indices to calculate the kappa coefficient accuracy.
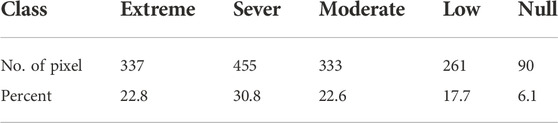
TABLE 1. Percentage of pixels selected in each class.
Evaluation and classification by the natural breaks method using ArcGIS10.8 revealed that the albedo index for August 1999, 2009, 2015, and 2020 was variable (Supplementary Figures S1, S2). The albedo index in the four periods showed the range of 0.06–0.63 in August 1999, 0.14–0.7 in August 2009, 0.11–0.81 in August 2015, and 0.13–0.45 in August 2020. The maximum albedo increased from 1999 to 2015, but in 2020, it decreased due to floods in parts of the wetland (Table 2). Additionally, the average albedo index in the region was variable from 1999 to 2020.
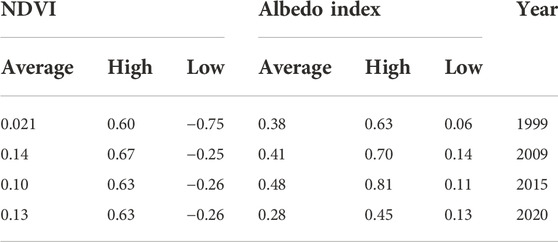
TABLE 2. Results from the study of albedo and NDVI.
The results also showed that the highest albedo value occurred in the northern, northwestern, and western parts of the wetland (Saburi and Puzak Hamoun), indicating vegetation decline and destruction of Hamoun International Wetland during the years. The results of the classification of albedo classes in the study area using the Jenks natural breaks method are presented in Table 2.
The NDVI estimations for August 1999, 2009, 2015, and 2020 are shown in Supplementary Figures S3, S4 for a comparative study of the changing trend.
According to NDVI classification using ArcGIS10.8, the range was between −0.75 and +0.60 in August 1999 and between −0.25 and +0.67 in August 2009. It was between −0.26 and +0.63 in August 2015 (Table 2).
The higher minimum in 1999 was due to the upper water level in Hamoun Wetland, and during the years, the water level has decreased, and the minimum range has also decreased.
The linear regression between NDVI and albedo is shown in Figure 3. The regression between the NDVI and albedo showed a high correlation between these two indices, with the coefficient of determination R2 = 0.72 and the negative correlation coefficient R = −0.849.
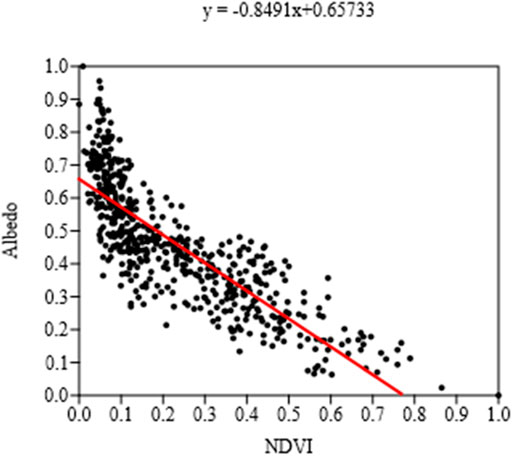
FIGURE 3. Linear regression between NDVI and albedo.
Evaluation of degradation intensity based on the albedo–NDVI model in the study area in August 1999 showed 28.72% of the study area was classified in the severe degradation class and 31.79% was in the extreme one (Figure 4, Supplementary Table S3). Based on the degradation intensity map results, severe and extreme degradation intensities were observed in parts of the wetland that has been already dried up. This year, 10.22% of the study area was covered with water (Figure 5A).
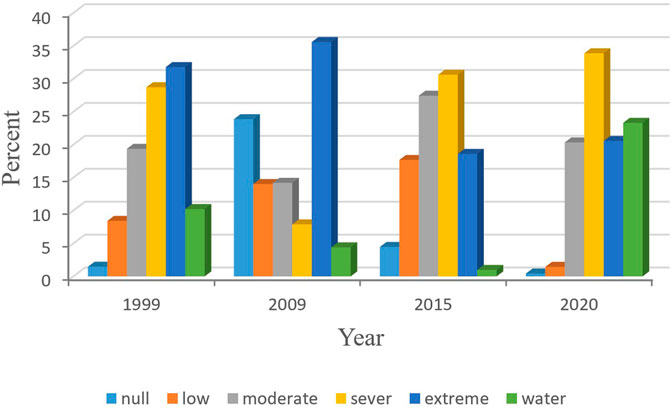
FIGURE 4. Degradation intensity percent for study periods.
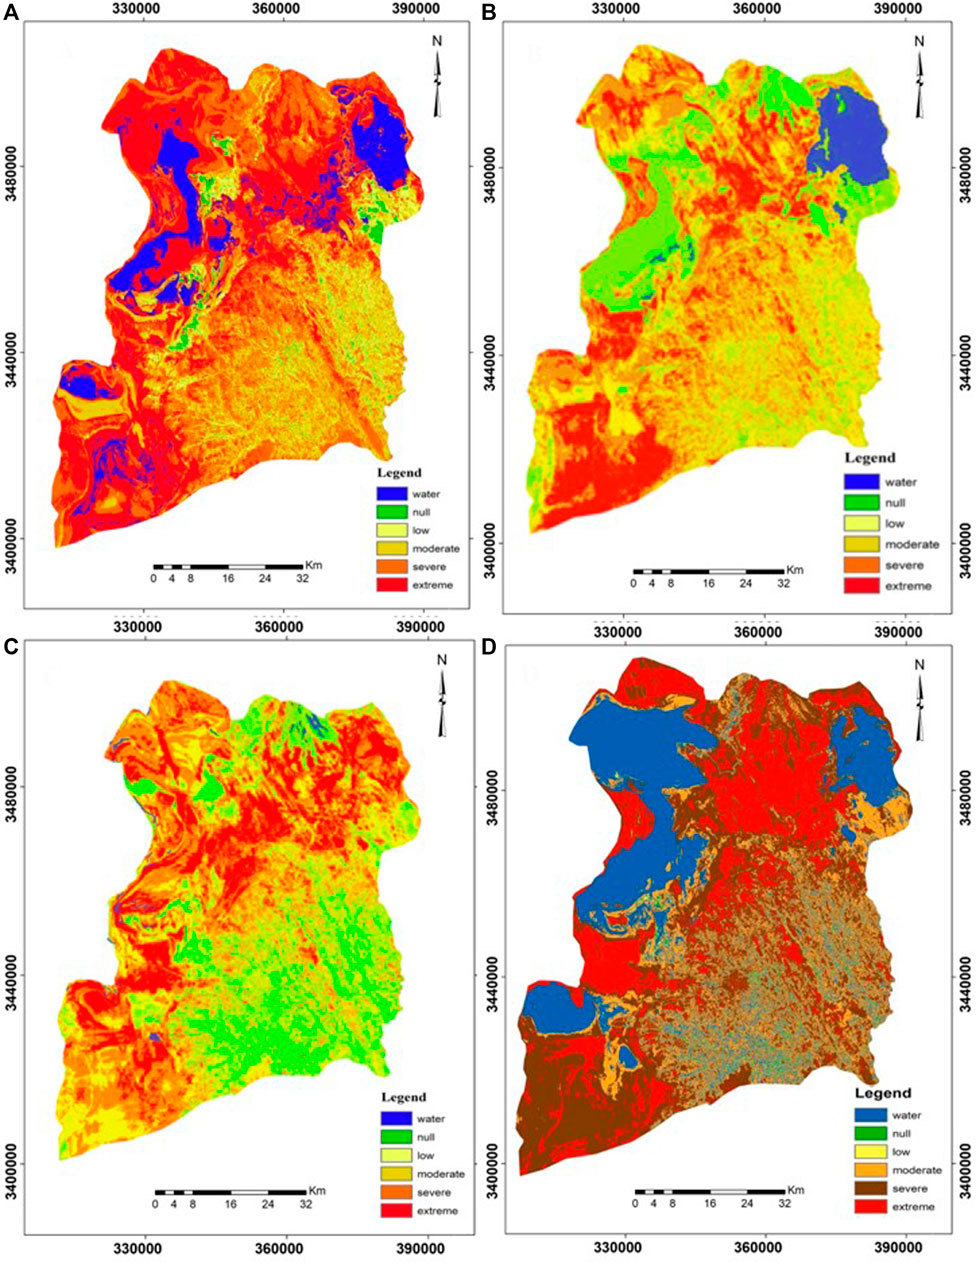
FIGURE 5. Degradation intensity map of studied periods. (A) August 1999, (B) August 2009, (C) August 2015, and (D) August 2020.
Evaluation of degradation intensity based on the albedo–NDVI model in the study area in August 2009 showed that 7.89% was classified as severe degradation intensity and 35.59% was in the extreme class (Figure 4, Supplementary Table S3). Based on the degradation intensity map, severe and extreme degradation intensities were observed in some parts of the wetland and the central and agricultural land in the study area (Figure 5B).
Evaluation of degradation intensity based on the albedo–NDVI model in the study area in August 2015 showed 30.62% of the area in the severe degradation intensity and 18.60% in the extreme class. Approximately all wetland area was dry and without water (Figure 4, Supplementary Table S3). Additionally, severe and extreme degradation intensities were observed in the north and west of the studied region, which indicated the wetland area (Figure 5C).
Evaluation of degradation intensity based on the albedo–NDVI model in the study area in August 2020 showed 33.88% of the area in the severe degradation intensity and 20.57% in the extreme class (Figure 4, Supplementary Table S3). Moreover, severe and extreme degradation intensities were observed in the north and west of the studied region. Due to the flooding of the wetland in 2020, the extreme degradation class decreased (Figure 5D). The description of degradation intensity classes is shown in Table 3.

TABLE 3. Description of different degradation intensities in the study area.
The rate changes in degradation intensity classes around the studied period 1999–2020 showed that 3.72% of the area without degradation and 2.88% of the area with low degradation intensity have decreased. Also, the area of severe degradation class has increased by 6.36 percent, and the area of extreme degradation class has decreased by 8.44%. Due to the flooding of the wetland in 2020, the highest degradation intensity in the study area occurred from 2015 to 2020. In the four studied periods, the regions without degradation, with low degradation, and with medium degradation decreased, but those with severe and extreme intensity increased. The average of changes in all classes was about +5.81% for 1999–2009, +3.43% for 2009–2015, +9.24% for 1999–2015, −13.11% for 1999–2020, −18.92% for 2009–2020, and −22.35% for 2015–2020 (Table 4).
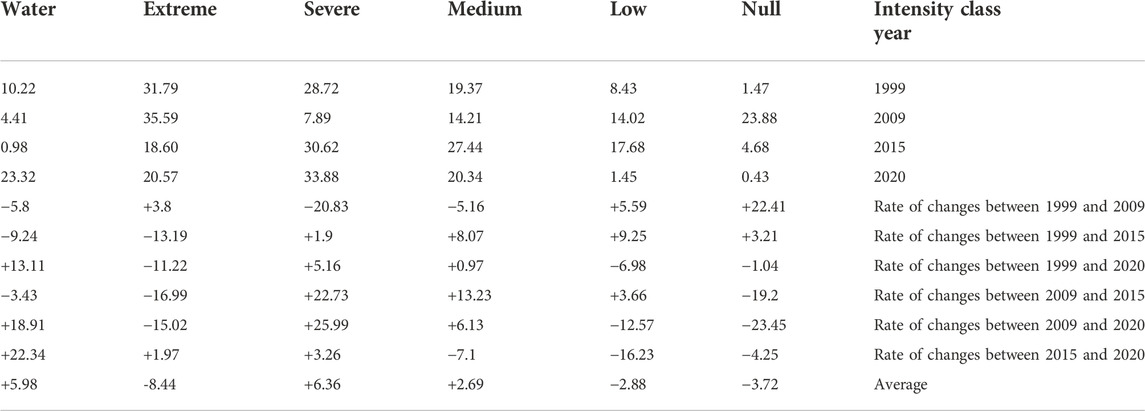
TABLE 4. Percentage of changes in degradation intensity classes in the study periods (1999–2020).
The results of the evaluation of the intensity changes based on the change vector analyses showed that 56.16% of the area had extreme changes, and the highest level of changes occurred in the wetland area (Figure 6). Table 5 shows the intensity change classification from 1999 to 2020.

FIGURE 6. Intensity map of changes from 1999 to 2020.
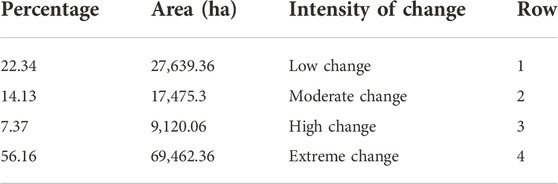
TABLE 5. Intensity change classification from 1999 to 2020.
The confusion matrix between the degradation intensity map obtained from the albedo–NDVI model and the degradation based on the linear coefficient of variation derived from brightness and greenness indices was used to evaluate the accuracy of the degradation intensity map classification. The confusion matrix for 1,476 pixels showed that the kappa coefficient was 0.705 (Table 6).
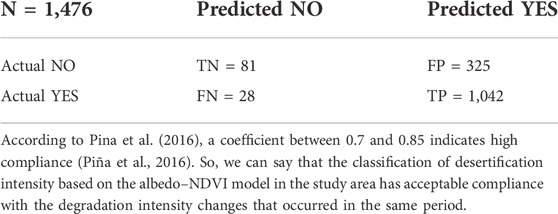
TABLE 6. Results of the confusion matrix.
In this research, we studied the degradation intensity of a region using a remote sensing technique based on spectral reflectance from the earth’s surface.
A linear regression analysis between NDVI and the albedo index showed a negative and strong relationship (r = −0.849), consistent with the results presented by Pan and Li (2013), Karnieli et al. (2014), and Piña et al. (2016). Increased NDVI is accompanied by a decline in albedo, where areas with high albedo indicate vegetation degradation and bare soil. In the study area, due to frequent droughts, drying of Lake Hamoun, and high evaporation intensity, vegetation is one of the points of desertification, consistent with the study of Zolfaghari et al. (2013). The degradation intensity map of the study area in 1999 revealed that the classes with the highest degradation intensity were observed in parts of the wetland that dried up, and there was no extreme class in the study area. In total, 28.72% of the area was classified into the severe degradation class and 31.79% into the extreme class. Evaluation of the degradation intensity map obtained from the albedo–NDVI for 2015 showed that 76.66% of the study area had an extreme, severe, and moderate degradation intensity class. A total of 49.22% of the area had an extreme and severe class, consistent with the results reported by Zolfaghari et al. (2011). As expected, the severe and extreme degradation classes in the proposed maps correspond to the areas with the minimum NDVI and the maximum albedo. Evaluation of the degradation intensity maps in 1999 and 2009 showed that 60.51% and 43.48% of the study area had severe and extreme degradation classes. One of the main reasons for the very high percentage of destruction in 1999 is the dryness of a large part of Saburi Hamoun in Afghanistan, as shown in Figure 5A. The rate of changes in degradation intensity classes showed that the highest intensity of changes occurred between 2015 and 2020 with 22.35% because a large part of Saburi and Puzak Hamoun in Iran and Afghanistan is dry, and the soil is bare due to the prevailing drought conditions in the wetland. Except for a few spots of scattered vegetation, the triple hamouns are affected by wind erosion. It is consistent with the studies of Rashki et al. (2015). Additionally, the rate of changes in degradation intensity classes between 2009 and 2020 was 18.92% and between 2009 and 2015 was 3.43%. It was 13.11% between 1999 and 2020, 9.24% between 1999 and 2015, and 5.81% between 1999 and 2009. The results showed that 22.32% of null areas, 17.28% of areas with low degradation, and 50.62% of areas with extreme degradation were reduced from 1999 to 2020. Meanwhile, 16.14% and 38.21% were added to areas with moderate and severe degradation classes, respectively. Additionally, the map of degradation intensity classes showed that the highest degradation intensity is related to the northern, northwestern, and western parts of Hamoun International Wetland, corresponding to areas of the three hamouns that are dry and where the dust rises into the air (Rashki et al., 2015). Therefore, it can be said that albedo is one of the main parameters for inland studies whose effects on the environment should be discussed. Additionally, the maps prepared for albedo distribution (Supplementary Figures S1, S2) and NDVI classification (Supplementary Figures S3, S4) indicated that the lowest NDVI and the highest albedo value occurred in the northern and western parts of the study area, coinciding with the most intense degradation class. NDVI is among the indices sensitive to viable and healthy vegetation. The vegetation distribution map showed that over 65% of the study area was characterized by an NDVI of less than 0.15, representing bare soil. The results reported by Zolfaghari et al. (2011) of a part of the Sistan region revealed that vegetation indices were among the indices for determining desertification (Zolfaghari et al., 2011). Additionally, based on the surface albedo distribution map, 43% of the region had an albedo value larger than 0.45. To evaluate the relationship between these two indices, we selected 600 points randomly where the regression correlation between the NDVI and albedo index showed a negative and robust correlation coefficient with a value of r = 0.849. These were compatible with the studies by Zongyi et al. (2011), Pan and Li (2013), Cordeiro et al. (2015), and Querino et al. (2016). Investigation of the degradation intensity map of the albedo index and NDVI indicated that 79.88, 57.69, 76.66, and 74.79% of the study area were found to belong to very intense, intense, and moderate degradation classes for 1999, 2009, 2015, and 2020, respectively. Over 49% of the region is characterized by very intense and intense degradation classes for 1999, 2015, and 2020, confirming the results reported by Zolfaghari et al. (2011). Additionally, according to Supplementary Figures S1, S2, and S4, intense and very intense degradation classes corresponded with areas with the minimum NDVI and maximum albedo values. In this study, it was found that the value of surface albedo in each area is influenced by the characteristics of that area. The map of degradation intensity classes indicated that the highest degradation intensity occurred in the northern, northwestern, and western parts of the Hamoun International Wetland. Thus, albedo is one of the important parameters in land use-related studies that should be discussed further due to its environmental impacts.
Results of the different periods showed that the areas without degradation and with low intensity of degradation decreased and were added to those with severe class from 1999 to 2020. However, the area of extreme class fluctuated and did not follow a general trend due to fluctuations in water and the level of dewatering of the wetland. When the surface of the wetland dries up, the surface of the land is free of moisture and vegetation and classified as extreme degradation class because the rate of albedo increases and the NDVI decreases. Additionally, when the wetland is flooded, the degradation area is highly reduced. Unlike expectations, the land area without any degradation increased in 2009 due to the temporarily created vegetation.
In summary, the results obtained are as follows:
1. The highest intensity of degradation occurred outside Iran between Hamoun Puzak and Saburi inside Afghanistan during the study period, consistent with the highest albedo and the lowest NDVI in these areas.
2. The highest intensity of changes in Saburi, Puzak, and Helmand hamouns occurred during the study period due to the presence of water or drought in Hamoun International Wetland.
3. The intensity of the changes based on the change vector analysis between 1999 and 2020 also showed that the most severe changes occurred in the range of the triple hamouns.
4. Degradation intensity maps (with Kappa coefficients ranging from 0.7 to 0.85) prepared using the albedo–NDVI model, are highly accurate compared to the maps derived from the change vector analysis models.
5. Monitoring of degraded areas with lack of access to the field can be done with this technique with high accuracy.
6. The development and use of this model may be a new step toward identifying and monitoring degradation in remote areas and determining dust sources in areas prone to wind erosion.
The original contributions presented in the study are included in the article/Supplementary Material; further inquiries can be directed to the corresponding author.
FZ: formal analysis and writing the original draft. HKh: methodology. HA: conceptualization. GhZ: data curation. SKS: software.
The authors declare that the research was conducted in the absence of any commercial or financial relationships that could be construed as a potential conflict of interest.
All claims expressed in this article are solely those of the authors and do not necessarily represent those of their affiliated organizations, or those of the publisher, the editors, and the reviewers. Any product that may be evaluated in this article, or claim that may be made by its manufacturer, is not guaranteed or endorsed by the publisher.
The Supplementary Material for this article can be found online at: https://www.frontiersin.org/articles/10.3389/fenvs.2022.902687/full#supplementary-material
Ali Baig, M, H., Zhang, L., Shuai, T., and Tong, Q. (2014). Derivation of a tasselled cap transformation based on Landsat 8 at-satellite reflectance. Remote Sens. Lett. 5 (5), 423–431. doi:10.1080/2150704X.2014.915434
Allen, R., Tasumi, M, and Trezza, R. (2002). SEBAL (surface energy balance algorithms for land)-advanced training and user’s manual-idaho implementation, version 1.0.
BdaS, Bernardo, Alexandra, C. B., Celia, C. B., MmdeO, Leidjane, Suzana, M. G. L. M., and Bernardo, B. J. (2016). Procedures for calculation of the albedo with OLI-Landsat 8 images: Application to the Brazilian semi-arid. Rev. Bras. Eng. Agric. Ambient. 20 (1), 3–8. doi:10.1590/1807-1929/agriambi.v20n1p3-8
Cai, G., Du, M., and Liu, Y. (2010). Regional drought monitoring and analyzing using MODIS data—A case study in yunnan province. Proc. 4th IFIP Int. Fed. Inf. Process. 345, 243–251.
Choobari, O., Zawar, R. P., and Sturman, A. (2014). The wind of 120 days and dust storm activity over the Sistan Basin. Atmos. Res. 143, 328–341. doi:10.1016/j.atmosres.2014.02.001
Cordeiro, M. C., Santos, N. A., Silva, V. M. A., Luiz, D. M., and Silva, V. P. R. (2015). Case study: Identification of desertification in the years 1999, 2006, and 2011 in mossoró-rn. Jour. Hyp. Rem. Sen. 4, 101–106. doi:10.29150/jhrs.v5.4.p101-106
Eftekhari, R., Shahriyari, A. R., and Ekhtesasi, M. R. (2015). Assessment and mapping of current and potential desertification using MICD Model with emphasis on wind erosion criteria in the southwest of Hirmand city. J. Dev. Geogr. 38, 139–150.
FAO (2015). Analysis on water availability and uses in Afghanistan river basins: Water accounting through remote sensing (WA+) in Helmand River Basin. FAO Project TCP/AFG/3402, 50.
Fozuni, L. (2007). Evaluation of the current status of desertification Sistan plain using modify MEDALUS Model with emphasis on wind and water erosion criteria. Master’s degree in desertification thesis. The University of Zabol.
Goudei, A. S., and Middleton, N. J. (2006). Desert dust in the global System. Heidelberg: Springer Verlag, 1–287.
Han, L., Zhang, Z., Zhang, Q., and Wan, X. (2015). Desertification assessments in the Hexi corridor of northern China’s Gansu Province by remote sensing. Nat. Hazards (Dordr). 75, 2715–2731. doi:10.1007/s11069-014-1457-0
Houldcroft, C. J., Grey, W. F., Barnsley, M., Taylor, C. M., Los, S. O., and North, P. R. J. (2009). New vegetation albedo parameters and global fields of soil background albedo derived from MODIS for use in a climate model. J. Hydrometeorol. 10, 183–198. doi:10.1175/2008JHM1021.1
Kang, H., and Hong, S. (2008). An assessment of the land surface parameters on the simulated regional climate circulations: The 1997 and 1998 East Asian summer monsoon cases. J. Geophys. Res. 113, D15121. doi:10.1029/2007jd009499
Kariminazar, M., Mosaaedi, A., and Moghadamnia, A. R. (2010). Investigation of climatic factors affecting the occurrence of drought (Case Study of Zabol Region). J. Water Soil Conservation 17 (1), 145–158.
Karnieli, A., Qin, Z., Wu, B., Panov, N., and Yan, F. (2014). Spatio-temporal dynamics of land-use and land-cover in the mu us sandy land, China, using the change vector analysis technique. Remote Sens. 6, 9316–9339. doi:10.3390/rs6109316
Khosravi, H., Haydari, E., Shekoohizadegan, S., and Zareie, S. (2017). Assessment the effect of drought on vegetation in desert area using Landsat data. Egypt. J. Remote Sens. Space Sci. 20, S3–S12. doi:10.1016/j.ejrs.2016.11.007
Lamchin, M., Lee, J. Y., Lee, W. K., Lee, E. J., Kim, M., Lim, C. H., et al. (2016). Assessment of land cover change and desertification using remote sensing technology in a local region of Mongolia. Adv. Space Res. 57 (1), 64–77. doi:10.1016/j.asr.2015.10.006
LANDSAT 8 (L8) Data users handbook, (2015). The Landsat 8 Data User’s Handbook is a living document prepared by the U.S. Geological Survey Landsat Project Science Office at the Earth Resources Observation and Science (EROS) Center in Sioux Falls, Greenbelt, Maryland: Zanter LSDS CCB Chair USGS. Version 1.0.
Mohammad Ghasemi, S., GhR, Zehtabian, and Ahmadi, H. (2008). Assessment of desertification intensity based on water index using MEDALUS methodology. Pajouhesh Sazandegi 80, 59–67.
Myhre, G., and Myhre, A. (2003). Uncertainties in radiative forcing due to surface albedo changes caused by land-use changes. J. Clim. 16, 1511–1524. doi:10.1175/1520-0442-16.10.1511
Pan, J., and Li, T. (2013). Extracting desertification from Landsat TM imagery based on spectral mixture analysis and Albedo- Vegetation feature space. Nat. Hazards (Dordr). 68, 915–927. doi:10.1007/s11069-013-0665-3
Parvariasl, H., Pahlavanravi, A., and Moghaddamnia, A. R. (2010). Assessing desertification hazard in Neiyatak region using ESAs Model. J. Iran Nat. Resour. 2, 42–54.
Piña, R. B., Diaz-Delgado, C., Mastachi-Loza, C. A., and González-Sosa, E. (2016). Integration of remote sensing techniques for monitoring desertification in Mexico. Hum. Ecol. Risk Assess. Int. J. 22, 1323–1340. doi:10.1080/10807039.2016.1169914
Querino, C. A. S., Beneditti, C. A., Machado, N. G., Silva, M. J. G., da Silva Querino, J. K. A., dos Santos Neto, L. A., et al. (2016). Spatiotemporal NDVI, LAI, albedo, and surface temperature dynamics in the southwest of the Brazilian Amazon forest. J. Appl. Remote Sens. 10 (2), 026007. doi:10.1117/1.JRS.10.026007
Rashki, A., Kaskaoutis, D. G., Francois, P., Kosmopoulos, P. G., and Legrand, M. (2015). Dust- storm dynamics over Sistan region, Iran: Seasonality, transport characteristics and affected areas. Aeolian Res. 16, 35–48. doi:10.1016/j.aeolia.2014.10.003
Scott, D. A., and Smart, M. (1992). Wetlands of the sistan basin, south caspian, and fars, islamic republic of Iran. Ramsar Conv. Monit. Proced. Rep. No., Gland, Switzerland: Ramsar Convention Bureau 26, 53.
Wei, H., Wang, J., and Han, B. (2020). Desertification information extraction along the China–Mongolia railway supported by multisource feature space and geographical zoning modeling. IEEE J. Sel. Top. Appl. Earth Obs. Remote Sens. 13, 392–402. doi:10.1109/jstars.2019.2962830
Wu, Zh, Lei, Sh, Bian, Zh, Huang, J., and Zhang, Y. (2019). Study of the desertification index based on the albedo-MSAVI feature space for semi-arid steppe region. Environ. Earth Sci. 78 (6), 232. doi:10.1007/s12665-019-8111-9
Zhao, Y., Wang, X., Novillo, C. J., Arrogante-Funes, P., Vázquez-Jiménez, R., and Maestre, F. T. (2018). Albedo estimated from remote sensing correlates with ecosystem multifunctionality in global drylands. J. Arid. Environ. 157, 116–123. doi:10.1016/j.jaridenv.2018.05.010
Zolfaghari, F., Khosravi, H., Shahriyari, A., Jabbari, M., and Abolhasani, A. (2019). Hierarchical cluster analysis to identify the homogeneous desertification management units. PLoS ONE 14 (12), 02263555–e226421. doi:10.1371/journal.pone.0226355
Zolfaghari, F., Shahriyari, A., and Fakhireh, A. (2013). Evaluate the effect of vegetation cover on land degradation process using IMDPA model and GIS (Case study: Sistan plain). J. Appl. RS GIS Tech. Nat. Resour. Sci. 4 (1), 69–77.
Zolfaghari, F., Shahriyari, A., Fakhireh, A., Rashki, A. R., Noori, S., and Khosravi, H. (2011). Assessment of desertification potential using IMDPA model in Sistan plain. Watershed Manag. Res. 9, 97–107.
Keywords: monitoring, degradation, albedo, NDVI, Hamoun Wetland
Citation: Zolfaghari F, Azarnivand H, Khosravi H, Zehtabian G and Sigaroudi SK (2022) Monitoring the severity of degradation and desertification by remote sensing (case study: Hamoun International Wetland). Front. Environ. Sci. 10:902687. doi: 10.3389/fenvs.2022.902687
Received: 23 March 2022; Accepted: 03 November 2022;
Published: 28 November 2022.
Edited by:
Hamid Gholami, University of Hormozgan, IranReviewed by:
Shuisen Chen, Guangzhou Institute of Geography, ChinaCopyright © 2022 Zolfaghari, Azarnivand, Khosravi, Zehtabian and Sigaroudi. This is an open-access article distributed under the terms of the Creative Commons Attribution License (CC BY). The use, distribution or reproduction in other forums is permitted, provided the original author(s) and the copyright owner(s) are credited and that the original publication in this journal is cited, in accordance with accepted academic practice. No use, distribution or reproduction is permitted which does not comply with these terms.
*Correspondence: Farhad Zolfaghari, em9sLmZhcmhhZEBnbWFpbC5jb20=
Disclaimer: All claims expressed in this article are solely those of the authors and do not necessarily represent those of their affiliated organizations, or those of the publisher, the editors and the reviewers. Any product that may be evaluated in this article or claim that may be made by its manufacturer is not guaranteed or endorsed by the publisher.
Research integrity at Frontiers
Learn more about the work of our research integrity team to safeguard the quality of each article we publish.