- 1Environmental Engineering Program, University of Northern British Columbia, Prince George, BC, Canada
- 2School of Engineering, University of British Columbia, Okanagan Campus, Kelowna, BC, Canada
- 3Ecosystem Science, Fisheries and Oceans Canada, Ottawa, ON, Canada
- 4Environmental Systems Engineering, Faculty of Engineering and Applied Science, University of Regina, Regina, SK, Canada
The understanding of waste generation is of critical importance for effective oily waste management in marine oil spill response operation. A system dynamics model was developed in this study to estimate the quantity of oily waste generated from marine oil spill response operations. Various aspects were considered, including weather conditions, spilled oil volume and characteristics, response time, and response methods. The types of oily waste include recovered oil, oily water, oily sorbents, oily personal protection equipment, and oily debris. The model was validated using data collected from an actual oil spill incident in British Columbia, Canada. The comparison of model estimation and observed results showed an average prediction accuracy of 86%. Sensitivity analysis was conducted to examine the impacts of two modeling parameters, including response arrival time and sorbent booms amount. Results of a case study indicated that initiation of response operations 5-h earlier could increased oil recovery by 26%. Furthermore, sensitivity analysis highlighted a 45% overuse of sorbents which resulted in the generation of unnecessary oily solid waste. Response surface methodology (RSM) analysis was applied to analyze the interaction effect of model parameters on model outputs. Results showed a significant interaction between sea temperature and response arrival time on recovered oil and between sorbent boom weight and sorbent booms usage rate on solid waste. The developed model can provide an effective tool for informed waste management decision-making related to marine oil spill response operations.
1 Introduction
Marine oil spills can result from maritime accidents or human activities, such as transportation, drilling, storing, manufacturing, and even illegal oily waste discharge to the ocean (Gong et al., 2014). It was reported that more than seven million tons of oil from about 140 large spills were released into the marine environment from 1907 to 2014 (Li et al., 2016). In 2010, the Deepwater Horizon spill released around four million barrels of oil to the Gulf of Mexico, representing the largest marine oil spill incident in history, which resulted in an environmental disaster and killed a large population of marine animals (EPA, 2022). As spills can cause significant environmental, economic, and health consequences; immediate response actions are usually applied on the sea (offshore) and on shorelines (Li et al., 2016; Chen et al., 2019; Zhang et al., 2019). The four most commonly actively used response methods are i) mechanical containment and recovery through the use of skimmers, booms, oil-water separators, and/or adsorbents; ii) use of chemical dispersants; iii) in-situ burning, and iv) bioremediation (Dave and Ghaly, 2011; Ivshina et al., 2015; Hu et al., 2020; Mohammadiun et al., 2021). Mechanical containment and recovery is the primary response option of choice globally due to its capability of recovering spilled oil and its low environmental effects (Chen et al., 2019; Hu et al., 2020).
In general, the type and volume of oily waste generated from oil spill response operations mainly depends on the type and volume of spilled oil, the oil characteristics (e.g., oil viscosity), the ocean and weather conditions, the response time, and the utilized response methods (Massoura and Sommerville., 2009; IPIECA-IOGP., 2016). The type of oil due to weathering processes like dispersion or evaporation and their effect on the chance of spilled oil reaching the shoreline may affect the quantity, quality, and types of generated waste (IPIECA-IOGP., 2016). The selection of response method depends on different factors, such as oil type, and the response method used considerably affects the quantity and types of waste generated from the response operation. For example, mechanical containment and recovery as the most common oil spill response method, generates a large amount of oily waste, including liquid waste (e.g., emulsified oil and oily water) and solid waste (e.g., oily sorbents, oily debris, and oily personal protective equipment (PPE)) (Saleem et al., 2022).
The generated waste can be ten times more than the original oil spill volume, which presents a significant waste management challenge (IPIECA-IOGP., 2016; POSOW., 2016). Oily waste management generally consists of waste minimization, short-term and long-term storage, transportation, treatment, and final disposal (IPIECA-IOGP., 2016; POSOW., 2016). For effective waste management, an estimation of waste quantity is of fundamental importance. This is a challenging task since many factors affect the rates and type of waste generated (IPIECA-IOGP., 2016; POSOW., 2016). Numerous researchers have developed computational models and tools to support strategies of oily waste management. IMO. (2010) as a guideline for oil spill waste management, identified various factors that would affect the quantity of oily waste generated from response operations. Although the relationship between the initial spilled oil volume and the waste generation has been preliminarily identified based on historical accidental oil spills (Wadsworth., 2014; IPIECA-IOGP., 2016), there is still a lack of oily waste quantification models. Metcalf (2014) developed a location-based oil spill waste management plan to study the effect of response tactics and shoreline operations in different locations on the generated waste. Chen et al. (2021) developed a mathematical model to reduce oil spill waste management costs by optimizing the waste inventory allocation scheme under uncertainty, but while their model provided waste management solutions, it could not accurately estimate the quantity of waste generation. Most previous studies were focused on developing oil spill clean-up strategies, and very few studies were related to oily waste quantity estimation.
System dynamics has been applied to analyze the nonlinear temporal behavior of a complex system based on the causal relations among system components (Al-Khatib et al., 2016). Many studies have used system dynamics to investigate different systems such as environmental and health-care systems (Kollikkathara et al., 2010; Ciplak and Barton., 2012; Al-Khatib et al., 2016). For example, Al-Khatib et al. (2016) developed a system dynamics model regarding hospital hazardous waste management to determine the effect of various factors on hospital waste segregation. Vensim® and STELLA® are the commonly used software tools for system dynamics modeling (Kollikkathara et al., 2010). Unlike machine learning-based methods such as neural networks (Vu et al., 2021, 2022), system dynamics modeling does not require big data. This would make it a suitable approach for oil spill response waste (OSRW) estimation where there is a considerable lack of waste generation data from historical oil spills.
To the best of our knowledge, system dynamics modeling has not been used for OSRW estimation. The objective of this study is to develop a system dynamics model to estimate the quantity of different types of oily waste generated from marine oil spill response. Various aspects are taken into account in the model development, such as the used response methods for recovery of spilled oil, the equipment and number of vessels, weather condition, response time, initial oil spill volume, and ocean condition. The data collected from an actual oil spill incident in British Columbia, Canada, was used to validate the performance of the model. Although the developed system dynamics model is validated through a case study of diesel spill, the model and mathematical equations included can be applied to other types of oil spills. The proposed system dynamics modeling approach would provide an effective tool for quickly quantifying oily waste generation from marine oil spill response under different conditions, and the outcomes would be useful for the development of effective oily waste management strategies.
2 Methodology
By using STELLA® Professional (version 2.1.4) software, a system dynamics model was developed to estimate the quantity of offshore OSRW. Oily wastes generated from shoreline clean-up and recovery were not considered in the model. Because of the low waste generation of dispersant and in-situ burning response methods and the strict environmental regulations limiting the use of these methods, the model was mainly developed to account for the waste generation from offshore mechanical containment and recovery operations.
2.1 Types of Oily Waste
Oily wastes generated from oil spill response operation and supporting activities can be classified into two categories, including oily solid waste and liquid waste (IPIECA-IOGP., 2016; POSOW., 2016). At-sea containment and recovery operations usually result in the generation of oily water, recovered oil, and solid waste. Solid waste may include oil contaminated PPE, vegetation, sorbent materials, debris, and animal carcasses (IPIECA-IOGP., 2016; POSOW., 2016). During offshore response operations, the quantity of oiled vegetation and animal carcasses, is usually very low as compared to other types of material recovered. Table 1 lists the oily waste types considered in the system dynamics model development.
2.2 System Dynamics Model
Figure 1 presents the structure of OSRW estimation model. It includes different sub-models to quantify recovered oil (Figure 1A), oily water (Figure 1B), and solid waste (oily PPE, oily sorbents, and oily debris) (Figure 1C). A number of stock variables were used in the model, including “Recoverable oil (RO),” “Recovered oil from skimming (RS),” “Recovered oil from sorbents (RA),” “Oily water (OW),” “Oily PPE (OP),” “Oily sorbents (OS),” and “Oily debris (OD)”.
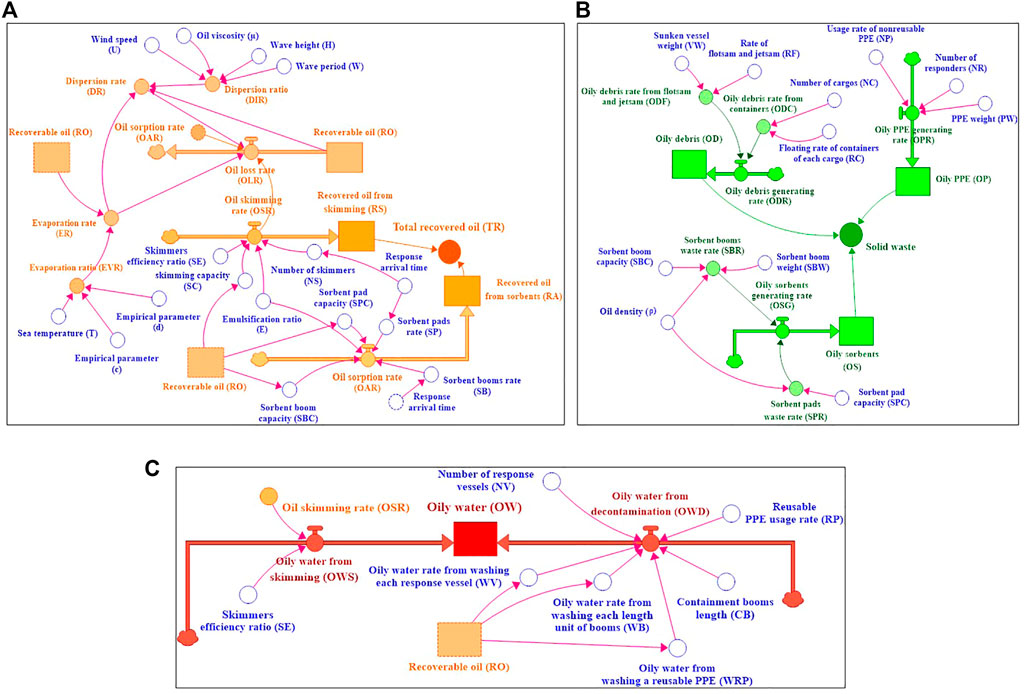
FIGURE 1. Overview of the system dynamics model for estimating (A) recovered oil, (B) oily water, (C) solid waste collected from oil spill response.
2.2.1 Sub Model for Estimating Recovered Oil
After an oil spill, responders try to recover as much spilled oil as possible. The mechanical containment and recovery operation usually includes booming operations coupled with skimmers and the use of sorbents (ITOPF.,2012; IPIECA-IOGP., 2016; POSOW., 2016). Although sorbent pads might be more effective on shorelines, in some offshore oil spills, especially when the type of original spilled oil is light, responders apply sorbent pads at sea to recover spilled oil. As a kind of boom with the absorption capability to recover oil, sorbent boom is the other common type of sorbents used in oil spill response operations (ITOPF., 2012). Different factors, including oil weathering, volume and type of spilled oil, and equipment specifications, can greatly affect the volume and quality of recovered oil (IPIECA-IOGP., 2016; Etkin and Nedwed., 2021).
In this study, it is assumed that the total volume of recoverable oil after oil spill occurrence is related to oil weathering processes (evaporation, dispersion), the rate of recovered oil from skimming, and the use of sorbents. Moreover, to estimate the recovered oil as a portion of the original spilled oil, the water content in the recovered oil is considered. The water content in the recovered oil (water-in-oil emulsions) varies depending on the oil type and response time. The emulsified oil generally contains less than 50% of water on the day of formation (Fingas and Fieldhouse., 2003). In addition to water-in-oil emulsions, skimmers, depending on the efficiency, might collect water containing oil (oil-in-water emulsions) during the oil skimming.
The total recovered oil (TR) [L3] is equal to the sum of the total recovered oil from skimming (TRS) [L3] and the total recovered oil from sorbents (TRA) [L3]. The total recovered oil from skimming (TRS) and from sorbents (TRA) equal the value of “Recovered oil from skimming (RS)” [L3T−1] and “Recovered oil from sorbents (RA)” [L3T−1] stocks, respectively, in the last unit time of response (Figure 1A).
Oil loss rate (OLR) [L3T−1] as the outflow for the “recoverable oil (RO)” [L3T−1] stock (Figure 1A) defines the rate of decrease in the volume of recoverable oil remaining on the ocean due to the recovery operations and the oil weathering processes. The initial value of the RO stock equals the oil spill volume (OV) [L3]. Figure 1A demonstrates that OLR is dependent on the evaporation rate (ER) [L3T−1] and dispersion rate (DR) [L3T−1] of oil on the ocean, the oil skimming rate (OSR) [L3T−1], and the oil sorption rate (OAR) [L3T−1]. In the system dynamics model, time t [T] refers to the time starting just after an oil spill incident until the end of the offshore response operations. The calculations of ER and DR are shown in Eqs. 1–4 (Fingas., 2011; Fingas., 2014)
where the evaporation ratio (EVR) (%) of the recoverable oil depends on the oil type, ocean temperature (T) (°C), and time after the spill (min); c and d are empirical parameters based on the oil type. Eq. 2 shows the evaporation equation for most oils. However, oils like diesel follow a square root equation1 (Fingas, 2011). The dispersion ratio (DIR) (%) is related to the oil viscosity (µ) (cp), wind speed (U) (m/s), wave height (H) (m), and wave period (W) (s) (Fingas, 2014).
The oil skimming rate (OSR) [L3T−1] represents the inflow for the “Recovered oil from skimming (RS)” [L3T−1] stock. The initial value for the RS stock is assumed to be zero. OSR depends on the skimmer capacity (SC) [L3T−1], skimmer efficiency ratio (SE) (%) and the number of skimmers (NS) used in the response operations, as shown in Eq. 5 (Ye et al., 2019)
where the SC represents the capacity of a skimmer in collecting oil mixed with water on the ocean per unit of time (usually hour) and the SE represents the portion of oil in the collected oil/water mixture from skimming. The emulsification ratio (E) (%) represents the water content in the water-in-oil emulsions affecting the behavior of spilled oil in the ocean and takes a different value for each type of oil (Fingas and Fieldhouse., 2003).
The oil sorption rate (OAR) [L3T−1] represents the inflow for the “Recovered oil from sorbents (RA)” stock [L3T−1]. The initial value for RA is assumed to be zero. OAR depends on the usage rate of sorbent booms (SB) [LT−1] and sorbent pads (SP) [MT−1] and their sorption capacity symbolized by SBC [L3L−1] and SPC [L3M−1], respectively. It is calculated as Eq. 6 (Wei et al., 2003; Wang et al., 2018)
where SB and SP represent the rate of sorbents used in the oily recovery process after an oil spill. SBC and SPC, moreover, define the capacity of sorbents in the recovery of spilled oil on the ocean through the sorption process.
2.2.2 Sub Model for Estimating Oily Water
Oily water includes wastewater generated from the decontamination (washing) of vessels, PPE, and contaminated reusable booms, as well as the oil containing water collected from the skimming process (Figure 1B) (IPIECA-IOGP., 2016; POSOW., 2016).
As shown in Figure 1B, the oily water generation rate from decontamination (OWD) [L3T−1] is an inflow for “Oily water (OW)” stock [L3T−1]. It represents the rate of oily water generated from the decontamination process, assuming the initial value of the OW stock is zero. The calculation of OWD is shown in Eq. 7.
It can be found that OWD depends on the usage rate of reusable PPE (RP) [T−1] and the generated oily water from washing them (WRP) [L3], the number of response vessels (NV) and the oily water generation rate from washing them WV [L3T−1], the containment booms length (CB) [L] and the oily water generation rate from washing them (WB) [L3 L−1T−1].
Another inflow for the OW stock in Figure 1B is the oily water generation rate from skimming (OWS) [L3T−1] which includes the rate of oily water collected from skimmers during the oil recovery operations. It is assumed that the oil/water mixture collected from skimming contains emulsified oil that can be recovered and oil-in-water emulsion which might require a further decanting process. OWS is thus depending on skimmer efficiency ratio (SE) and oil skimming rate (OSR) [L3T−1], as shown in Eq. 8.
2.2.3 Sub Model for Estimating Solid Oily Waste
Three primary types of solid waste generated from oil spill response operations, including oily sorbents, oily PPE, and oily debris, were considered in the model. The total oily solid waste (TSW) [M] is equal to the sum of total oily sorbents (TOS) [M], total oily PPE (TOP) [M], and total oily debris (TOD) [M]. TOS, TOP, and TOD equal the value of “Oily sorbents (OS)” [MT−1], “Oily PPE (OP)” [MT−1], and “Oily debris (OD)” [MT−1] stocks, respectively, in the last response unit time (Figure 1C). Sorbent booms and pads are commonly used for sorbing the spilled oil, and they would become oily sorbents. As shown in Figure 1C, the oily sorbents generating rate (OSG) [MT−1], as the inflow for the “Oily sorbents (OS)” stock [MT−1], includes the sorbent booms waste generation rate (SBR) [MT−1] and sorbent pads waste generation rate (SPR) [MT−1]. The initial value of OS stock is assumed to be zero. As shown in Eq. 9, the SBR is calculated based on the usage rate of sorbent booms (SB) [LT−1], sorbent boom weight (SBW) [ML−1] as the original weight of each deployed sorbent boom, and the sorbent boom sorption capacity (SBC) [L3L−1] to sorb the emulsified oil in the ocean. The SPR is calculated considering the usage rate of sorbent pads (SP) [MT−1] and their sorption capacity (SPC) [L3M−1] as shown in Eq. 10
where
During response operations, personnel are often required to wear personal protective equipment (PPE) which creates a considerable quantity of solid waste after usage (IPIECA-IOGP., 2016; POSOW., 2016). In Figure 1C, the oily PPE waste generating rate (OPR) [MT−1] is the inflow for the “Oily PPE (OP)” stock [MT−1], assuming the initial value for this stock is zero. OPR is dependent on the number of responders (NR), the usage rate of non-reusable PPE (NP) per responder [T−1], and the weight of PPE (PW) [M], as calculated in Eq. 11.
In Figure 1C, the oily debris waste generating rate (ODR) [MT−1] is the inflow for the “Oily debris (OD)” stock [MT−1], assuming the initial value of OD is zero. ODR represents the waste generation rate of oily debris from flotsam and jetsam (ODF) [MT−1] and containers (ODC) [MT−1] (IPIECA-IOGP., 2016), as calculated in Eq. 12 and Eq. 13
where VW is the weight of sunken vessel [M]; RF is the rate of flotsam and jetsam [T−1] (e.g., the estimated floating rate of sunken vessels that resulted in the flotsam and jetsam); NC is the number of cargos; RC is the floating rate of containers of each cargo [MT−1] that generates oily debris.
2.3 Modeling Performance
The developed system dynamics model was validated using real-world offshore oil spill response data. The modeling accuracy η (%) is calculated below
where S is the model result, and O is the real-world observation. Eq. 14 validates the model performance in estimating the recovered oil, oily water, and oily solid waste as the outputs.
2.4 Sensitivity Analysis
The sensitivity analysis is conducted to examine the impacts of modeling parameters on waste estimation results. It can also help decision-makers determine the desirable response alternatives. For instance, users can change the quantity of response materials like sorbents to see the variation of recovered oil and the quantity of generated oily solid waste. The analysis helps users determine the optimal usage of sorbents for maximization of oil recovery and minimization of waste generation. This study conducted the sensitivity analysis for all system dynamics model parameters to analyze their effect on the model outputs, including the recovered oil, oily water, and solid waste. Based on the expert knowledge and available information regarding previous oil spills, a realistic range of values was selected for each parameter. Then, the sensitivity analysis for each parameter was run, and the results were recorded. As some parameters had more effects on the recovered oil, oily water, and solid waste, the results are presented for the most influential parameters of the model, including response arrival time and sorbent booms usage rate.
2.5 Response Surface Methodology
Response surface methodology (RSM) is a statistical tool to analyze the relationships between two or more explanatory variables (model inputs) and one or more response variables. The main purpose of RSM might also be determining the optimum settings of effective inputs that result in the maximization/minimization of response variables using some designed experiments (Khuri and Mukhopadhyay., 2010). RSM was conducted to analyze the interaction effect of different model inputs on the model outputs. The RSM results for the two most interactive parameters of the developed system dynamics model (sea temperature and response arrival time) on the total recovered oil as an important source of liquid waste are presented (Section 4.3). The objective function in this RSM subjects to maximize the total recovered oil. The interaction of two other parameters with high interactivity (sorbent booms usage rate and sorbent boom weight) on total solid waste was also illustrated through RSM, with an objective function of minimizing the total solid waste. Minitab® (version 20.3) was used to perform RSM in this study.
3 Case Study
An actual oil spill incident in Bella Bella, British Columbia, Canada, that occurred in October 2016 was considered for case study validation. During this incident the fuel barge tug Nathan E. Stewart released approximately 110,000 L of diesel fuel into the marine environment after it ran ground in Seaforth Channel approximately 10 miles west of Bella Bella. Responders took roughly 1 month to complete offshore response operations and remove the tug from the environment. During response operations, different types of wastes were generated (TSB, 2018).
3.1 Data Collection
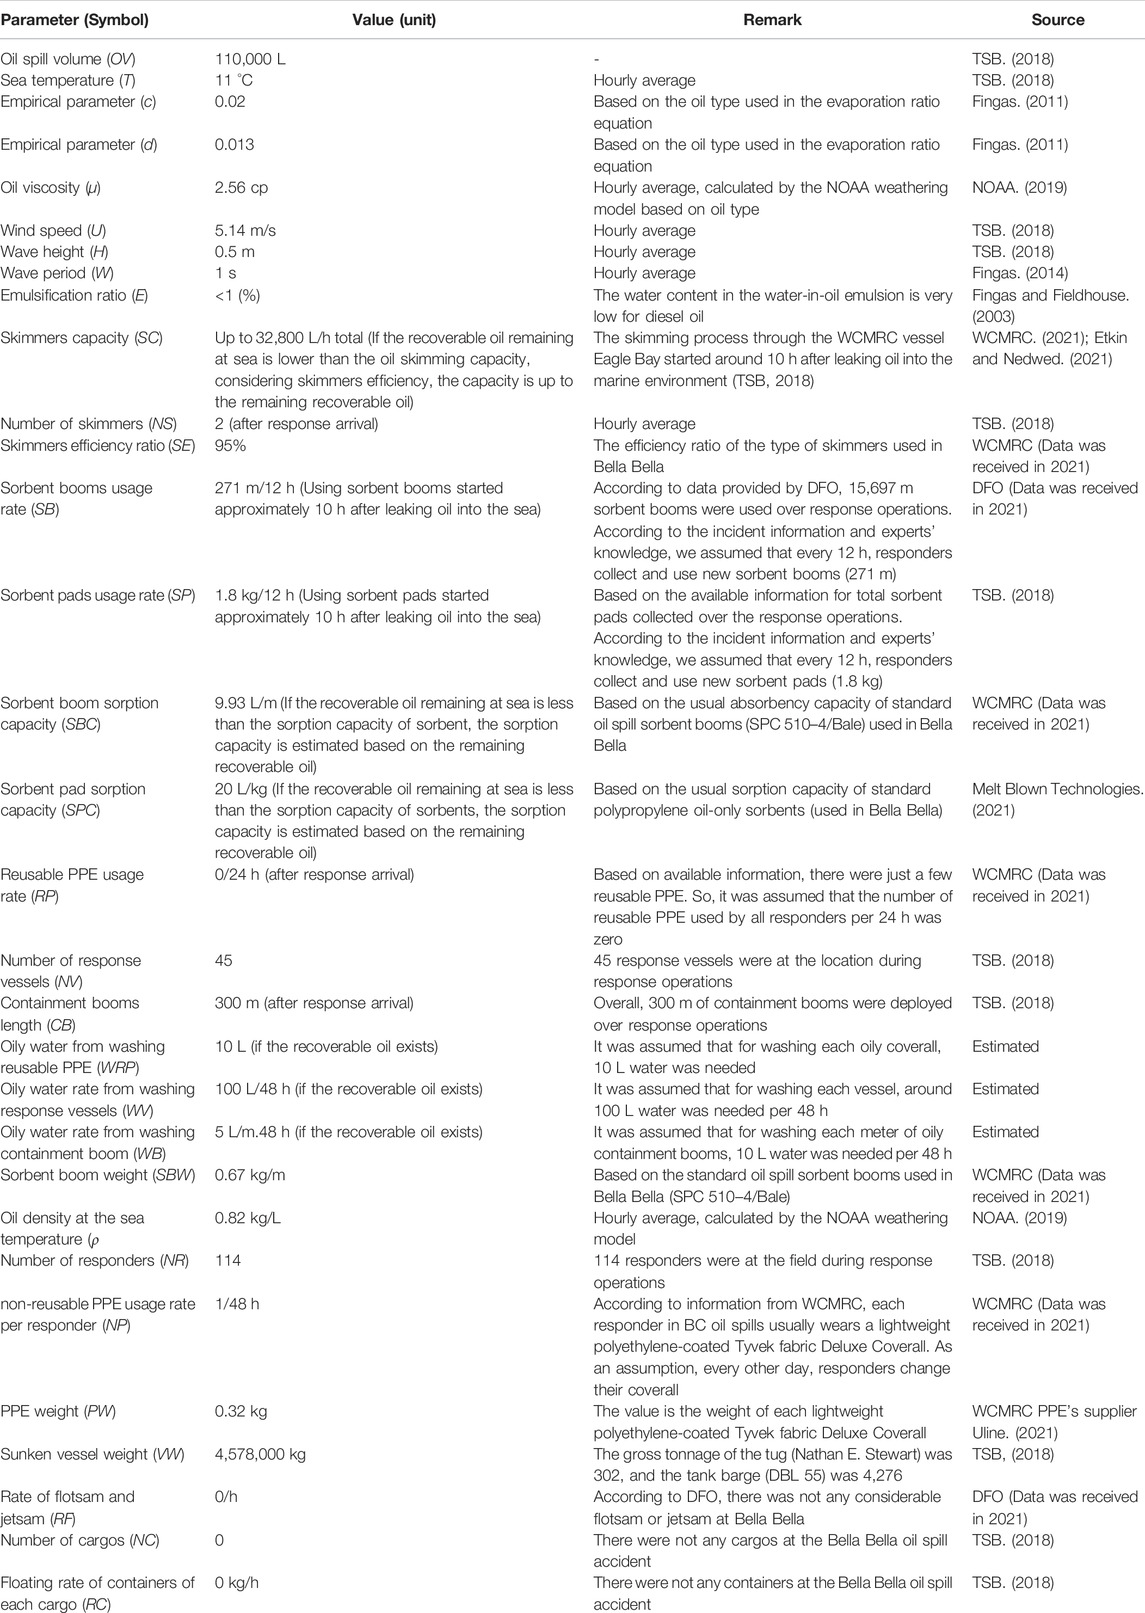
The values of most input parameters of the system dynamics model for model validation were collected from the Bella Bella oil spill data, while a few other parameters used data based on previous studies. Table 2 presents the oil spill response data collected from different sources.
4 Results and Discussion
The recovered oil, oily water and solid waste estimation, model validation, sensitivity analysis, and response surface methodology results are presented in the following sections.
4.1 Estimation Results
To validate the developed dynamic model, data in Table 2 was applied to estimate different types of product, including recovered oil, oily water, and solid waste (Table 1) generated after the Bella Bella oil spill response operations. All estimated variables are time-dependent in the dynamics model, and the start point is the time when the oil spill occurred.
4.1.1 Recovered Oil
Figure 2 shows the estimated variables relevant to recovered oil. Oil weathering processes (evaporation, dispersion, and emulsification) and the oil recovery using skimming and sorbents affect the volume of remaining recoverable oil and the total recovered oil. In the Bella Bella oil spill incident resulted in the release of a light oil (diesel) into the marine environment. Studies show that light oils like diesel usually need just a few hours to be evaporated and dispersed into the water column (Fingas, 2011; Fingas, 2014; NOAA, 2020). Moreover, weather conditions such as sea temperature, wind speed, and wave conditions influence the oil weathering process (Fingas, 2014). Figure 2A illustrates the evaporation volume of oil over time. As shown, considering a dynamic value for recoverable oil volume, the evaporation rate increases to reach a maximum value and continues with a downward trend until oil exists in the seawater for the recovery operations. Also, Figure 2B illustrates the same trend for the dispersion volume of oil over time.
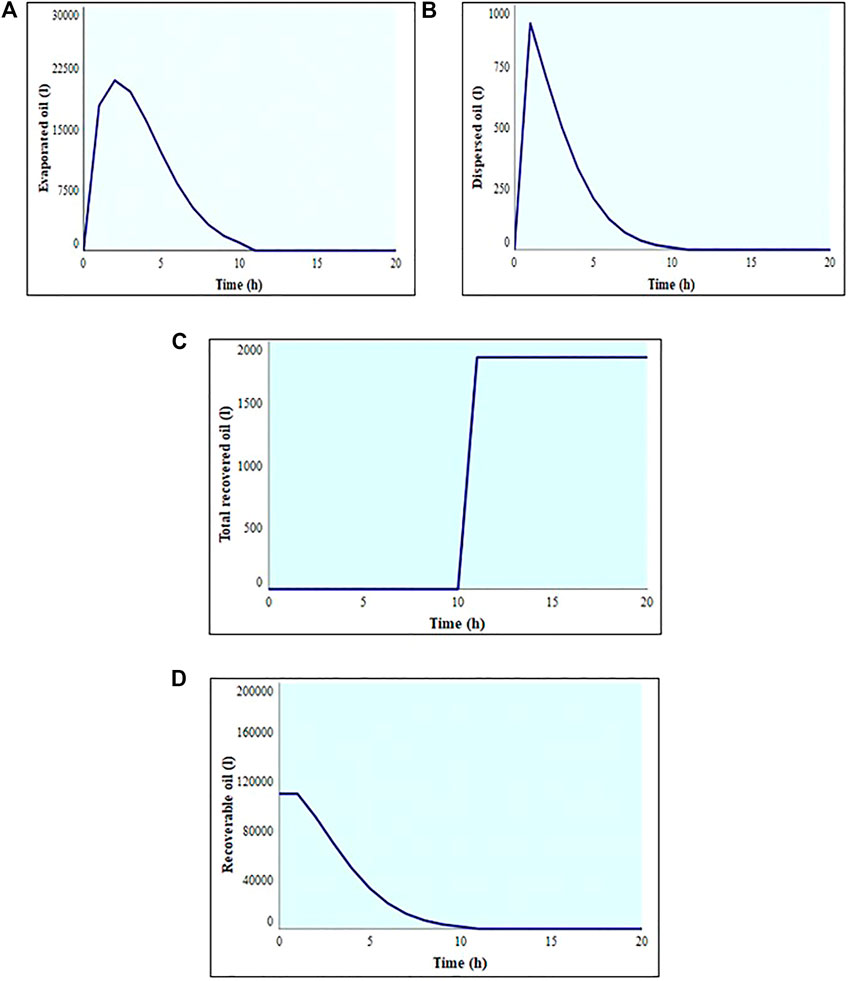
FIGURE 2. Modeling of (A) oil evaporation, (B) oil dispersion, (C) total recovered oil volume, and (D) recoverable oil as the function of time.
Response operations in Bella Bella started approximately 10 h after the initial release of the diesel oil into the marine environment (TSB, 2018). Figure 2C demonstrates that a small volume of spilled oil was recovered in total, as the majority of spilled oil was evaporated and dispersed before oil recovery operations started (i.e., 10 h after the spill). Overall, the total recovered oil from skimming and absorption operations in Bella Bella was 2,132 L (TSB, 2018). According to WCMRC, all the recovered oil in the Bella Bella was from the course of using sorbents and the oil recovery through the skimming process was insufficient as very little recoverable oil had remained on the ocean when the skimmers started recovery operations. Figure 2D shows that the volume of recoverable oil at sea with a downward trend reaches its steady-state a few hours after the oil spill, demonstrating that there was not a considerable volume of oil at sea after a few hours.
4.1.2 Oily Water and Solid Waste
The dynamic model estimates the generation of approximately 6,000 L of oily water over the response operations (around 1 month) in the Bella Bella oil spill. The total volume of oily water depends on the decontamination process and parameters presented in Figure 1B.
The quantity of oily sorbents as a type of solid waste is dependent on the use of sorbent pads and sorbent booms. Although the oil recovery process through sorbents in Bella Bella took a few hours, the usage of sorbents continued until the last hours of operations to make sure that no remaining recoverable oil was left. By considering the weight of sorbents after oil sorption, the model estimates that approximately 13,300 kg of oily solid waste was generated due to the use of sorbents.
To estimate the generated waste from oily PPE over time, the number of responders and the weight and the usage rate of non-reusable PPE for each responder were considered. So, the quantity of oily PPE continues to increase until the last hour of response operations. The model estimates around 547 kg of oily PPE after response operations in the Bella Bella.
The quantity of oily debris as a stream of solid waste originates from oily flotsam and jetsam after an oil spill incident and the oily waste generated from floated cargos with their containers (IPIECA-IOGP, 2016). In the Bella Bella oil spill, there were no cargos or collected flotsam and jetsam, and thus the estimated value for oily debris is zero (RF, NC, and RC parameters take zero in Eq. 12 and 13.
4.1.3 Results Validation
Table 3 compares the observed data in the real world and the model estimation. The estimated values illustrate the total collected waste over response time (almost 686 h). The data presented in the “Observation” column of Table 3 was provided by the Department of Fisheries and Oceans Canada. The model validation shows a range of 85.2%–87.7% accuracy for estimating each type of waste compared to the real data in the Bella Bella oil spill. Overall, the average accuracy of OSRW estimation is 86.3%. Based on the model results, the developed system dynamics model can be applied for the estimation of different types of waste generated from oil spill response operations.
4.2 Sensitivity Analysis Results
Table 4 shows the effect of the arrival time of response operations (the time of starting the oil recovery process by skimmers and sorbents) on the total recovered oil, generated oily water, and solid waste. As shown in Figure 1 and explained in Table 2, the response arrival time affects the starting time of deploying skimmers and sorbents; the recoverable oil remaining on the ocean could be less due to oil weathering (Figure 2D) if responders arrive late. The results demonstrate that if response operations in the Bella Bella oil spill had started earlier, much more recovered oil could be collected. For example, a 5-h decrease in the response arrival time could increase the percentage of recovered oil from around 2% to approximately 28% without a considerable increase in generated oily water and solid waste. The effect of response arrival time on the recovered oil is much more significant than on the generated oily water and solid waste, reflecting the economic and environmental importance of response time in oil spill cases. However, Table 4 illustrates that the decrease in response arrival time might generate more oily water as long as skimmers recover more recoverable oil remaining on the ocean, causing to collect more water containing oil during the process of oil recovery. There is no significant change in the generation of oily water from decontamination as the total number of vessels and equipment departed to the oil spill location does not usually differ for the same volume of spilled oil and for a few hours change in response arrival time as long as the oil recovery process is required. However, the oil concentration in the collected oily water from decontamination might be more significant when the recoverable oil is more remarkable.
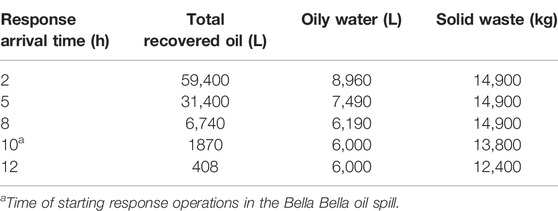
TABLE 4. Sensitivity analysis of the effect of response arrival time on recovered oil, oily water, and solid waste.
The increase in response arrival time can also slightly reduce the generated solid waste by generating less oily sorbents from the recovery of less oil remaining on the ocean. The weight of sorbents after oil sorption is greater than the original weight of sorbents. However, there is no significant difference regarding the generated solid waste among the first three rows in Table 4 as with the same quantity of sorbents used in Bella Bella and based on their capacity, the estimated volume of absorbed oil does not differ. Moreover, since in the Bella Bella, the use of sorbents and wearing a non-reusable coverall by responders lasted until the last hours of response operations, the generation of solid waste still exists even when there is low recoverable oil remaining on the ocean (Table 4).
The sensitivity analysis also considered the effect of sorbent booms on the total recovered oil and the total generated solid waste (Table 5). According to the model estimation results for the Bella Bella oil spill, the total recovered oil using 15,697 m (271 m/12 h) sorbent booms was estimated to be 1870 L. However, based on the sensitivity analysis result, it seems that even a 45% decrease in the use of sorbent booms could recover the same volume of oil. It means that the model estimates that in the Bella Bella response, there was around 45% overuse of sorbents, which may result in the extra generation of 4,750 kg of solid waste. Although the model estimation might not guarantee the same recovery efficiency by reducing sorbent use, it demonstrates that it is vital to consider the effect of sorbent use on the total recovered oil and generated solid waste in making suitable decisions.
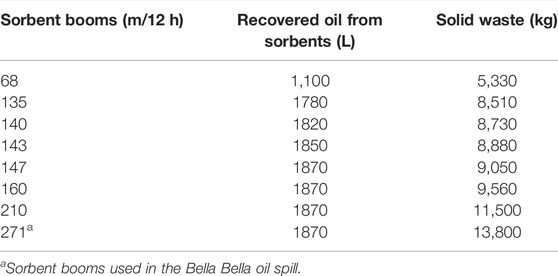
TABLE 5. Sensitivity analysis of the effect of sorbent booms on recovered oil from sorbents and solid waste.
4.3 Interaction Effects
Minitab designs 13 unblocked runs of experiments for two continuous factors over a certain region of values. Figure 3 illustrates the interaction effect between sea temperature as a weathering condition-related parameter and response arrival time on the total recovered oil estimated for the Bella Bella oil spill. A range of values between 2°C and 15°C for sea temperature and between 5 and 15 h for response arrival time were selected based on the effect of each parameter on total recovered oil.
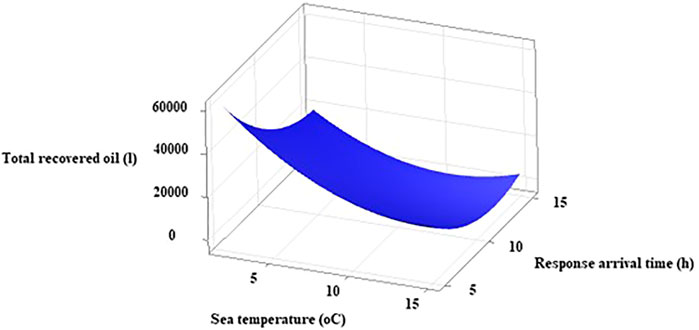
FIGURE 3. A contour plot for the estimation of total recovered oil (L) based on the interaction of sea temperature (°C) and response arrival time (h) in the Bella Bella oil spill.
As shown in Figure 3, it is estimated that the maximum recovered oil can be obtained from the lowest response arrival time and sea temperature. Moreover, Figure 3 presents that the effect of response arrival time on the oil recovery is much more significant with a lower sea temperature than with a high sea temperature. Table 6 demonstrates a significant interaction between sea temperature and response arrival time on the recovered oil considering the low related p-value. Therefore, in some seasons, responders might arrange more equipment and vessels as their immediate action can be more crucial.
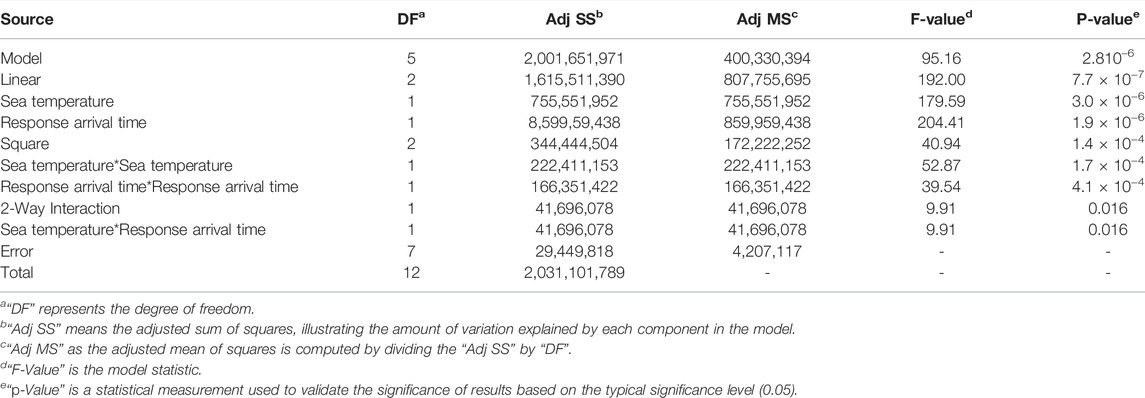
TABLE 6. Analysis of variance for estimation of total recovered oil (L) based on sea temperature (°C) and response arrival time (h).
Figure 4 shows the interaction effect between sorbent booms usage rate and sorbent boom weight on total solid waste estimation for the Bella Bella oil spill. A range of values between 1 kg/m and 3 kg/m for sorbent boom weight and between 150 m/12h and 400 m/12 h for sorbent booms usage rate were considered in RSM.
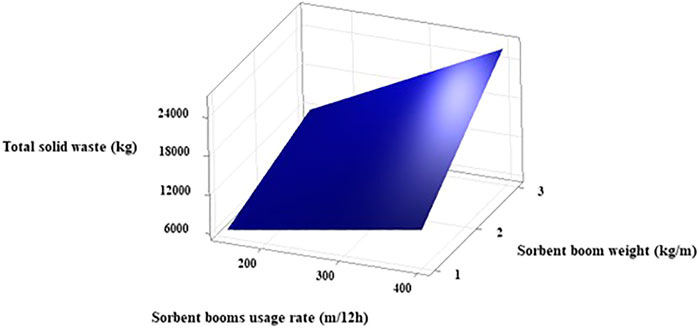
FIGURE 4. A contour plot for the estimation of total solid waste (kg) based on the interaction of sorbent booms usage rate (m/12 h) and sorbent boom weight (kg/m) in the Bella Bella oil spill.
Figure 4 illustrates that both the sorbent boom weight and sorbent booms usage rate positively correlate with total solid waste. Also, the effect of sorbent booms usage rate on total solid waste is more considerable when the sorbent boom weight takes a higher value. Table 7 demonstrates a significant interaction between sorbent booms usage rate and sorbent boom weight on total solid waste considering the low p-value.

TABLE 7. Analysis of variance for estimation of total solid waste based on sorbent booms usage rate (m/12 h) and sorbent boom weight (kg/m).
5 Conclusion
The management of OSRW is the most challenging, time-consuming and expensive part of marine oil spill response. The first step of OSRW management is estimating liquid and solid waste quantity. The estimation of waste generation can assist decision-makers in selecting the most suitable waste management strategies, transportation methods, and the optimum location of storage, treatment, and disposal facilities. This study developed a system dynamics-based model to estimate different types of OSRW. The model considered the dynamic effect of a variety of aspects, including weather conditions, response equipment, and volume and characteristics of spilled oil. As the advantage of all dynamics models, the user can monitor and analyse the generation rate of each type of waste during the response operation. A case study of response operations following the Bella Bella oil spill incident was used to validate the model. The comparison results showed approximately 86% accuracy, on average, for the model outputs.
Another importance of this study is that the developed system-dynamics model is highly suitable for the sensitivity analysis and the analysis of interaction effects of parameters on the generated OSRW. Sensitivity analysis was implemented for some model parameters to provide decision-makers with information to develop optimum OSRW management strategies. For example, the sensitivity analysis for response arrival time estimated that responders could have increased the volume of recovered oil by 26% by arriving at the spill location 5 hours earlier. This highlights the importance of quick response in terms of recovery of spilled oil. Also, the sensitivity analysis for the use of sorbent booms revealed the possibility of a 45% overuse of sorbents during the Bella Bella oil spill response operations that resulted in unnecessary solid oily waste generation. Besides that, the conducted response surface methodology illustrated the significant interaction effect of sea temperature and response arrival time on the total recovered; and sorbent booms usage rate and the sorbent boom weight on total solid waste estimated for the Bella Bella oil spill.
Data Availability Statement
The original contributions presented in the study are included in the article/Supplementary Material, further inquiries can be directed to the corresponding authors.
Author Contributions
SH: Conceptualization, investigation, methodology, software, writing—original draft, visualization. GH: Methodology, investigation, validation, writing—review and editing, project administration. KL: Investigation, writing—review and editing. JL: Methodology, supervision, writing—review and editing, funding acquisition. KN: Writing—review and editing. HV: investigation, writing—review and editing.
Funding
This study was supported by the Multi-Partner Oil Spill Research Initiative (MPRI) of Fisheries and Oceans of Canada and the Natural Sciences and Engineering Research Council of Canada (NSERC).
Conflict of Interest
The authors declare that the research was conducted in the absence of any commercial or financial relationships that could be construed as a potential conflict of interest.
Publisher’s Note
All claims expressed in this article are solely those of the authors and do not necessarily represent those of their affiliated organizations, or those of the publisher, the editors and the reviewers. Any product that may be evaluated in this article, or claim that may be made by its manufacturer, is not guaranteed or endorsed by the publisher.
Acknowledgments
Special thanks to Dale Bull, a senior environmental emergency response officer in the BC Ministry of Environment and Climate Change Strategy; Jeff Brady, deputy superintendent of environmental response from Canadian Coast Guard; and Scott Wright, the response readiness director in WCMRC, for their enormous help regarding data collection and making the developed model more realistic by providing imperative information and experiences.
References
Al-Khatib, I. A., Eleyan, D., and Garfield, J. (2016). A System Dynamics Approach for Hospital Waste Management in a City in a Developing Country: the Case of Nablus, Palestine. Environ. Monit. Assess. 188 (9), 503–509. doi:10.1007/s10661-016-5487-9
Chen, B., Ye, X., Zhang, B., Jing, L., and Lee, K. (2019). Marine Oil Spills-Preparedness and Countermeasures. In World Seas: An Environmental Evaluation (pp. 407-426). Cambridge, Massachusetts, United States: Academic Press. doi:10.1016/b978-0-12-805052-1.00025-5
Chen, Z., An, C., Chen, X., Taylor, E., Bagchi, A., and Tian, X. (2021). Inexact Inventory-Theory-Based Optimization of Oily Waste Management System in Shoreline Spill Response. Sci. Total Environ. 777, 146078. doi:10.1016/j.scitotenv.2021.146078
Ciplak, N., and Barton, J. R. (2012). A System Dynamics Approach for Healthcare Waste Management: a Case Study in Istanbul Metropolitan City, Turkey. Waste Manag. Res. 30 (6), 576–586. doi:10.1177/0734242x12443405
Dave, D. A. E. G., and Ghaly, A. E. (2011). Remediation Technologies for Marine Oil Spills: A Critical Review and Comparative Analysis. Am. J. Environ. Sci. 7 (5), 423–440. doi:10.3844/ajessp.2011.423.440
EPA (2022). Uniated States Environmental Protection Agency Deepwater Horizon – BP Gulf of Mexico Oil Spill. Retrieved from https://www.epa.gov/enforcement/deepwater-horizon-bp-gulf-mexico-oil-spill (accessed on April 10, 2022).
Etkin, D. S., and Nedwed, T. J. (2021). Effectiveness of Mechanical Recovery for Large Offshore Oil Spills. Mar. Pollut. Bull. 163, 111848. doi:10.1016/j.marpolbul.2020.111848
Fingas, M., and Fieldhouse, B. (2003). Studies of the Formation Process of Water-In-Oil Emulsions. Mar. Pollut. Bull. 47 (9-12), 369–396. doi:10.1016/S0025-326X(03)00212-1
Fingas, M. (2014). A Review of Natural Dispersion Models. Int. Oil Spill Conf. Proc. 20141, 285471. doi:10.7901/2169-3358-2014-1-285471.1
Fingas, M. F. (2011). Oil and Petroleum Evaporation.” in Proceedings of the 34th Arctic and Marine Oilspill Program Technical Seminar, Canada, Ottawa, Ontariopp. 426
Gong, Y., Zhao, X., Cai, Z., O'Reilly, S. E., Hao, X., and Zhao, D. (2014). A Review of Oil, Dispersed Oil and Sediment Interactions in the Aquatic Environment: Influence on the Fate, Transport and Remediation of Oil Spills. Mar. Pollut. Bull. 79 (1-2), 16–33. doi:10.1016/j.marpolbul.2013.12.024
Hu, G., Mohammadiun, S., Gharahbagh, A. A., Li, J., Hewage, K., and Sadiq, R. (2020). Selection of Oil Spill Response Method in Arctic Offshore Waters: A Fuzzy Decision Tree Based Framework. Mar. Pollut. Bull. 161, 111705. doi:10.1016/j.marpolbul.2020.111705
International Maritime Organization. (2010). Guidelines on Oil Spill Waste Management. Retrieved from: http://www.imo.org/en/OurWork/Environment/PollutionResponse/Documents/Oil%20spill%20waste%20management%20decision%20support%20tool.pdf (Accessed on May 1, 2022).
IPIECA-IOGP (2016). International Petroleum Industry Environmental Conservation Association, & International Association of Oil and Gas Producers. Oil Spill Waste Minimization and Management Guideline. Retrieved from https://www.ipieca.org/resources/good-practice/oil-spill-waste-minimization-and-management/(Accessed on July 29, 2021).
ITOPF (2012). Use of Sorbent Materials in Oil Spill Response. Retrieved from https://www.uvm.edu/seagrant/sites/default/files/uploads/TIP8UseofSorbentMaterialsinOilSpillResponse.pdf (Accessed on May 2, 2022).
Ivshina, I. B., Kuyukina, M. S., Krivoruchko, A. V., Elkin, A. A., Makarov, S. O., Cunningham, C. J., et al. (2015). Oil Spill Problems and Sustainable Response Strategies through New Technologies. Environ. Sci. Process. Impacts 17 (7), 1201–1219. doi:10.1039/c5em00070j
Khuri, A. I., and Mukhopadhyay, S. (2010). Response Surface Methodology. WIREs Comp. Stat. 2 (2), 128–149. doi:10.1002/wics.73
Kollikkathara, N., Feng, H., and Yu, D. (2010). A System Dynamic Modeling Approach for Evaluating Municipal Solid Waste Generation, Landfill Capacity and Related Cost Management Issues. Waste Manag. 30 (11), 2194–2203. doi:10.1016/j.wasman.2010.05.012
Li, P., Cai, Q., Lin, W., Chen, B., and Zhang, B. (2016). Offshore Oil Spill Response Practices and Emerging Challenges. Mar. Pollut. Bull. 110 (1), 6–27. doi:10.1016/j.marpolbul.2016.06.020
Massoura, T., and Sommerville, M. (2009). Realities of Spill: Waste Remediation Strategies,” in Asia Pacific Health, Safety, Security and Environment Conference, Jakarta, Indonesia: Society of Petroleum Engineers.
Melt Blown Technologies (2021). Oil Only Absorbents. Retrieved from https://meltblowntechnologies.com/products/absorbents/oil-only-absorbents/(Accessed on July 29, 2021).
Metcalf, S. (2014). Developing Location-Based Oil Spill Waste Management Plans. Int. Oil Spill Conf. Proc. 20141, 1633–1646. doi:10.7901/2169-3358-2014.1.1633
Mohammadiun, S., Hu, G., Alavi Gharahbagh, A., Mirshahi, R., Li, J., Hewage, K., et al. (2021). Optimization of Integrated Fuzzy Decision Tree and Regression Models for Selection of Oil Spill Response Method in the Arctic. Knowledge-Based Syst. 213, 106676. doi:10.1016/j.knosys.2020.106676
National Oceanic and Atmospheric Administration (2019). NOAA's Oil Weathering Model (ADIOS). Retrieved from https://response.restoration.noaa.gov/oil-and-chemical-spills/oil-spills/response-tools/adios.html (Accessed on July 29, 2021).
National Oceanic and Atmospheric Administration (2020). Small Diesel Spills (500-5,000 Gallons). Retrieved from https://response.restoration.noaa.gov/sites/default/files/Small-Diesel-Spills.pdf (Accessed on March 16, 2022).
POSOW (2016)Preparedness for Oil-Polluted Shoreline Cleanup and Oiled Wildlife Interventions: Oil Spill Waste Management Manual. Retrieved from: https://www.posow.org/documentation/wasteweb.pdf, accessed on May 2, 2022.
Saleem, S., Hu, G., Li, J., Hewage, K., and Sadiq, R. (2022). Evaluation of Offshore Oil Spill Response Waste Management Strategies: A Lifecycle Assessment-Based Framework. J. Hazard. Mater. 432, 128659. doi:10.1016/j.jhazmat.2022.128659
Transportation Safety Board of Canad (2018). Marine Investigation. Report M16P0378. Retrieved from: https://www.bst-tsb.gc.ca/eng/rapports reports/marine/2016/m16p0378/m16p0378.html (Accessed on October 13, 2016).
ULINE (2021). Protective Clothing. Retrieved from https://www.uline.ca/Product/Detail/S-19205E-2X/Disposable-Clothing/Tychem-QC-Deluxe-Coverall-2XL (Accessed on July 29, 2021).
Vu, H. L., Ng, K. T. W., Richter, A., and An, C. (2022). Analysis of Input Set Characteristics and Variances on k-fold Cross Validation for a Recurrent Neural Network Model on Waste Disposal Rate Estimation. J. Environ. Manag. 311, 114869. doi:10.1016/j.jenvman.2022.114869
Vu, H. L., Ng, K. T. W., Richter, A., Karimi, N., and Kabir, G. (2021). Modeling of Municipal Waste Disposal Rates during COVID-19 Using Separated Waste Fraction Models. Sci. Total Environ. 789, 148024. doi:10.1016/j.scitotenv.2021.148024
Wadsworth, T. (2014). Comparison and Assessment of Waste Generated during Oil Spills. Int. Oil Spill Conf. Proc. 20141, 1647–1658. doi:10.7901/2169-3358-2014.1.1647
Wang, Y., Liu, X., Yu, X., and Zheng, X. (2018). Assessing Response Capabilities for Responding to Ship-Related Oil Spills in the Chinese Bohai Sea. Int. J. Disaster Risk Reduct. 28, 251–257. doi:10.1016/j.ijdrr.2018.02.040
WCMRC (2021). Western Canada Marine Response Operations (WCMRC) Website. vessels Retrieved from http://wcmrc.com/preparedness/vessels/(Accessed on July 29, 2021).
Wei, Q. F., Mather, R. R., Fotheringham, A. F., and Yang, R. D. (2003). Evaluation of Nonwoven Polypropylene Oil Sorbents in Marine Oil-Spill Recovery. Mar. Pollut. Bull. 46 (6), 780–783. doi:10.1016/s0025-326x(03)00042-0
Ye, X., Chen, B., Li, P., Jing, L., and Zeng, G. (2019). A Simulation-Based Multi-Agent Particle Swarm Optimization Approach for Supporting Dynamic Decision Making in Marine Oil Spill Responses. Ocean Coast. Manag. 172, 128–136. doi:10.1016/j.ocecoaman.2019.02.003
Zhang, B., Matchinski, E. J., Chen, B., Ye, X., Jing, L., and Lee, K. (2019). “Marine Oil Spills-Oil Pollution, Sources and Effects,” in World Seas: N Environmental Evaluation (Cambridge, Massachusetts, United States: Academic Press), 391–406. doi:10.1016/b978-0-12-805052-1.00024-3
Glossary
RSM response surface methodology
OSRW oil spill response waste
PPE personal protective equipment
RO recoverable oil
RS recovered oil from skimming
RA recovered oil from sorbents
OW oily water
OP oily PPE
OD oily debris
TR total recovered oil
TRS total recovered oil from skimming
TRA total recovered oil from sorbents
OLR oil loss rate
OV oil spill volume
ER evaporation rate
DR dispersion rate
OSR oil skimming rate
OAR oil sorption rate
t time starting just after an oil spill incident until the end of the offshore response operations
EVR evaporation ratio
T ocean temperature
c an empirical parameter in the EVR calculation
d an empirical parameter in the EVR calculation
DIR dispersion ratio
µ oil viscosity
U wind speed
H wave height
W wave period
SC skimmer capacity
SE skimmer efficiency ratio
NS number of skimmers
E emulsification ratio
SB sorbent booms usage rate
SBC sorbent boom sorption capacity
SP sorbent pads usage rate
SPC sorbent pad sorption capacity
OWD oily water generation rate from decontamination
RP reusable PPE usage rate
WRP oily water from washing reusable PPE
NV number of response vessels
WV oily water generation rate from washing vessels
CB containment booms length
WB oily water generation rate from washing containment booms
OWS oily water generation rate from skimming
TSW total solid waste
TOS total oily sorbents
TOP total oily PPE
TOD total oily debris
OSG oily sorbents generating rate
SBR sorbent booms waste generation rate
SBW sorbent boom weight
SPR sorbent pads waste generation rate
ρ oil density
OPR oily PPE waste generating rate
NR number of responders
NP non-reusable PPE
PW weight of PPE
ODR oily debris waste generating rate
ODF oily debris generation rate from flotsam and jetsam
ODC oily debris generation rate from containers
VW Sunken vessel weight
RF rate of flotsam and jetsam
NC number of cargos
RC floating rate of containers per cargo
η accuracy of results
S model result
O real-world observation
Keywords: marine oil spill response, oily waste, response surface method, system dynamics model, sensitivity analysis
Citation: Hosseinipooya SA, Hu G, Lee K, Li J, Ng KTW and Vu HL (2022) A System Dynamics Modeling Approach for Estimation of Oily Waste Generation From Marine Oil Spill Response: A Case Study of an Oil Spill in Central Coast of British Columbia. Front. Environ. Sci. 10:902229. doi: 10.3389/fenvs.2022.902229
Received: 22 March 2022; Accepted: 19 May 2022;
Published: 15 June 2022.
Edited by:
Nsikak U. Benson, Covenant University, NigeriaReviewed by:
Ewa Dąbrowska, Gdynia Maritime University, PolandMichel C. Boufadel, New Jersey Institute of Technology, United States
Copyright © 2022 Hosseinipooya, Hu, Lee, Li, Ng and Vu. This is an open-access article distributed under the terms of the Creative Commons Attribution License (CC BY). The use, distribution or reproduction in other forums is permitted, provided the original author(s) and the copyright owner(s) are credited and that the original publication in this journal is cited, in accordance with accepted academic practice. No use, distribution or reproduction is permitted which does not comply with these terms.
*Correspondence: Guangji Hu, Z3VhbmdqaS5odUB1YmMuY2E=; Jianbing Li, SmlhbmJpbmcuTGlAdW5iYy5jYQ==
 Seyed Ashkan Hosseinipooya
 Guangji Hu
 Kenneth Lee
 Jianbing Li
 Kelvin Tsun Wai Ng4
