 Qingbo Wang1
 Shiliang Liu1*Fangfang Wang1Hua Liu1
 Yixuan Liu1Lu Yu1Jian Sun2
 Lam-Son Phan Tran3
 Yuhong Dong4
- 1State Key Laboratory of Water Environment Simulation, School of Environment, Beijing Normal University, Beijing, China
- 2Institute of Geographical Sciences and Natural Resources Research, Chinese Academy of Sciences, Beijing, China
- 3Institute of Genomics for Crop Abiotic Stress Tolerance, Department of Plant and Soil Science, Texas Tech University, Lubbock, TX, United States
- 4Research Institute of Forestry, Chinese Academy of Forestry, Key Laboratory of Tree Breeding and Cultivation of State Forestry Administration, Beijing, China
The flow of ecosystem services between regions as a result of the mismatch of supply and demand has increasingly become a new research focus. Clarifying the spatial regularity of ecosystem service flow is of great significance for realizing regional sustainable development and improving human well-being. This study applied a network model to map the interregional carbon flow based on the supply and demand of carbon sequestration service, and the driving effect of various driving factors was further analyzed. The results showed that the demand for carbon sequestration service on the Qinghai-Tibet Plateau increased steadily from 2000 to 2019, resulting in an increasingly significant difference between supply and demand with more than 20 million tons. In the carbon sequestration service flow network, the number of defined deficit nodes increased to 22 in 2010, but decreased to 21 in 2019. The interrupted edges continued to increase to 16, and the network density dropped to 0.022. The carbon sequestration service flow network on the northeastern parts of the Qinghai-Tibet Plateau was severely damaged. With the high-quality development of animal husbandry, the impact of grazing intensity on the difference between the supply and demand of carbon sequestration service has been weakened. When urbanization reached a certain level, the driving effects of urbanization and agricultural activities increased significantly. The study provided a reference for the use of network models to analyze ecosystem service flow, and provided a theoretical basis and data support for local ecological management decisions.
1 Introduction
Since the concept of ‘ecosystem service’ was put forward in the 1970s (Holdren and Ehrlich, 1974; Westman, 1977), it has been continuously developed through further study and evaluation by many scholars (Costanza et al., 1997; Daily, 1997). The widely accepted definition refers to the benefits that humans derive from ecosystems. These benefits are classified as the supply services that provide food, freshwater, production and living materials, cultural services that promote spiritual pleasure and civilized development, support services, and regulation services that maintain the operation and development of the ecosystems (Millennium Ecosystem Assessment, 2005). Carbon sequestration service is an important regulation service that plays an important role in slowing down the rise of atmospheric CO2 concentration, regulating global climate, and maintaining global carbon balance, which captures carbon in atmosphere through the carbon sequestration function of ecosystems and fixes the captured carbon to offset part of the CO2 emitted by humans into the atmosphere (Yang et al., 2019; Zhai et al., 2021). However, as population growth and economic development have led to the increase in the demand for carbon resources (Adams et al., 2020), resource consumption and ecological damage have far exceeded the tolerance of the ecosystem, seriously affecting the sustainability of carbon resources (Abbasi et al., 2021). Ecosystem carbon sequestration service have become one of the most concerned focuses in the ecosystem service research.
As a hotspot and Frontier of ecological research, the study of ecosystem services has been continuously deepened in recent decades. The initial studies were conducted from the ecological perspective, focusing more on the structure, processes and functions of ecosystem (Kremen et al., 2007; Reiss et al., 2009). Some researchers conducted dynamic evaluation of ecosystem services through model simulation (Yapp et al., 2010; Robards et al., 2011), while others estimated the value of different types of ecosystem services in different regions from the perspective of ecological economics (Kontogianni et al., 2010; Zander and Straton, 2010). However, it was difficult to put forward scientific management policies only for ecosystem services supply without considering whether human’s demand for ecosystem services has been met. Therefore, in recent years, more and more attention has been paid to the study of the supply and demand of ecosystem services and their balance. Kroll et al. (2012) quantified and mapped the supply and demand of three essential provisioning services, energy, food, and water, along the rural–urban gradient of the eastern German region by using land use, soil, climate, population, energy consumption and other data. Burkhard et al. (2012) constructed a matrix linking spatially explicit biophysical landscape units to ecosystem service supply and demand, and used remote sensing, land survey and socio-economic data to analyze the spatial pattern of ecosystem service supply and demand and their balance. Yang et al. (2012) analyzed the balance between the supply and demand of grain, oil and meat production services in the Yellow River Basin based on county-level statistical data, and visualized the spatial data. These studies demonstrated the spatial mismatch between the supply and demand of ecosystem services, which meant the ecosystem services provided by the region were not used to meet the needs of human society in the same region. In consequence, it is necessary to study the whole process of ecosystem services from generation to use, and clarify the flow process from supply to demand, so as to determine the impact on the human well-being.
Ecosystem service flow, defined as the movement of services from supply areas to benefit areas, can establish a spatio-temporal connection between the supply and demand of ecosystem services (Schirpke et al., 2019a). Therefore, clarifying the transmission path and flow of the ecosystem services is conducive to improving the accuracy of ecosystem service assessment. The formation of services flow mainly depends on the spatial heterogeneity of factors such as ecosystem structure, habitat condition, utilization degree, and the increasing demand of human beings at different levels is the fundamental driving force of ecosystem service flow (Azam and Mohsen, 2021). The direction and intensity of service flow reflect the regional differences in the level of social and economic development (Zank et al., 2016). At present, the research on ecosystem service flow mainly focused on the construction of the theoretical framework (Maass et al., 2005; Palomo et al., 2013), the analysis of service value (Turner et al., 2012; Wang et al., 2021), and spatial correlation analysis of supply and demand (Serna-Chavez et al., 2014). Although it was clear that the source and sink of ecosystem services need to go through a process of spatial flow, the existing studies have not accurately described the flow. Despite the difficulties, research needs to be continued. Only in this way can we accurately link the supply and demand of ecosystem services and provide a scientific basis for scientific and reasonable management policies.
Networks are composed of nodes that represent specific objects, and edges that represent relations between nodes, which can depict many systems that emphasize linkages between components and dynamics (Reza et al., 2021). To date, the network model has been widely used in the field of ecosystem service. For instance, Dee et al. (2017) proposed that using meta-networks to assess how drivers and management actions will impact ES directly and indirectly. Field and Parrott (2017) constructed a conceptual schematic of the multi-ES network to assess landscape connectivity and resilience. In addition, network model had great potential in ecosystem service flow research. Wang et al. (2020) demonstrated the effectiveness of the network model in mapping ESF by constructing a freshwater service flow network for the Yanhe watershed in China. Using networks to identify and regard the supply and demand of ecosystem services as the starting point and end point of the spatial flow can support connectivity assessment, determine the service flow transmission path and help identify spatial and temporal changes (Feurer et al., 2021). The ecosystem services network can assist in making ecological protection decisions by identifying where ecosystem services is most or least connected, and which nodes and edges are the most important.
The Qinghai-Tibetan Plateau has unique ecological significance not just for the natural ecosystems, but also for human society. As an important geographic and ecological unit, the changes in the ecosystems of the Qinghai-Tibet Plateau have a significant impact on the global environment. For the purposes of this study, we adapted the definition of ecosystem service flow from Bagstad et al. (2013) as the transmission of carbon from ecosystems to humans with a spatio-temporal connection between carbon supply and benefit areas. Therefore, the aims of this study were to: 1) quantify and map the spatio-temporal patterns on the supply and demand of carbon sequestration service from 2000 to 2019; 2) construct the carbon sequestration service flow network on the Qinghai-Tibet Plateau; 3) analyze the driving factors of difference between supply and demand of carbon sequestration service and discuss implications for resource management. The study contributed to a better understanding of the objective laws governing spatial flow of carbon sequestration service in regional ecosystems as well as providing theoretical basis and data support for regional carbon management, which was critical to the ecological management and sustainable development of the Qinghai-Tibet Plateau.
2 Data Sources and Methods
2.1 Study Area
The Qinghai-Tibet Plateau (QTP) is located in the Southwest China (73°18′E∼104°46′E, 26°00′N∼39°46′N) (Figure 1) and is the world’s largest and most unique geographical unit, accounting for about 26.8% of the land area in China. With an average altitude of more than 4000 m, it is known as the “third pole” of the Earth. The region belongs to a typical continental plateau climate area with low air temperature, strong solar radiation and distinct dry and rainy seasons. The mean annual precipitation ranges from 415 to 515 mm, and the mean annual temperature varies from -2.2 to 0°C. Precipitation and average annual temperature decline from the southeast to the northwest of the Plateau. As one of the most important agricultural and pastoral areas in China, the QTP is abundant in grassland resources, accounting for 50.43% of the country’s total grassland area. The average annual carbon storage reaches 37.61 Pg C, accounting for 63.2% of the total grassland carbon storage in China, which is vital to maintain ecological security of China and the global carbon cycle (Li et al., 2019).
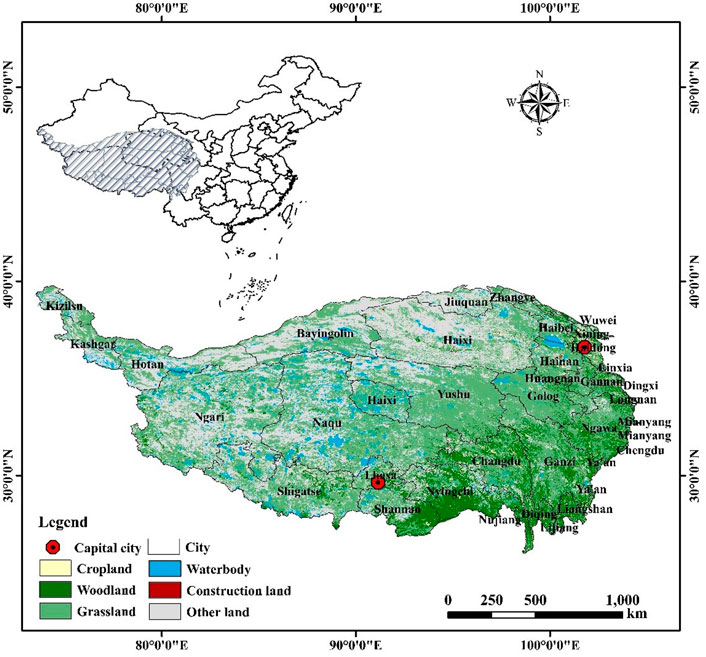
FIGURE 1. Study area.
Administratively, the Qinghai-Tibetan Plateau covers six provinces including Xinjiang, Gansu, Qinghai, Tibet, Yunnan and Sichuan. Since 1949, the population has grown rapidly. By the end of 2019, the total population has reached 26.85 million. The expansion of agriculture and animal husbandry in recent decades has deteriorated grassland ecosystems and increased greenhouse gas emissions, contributing to global climate change (Liu et al., 2021). Increasingly intense human activities have led to the degradation of the ecosystems and the continuous loss of biodiversity on the QTP, and the further decline in the supply of ecosystem services on the Plateau. The demand for ecosystem services has increased with the acceleration of urbanization. The trend of mismatches between ecosystem service supply and demand became increasingly serious (Sun et al., 2020).
2.2 Data Sources
The basic data used in this study includes the following: 1) NPP data is derived from the MODIS data of the National Aeronautics and Space Administration (NASA) with a spatial resolution of 500 m. 2) Land use data are interpreted by Landsat TM and provided by the Data Center for Resources and Environmental Sciences, Chinese Academy of Sciences (RESDC). 3) Wind direction data is obtained from the European Center for Medium-Term Weather Forecast and is further counted to the dominant wind direction in the past 20 years according to the city scale. 4) Socioeconomic data include population of urban and rural residents, GDP, agricultural material input, crop yield, livestock production, electricity, heat, etc. The data is derived from statistical yearbooks and national economic and social development bulletins of various provinces and cities. Specific data sources are shown in Table 1.
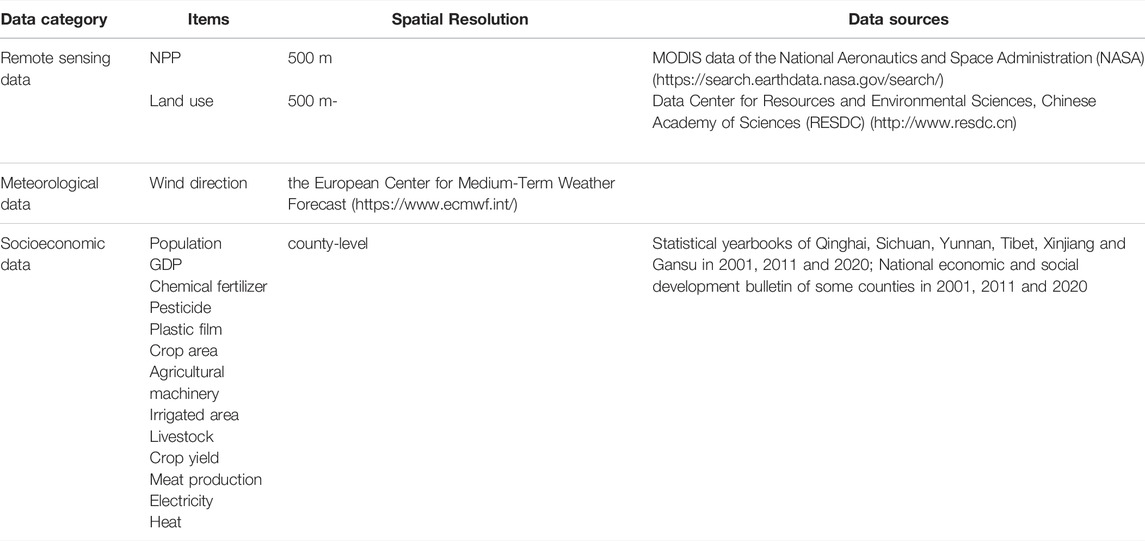
TABLE 1. Data type and sources.
2.3 Materials and Methods
2.3.1 Supply and Demand of Carbon Sequestration Service
The study referred to the evaluation of ecosystem services by Zhang et al. (2021) and Bagstad et al. (2014), using vegetation net primary productivity (NPP) to characterize the supply of carbon sequestration service, and using regional carbon emissions as the demand of carbon sequestration service, as shown in Table 2.

TABLE 2. Datasets for mapping the supply and demand of carbon sequestration.
NPP can reflect not only the productivity of vegetation in the natural environment, but also the surface carbon sequestration capacity. Therefore, NPP can characterize the supply of carbon sequestration service (CS) (Jia et al., 2014). Carbon emitters are users of carbon sequestration service, so carbon emissions provide one possible measure for the demand of carbon sequestration service (CD) required to offset anthropogenic emissions (Bagstad et al., 2014). The carbon emissions calculated in this study mainly come from the production and life of residents, as shown in Eq. 1.
where
where
Agricultural production activities consume large amount of chemical fertilizers, pesticides and other products, which brings about large carbon emissions (Li M. et al., 2021). This study calculated the carbon emissions from chemical fertilizers, pesticides, agricultural plastic film, machinery, and irrigation as follows.
In the formula,
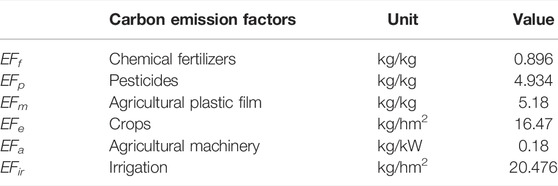
TABLE 3. Specific values of carbon emission factors (Xu et al., 2018).
Animal husbandry carbon emissions are greenhouse gas emissions which are expressed in terms of equivalent carbon dioxide, including methane emissions from animal enteric fermentation and methane and nitrous oxide emissions from animal manure management (Guo et al., 2017). The formula is calculated as follows:
In the formula,
where
where
To better analyze the supply-demand situation of carbon sequestration service at city scale, the difference between supply and demand of carbon sequestration (DSDC) in different cities was calculated on the Qinghai-Tibet Plateau. The formula is as follows:
where
2.3.2 The Network Model of Carbon Sequestration Service Flow
In the carbon sequestration service flow model of this study, we assumed that the carbon sequestration service flow connected the supply area with the demand area through the atmospheric circulation in a closed system, without considering the obstacles and resistance in the process (Schirpke et al., 2019b). The demand for carbon sequestration service in different spatial locations could be offset by the remaining supply amount in other regions. The flow path of the carbon sequestration service was mainly determined according to the dominant wind direction, and the flow source and sink was mainly determined according to the DSDC. This study used a network model to reveal the carbon sequestration service flow between different cities on the Qinghai-Tibet Plateau. The specific construction process is shown in Figure 2.
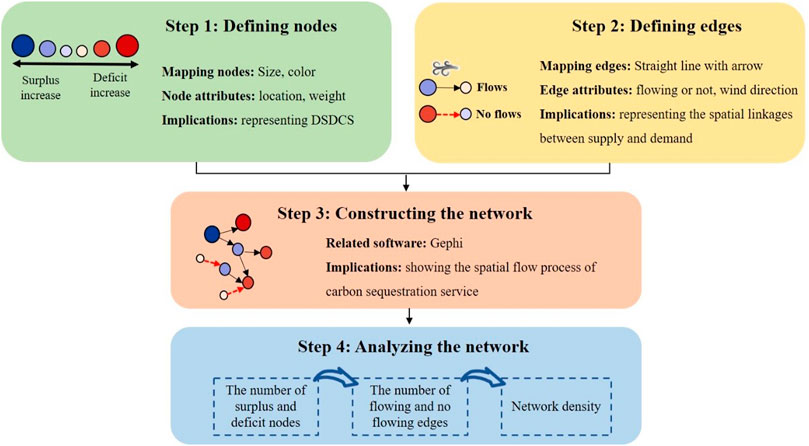
FIGURE 2. Summary of the steps for mapping the service flow network.
Step 1. Defining nodes. We set the central point of each city on the Qinghai-Tibet Plateau as the node of carbon sequestration service flow network. These central points with geographic coordinates (longitude and latitude) were extracted by ArcGIS 10.2. The weight of each node was calculated as the difference between carbon sequestration supply and demand (DSDC) in each city. If the weight was greater than 0, it meant supply could meet local demand, and therefore we defined this node as a surplus node. Otherwise, we defined it as a deficit node. Different color of nodes was utilized to indicate the surplus or deficit state. The size and shade of the nodes represented the degree of surplus or deficit.
Step 2. Defining edges. We defined carbon sequestration service flows from one location to another as edges between nodes. Referring to Wang et al. (2020), we assumed that the remaining carbon flows from node to node accumulating following the dominant wind direction, as flows satisfied the demand of each local area and moved among cities. On the contrary, if one node was in deficit and its carbon sequestration demand was still not met with supplements from other nodes, then the node would have no surplus for the adjacent node, implying that the edge was interrupted. It was worth noting that this assumption was based on accumulation, i.e., flowing until the final accumulation of carbon sequestration supply could not meet the demand. We used the black lines with arrows to represent connecting edges, indicating that there was carbon sequestration service flow on the path, and the red dashed lines represented the interrupted edges, that is, there was no service flow along the path.
Step 3. Constructing the network. Based on the definitions and assumptions above, we visualized the carbon sequestration flow network using Gephi software (https://gephi.org/) with Geo layout that accurately determined the spatial location of nodes according to their geographic coordinates, making the spatial flow paths between nodes more intuitive.
Step 4. Analyzing the network. After constructing the carbon sequestration service flow network, we analyzed the network properties from three aspects. Firstly, we used the number of surplus and deficit nodes to analyze the spatial match between supply and demand of carbon sequestration services (Chen et al., 2019). Secondly, we distinguished the potential and actual supply of carbon sequestration service according to the number of flowing and no flowing edges. The carbon sequestration supply of one node may come from two parts that are the node itself and the carbon sequestration flows. Therefore, although the carbon sequestration supply of some nodes cannot meet demand under the static spatial matching, they can meet the demand because of service flows. Specifically, in the carbon sequestration service flow network, nodes starting with solid lines indicated that supply actually can meet the demand, while nodes starting with dotted lines indicated that the supply actually cannot meet the demand. Finally, we calculated network density to analyze the connectivity of the carbon sequestration service flow network. The greater the network density, the better the overall connectivity of the network.
2.3.3 The Driving Force of the Difference Between Supply and Demand of Carbon Sequestration Service
Considering data accessibility and scientific analysis, urbanization, socioeconomic conditions, demographic factors, agricultural activities, grazing intensity, and urban conditions were selected as the driving force for DSDC. Referring to previous studies, six possible indicators were used to represent these driving forces. The detailed variables are described in Table 4.
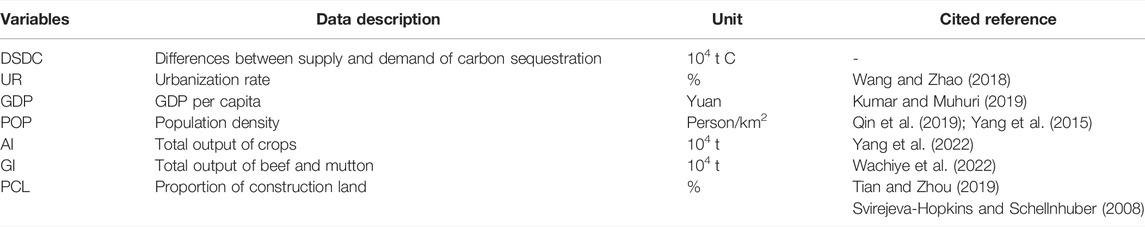
TABLE 4. Description of the driving force factors.
The geographical detector model was used to detect spatial stratified heterogeneity and reveal the main driving forces of variables (Wang and Xu, 2017). Specifically, it measures a dependent variable (Y) while also testing the coupling between Y and X (explanatory variable) and investigates the effect of the interaction between two explanatory variables on Y. There are several advantages of this method. First, the dependent and explanatory variables do not require linear assumptions. Second, the explanatory variables do not need to consider the multiple collinearity problem. Third, the method can determine how the interaction of two explanatory variables affects the dependent variable.
The module of factor detection is commonly applied to determine a specific geographical factor. Quantification of the spatial distribution difference is performed by comparing the total variance of this indicator in different regions and the entire region. The formula of q value is given below:
where
where λ is a non-central parameter and
The module of interaction detection quantifies the interaction between two explanatory factors X1 and X2 by comparing the q value of factors X1 and X2 with the interaction q value (
3 Results
3.1 The Spatio-Temporal Pattern of Carbon Sequestration Service Supply and Demand
The supply of carbon sequestration service on the Qinghai-Tibet Plateau has not changed significantly, which increased from 28.38 million tons in 2000 to 31.45 million tons in 2019. While the demand for large changes increased from 23.95 million tons in 2000 to 51.55 million tons in 2019 (Figure 3). It should be noted that the supply of carbon sequestration service exceeded the demand in 2000. However, the supply was less than the demand in 2010 and 2019, and the carbon deficit in 2019 exceeded by 20 million tons.
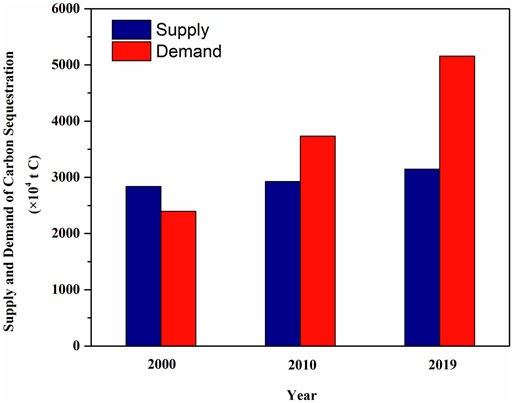
FIGURE 3. The carbon sequestration supply and demand from 2000 to 2019.
In terms of the spatial variability, the supply of carbon sequestration service gradually decreased from the southeast to the northwest (Figure 4). Especially, the high-supply areas were mainly concentrated on the southern parts of the Qinghai-Tibet Plateau. Compared with that in 2000 and 2010, the supply in the northwestern increased significantly in 2019. Cities with high demand for carbon sequestration service (over two million tons) increased from one in 2000 to five in 2019. Among the cities, Xining and Haidong in Qinghai province had the largest demand for carbon sequestration service, and the demand for Hotan and Kashgar in Xinjiang province has increased significantly.
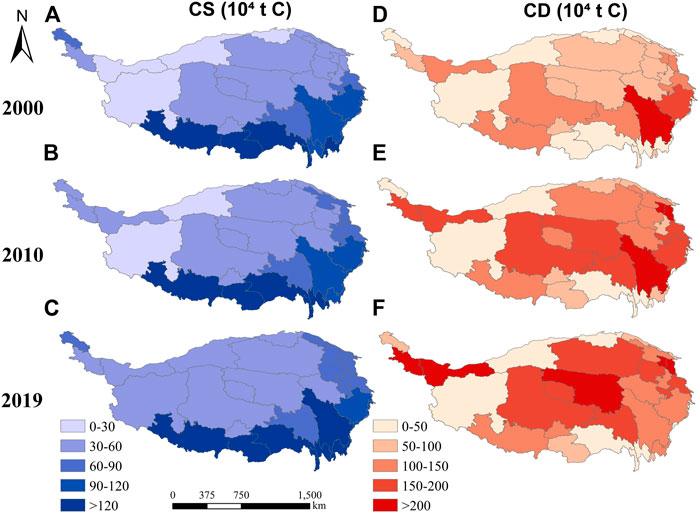
FIGURE 4. The supply (A,B,C) and demand (D,E,F) of carbon sequestration service from 2000 to 2019 (CS: the supply of carbon sequestration service, CD: the demand of carbon sequestration service).
Figure 5 depicted the differences between the supply and demand of carbon sequestration service in various cities on the Qinghai-Tibet Plateau in 2000, 2010 and 2019. Due to the rapid development of carbon demand, most cities have turned from carbon surpluses to deficits (such as Linxia and Chengdu), or the deficits have increased (such as Yushu and Xining), or the surpluses have weakened (such as Longnan and Shannan). However, there were still cities that have improved. For example, Ganzi and Aba in Sichuan province were in deficit in 2000 and 2010, but they had the carbon surplus in 2019. In terms of spatial distribution, we also discovered that all cities in Qinghai province were in deficit, while three cities in Yunnan province were in carbon surplus.
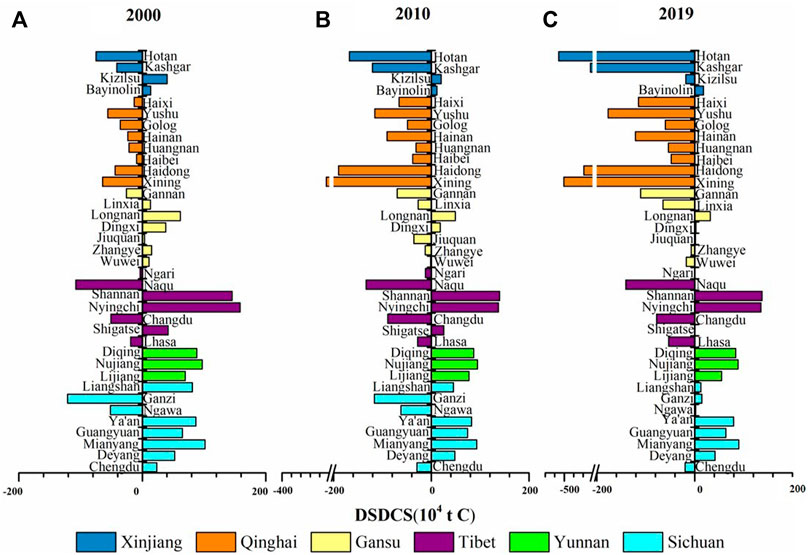
FIGURE 5. DSDC changes in all cities in 2000 (A), 2010 (B), 2019 (C).
3.2 The Spatio-Temporal Pattern of the Carbon Sequestration Service Flow Network
According to the nodes and edges defined in Section 2.3.2, we constructed a carbon sequestration service flow network, as shown in Figure 6. A total of 37 nodes represented the surplus or deficit status of carbon sequestration service. The results showed that the number of carbon surplus nodes decreased from 20 in 2000 to 15 in 2010, and then increased to 18 in 2019. The number of deficit nodes increased from 17 in 2000 to 22 in 2010, and decreased to 19 in 2019 (Table 5).
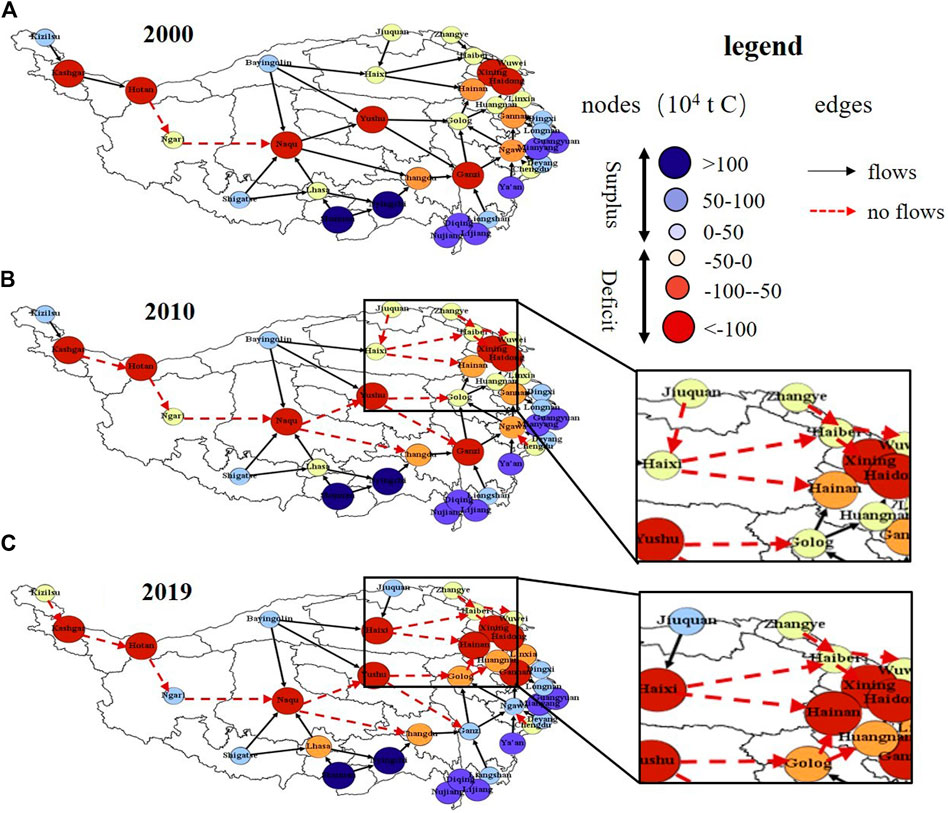
FIGURE 6. The carbon sequestration flow network in 2000 (A), 2010 (B), 2019 (C).
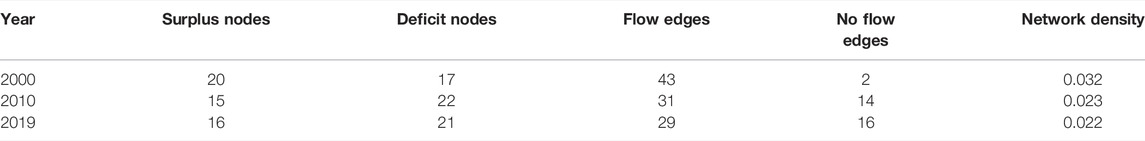
TABLE 5. Overall characteristics of service flow network.
In 2000, although there were 17 carbon deficit nodes, the transmission of atmospheric circulation through the surrounding areas kept the carbon sequestration service flow network intact to a certain extent. However, as there was no excess carbon surplus in the central region, a large number of interrupted edges existed in the service flow network. In 2010, the number of interrupted edges reached 14 and the severely damaged parts were concentrated in the northeast of the Qinghai-Tibet Plateau. In 2019, despite the increase in carbon surplus nodes, the number of interrupted edges still increased to 16, which showed that while the shortage of carbon sequestration service in some cities has lessened, it still has not had a positive impact on the entire region. The network density of the service flow network dropped from 0.032 in 2000 to 0.022 in 2019. It could be seen that the shortage of carbon sequestration service on the Qinghai-Tibet Plateau was still getting worse and the connectivity of the service flow network was declining.
3.3 The Drivers of Supply-Demand Dynamics of Carbon Sequestration Service
We further analyzed the main drivers of the supply-demand dynamics of carbon sequestration service on the Qinghai-Tibet Plateau. The finding revealed that after 2000, the demand of carbon sequestration service became the primary driving force that determined the surplus and deficit of carbon sequestration service in various cities, with its influence rising from 2000 to 2015. Specifically, the percentage of explanation (q value) for carbon supply dropped from 0.536 in 2000 to 0.355 in 2019, and the percentage of explanation (q value) for carbon demand, as another explanatory variable, rose from 0.627 in 2000 to 0.926 in 2019 (Figure 7A). This demonstrated that the demand for carbon sequestration service in cities continued to exceed the supply.
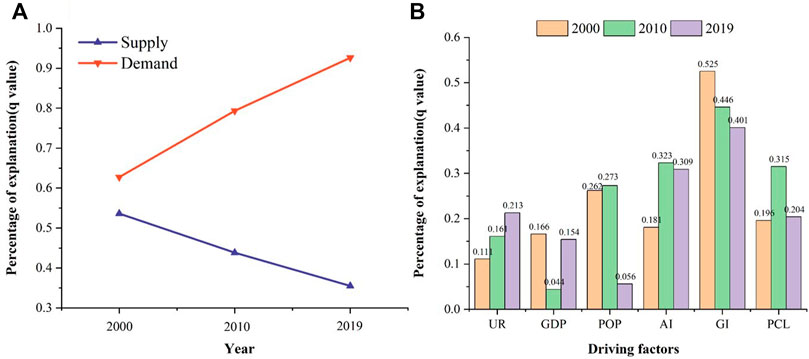
FIGURE 7. Percentage of explanation (q value) for supply and demand of carbon sequestration service (A); Percentage of explanation (q value) for each driving factor in 2000, 2010 and 2019 (B) (UR: urbanization rate, GDP: gross domestic product per capita, POP: population density, AI: agricultural input, GI: grazing intensity, PCL: proportion of construction land).
We then investigated the explanatory power of different driving factors for the difference between the supply and demand of carbon sequestration service, as shown in Figure 7B. Notably, the factors varied in their ability to explain the DSDC, with some factors having a large impact. Additionally, an ecological detector was employed to identify whether there were significant differences among the influencing factors regarding the spatial distribution of DSDC (Figure 8, p < 0.05). In 2000, Total output of beef and mutton (GI) (0.525) and Population density (POP) (0.262) had the highest explanatory power, implying that grazing intensity and population density had remarkably prominent impact on DSDC. The results from the ecological detector demonstrated that grazing intensity had a considerably different effect on DSDC than population density. In 2010, GI (0.446) exerted a significant effect on DSDC. Total output of crops (AI) (0.323) and Proportion of construction land (PCL) (0.315) also affected the DSDC. In 2019, the explanatory power of GI (0.401) has declined, but it was still the largest, followed by AI (0.309) and Urban population ratio (UR) (0.213). Furthermore, results from the ecological detector demonstrated that the effects of urbanization rate and proportion of construction land on DSDC were significantly different from those of grazing intensity. The q value of grazing intensity has been decreasing, indicating that the influence of grazing intensity on the DSDC has lessened. The result could be attributed to the high-quality development of animal husbandry in recent years. In contrast, the q values of urbanization rate and agricultural input had increasing trends, indicating that urbanization and agricultural activities had increasing impacts on DSDC. This meant that when evaluating carbon sequestration service in the future, the impact of urban and agricultural development must be taken into consideration.
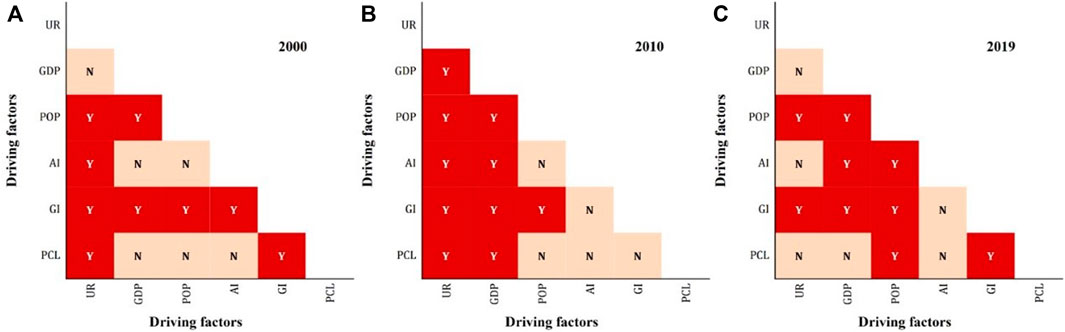
FIGURE 8. The ecological detector results for driving factors in 2000 (A), 2010 (B), 2019 (C) (UR: urbanization rate, GDP: gross domestic product per capita, POP: population density, AI: agricultural input, GI: grazing intensity, PCL: proportion of construction land).
Finally, we continued to analyze the explanatory power of the interaction between the factors (Figure 9). According to Figure 7B, the explanatory power of proportion of construction land and urbanization rate in factor detection were relatively low (q = 0.196 and 0.111, respectively). However, the interaction of urbanization rate with proportion of construction land had stronger explanatory power, indicating that proportion of construction land only had an important influence on DSDC when there was a sufficient level of urbanization development. The explanatory power of factor interaction in 2010 was similar to that in 2000. In 2019, AI and GDP, AI and POP, AI and PCL were found to enhance each other to jointly affect the DSDC. Agricultural input, together with economic development, population density, and the proportion of construction land, have increased the driving force for DSDC. The development of agriculture has surpassed that of animal husbandry, which had a stronger impact on carbon sequestration service and economic development.
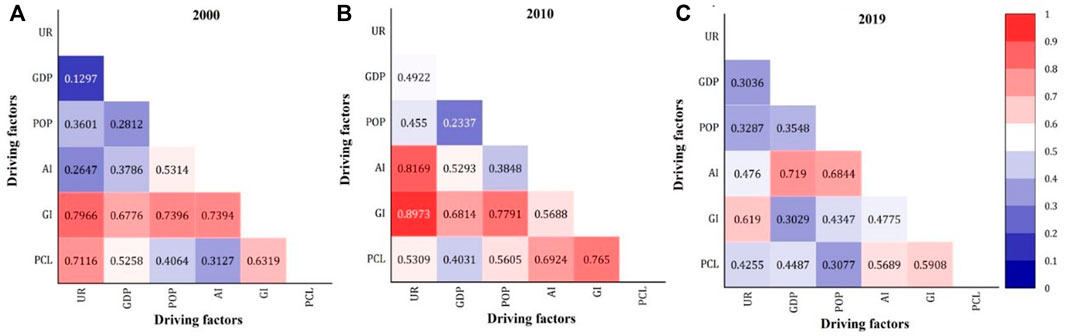
FIGURE 9. Percentage of explanation (q value) in interaction in 2000 (A), 2010 (B), 2019 (C) (UR: urbanization rate, GDP: gross domestic product per capita, POP: population density, AI: agricultural input, GI: grazing intensity, PCL: proportion of construction land).
4 Discussion
4.1 The Implications for Management of Carbon Sequestration Service
Carbon sequestration service is essential for maintaining the sustainable development of humans and ecosystems (Liu et al., 2018). In this study, we quantified the supply and demand of carbon sequestration service on the Qinghai-Tibetan Plateau. Based on our results, the supply increased slowly from 2000 to 2019, but the demand changed significantly (Figure 3). Especially in 2019, the deficit of carbon sequestration service exceeded 20 million tons. If the supply and demand of carbon sequestration service continues to develop at this trend in the following years, we can infer that the deficit on the Qinghai-Tibetan Plateau will be more serious. Therefore, this result illustrates the necessity of strengthening management of carbon sequestration service.
For management of carbon sequestration service, we often need to identify areas with high supply or demand, as well as areas with deficit or surplus of carbon sequestration service, because it is very important for policy making and resource allocation. The supply of carbon sequestration service on the Qinghai-Tibetan Plateau gradually decreased from southeast to northwest. The regions where supply increased from 2000 to 2019 mainly included Ngari, Hotan and eastern Qinghai-Tibetan Plateau (Figure 4). It was not only related to the implementation of ‘returning farmland to forest and grassland’ policy, but also to the remarkable achievements in soil erosion control (Bi et al., 2021; Zinda et al., 2017). The regions with high demand of carbon sequestration service on the Qinghai-Tibetan Plateau were mainly characterized by intense human activities (Xiong et al., 2021; Wang et al., 2022). For example, Xining and Haidong had the largest demand of carbon sequestration service. Hotan and Kashgar in Xinjiang had significant growth in demand (Figure 4). Cities with more serious deficit from 2000 to 2019 were Shannan and Yushu, while the difference between supply and demand of carbon sequestration service has improved in Ganzi and Aba in Sichuan province (Figure 5). This was primarily due to rich ecological resources and policy conditions in northwest Sichuan to play an important role in emission reduction and carbon sequestration in recent years (Wang et al., 2017). In this study, we constructed a carbon sequestration service flow network based on the data of supply and demand of carbon sequestration service. The results showed that the connectivity of the service flow network has decreased since 2010 (Figure 6), especially on the northeastern part of Qinghai-Tibetan Plateau. Our results can help managers to identify the regions where carbon sequestration service can’t meet the local demands, and thus develop strategies to reduce emission and allocate resources. We can also found from the results that some cities with deficits benefited from surrounding cities with surpluses. Therefore, the carbon sequestration service flow can help inform ecological compensation policy (Voghera and Giudice, 2020; Zhai et al., 2021).
The shortage of carbon sequestration service was a global problem (Ghosh et al., 2022). Our analysis showed that after 2000 the demand has been the dominant driver determining the surplus and deficit of carbon sequestration service and its influence has been increasing (Figure 7A). In this case, it is an effective way to reduce demand as much as possible and improve supply in key areas. These nodes connected with interruption edges should be the main areas of supply replenishment. In addition to increasing supply, reducing consumption is another important aspect of alleviating service shortages. Our results indicated that the driving force effect of grazing intensity on the DSDC gradually weakened (Figure 7B). This was primarily due to the policies implemented in recent years, such as limiting and banning grazing, returning grazing to grassland, and subsidizing ecological rewards. The damage of grazing activities to grassland has been limited to a certain extent (Wang et al., 2019). However, the impact of agricultural activity has increased. In agricultural activities, the transition from traditional agriculture to organic agriculture is conducive to reducing the environmental impact of carbon emissions. However, agricultural mechanization has increased the amount of energy used, and seeding have also produced resource consumption in the process of processing and transportation, both of which has a considerable impact on carbon emissions (Jiang et al., 2020). The impact of urbanization and construction land has also increased (Figure 7B). The primary reason for this was that in recent years, with the support of national aid policies, the agglomeration effect of towns on the Qinghai-Tibetan Plateau has been significantly improved, and the urban infrastructure has been gradually improved, accompanied by the transformation of other land use types into construction land, which was bound to affect carbon sequestration service (van Roon, 2012; Li et al., 2021a). We also found that the explanatory power of the interaction between urbanization rate and proportion of construction land exceeded that of the single factor (Figure 9). The Qinghai-Tibetan Plateau had a vast territory but a small population. Although the agglomeration effect of towns has significantly increased, urbanization was still in its infancy, and the construction land was still increasing (Tian et al., 2021). Therefore, the following suggestions need to be noted. 1) In the process of future urban construction and economic development, ecological protection should be given priority and ecological security barrier construction will continue to be promoted. 2) The government should make rational plans for land use, and rationally coordinate the use of ecological land, construction land, agricultural land and other functional spaces. 3) The protection of natural forest, grassland and wetland should be strengthened in key areas where carbon sequestration service need to be improved. Meanwhile, the ecological fragile areas affected by construction activities should be restored by measures such as containment protection.
4.2 Limitations and Prospects
Our study with the methodological provided theoretical evidence and support in terms of carbon cycle optimization, planning, and protection in other regions where were also experiencing rapid urbanization. However, our study had also some limitations. To begin with, due to a lack of data, this study only used NPP to illustrate the supply of carbon sequestration service. Future research will pay more attention to the completeness and accuracy of research data. Second, the differences between and within the cities were ignored when analyzing the driving forces. The specific driving analysis should be refined to a county-level scale, accounting for the various driving effects of carbon sequestration service flows between cities. In addition, due to the limitations of the research method, this study only considered carbon sequestration service flow within the Qinghai-Tibet Plateau, and did not discuss carbon sequestration service flow between the marginal counties of the study area and outside the study area. In future research, we will focus on the service flow both inside and outside the study region, as well as a more thorough examination of spatial flow.
5 Conclusion
This study quantified the spatial difference between the supply and demand of carbon sequestration service on the Qinghai-Tibet Plateau, simulated the spatial flows of carbon sequestration service and revealed the driving effects of various driving factors on carbon sequestration service, which provided a new idea for the optimization of ecosystem service flow and regional carbon sequestration pattern. In the past 20 years, the demand of carbon sequestration service on the Qinghai-Tibet Plateau has greatly outpaced the supply, resulting in carbon deficits in most cities. The spatial flow was considerably affected, and the density of the carbon sequestration service flow network continued to decline. The spatial disparity between the supply and demand of carbon sequestration service was jointly influenced by a variety of human activities. With the development of urbanization, the influence of grazing has lessened, while the driving influence of agriculture and urbanization rate has gradually increased. The study of ecosystem service supply and demand is conducive to the construction of regional ecological security pattern. Reasonable simulations of ecosystem service flow can effectively alleviate the obvious spatial dislocation between the unbalanced distribution of natural resources and people’s consumption needs, so as to focus on the deficit areas that require input of limited human and material resources, and realize the optimal allocation of resources.
Data Availability Statement
Publicly available datasets were analyzed in this study. This data can be found here: https://data.cnki.net/Yearbook/Navi?type = typeandamp;code = A.
Author Contributions
QW: conceptualization, writing-original draft preparation, methodology, software.SL: writing-reviewing and editing, validation. FW: writing, resources. HL: data curation, supervision. YL: writing, data curation. LY: writing, resources. JS: formal analysis, supervision. L-SPT: investigation, validation. YD: investigation, methodology.
Funding
This study was supported by the Second Scientific Expedition to the Qinghai-Tibet Plateau (No. 2019QZKK0405-05) and National Natural Sciences Foundation of China (No. 41571173).
Conflict of Interest
The authors declare that the research was conducted in the absence of any commercial or financial relationships that could be construed as a potential conflict of interest.
Publisher’s Note
All claims expressed in this article are solely those of the authors and do not necessarily represent those of their affiliated organizations, or those of the publisher, the editors and the reviewers. Any product that may be evaluated in this article, or claim that may be made by its manufacturer, is not guaranteed or endorsed by the publisher.
References
Abbasi, K. R., Hussain, K., Redulescu, M., and Ozturk, I. (2021). Does Natural Resources Depletion and Economic Growth Achieve the Carbon Neutrality Target of the UK? A Way Forward towards Sustainable Development. Resour. Policy 74, 102341. doi:10.1016/j.resourpol.2021.102341
Adams, S., Adedoyin, F., Olaniran, E., and Bekun, F. V. (2020). Energy Consumption, Economic Policy Uncertainty and Carbon Emissions; Causality Evidence from Resource Rich Economies. Econ. Analysis Policy 68, 179–190. doi:10.1016/j.eap.2020.09.012
Azam, K. M., and Mohsen, S. (2021). Investigating Tradeoffs between Supply, Use and Demand of Ecosystem Services and Their Effective Drivers for Sustainable Environmental Management. J. Environ. Manag. 289, 112534. doi:10.1016/j.jenvman.2021.112534
Bagstad, K. J., Johnson, G. W., Voigt, B., and Villa, F. (2013). Spatial Dynamics of Ecosystem Service Flows: A Comprehensive Approach to Quantifying Actual Services. Ecosyst. Serv. 4, 117–125. doi:10.1016/j.ecoser.2012.07.012
Bagstad, K. J., Villa, F., Batker, D., Harrison-Cox, J., Voigt, B., and Johnson, G. W. (2014). From Theoretical to Actual Ecosystem Services: Mapping Beneficiaries and Spatial Flows in Ecosystem Service Assessments. Ecol. Soc. 19 (2), 64. doi:10.5751/es-06523-190264
Bi, W., Wang, K., Weng, B., Yan, D., and Liu, S. (2021). Does the Returning Farmland to Forest Program Improve the Ecosystem Stability of Rhizosphere in Winter in Alpine Regions? Appl. Soil Ecol. 165, 104011. doi:10.1016/j.apsoil.2021.104011
Burkhard, B., Kroll, F., Nedkov, S., and Müller, F. (2012). Mapping Ecosystem Service Supply, Demand and Budgets. Ecol. Indic. 21, 17–29. doi:10.1016/j.ecolind.2011.06.019
Chen, G., Luo, J., Zhang, C., Jiang, L., Tian, L., and Chen, G. (2018). Characteristics and Influencing Factors of Spatial Differentiation of Urban Black and Odorous Waters in China. Sustainability 10, 4747. doi:10.3390/su10124747
Chen, J., Jiang, B., Bai, Y., Xu, X., and Alatalo, J. M. (2019). Quantifying Ecosystem Services Supply and Demand Shortfalls and Mismatches for Management Optimisation. Sci. Total Environ. 650, 1426–1439. doi:10.1016/j.scitotenv.2018.09.126
Costanza, R., d'Arge, R., de Groot, R., Farber, S., Grasso, M., Hannon, B., et al. (1997). The Value of the World's Ecosystem Services and Natural Capital. Nature 387, 253–260. doi:10.1038/387253a0
Daily, G. C. (1997). Nature’s Services: Societal Dependence on Natural Ecosystems. Washington, DC: Island Press.
Dee, L. E., Allesina, S., Bonn, A., Eklöf, A., Gaines, S. D., Hines, J., et al. (2017). Operationalizing Network Theory for Ecosystem Service Assessments. Trends Ecol. Evol. 32, 118–130. doi:10.1016/j.tree.2016.10.011
Feurer, M., Rueff, H., Celio, E., Heinimann, A., Blaser, J., Htun, A. M., et al. (2021). Regional Scale Mapping of Ecosystem Services Supply, Demand, Flow and Mismatches in Southern Myanmar. Ecosyst. Serv. 52, 101363. doi:10.1016/j.ecoser.2021.101363
Field, R. D., and Parrott, L. (2017). Multi-Ecosystem Services Networks: A New Perspective for Assessing Landscape Connectivity and Resilience. Ecol. Complex. 32, 31–41. doi:10.1016/j.ecocom.2017.08.004
Ghosh, S., Dinda, S., Chatterjee, N. D., Dutta, S., and Bera, D. (2022). Spatial-Explicit Carbon Emission-Sequestration Balance Estimation and Evaluation of Emission Susceptible Zones in an Eastern Himalayan City Using Pressure-Sensitivity-Resilience Framework: An Approach towards Achieving Low Carbon Cities. J. Clean. Prod. 336, 130417. doi:10.1016/j.jclepro.2022.130417
Guo, J., Qi, D., Zhang, N., Sun, L., and Hu, R. (2017). Chinese Greenhouse Gas Emissions from Livestock:Trend and Predicted Peak Value. J. Agro-Environ. Sci. 36, 2106–2113. doi:10.11654/jaes.2017-0132
Holdren, J. P., and Ehrlich, P. R. (1974). Human Population and the Global Environment. Am. Sci. 62, 282–292.
Jia, X., Fu, B., Feng, X., Hou, G., Liu, Y., and Wang, X. (2014). The Tradeoff and Synergy between Ecosystem Services in the Grain-For-Green Areas in Northern Shaanxi, China. Ecol. Indic. 43, 103–113. doi:10.1016/j.ecolind.2014.02.028
Jiang, M., Hu, X., Chunga, J., Lin, Z., and Fei, R. (2020). Does the Popularization of Agricultural Mechanization Improve Energy-Environment Performance in China's Agricultural Sector? J. Clean. Prod. 276, 124210. doi:10.1016/j.jclepro.2020.124210
Kontogianni, A., Luck, G. W., and Skourtos, M. (2010). Valuing Ecosystem Services on the Basis of Service-Providing Units: A Potential Approach to Address the 'Endpoint Problem' and Improve Stated Preference Methods. Ecol. Econ. 69, 1479–1487. doi:10.1016/j.ecolecon.2010.02.019
Kremen, C., Williams, N. M., Aizen, M. A., Gemmill-Herren, B., LeBuhn, G., Minckley, R., et al. (2007). Pollination and Other Ecosystem Services Produced by Mobile Organisms: A Conceptual Framework for the Effects of Land-Use Change. Ecol. Lett. 10, 299–314. doi:10.1111/j.1461-0248.2007.01018.x
Kroll, F., Müller, F., Haase, D., and Fohrer, N. (2012). Rural-Urban Gradient Analysis of Ecosystem Services Supply and Demand Dynamics. Land Use Policy 29, 521–535. doi:10.1016/j.landusepol.2011.07.008
Kumar, S., and Muhuri, P. K. (2019). A Novel GDP Prediction Technique Based on Transfer Learning Using CO2 Emission Dataset. Appl. Energy 253, 113476. doi:10.1016/j.apenergy.2019.113476
Li, J., Huang, X., Chuai, X., and Yang, H. (2021a). The Impact of Land Urbanization on Carbon Dioxide Emissions in the Yangtze River Delta, China: A Multiscale Perspective. Cities 116, 103275. doi:10.1016/j.cities.2021.103275
Li, L., Zhang, Y., Wu, J., Li, S., Zhang, B., Zu, J., et al. (2019). Increasing Sensitivity of Alpine Grasslands to Climate Variability along an Elevational Gradient on the Qinghai-Tibet Plateau. Sci. Total Environ. 678, 21–29. doi:10.1016/j.scitotenv.2019.04.399
Li, M., Liu, S., Sun, Y., and Liu, Y. (2021b). Agriculture and Animal Husbandry Increased Carbon Footprint on the Qinghai-Tibet Plateau during Past Three Decades. J. Clean. Prod. 278, 123963. doi:10.1016/j.jclepro.2020.123963
Liu, W., Yan, Y., Wang, D., and Ma, W. (2018). Integrate Carbon Dynamics Models for Assessing the Impact of Land Use Intervention on Carbon Sequestration Ecosystem Service. Ecol. Indic. 91, 268–277. doi:10.1016/j.ecolind.2018.03.087
Liu, Y., Liu, S., Sun, Y., Wang, F., and Li, M. (2021). Driving Forces of Cultivated Land Evolution in Agro-Pastoral Areas on the Qinghai-Tibet Plateau Based on Ecological Niche Theory. J. Clean. Prod. 313, 127899. doi:10.1016/j.jclepro.2021.127899
Maass, J. M., Balvanera, P., Castillo, A., Daily, G. C., Mooney, H. A., Ehrlich, P., et al. (2005). Ecosystem Services of Tropical Dry Forests: Insights from Long-Term Ecological and Social Research on the Pacific Coast of Mexico. Ecol. Soc. 10, 17. doi:10.5751/es-01219-100117
Millennium Ecosystem Assessment (2005). Ecosystems and Human Wellbeing: Synthesis. Washington: Island Press.
Palomo, I., Martín-López, B., Potschin, M., Haines-Young, R., and Montes, C. (2013). National Parks, Buffer Zones and Surrounding Lands: Mapping Ecosystem Service Flows. Ecosyst. Serv. 4, 104–116. doi:10.1016/j.ecoser.2012.09.001
Qin, H., Huang, Q., Zhang, Z., Lu, Y., Li, M., Xu, L., et al. (2019). Carbon Dioxide Emission Driving Factors Analysis and Policy Implications of Chinese Cities: Combining Geographically Weighted Regression with Two-Step Cluster. Sci. Total Environ. 684, 413–424. doi:10.1016/j.scitotenv.2019.05.352
Reiss, J., Bridle, J. R., Montoya, J. M., and Woodward, G. (2009). Emerging Horizons in Biodiversity and Ecosystem Functioning Research. Trends Ecol. Evol. 24, 505–514. doi:10.1016/j.tree.2009.03.018
Reza, V., Bertanza, G., Sbaffoni, S., and Vaccari, M. (2021). Regional Industrial Symbiosis: A Review Based on Social Network Analysis. J. Clean. Prod. 280, 124054. doi:10.1016/j.jclepro.2020.124054
Robards, M. D., Schoon, M. L., Meek, C. L., and Engle, N. L. (2011). The Importance of Social Drivers in the Resilient Provision of Ecosystem Services. Glob. Environ. Change 21, 522–529. doi:10.1016/j.gloenvcha.2010.12.004
Schirpke, U., Candiago, S., Egarter Vigl, L., Jäger, H., Labadini, A., Marsoner, T., et al. (2019a). Integrating Supply, Flow and Demand to Enhance the Understanding of Interactions Among Multiple Ecosystem Services. Sci. Total Environ. 651, 928–941. doi:10.1016/j.scitotenv.2018.09.235
Schirpke, U., Tappeiner, U., and Tasser, E. (2019b). A Transnational Perspective of Global and Regional Ecosystem Service Flows from and to Mountain Regions. Sci. Rep. 9, 6678. doi:10.1038/s41598-019-43229-z
Serna-Chavez, H. M., Schulp, C. J. E., van Bodegom, P. M., Bouten, W., Verburg, P. H., and Davidson, M. D. (2014). A Quantitative Framework for Assessing Spatial Flows of Ecosystem Services. Ecol. Indic. 39, 24–33. doi:10.1016/j.ecolind.2013.11.024
Sun, Y., Liu, S., Shi, F., An, Y., Li, M., and Liu, Y. (2020). Spatio-Temporal Variations and Coupling of Human Activity Intensity and Ecosystem Services Based on the Four-Quadrant Model on the Qinghai-Tibet Plateau. Sci. Total Environ. 743, 140721. doi:10.1016/j.scitotenv.2020.140721
Svirejeva-Hopkins, A., and Schellnhuber, H.-J. (2008). Urban Expansion and its Contribution to the Regional Carbon Emissions: Using the Model Based on the Population Density Distribution. Ecol. Model. 216, 208–216. doi:10.1016/j.ecolmodel.2008.03.023
Tian, Y., Jiang, G., Zhou, D., and Li, G. (2021). Systematically Addressing the Heterogeneity in the Response of Ecosystem Services to Agricultural Modernization, Industrialization and Urbanization in the Qinghai-Tibetan Plateau from 2000 to 2018. J. Clean. Prod. 285, 125323. doi:10.1016/j.jclepro.2020.125323
Tian, Y., and Zhou, W. (2019). How Do CO2 Emissions and Efficiencies Vary in Chinese Cities? Spatial Variation and Driving Factors in 2007. Sci. Total Environ. 675, 439–452. doi:10.1016/j.scitotenv.2019.04.239
Turner, W. R., Brandon, K., Brooks, T. M., Gascon, C., Gibbs, H. K., Lawrence, K. S., et al. (2012). Global Biodiversity Conservation and the Alleviation of Poverty. Bioscience 62, 85–92. doi:10.1525/bio.2012.62.1.13
van Roon, M. R. (2012). Wetlands in The Netherlands and New Zealand: Optimising Biodiversity and Carbon Sequestration during Urbanisation. J. Environ. Manag. 101, 143–150. doi:10.1016/j.jenvman.2011.08.026
Voghera, A., and Giudice, B. (2020). Defining a Social-Ecological Performance to Prioritize Compensatory Actions for Environmental Regeneration. The Experimentation of the Environmental Compensation Plan. Sustain. Cities Soc. 61, 102357. doi:10.1016/j.scs.2020.102357
Wachiye, S., Pellikka, P., Rinne, J., Heiskanen, J., Abwanda, S., and Merbold, L. (2022). Effects of Livestock and Wildlife Grazing Intensity on Soil Carbon Dioxide Flux in the Savanna Grassland of Kenya. Agric. Ecosyst. Environ. 325, 107713. doi:10.1016/j.agee.2021.107713
Wang, C., Li, W., Sun, M., Wang, Y., and Wang, S. (2021). Exploring the Formulation of Ecological Management Policies by Quantifying Interregional Primary Ecosystem Service Flows in Yangtze River Delta Region, China. J. Environ. Manag. 284, 112042. doi:10.1016/j.jenvman.2021.112042
Wang, J., and Xu, C. (2017). Geodetector: Principle and Prospective. Acta Geogr. Sin. 72, 116–134. doi:10.11821/dlxb201701010
Wang, S., Fan, J., Li, Y., Wu, D., Zhang, Y., and Huang, L. (2019). Dynamic Response of Water Retention to Grazing Activity on Grassland Over the Three River Headwaters Region. Agric. Ecosyst. Environ. 286, 106662. doi:10.1016/j.agee.2019.106662
Wang, X., Huang, X., Zhang, X., Yan, Y., Zhou, C., Zhou, J., et al. (2022). Analysis of the Spatio-Temporal Change of Social-Ecological System Coupling: A Case Study in the Qinghai-Tibet Plateau. Glob. Ecol. Conserv. 33, e01973. doi:10.1016/j.gecco.2021.e01973
Wang, X., Zhou, M., Li, T., Ke, Y., and Zhu, B. (2017). Land Use Change Effects on Ecosystem Carbon Budget in the Sichuan Basin of Southwest China: Conversion of Cropland to Forest Ecosystem. Sci. Total Environ. 609, 556–562. doi:10.1016/j.scitotenv.2017.07.167
Wang, Y., and Zhao, T. (2018). Impacts of Urbanization-Related Factors on CO2 Emissions: Evidence from China's Three Regions with Varied Urbanization Levels. Atmos. Pollut. Res. 9, 15–26. doi:10.1016/j.apr.2017.06.002
Wang, Z., Zhang, L., Li, X., Li, Y., Frans, V. F., and Yan, J. (2020). A Network Perspective for Mapping Freshwater Service Flows at the Watershed Scale. Ecosyst. Serv. 45, 101129. doi:10.1016/j.ecoser.2020.101129
Westman, W. E. (1977). How Much Are Nature's Services Worth? Science 197, 960–964. doi:10.1126/science.197.4307.960
Xiong, Q., Xiao, Y., Liang, P., Li, L., Zhang, L., Li, T., et al. (2021). Trends in Climate Change and Human Interventions Indicate Grassland Productivity on the Qinghai-Tibetan Plateau from 1980 to 2015. Ecol. Indic. 129, 108010. doi:10.1016/j.ecolind.2021.108010
Xu, P., Zhao, Y., Chen, H., Duan, X., Chen, F., and Wang, C. (2018). Dynamic Change of Carbon Source/Sink and Carbon Footprint of Farmland Ecosystem in Jiangsu Province. Bull. Soil Water Conservation 38, 238–243.
Yang, H., Wang, X., and Bin, P. (2022). Agriculture Carbon-Emission Reduction and Changing Factors Behind Agricultural Eco-Efficiency Growth in China. J. Clean. Prod. 334, 130193. doi:10.1016/j.jclepro.2021.130193
Yang, L., Dong, L., Zhang, L., He, B., and Zhang, Y. (2019). Quantitative Assessment of Carbon Sequestration Service Supply and Demand and Service Flows: A Case Study of the Yellow River Diversion Project South Line. Resour. Sci. 41, 557–571. doi:10.18402/resci.2019.03.13
Yang, L., Pan, Y., Cao, X., and Long, X. (2012). Ecosystem Services Supply and consumptionA Case in Yellow River Watershed,China. J. Arid Land Resour. Environ. 26, 131–138.
Yang, W., Li, T., and Cao, X. (2015). Examining the Impacts of Socio-Economic Factors, Urban Form and Transportation Development on CO2 Emissions from Transportation in China: A Panel Data Analysis of China's Provinces. Habitat Int. 49, 212–220. doi:10.1016/j.habitatint.2015.05.030
Yapp, G., Walker, J., and Thackway, R. (2010). Linking Vegetation Type and Condition to Ecosystem Goods and Services. Ecol. Complex. 7, 292–301. doi:10.1016/j.ecocom.2010.04.008
Zander, K. K., and Straton, A. (2010). An Economic Assessment of the Value of Tropical River Ecosystem Services: Heterogeneous Preferences Among Aboriginal and Non-Aboriginal Australians. Ecol. Econ. 69, 2417–2426. doi:10.1016/j.ecolecon.2010.07.010
Zank, B., Bagstad, K. J., Voigt, B., and Villa, F. (2016). Modeling the Effects of Urban Expansion on Natural Capital Stocks and Ecosystem Service Flows: A Case Study in the Puget Sound, Washington, USA. Landsc. Urban Plan. 149, 31–42. doi:10.1016/j.landurbplan.2016.01.004
Zhai, T., Zhang, D., and Zhao, C. (2021). How to Optimize Ecological Compensation to Alleviate Environmental Injustice in Different Cities in the Yellow River Basin? A Case of Integrating Ecosystem Service Supply, Demand and Flow. Sustain. Cities Soc. 75, 103341. doi:10.1016/j.scs.2021.103341
Zhang, X., Wang, X., Cheng, C., Liu, S., and Zhou, C. (2021). Ecosystem Service Flows in Karst Area of China Based on the Relationship between Supply and Demand. Acta Ecol. Sin. 41, 3368–3380. doi:10.5846/stxb202005161566
Keywords: Carbon Sequestration, Supply and demand, network model, Spatial flow, Geographical detector
Citation: Wang Q, Liu S, Wang F, Liu H, Liu Y, Yu L, Sun J, Tran L-SP and Dong Y (2022) Quantifying Carbon Sequestration Service Flow Associated with Human Activities Based on Network Model on the Qinghai-Tibetan Plateau. Front. Environ. Sci. 10:900908. doi: 10.3389/fenvs.2022.900908
Received: 21 March 2022; Accepted: 17 May 2022;
Published: 03 June 2022.
Edited by:
Lei Deng, Northwest A&F University, ChinaReviewed by:
Jianjun Cao, Northwest Normal University, ChinaXinzhu Zheng, China University of Petroleum, China
Copyright © 2022 Wang, Liu, Wang, Liu, Liu, Yu, Sun, Tran and Dong. This is an open-access article distributed under the terms of the Creative Commons Attribution License (CC BY). The use, distribution or reproduction in other forums is permitted, provided the original author(s) and the copyright owner(s) are credited and that the original publication in this journal is cited, in accordance with accepted academic practice. No use, distribution or reproduction is permitted which does not comply with these terms.
*Correspondence: Shiliang Liu, c2hpbGlhbmdsaXVAYm51LmVkdS5jbg==