 Chang Li
 Zhili Wang*
 Liqin Zuo
- Nanjing Hydraulic Research Institute, State Key Laboratory of Hydrology-Water Resources and Hydraulic Engineering, Nanjing, China
The water-sediment regulation scheme (WSRS) imposed on dams throughout the Yellow River not only alleviates siltation in the downstream section but also alters the nutrient characteristics, which indirectly affects the enrichment of nutrients in the estuary. Nevertheless, the long-term changes in the nutrient contents and their causes in the lower Yellow River (LYR) remain unclear, and the nutrients characteristics during the years with and without WSRS have yet to be compared. Therefore, the purpose of this study was to explore the variations in the nutrient contents and limitations at the Lijin station on the LYR over the past decade, especially during the annual WSRS period, and to compare the water quality characteristics at Lijin between the years with and without WSRS. The results reveal that WSRS significantly changed the seasonal nutrient concentrations (nitrogen, phosphorus and silicon) at the Lijin station. The fluxes of these nutrients during WSRS (excluding 2016 and 2017) accounted for 11.64–40.63% of the total annual fluxes. The N concentration in the LYR was higher than that in some global rivers, while the concentrations of dissolved inorganic phosphorus (DIP) and dissolved silica (DSi) were lower than the average levels in other rivers. In addition, higher values of dissolved inorganic nitrogen (DIN), DSi and the Redfield ratio indicated that the growth of phytoplankton at the Lijin station was strongly restricted by P. However, during the 2 years without WSRS (2016 and 2017), the proportions of the nutrient fluxes in June were less than 66% of those in the WSRS period in other years. Additionally, there was a potential Si limitation in June in these 2 years. Furthermore, due to the occurrence of floods upstream of the Yellow River and the low-level operation of the Xiaolangdi Reservoir, the fluxes of nutrients during WSRS in 2018 were approximately 0.90–4.20 times those during the same period in 2009–2015 and 6.30–35.76 times those in June 2016 and June 2017. This study shows that WSRS effectively changes the nutrient balance in the LYR and provides a reference for the multi-objective collaborative optimization of WSRS to improve siltation and control flood in the LYR.
1 Introduction
As an important mode of material transport, rivers carry tremendous amounts of sediment and nutrients into the sea, which significantly affects regional biogeochemical cycle (Seitzinger et al., 2010; Ching and Mukherjee, 2015; Bi et al., 2019). Changes in river runoff and sediment concentrations, especially under the influences of human activities, can strongly disturb the temporal and spatial variations of water quality characteristics in both the downstream sections and the estuaries of rivers (Zhang et al., 2004). With the rapid development of the global economy and society in recent years, a large number of reservoirs have been built on most major rivers around the world. While the construction and operation of reservoirs can prevent flooding and drought disasters, allow water resources to be better utilized, and improve the water environment (Zarfl et al., 2015). Dams can also indirectly change the nutrient levels entering the sea by altering the runoff and sediment loads of rivers (Carriquiry et al., 2010). For example, dams can change the concentrations and fluxes of nitrogen (N), phosphorus (P) and silicon (Si), which are important sources of environmental problems such as coastal eutrophication events (Seitzinger et al., 2010; Wu et al., 2017). Consequently, it is meaningful to quantitatively investigate the impacts of reservoir regulation measures on the downstream water quality of dammed rivers.
To date, many studies have examined the impacts of reservoir operations on downstream river environments. For example, damming reduced the flow of the Nile River into the Mediterranean by 90% and sharply decreased the fluxes of N, P and other organic matter into the coastal waters (Maavara et al., 2020). In addition, the concentration of dissolved silica (DSi) in the Danube estuary decreased by more than 60% due to the construction of large reservoirs such as the Iron Gates (Humborg et al., 1997). However, these impacts greatly differ among different rivers because the contributions of various factors to the total nutrient load vary substantially (Vilmin et al., 2018). Hence, targeted measures taken to the same problem on different rivers ultimately have completely different impacts on the downstream water quality, and therefore, the factors affecting the nutrient status should be explored according to the specific characteristics of different basins.
The Yellow River (YR) once had the highest sediment load of any river in the world; at present, the YR continues to face serious water and sediment problems (Milliman and Meade, 1983; Wang et al., 2007). More than 3,000 reservoirs have been built throughout the Yellow River Basin (YRB) since the 1950s (Wang et al., 2015). As a result, the sediment load has fallen by approximately 90% over the past six decades (Wang et al., 2015), resulting in a nearly 10-fold increase in the sediment concentration in the period without water flow in the lower Yellow River (LYR) from 1972 to 1997 and an increase in flood risk due to the rising riverbed (Zhang et al., 2001; Hou et al., 2021). To alleviate siltation in the LYR and guarantee the reservoir’s storage capacity, a water and sediment regulation scheme (WSRS) was first implemented in 2002 by the Yellow River Water Resources Commission (YRCC) via the joint operation of multiple reservoirs (Yu et al., 2013). Every year since 2002, WSRS has been implemented for nearly 20 days between June and July. Although WSRS was discontinued temporarily in 2016 and 2017 owing to low inflow from the upper YR and resumed in 2018 (Chen J. Q. et al., 2019). When WSRS is being enacted, large amounts of water and sediment are transported from the YR to the sea in a short time. Specifically, nearly 30–50% of the annual runoff and sediment load were transported into the Bohai Sea during WSRS (Wang et al., 2017). This engineering measure evidently changes the hydrological conditions and nutrient behaviours throughout the LYR (Xu et al., 2016), including the concentrations and migration of nutrients through runoff and the sediment load. However, even though such extensive alterations of the hydrological regime caused by WSRS inevitably affect the concentrations and fluxes of terrestrial matter entering the sea (e.g., sediment and nutrients) (Yang and Liu, 2007; Li et al., 2009; Liu et al., 2012; Xu et al., 2016), few studies have attempted to quantify the long-term impacts of WSRS. In particular, the responses of the nutrient transport patterns in the LYR have not been examined in depth.
The Lijin (LJ) hydrological station in the LYR is the closest station to the estuary that is not affected by the tide. Therefore, the data from the LJ station are important in reflecting the hydrological processes and water quality characteristics of the LYR. Accordingly, some scholars have investigated the effects of WSRS on nutrient transport in the LYR. For instance, Yao et al. (2009) described the changes in monthly nutrient concentrations and transport based on observations from March 2002 to February 2003. Liu (2015) summarized the response of the nutrient transport mode to WSRS around the Yellow River Estuary (YRE) during 2001–2011. Gong et al. (2015) reported the seasonal variation of nutrients at LJ in the YRB and evaluated the potential nutrient limitation in the LYR during 2002–2004. However, although these studies have shown that the annual nutrient flux from the YR to the Bohai Sea during WSRS accounts for 23–68% of the total flux (Liu, 2015), their conclusions are mostly based on monthly data for some individual years. In contrast, although short-term observations can provide references for changes in nutrient content within a specific period of time or the occurrence of special events, it is difficult to reveal the long-term regularity of changes in nutrient content. Therefore, long-term monthly or daily nutrient content observations/estimations at LJ are particularly important for quantitatively assessing of the impact of WSRS on the water quality of the LYR. In addition, new hydrological conditions emerged during the absence of WSRS during 2016 and 2017 (Chen S. L. et al., 2019). Nevertheless, few comparative studies have examined the changes in and caused of nutrient concentrations in the LYR between the years with and without WSRS.
In this study, long time series of hydrological and nutrient data recorded at the LJ station over the past decade (2009–2018) were collected. The nutrient variations caused by WSRS were investigated quantitatively through these long time series, and a comparative analysis was carried out between the years with and without WSRS. The main objectives of this study were to 1) explore the characteristics and relationship between the nutrient contents and hydrological processes during the WSRS period over the past decade, 2) compare the nutrient contents and nutrient limitations between the years with and without WSRS, and 3) evaluate the nutrient contents and nutrient structure at LJ and compare them with those among other rivers worldwide.
2 Materials and methods
2.1 Study area
The Yellow River is well known worldwide for its high sediment concentration (Meybeck, 1982; Milliman and Meade, 1983). It originates from the Qinghai-Tibet Plateau and stretches a length of approximately 5,464 km before finally flowing into the Bohai Sea, and the area of the YRB is approximately 795,000 km2 (Wang et al., 2007). In general, the LYR with a length of 786 km refers to the reach from Taohuayu in Henan Province to the YRE (Gong et al., 2015). The area of the LYR is nearly 23,000 km2 and is home to a population of more than 1.895 million. Therefore, intensive human activities are an important feature of LYR (Milliman and Saito, 1987). The LJ gauging station is the closest station to the estuary and is not affected by tides and seawater, and thus, this station is a good reference point for estimating the water quality, sediments, and nutrients transported to the estuary (Figure 1). The annual average water discharge and annual average sediment load of the LJ station were 292.8 × 10⁹ m3 (1952–2015) and 6.74×10⁹ t (1952–2015), respectively (YRSB, 2018), both of which are among the highest among rivers globally (Milliman and Meade, 1983; Wu et al., 2017). The maximum and minimum annual water discharges at LJ generally appear in September and April-May, respectively.
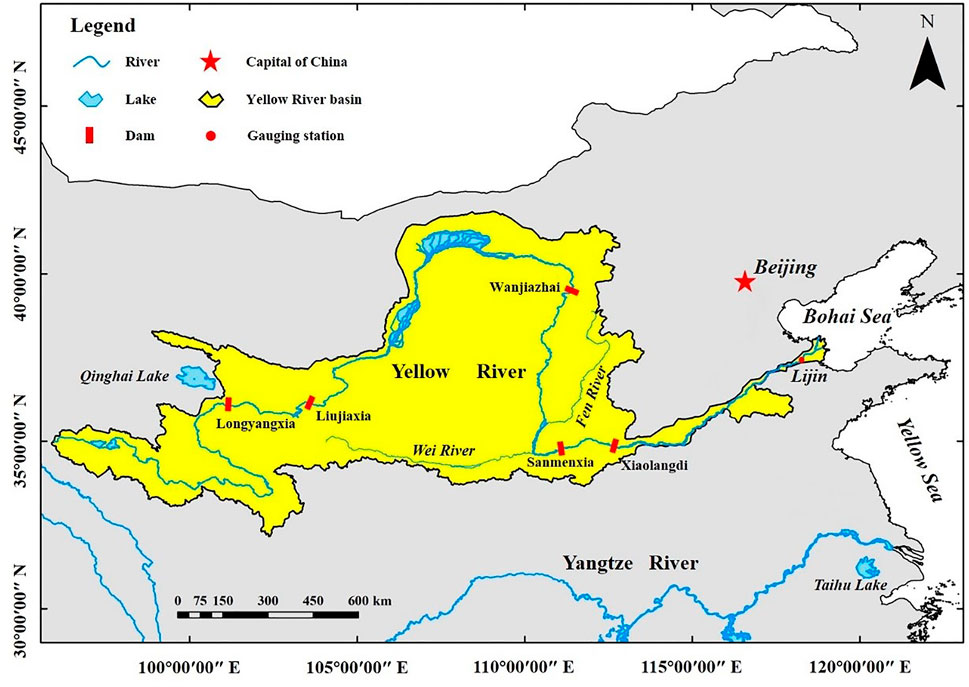
FIGURE 1. Location of the LJ station in the YRB.
In recent decades, great changes have taken place in the YRB, with variations in natural conditions (e.g., precipitation and temperature) and the construction of reservoirs along the YR (Wang et al., 2015). At the LJ station, the average water discharged in the flood seasons reached 749 m3/s since 2000, which was only approximately 31% of the 1950–1985 level (Ji et al., 2020). The annual sediment load also significantly declined from 10.5×10⁸ t/yr before 1985 to 1.13×10⁸ t/yr after 2000 (Ji et al., 2020). In addition, the sediment grain size recorded at the LJ station has displayed an increasing trend since the WSRS was first implemented (Ji et al., 2020).
2.2 Water-sediment regulation scheme
WSRS was designed to adjust the hydrological conditions in the LYR through the joint operation of several upstream reservoirs (Ji et al., 2020). This scheme is complex and can be divided into several different modes (Gong et al., 2015). Based on the water level of the Xiaolangdi Reservoir and the occurrence of floods upstream, the most common measures involve the joint operation of multiple reservoirs and artificial regulations (Liu, 2015). WSRS has been continuously implemented since 2002 except in 2016 and 2017, when the regulations were paused due to significant reductions in the upstream water discharge and sediment load. The water discharge of these 2 years reached 8.175 × 10⁹ m3 and 9 × 10⁹ m3, respectively. The sediment load of these 2 years were 100×106 t and 200×106 t, respectively. WSRS was resumed in 2018. Overall, the water discharge and sediment load during WSRS have accounted for 14–55% (average 23%) and 19–66% (average 39%), respectively, of the corresponding annual total (Table. 1).

TABLE 1. Historical hydrological data during the WSRS.
The implementation of WSRS in 2015 is described as an example. By June 2015, the reservoirs on the mainstream (including the Sanmenxia, Wanjiazhai, and Xiaolangdi Reservoirs) stored enough water to satisfy the conditions required by the WSRS before flood season. The implementation of WSRS in 2015 was divided into a draining stage and a desilting stage. During the first stage, the Xiaolangdi Reservoir released large amounts of clear water. During the second stage, water with a high sediment concentration was discharged from the Xiaolangdi Reservoir through the joint operation of the Sanmenxia Reservoir and the Wanjiazhai Reservoir (Wang et al., 2015). WSRS extended this high-discharge period by loading more water and sediment to the YRE in a short time, thus changing the seasonal patterns of the hydrological conditions downstream (Liu et al., 2012). In addition, water contaminated by both point sources (e.g., industrial wastes and domestic sewage) and nonpoint sources also increase the downstream nutrient concentrations.
2.3 Data sources and statistical methods
Hydrologic data (daily runoff and sediment load) and nutrient concentrations data were used in this research. The hydrological data before 2009 and during 2009–2018 were obtained from a paper published by Wang et al. (2015) and the Hydrological Yearbook. Nutrient data collected during 2009–2018 at the LJ station were obtained from the Shandong Provincial Environmental Protection Department.
The following equation was used to be calculate the nutrient fluxes at the LJ station:
where F (g) is the flux of nutrient; C (g/m3) is the concentration of nutrient; and Q is the water discharge (m3/s).
The Mann-Kendall trend test (MK; Mann, 1945; Kendall, 1975) is a nonparametric statistical method and has been widely used to analyse the trends in hydrological and meteorological time series (Wang et al., 2015; Wang and Sun, 2021). Linear fitting and MK test methods were used to explore the temporal variations and trend analysis of nutrient contents from 2009 to 2018. The statistic S and standardized test value Z of the MK test are calculated following Zuo et al. (2014). If the value of Z is greater than or equal to 2.56, the trend is significant at the significance of 0.01; if the value of Z is greater than or equal to 1.96, the trend is significant at the significance of 0.05. Besides, the Kendall slope β is generally jointed with the MK test to explain the change in long-term series. A positive value of β indicates an upward trend, whereas a negative value represents a downward trend.
In addition, Pearson’s coefficient was introduced to test for correlations between the hydrological data and nutrient data using SPSS 13.0 software.
3 Results
3.1 Variations in water discharge and sediment supply
The annual water discharge and sediment load at the LJ station have gradually declined over the past 60 years, approximately consistent with the completion time of five reservoirs (Figure 2). This trend has been particularly obvious since 1968, when the Liujiaxia Reservoir began to operate. The annual water discharge and sediment load decreased by 176.22 × 10⁸ m3 and 1.40×10⁸ t in 2002–2018, which corresponded to 36.33 and 10.48% of the 1950s levels, respectively. It should be mentioned that after 2002, the annual water discharge exceeded 100 × 108 m3 in most years due to WSRS (excluding 2016 and 2017). However, the annual water discharge and sediment load were 81.75 × 10⁸ m3 and 0.11×10⁸ t in 2016, respectively. They were 91.33 × 10⁸ m3 and 0.08×10⁸ t in 2017, respectively. They were all lower than the values in the years when WSRS was implemented since 2002. Subsequently, after the resumption of WSRS in 2018, the annual levels of water and sediment discharged into the Bohai Sea increased to 334.12 × 10⁸ m3 and 0.29×10⁸ t, respectively. In general, the average annual water discharge and sediment load in the years with WSRS (2002–2015 and 2018) were about 32.15 and 257.63 times higher than those in the years without WSRS (2016 and 2017), respectively (Figure 2).
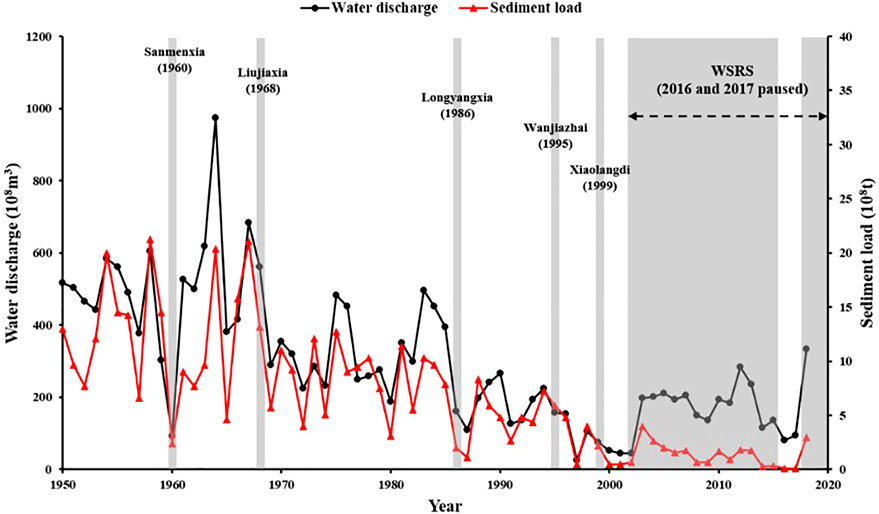
FIGURE 2. Annual levels of water and sediment discharged at the LJ station from 1950 to 2018. Grey shadow bars represent the year of each reservoir construction and the years of implementation of WSRS in the YRB since 2002.
Figure 3A shows the daily water discharge and sediment load at the LJ station from 2009 to 2018. Water and sediment transport showed obvious seasonal changes, and the process of sediment transport was generally consistent with water discharge trend. Water discharge increased during the flood reason (July to November) in the YRB. Notably, before the WSRS was paused in 2016, the maximum monthly water discharge exceeded 1,500 × 108 m3 in 2012, especially in July (almost 2,000 × 108 m3) (Figure 3B). After the resumption of WSRS in 2018, this high water discharge level lasted almost the entire flood season, reaching 2,512.26 × 108 m3 in November (Figure 3B). The same phenomenon also appeared for the sediment loading (Figure 3C).
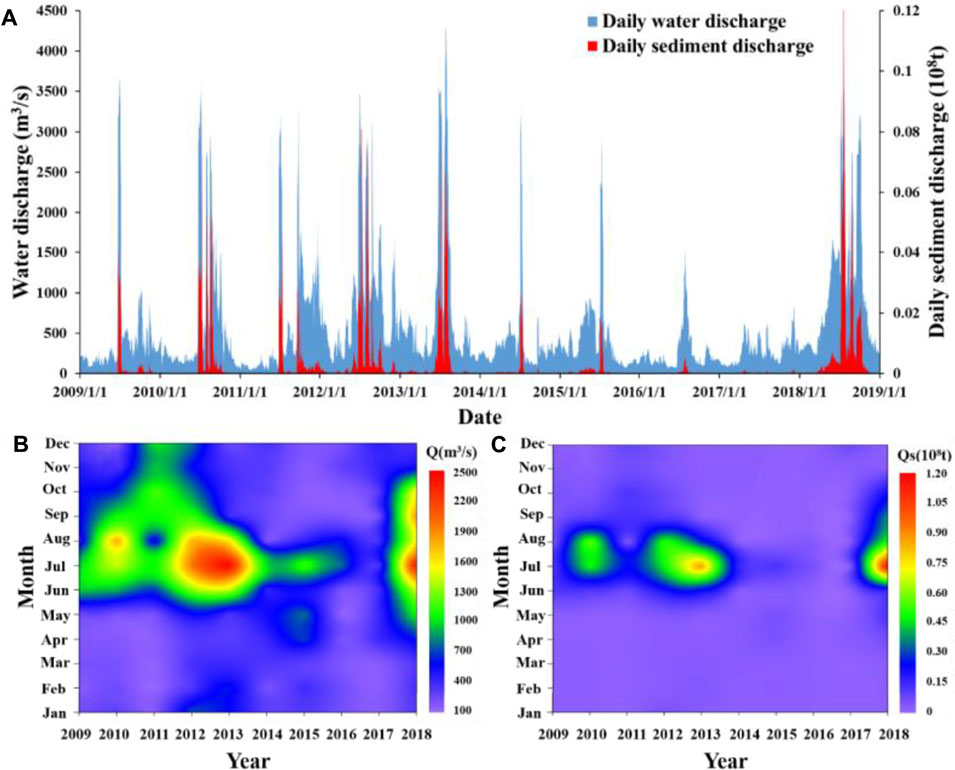
FIGURE 3. (A) Daily runoff and sediment load and (B) monthly runoff and (C) monthly sediment load at the LJ station during 2009–2018.
3.2 Nutrient variation at the lijin station
Higher N and DSi contents but lower P levels are the main features at the LJ station (Figure 4). The concentrations of dissolved organic nitrogen (DON) were higher during flood season (July to October), but the concentrations of total nitrogen (TN) and dissolved inorganic nitrogen (DIN) were higher during the non-flood season (November to June) (Figures 4C,F). However, the monthly concentrations of TN and DIN in this study decreased linearly by approximately 4 × 10⁻⁴ mg/L and 2 × 10⁻⁴ mg/L, respectively, from 2009 to 2018; in contrast, the monthly DON concentration increased from 2009 to 2018 at a rate of approximately 7 × 10⁻⁶ mg L−1·month−1 (Figures 4A,F).
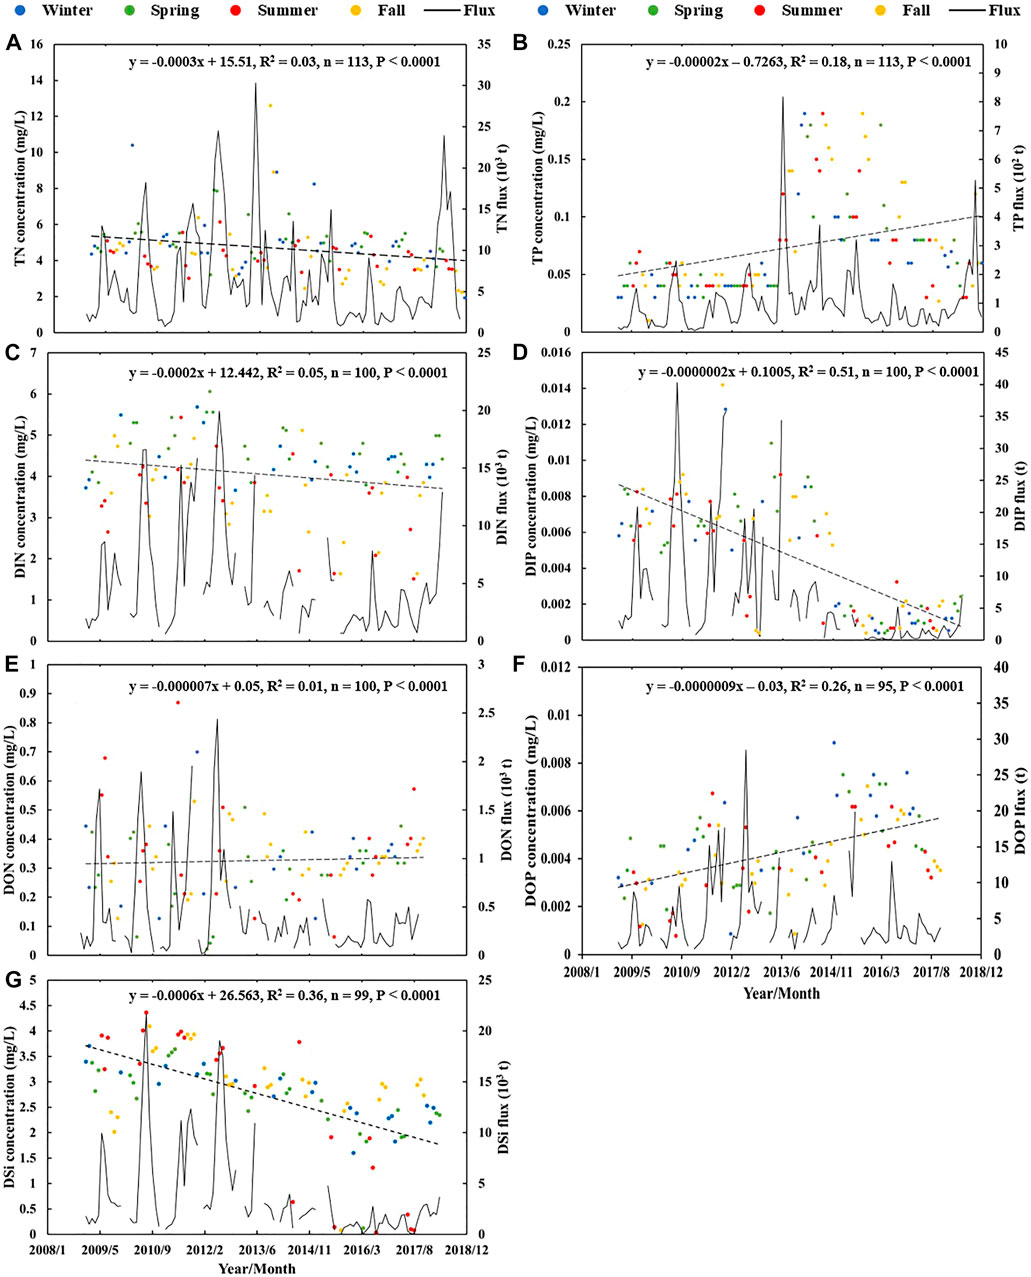
FIGURE 4. Monthly N concentrations and fluxes (A,C,E); P concentrations and fluxes (B,D,F), and DSi concentrations (G) at the LJ station during 2009–2018. Winter: December to February; Spring: March to May; Summer: June to August; Fall: September to November.
Figure 4 shows that the concentrations of total phosphorous (TP), dissolved inorganic phosphorous (DIP) and dissolved organic phosphorus (DOP) were 0.01–0.19 mg/L, 0.0004–0.014 mg/L and 0.0009–0.0070 mg/L, respectively. DIP concentrations were higher in the flood season, while DOP concentrations were higher in the non-flood season. The observed change in the DIP concentration is consistent with that reported by Ma et al. (2015). However, relatively few studies have examined the long-term variation in the DOP concentration at the LJ station (Chen et al., 2013; Liu, 2015). The concentration of DIP decreased linearly during the study period, and this trend was particularly pronounced before 2014 (Figure 4D).
The monthly concentrations of DSi was 0–4.36 mg/L and declined linearly at a rate of 6 × 10⁻⁴ mg L−1·month−1 (Figure 4E). The long-term variation in DSi was similar to the trends presented by Ran et al. (2015) and Ma et al. (2015). Before 2014, DSi concentrations were highest in summer; however, this changed significantly after 2014, after which the highest values occurred in fall. In fact, several extremely low concentrations were observed in the summers (June to August) of 2014–2017.
Nine events marked by particularly low nutrient concentration were occurred from 2014 to 2017 (Figure 4). Six of these events occurred in the summers of 2016–2017, specifically in May, August and September 2016 and July, August and September 2017. The concentrations of DIN, DIP, and DSi during these events were 1.47 ± 0.04 mg/L, 0.00045 ± 0.00015 mg/L, and 0.01 ± 0.006 mg/L, respectively, which accounted for 36, 9.6 and 0.5%, respectively, of the corresponding average from 2009 to 2018.
3.3 Nutrient limitation at lijin station
The diagram in Figure 5 illustrates the nutrient limitations at the LJ station from 2009 to 2018; this diagram indicates the dominant roles played by different nutrients in phytoplankton growth according to the Redfield ratio (Redfield, 1958). From 2009 to 2018, the ranges of DSi/DIP, DIN/DIP and DSi/DIN were 6.79–3,911.74, 369.23–12,666.65, and 0.0099–1.11, respectively. Their average values were 654.53, 2,161.84, and 0.35, respectively. These values showed that the growth of phytoplankton at LJ was strongly restricted by P but simultaneously was not restricted obviously by either N or Si. In addition, significant seasonal variations occurred in 2016 and 2017, during which WSRS was not implemented. The DIN/DIP ratios in the summers of 2016 and 2017 (black dotted circles) were similar to those in the other seasons (red dotted circles), but the DSi/DIP and DSi/DIN ratios were lower in the summers than in the other seasons (Figure 6). This suggested that the summers of these 2 years may have approached the Si limitation.
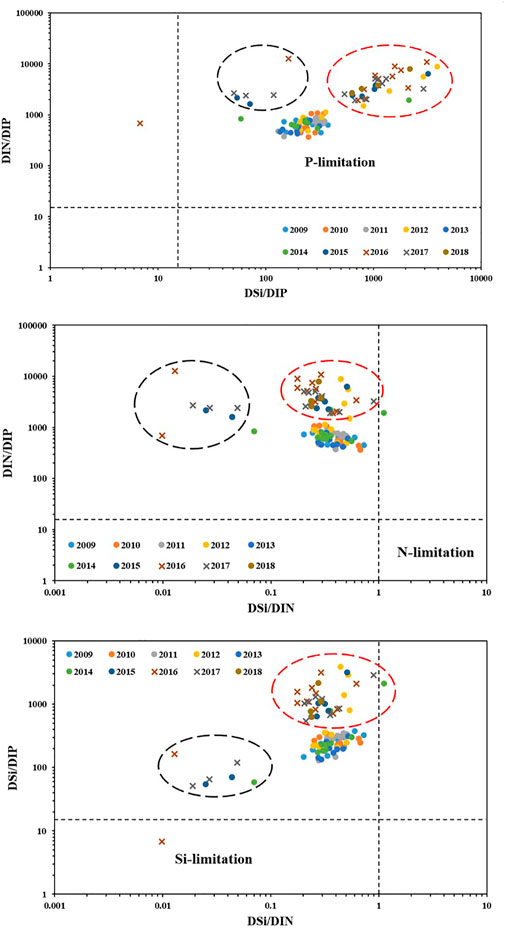
FIGURE 5. Nutrient limitation based on the Redfield ratio from 2009 to 2018 at LJ. Dotted lines mark the Redfield ratio of potential nutrient limitations (Si:N:P of 16:16:1). Black dotted circles indicate the summers of 2016 and 2017, and red dotted circles indicate the other seasons of 2016 and 2017.
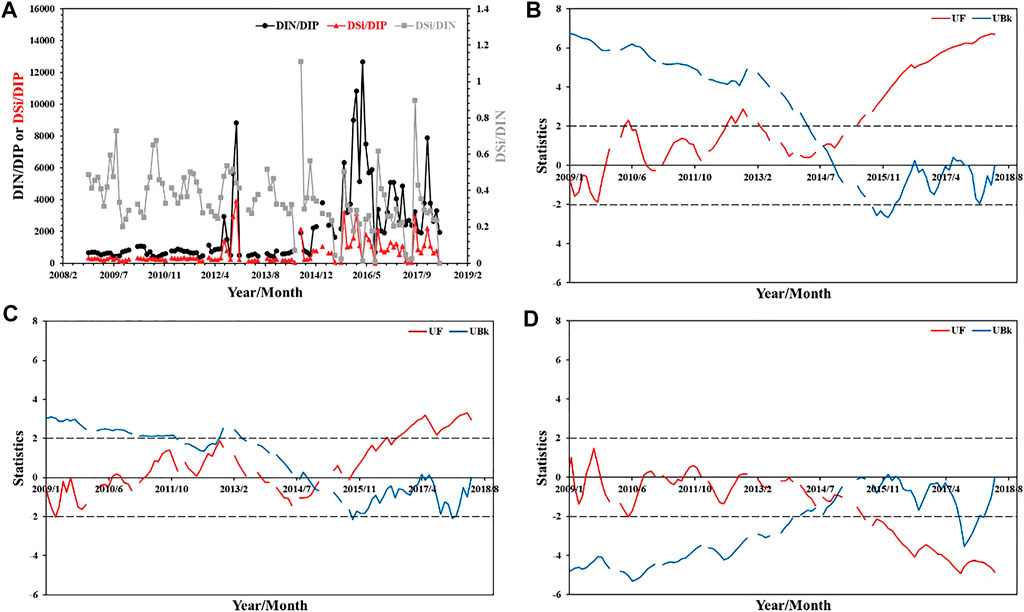
FIGURE 6. (A) Temporal variations in the dissolved nutrient ratios at LJ from 2009 to 2018. Mann-Kendall tests for (B) DIN/DIP, (C) DSi/DIP and (D) DSi/DIN. The dotted lines in (B)–(D) represent the significant level of 0.05.
The temporal variation characteristics of the above nutrient concentration ratios are not easily observed in Figure 6. In particular, three dissolved nutrient ratios exhibited strong discharge-related periodicities (Figure 6A). Both DIN/DIP and DSi/DIP generally peaked from March to April each year, while DSi/DIN usually peaked from July to August (Figure 6A). DSi/DIN peaked in August or September from 2009 to 2018, when the discharge rates were high. In general, DIN/DIP and DSi/DIP have increased substantially since 2016, and DIN/DIP even exceeded 12,000 in April 2016. In contrast, the trend of DSi/DIN was clearly opposite of those of the other two ratios after January 2016 (Figure 6A).
In addition, the mutations of these three ratios were analysed with the MK test (Figures 6B–D). DIN/DIP showed an increasing trend after November 2009, but this trend was not significant before September 2014, except in individual months (e.g., April to May 2010 and July to December 2012) (Figure 6B). The growth trend mutated in September 2014, and thereafter, growth increased significantly after May 2015 (Figure 6B). DSi/DIP showed a decreasing trend before March 2011 but increased from April 2011 to June 2013 and then declined again until December 2014. However, a deviation occurred in December 2014, followed by an increase after March 2015 and a significant increase after September 2016 (Figure 6C). As with DIN/DIP, DSi/DIN fluctuated before November 2014. Notably, the DSi/DIN mutation occurred in November 2014, and DSi/DIN showed a significant decreasing trend after July 2015 (Figure 6D).
4 Discussion
4.1 Effects of water-sediment regulation scheme on nutrient variations
This study explored the Pearson correlation between water-sediment and nutrients at the LJ station (Table 2). Significant positive correlations were found between the nutrient fluxes and water discharge, which is consistent with the outcomes of a previous study (Gong et al., 2015). Furthermore, the monthly fluxes of nutrients and water discharge exhibited significant linear correlations, as shown in Figure 7. Based on these results, daily water discharge data were employed to estimate the daily nutrient fluxes. Furthermore, the proportions of the nutrient load during the annual implementation of WSRS were calculated (Figure 8). The water discharge and nutrient load during WSRS accounted for 14.42–36.25% and 11.64–40.31%, respectively, of the annual values (excluding 2016 and 2017). The proportion of the nutrient load during the 2010 WSRS period was higher than that in other years, which was related to the WSRS period being longer (47 days) in 2010 (Table 1). Observations made in 2001 could serve as a reference for the period before the initial implementation of WSRS in 2002. Previous studies calculated the monthly fluxes in June and July 2001, namely, the months when WSRS was frequently implemented after 2002. The results showed that the monthly water discharge accounted for only 6% of the total, and the proportions of the dissolved nutrient fluxes were similar (Liu, 2015). In addition, the water discharges in June during 1950–1968, 1969–1985 and 1986–1996 accounted for only 2.5–5.0% of the annual values (Liu, 2015). Therefore, the transport patterns of dissolved nutrients rely mainly on water discharge.
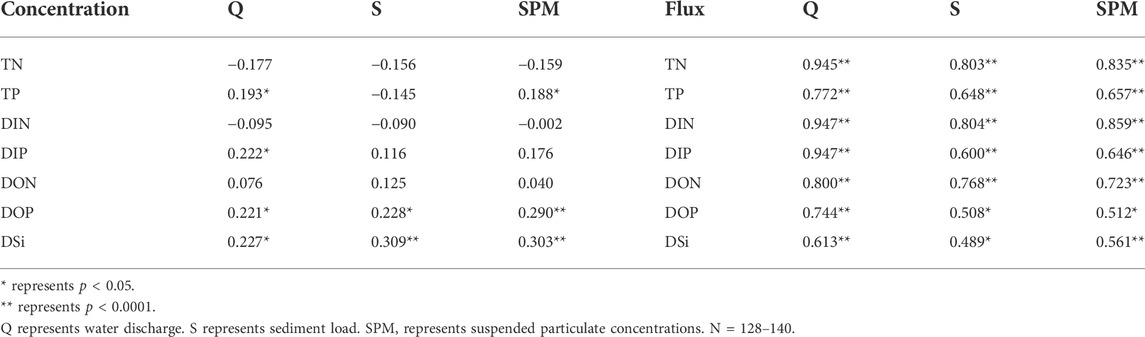
TABLE 2. Correlations between the monthly water discharge (m3), sediment load (t), nutrient concentrations (mg/L) and nutrient fluxes (t) at LJ from 2009 to 2018.
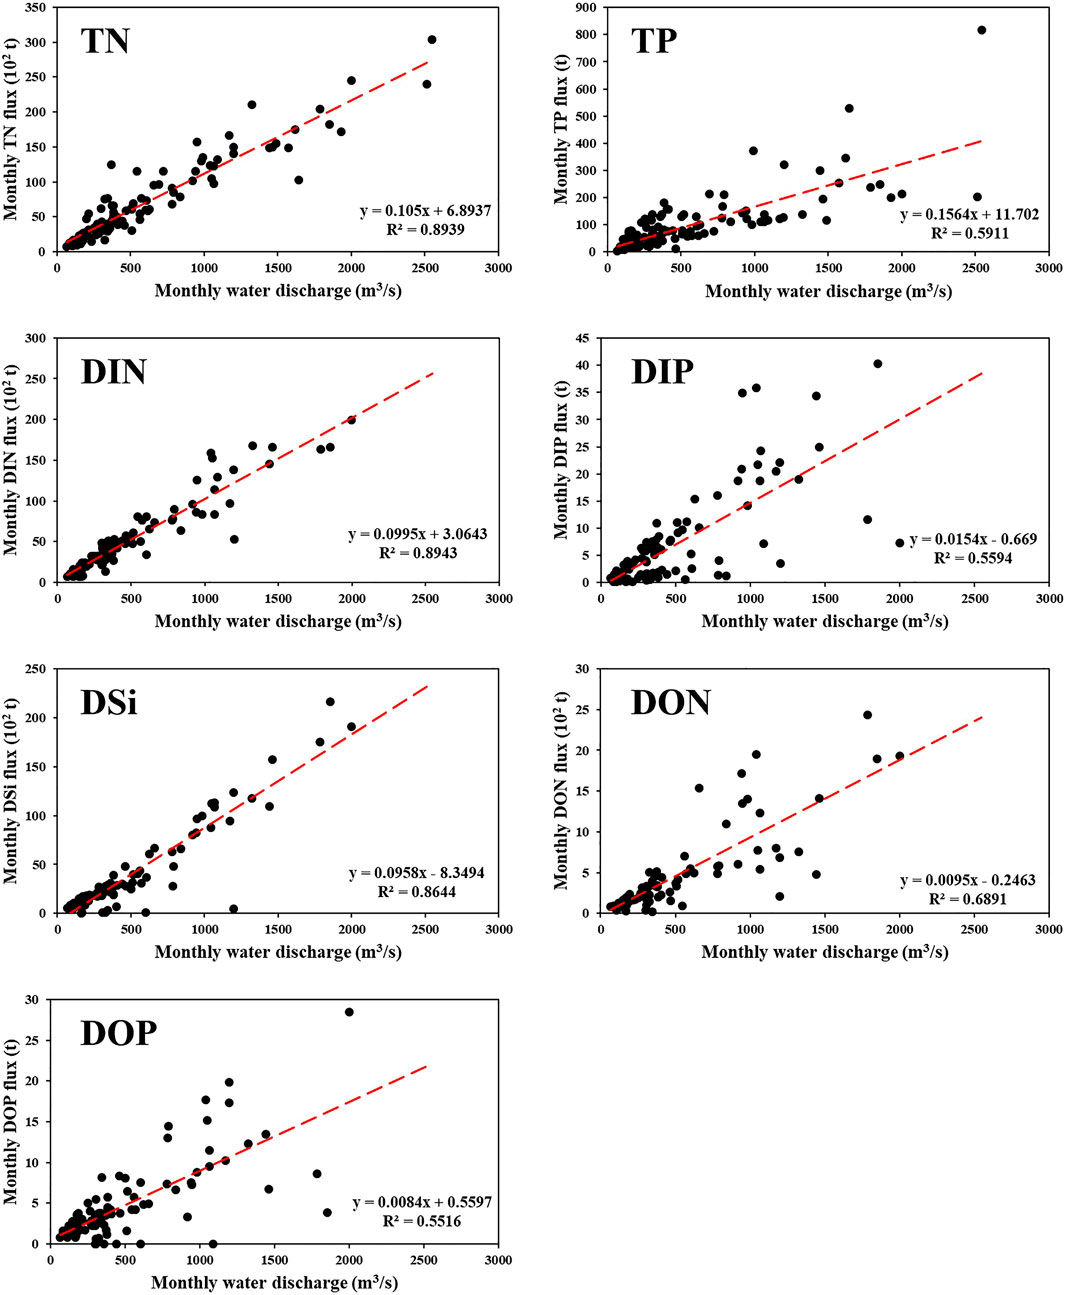
FIGURE 7. Correlations between monthly nutrient fluxes and monthly water discharge.
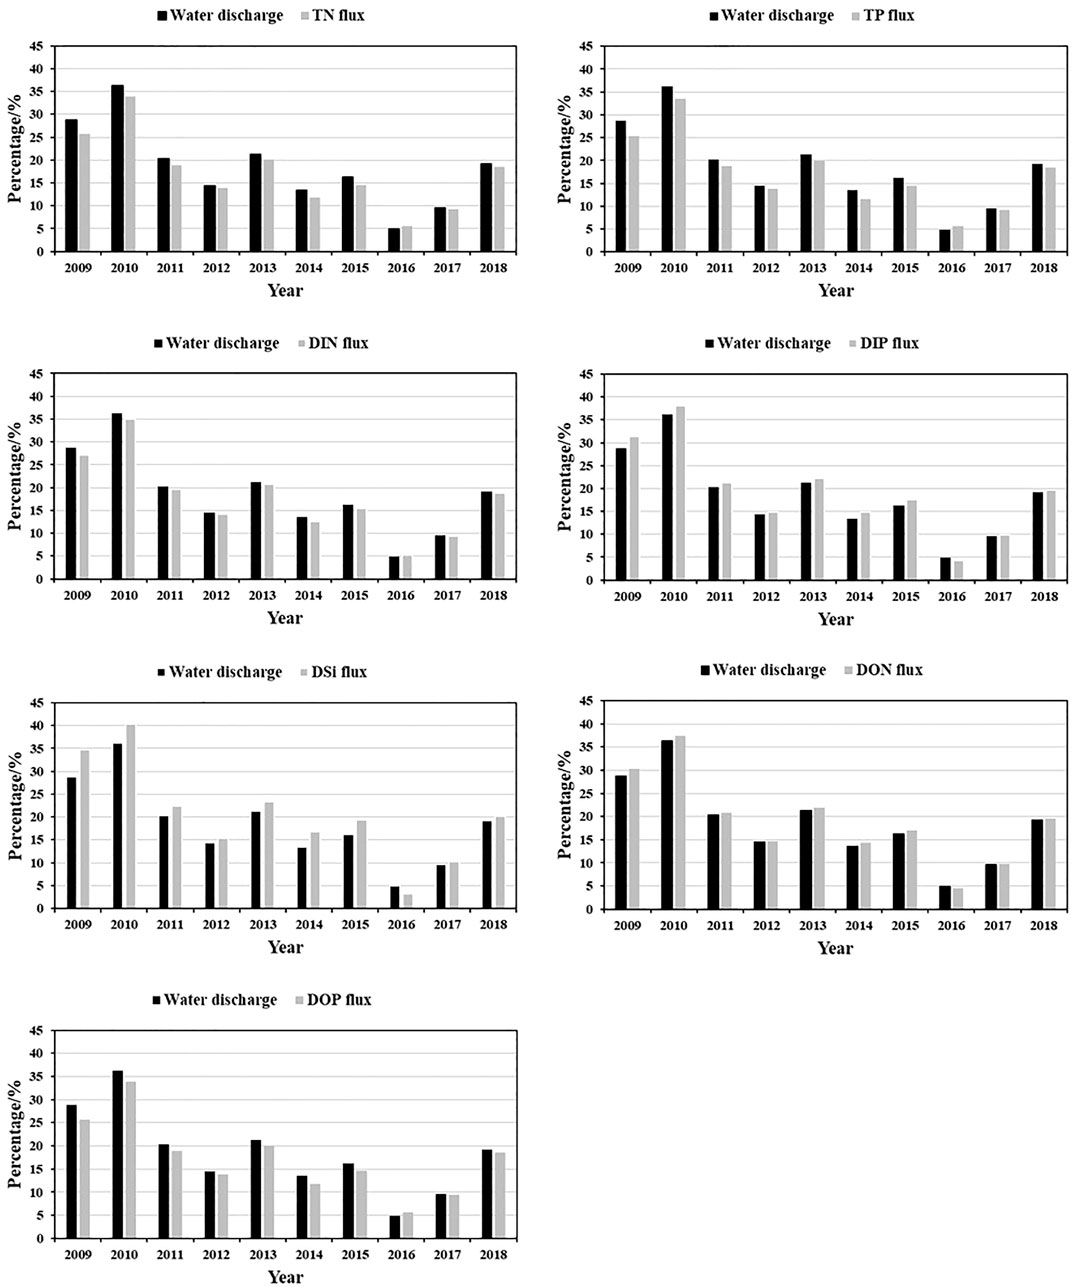
FIGURE 8. Proportions of water discharge and nutrient fluxes during WSRS compared to the whole year (the ratios in 2016 and 2017 are the values in June).
The average time for WSRS was 21 days since this engineering regulation was implemented in 2002 (Table 1). However, WSRS was discontinued in 2016 and 2017 owing to low inflow, and no flood events occurred in the upper reaches of the YR (Chen S. L. et al., 2019). Because WSRS was usually executed in June or July of each year (Table 1), the proportions of the nutrient fluxes in June 2016 and June 2017 were compared with those during WSRS in other years (Figure 8). The proportions of water discharge in June of 2016 and 2017 were 4.92 and 9.50%, respectively, which were lower than the average values during the WSRS periods from 2009 to 2018. Similarly, the proportions of the nutrient fluxes in June of the 2 years without WSRS were lower than 10%, which were also lower than those during the WSRS in other years. In addition, some studies have revealed a trend from siltation to erosion in the LYR after the continuous implementation of WSRS from 2002 to 2015 (Chen J. Q. et al., 2019; Ji et al., 2020). However, considering the impact of WSRS on the water quality of the LYR, although the annual WSRS is implemented for approximately 20 days, the fluxes of nutrients are still heavily dependent on WSRS.
In addition, two floods occurred in the upstream region of the YR in July 2018, and the water discharge at the Tongguan hydrological station reached 265.7 × 10⁸ m3, 48.1% higher than the long-term average. Therefore, WSRS was re-implemented in 2018, and the Xiaolangdi Reservoir implemented a low water level scheduling mode in advance, with the lowest water level dropping to 213.03 m (Figure 9). This situation made the water discharge and sediment load of LJ increase rapidly in the short term. The proportion of water discharge at the LJ station during WSRS in 2018 accounted for approximately 19.20% of the total, and the proportions of the nutrient loads were all close to 20% (Figure 8). Specifically, the fluxes of nutrients during WSRS in 2018 were approximately 0.90–4.20 times higher than those during 2009–2015. Moreover, the fluxes of nutrients during WSRS in 2018 (28 days) were approximately 6.30–35.76 times higher than those in June 2016 and June 2017. This shows that although WSRS was implemented for only 14 days in 2018 after a 2-year interruption, the proportions of the nutrient fluxes during WSRS still reached the pre-2016 levels. Moreover, these findings indicated that the nutrient fluxes were most concentrated during WSRS throughout each year and that the seasonal characteristics of the nutrient loads in the LYR changed as a result of WSRS in 1 year.
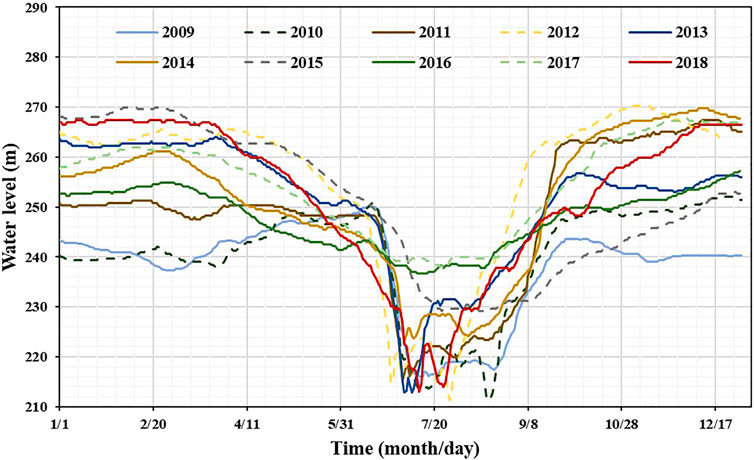
FIGURE 9. Water level of the Xiaolangdi Reservoir from 2009 to 2018.
4.2 Effects of water-sediment regulation scheme on nutrient limitations
Numerous studies have shown that eutrophication is closely related to nutrient contents and their ratios in water (Redfield, 1958; Wang et al., 2003; Jiang et al., 2010). DIN and DIP are the main indicators of the nutrient levels in waters (Smith et al., 2003). For instance, it has been reported that phytoplankton growth is limited when DIP is lower than 1.5 × 10⁻³ mg/L (Nelson and Brzezinski, 1990). Moreover, some studies have shown that the levels of biogenic elements at the LJ station have seriously deviated from the Redfield ratio (N:P:Si = 16:1:16) over the past two decades (Yao et al., 2009; Liu, 2015). In this study, high concentrations of N and DSi compared to P indicated that the nutrient ratios at LJ showed high DIN/DIP and DSi/DIP but low DSi/DIN (Figure 4). This nutrient imbalance limits the growth of phytoplankton in the LYR due to limited P, which is consistent with the results of previous studies (Chen et al., 2013; Gong et al., 2015; Liu, 2015).
As mentioned above, the fluxes of nutrients during WSRS can account for more than 25.98% of the total annual flux (Figure 8), which is consistent with the conclusions of previous studies (Yao et al., 2009; Chen et al., 2013; Liu, 2015). However, there are different views on the impacts of WSRS on the nutrient structure in the LYR. Based on observations acquired in the LYR during WSRS from 2009 to 2011, Chen et al. (2013) found that the concentrations of DSi and P increased significantly, but the concentration of DIN decreased, which made DSi/DIP and DSi/DIN increase, while DIN/DIP was significantly lower. This result shows that WSRS can change the state of this serious nutrient imbalance in the short term, but the P limitation remains prominent. Similarly, Sun et al. (2019) indicated that WSRS could alleviate the imbalance of nutrient proportions in the YRE to a certain extent based on observations from 2013. In contrast, Wang et al. (2021) found that DIN/DIP (2,492.1) and DSi/DIN (1.2) were significantly higher during WSRS than during other times of the year in the YRE in 2015, suggesting that WSRS aggravates imbalances in the nutrient proportions in the LYR. Furthermore, Dortch and Packard (1989) and Justic et al. (1995) indicated that the growth of phytoplankton could be absolutely limited when the concentrations of DSi, DIN and DIP were lower than 0.056 mg/L, 0.014 mg/L and 0.0015 mg/L, respectively.
A relative P limitation exists when DSi/DIP > 22 and DIN/DIP > 22, a relative N limitation exists when DIN/DIP < 10 and DSi/DIN > 1, and a relative Si limitation exists when DSi/DIP < 10 and DSi/DIN < 1 (Dortch and Packard, 1989; Justic et al., 1995). According to this standard, the situation during the study period was classified. Except for the relative Si limitation that occurred from June to August 2016, the other months were characterized by relative P limitations. This phenomenon can also be seen in Figure 6, in which the nutrient ratios in the summers of 2016 and 2017 are plotted as dotted black circles. This figure shows that the flood season in the years without WSRS led to an increase in the DIP content, but the concentration of DSi decreased. Thus, there may have been a potential Si limitation during the flood season in the years not regulated by WSRS. Overall, the impacts of WSRS on the nutrient structure of the LYR varied among different years.
4.3 Comparison of the nutrient status between lijin and some major global rivers
The average nutrient concentrations at LJ differed considerably from those in some other global rivers (Table 3). The average concentration of N at LJ from 2009 to 2018 was twice that in some European rivers and was also higher than that in other major Chinese rivers. In addition, the average concentration of N at LJ in the study period was slightly higher than that in 2002–2004 (4.39 mg/L) and was more than 40 times higher than that in some unpolluted rivers around the world (Meybeck, 1982). In contrast, the average concentration of TP at LJ was slightly higher than that in the Yangtze River and Pearl River, but lower than that in the Rhine River. However, the average concentration of DIP at LJ was almost half of that in other Chinese rivers and far below those in rivers throughout Europe and North America. The absorption of DIP onto the high sediment load of the YR may be a main factor affecting the low DIP concentrations relative to DIN (Gong et al., 2015). The average concentration of DSi of 2.69 mg/L at LJ in this study was lower than the average value of 2002–2004 (Yao et al., 2009; Gong et al., 2015) and slightly lower than the concentrations in the Yangtze River and Pearl River but close to the average levels in the Rhine River and Rhône River in Europe (Table 3). The relatively low concentration of DSi at LJ may be attributable to chemical weathering, mechanical erosion, or the strong evaporation of the YR (Li and Zhang 2003; Cai et al., 2008; Liu et al., 2009).
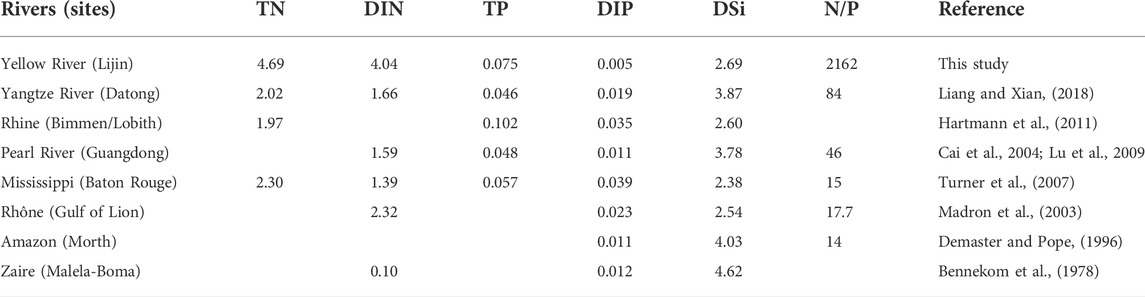
TABLE 3. Nutrient concentrations in some rivers worldwide (mg/L).
LJ displayed a much higher value of the N/P ratio than other rivers worldwide, with the N/P ratio reaching more than approximately 61 times the average in some rivers (Table 3). In addition, the average N/P at LJ from 2009 to 2018 was approximately twice the average for 2002–2004 (1,003) (Gong et al., 2015). This higher N/P was mainly due to the higher concentration of dissolved N, whereas the average concentrations of dissolved P at LJ were similar to those in some other global rivers. The estimated value of N/P input to the YR from fertilizer was higher than 44.6, which was also higher than the average level of fertilizer used in China (Liu et al., 2003). This is another important factor that causes the N/P of the LYR to be much higher than those of the Yangtze River and Pearl River.
5 Conclusion
Due to the implementation of WSRS, the water discharge and sediment load peaked at least 2 months ahead of the years in which WSRS was not implemented. The average water-sediment budgets during 2002–2018 corresponded to 36.33 and 10.48%, respectively, of the levels in the 1950s. From 2009 to 2018, the main characteristics of the monthly nutrient concentrations at the LJ station were high N, high DSi and low p values. The nutrient transport patterns were highly dependent on water discharge. WSRS led to significant short-term increases in the water-sediment budgets and nutrient fluxes at the LJ station. WSRS also changed the seasonal patterns of nutrient transport in the LYR. The annual average water discharge and the fluxes of nutrients during WSRS were almost 14.42–36.25% and 11.64–40.31%, respectively, of the annual values from 2009 to 2018 (excluding 2016 and 2017). The proportions of the nutrient fluxes in June of the 2 years (2016 and 2017) without WSRS (<10%) were higher than those during the WSRS period in other years. The fluxes of nutrients seen during the WSRS in 2018 were 0.90–4.20 times higher than those in 2009–2015, close to the 2010 levels, and 6.30–35.76 times higher than those in June 2016 and June 2017. This was primarily caused by scheduling the low water level operation mode at the Xiaolangdi Reservoir in 2018 because two floods occurred upstream of the YR in July 2018. Higher DIN and DSi concentrations and Redfield ratios showed that the LJ station was obviously P-limited during 2009–2018 (excluding 2016 and 2017). However, there were higher P levels and higher concentrations of DIN and DSi in the years without WSRS, which caused a potential Si limitation during the flood season. In addition, the value of N/P at LJ exceeded 61 times the average level in some other global rivers. This was mainly due to the high N/P ratio of agricultural water entering the YR.
In general, the implementation of WSRS can result in the transport of large amounts of water, sediment and nutrients to the LYR in a short time each year. WSRS also significantly changed the seasonal characteristics of nutrients in the LYR. Although WSRS can, in most years, alter the nutrient imbalance in the LYR, the opposite trend emerged in some individual years. Therefore, in the future, more daily nutrient observations could be conducted before, during, and after WSRS to better explore the mechanism by which WSRS influences the nutrient structure in the LYR.
Data availability statement
The original contributions presented in the study are included in the article/supplementary material, further inquiries can be directed to the corresponding authors.
Author contributions
CL: Drafting the manuscript, Methodology, Analysis data, Editing. ZW: Supervision, Reviewing and Editing. HL: Reviewing and Editing. LZ: Supervision. YL: Reviewing. PW: Editing, Supervision. YJL: Supervision, Reviewing and Editing.
Funding
This work has been financially supported by the National Key Research and Development Program of China (2018YFC1407601) (co-author: ZW), National Natural Science Foundation of China (Grants: 5217110695, 52071221) (co-authors: ZW and LZ), Natural Science Foundation of Jiangsu Province (BK20191130) (co-author: PW) and Special Funds for Basic Scientific Research Business Expenses of Central Public Welfare Scientific Research Institutes of China (Y221010) (co-author: LZ). National Natural Science Foundation of China Key Joint Fund (U2040219; U2240207) (co-author: YJL).
Conflict of interest
The authors declare that the research was conducted in the absence of any commercial or financial relationships that could be construed as a potential conflict of interest.
Publisher’s note
All claims expressed in this article are solely those of the authors and do not necessarily represent those of their affiliated organizations, or those of the publisher, the editors and the reviewers. Any product that may be evaluated in this article, or claim that may be made by its manufacturer, is not guaranteed or endorsed by the publisher.
Acknowledgments
The constructive suggestions of the editors and anonymous reviewers are gratefully acknowledged.
References
Bennekom, A. J. V., Berger, G. W., Helder, W., and Vries, R. T. P. D. (1978). Nutrient distribution in the Zaire estuary and river plume. Neth. J. Sea Res. 12 (3-4), 296–323. doi:10.1016/0077-7579(78)90033-9
Bi, N., Sun, Z., Wang, H., Wu, X., Fan, Y., Xu, C., et al. (2019). Response of channel scouring and deposition to the regulation of large reservoirs: A case study of the lower reaches of the Yellow River (huanghe). J. Hydrology 568, 972–984. doi:10.1016/j.jhydrol.2018.11.039
Cai, W., Dai, M., Wang, Y., Zhai, W., Huang, T., Chen, S., et al. (2004). The biogeochemistry of inorganic carbon and nutrients in the Pearl River estuary and the adjacent Northern South China Sea. Cont. Shelf Res. 24 (12), 1301–1319. doi:10.1016/j/csr.2004.04.00510.1016/j.csr.2004.04.005
Cai, W. J., Guo, X., Chen, C. T. A., Dai, M., Zhang, L., Zhai, W., et al. (2008). A comparative overview of weathering intensity and HCO3− flux in the world's major rivers with emphasis on the Changjiang, Huanghe, Zhujiang (Pearl) and Mississippi Rivers. Cont. Shelf Res. 28 (12), 1538–1549. doi:10.1016/j.csr.2007.10.014
Carriquiry, J. D., Villaescusa, J. A., Camacho-Ibar, V., Walter Daesslé, L., and Castro-Castro, P. G. (2010). The effects of damming on the materials flux in the Colorado River delta. Environ. Earth Sci. 62, 1407–1418. doi:10.1007/s12665-010-0626-z
Chen, P., Liu, S., Zhang, G., Lingwei, L. I., Peipei, G. U., and Cao, X. (2013). Monthly variation of nutrient concentrations and fluxes in the lower huanghe river: Under the influence of artificial floods. Acta Oceanol. Sin. 35, 59–71. (in China).
Chen, J. Q., Fan, Y. Y., Wu, W. J., Gao, J., and Li, X. J. (2019a). Evolution characteristics of the Yellow River estuary after interruption of the Yellow River water and sediment regulation in 2016-2017. Yellow River 41 (08), 6–10. (in China). doi:10.3969/j.issn.1000-1379.2019.08.002
Chen, S. L., Gu, S., Ji, H. Y., and Xu, C. L. (2019b). Process of the Yellow River Mouth on new water and sediment condition. J. Sediment. Res. 44 (5), 61–67. (in China). doi:10.16239/j.cnki.0468-155x.2019.05.010
Ching, L., and Mukherjee, M. (2015). Managing the socio-ecology of very large rivers: Collective choice rules in IWRM narratives. Glob. Environ. Change 34, 172–184. doi:10.1016/j.gloenvcha.2015.06.012
Demaster, D. J., and Pope, R. H. (1996). Nutrient dynamics in amazon shelf waters: Results from AMASSEDS. Cont. Shelf Res. 16 (16), 263–289. doi:10.1016/0278-4343(95)00008-o
Dortch, Q., and Packard, T. T. (1989). Differences in biomass structure between oligotrophic and eutrophic marine ecosystems. Deep Sea Res. Part A. Oceanogr. Res. Pap. 36 (2), 223–240. doi:10.1016/0198-0149(89)90135-0
Gong, Y., Yu, Z., Yao, Q., Chen, H., Mi, T., Tan, J., et al. (2015). Seasonal variation and sources of dissolved nutrients in the Yellow River, China. Int. J. Environ. Res. Public Health 12 (8), 9603–9622. doi:10.3390/ijerph12080960310.3390/ijerph120809603
Hartmann, J., Levy, J., and Kempe, S. (2011). Increasing dissolved silica trends in the Rhine River: An effect of recovery from high P loads? Limnology 12 (1), 63–73. doi:10.1007/s10201-010-0322-4
Hou, C. Y., Yi, Y. J., Song, J., and Zhou, Y. (2021). Effect of water-sediment regulation operation on sediment grain size and nutrient content in the lower Yellow River. J. Clean. Prod. 279, 123533. doi:10.1016/j.jclepro.2020.123533
Humborg, C., Ittekkot, V., Cociasu, A., and Bodungen, B. V. (1997). Effect of Danube river dam on black sea biogeochemistry and ecosystem structure. Nature 386, 385–388. doi:10.1038/386385a0
Ji, H. Y., Pan, S. Q., and Chen, S. L. (2020). Impact of river discharge on hydrodynamics and sedimentary processes at Yellow River Delta. Mar. Geol. 425, 106210. doi:10.1016/j.margeo.2020.106210
Jiang, T., Yu, Z., Song, X., Cao, X., and Yuan, Y. (2010). Long-term ecological interactions between nutrient and phytoplankton community in the Changjiang estuary. Chin. J. Ocean. Limnol. 28, 887–898. doi:10.1007/s00343-010-9059-5
Justic, D., Rabalais, N. N., and Turner, R. E. (1995). Stoichiometric nutrient balance and origin of coastal eutrophication. Mar. Pollut. Bull. 30 (1), 41–46. doi:10.1016/0025-326X(94)00105-I
Kendall, M. G. (1975). Rank correlation methods. 4th ed. London: Charles Griffin. doi:10.2307/2226580
Li, S. N., Wang, G. X., Deng, W., and Hu, Y. M. (2009). Effects of runoff and sediment variation on landscape pattern in the Yellow River Delta of China. Adv. Water Sci. 20 (3), 325–331. (in China). doi:10.14042/j.cnki.32.1309.2009.03.007
Liang, C., and Xian, W. W. (2018). Changjiang nutrient distribution and transportation and their impacts on the estuary. Cont. Shelf Res. 165, 137–145. doi:10.1016/j.csr.2018.05.001
Liu, S. M., Zhang, J., Chen, H. T., Wu, Y., Xiong, H., Zhang, D., et al. (2003). Nutrients in the changjiang and its tributaries. Biogeochemistry 62, 1–18. doi:10.1023/A:1021162214304
Liu, S. M., Hong, G. H., Zhang, J., Ye, X. W., and Jiang, X. L. (2009). Nutrient budgets for large Chinese estuaries. Biogeosciences 6, 2245–2263. doi:10.5194/bg-6-2245-2009
Liu, S. M., Li, L. W., Zhang, G. L., Liu, Z., Yu, Z., and Ren, J. L. (2012). Impacts of human activities on nutrient transports in the huanghe (Yellow River) estuary. J. Hydrol. 430–431, 103. doi:10.1016/j.hydrol.2012.02.005
Liu, S. M. (2015). Response of nutrient transports to water-sediment regulation events in the Huanghe basin and its impact on the biogeochemistry of the Bohai. J. Mar. Syst. 141, 59–70. doi:10.1016/j.jmarsys.2014.08.008
Lu, F., Ni, H., Liu, F., and Zeng, E. Y. (2009). Occurrence of nutrients in riverine runoff of the Pearl River delta, south China. J. Hydrology 376 (1), 107–115. doi:10.1016/j.jhydrol.2009.07.018
Ma, Y. X., Zang, J. Y., Che, H., Zheng, L. L., Zhang, B. T., and Ran, X. B. (2015). Trend and distributions of nutrient elements in the huanghe (Yellow) river. Oceanol. Limnol. Sin. 46 (1), 140–147. (in China). doi:10.11693/hyhz20140200046
Maavara, T., Chen, Q., Van Meter, K., Brown, L. E., Zhang, J. Y., Ni, J. R., et al. (2020). River dam impacts on biogeochemical cycling. Nat. Rev. Earth Environ. 1, 103–116. doi:10.1038/s43017-019-0019-0
Madron, X. D., Denis, L., Diaz, F., Garcia, N., Guieu, C., Grenz, C., et al. (2003). Nutrients and carbon budgets for the gulf of lion during the moogli cruises. Oceanol. Acta 26 (4), 421–433. doi:10.1016/S0399-1784(03)00024-0
Meybeck, M. (1982). Carbon, nitrogen, and phosphorus transport by world rivers. Am. J. Sci. 282, 401–450. doi:10.2475/ajs.282.4.401
Milliman, J. D., and Meade, R. H. (1983). World-wide delivery of river sediment to the oceans. J. Geol. 91, 1–21. doi:10.1086/628741
Milliman, J. D., Yun-Shan, Y., Mei-E, R., and Saito, Y. (1987). Man's influence on the erosion and transport of sediment by asian rivers: The Yellow River (huanghe) example. J. Geol. 95, 751–762. doi:10.1086/629175
Nelson, D. M., and Brzezinski, M. A. (1990). Kinetics of silicic acid uptake by natural diatom assemblages in two Gulf Stream warm-core rings. Mar. Ecol. Prog. Ser. 62 (3), 283–292. doi:10.3354/meps062283
Ran, X., Che, H., Zang, J., Yu, Y., Liu, S., Zheng, L., et al. (2015). Variability in the composition and export of silica in the huanghe River Basin. Sci. China Earth Sci. 58 (11), 2078–2089. doi:10.1007/s11430-015-5064-z
Redfield, A. C. (1958). The biological control of chemical factors in the environment. Am. Sci. 46, 205–222. doi:10.2307/27827150
Seitzinger, S. P., Mayorga, E., Bouwman, A. F., Kroeze, C., Beusen, A. H. W., Billen, G., et al. (2010). global river nutrient export: A scenario analysis of past and future trends. Glob. Biogeochem. Cycles 24 (4), a–n. doi:10.1029/2009GB003587
Smith, S. V., Swaney, D. P., Talaue-McManus, L., Bartley, J. D., Sandhei, P. T., McLaughlin, C. J., et al. (2003). Humans, hydrology, and the distribution of inorganic nutrient loading to the ocean. Bioscience 53, 235–245. doi:10.1641/0006-3568(2003)053[0235:hhatdo]2.0.co;2
Summerfield, J. Y., and Hulton, J. (1994). Natural controls of fluvial denudation rates in major world drainage basins. J. Geophys. Res. 99, 13871–13883. (in China). doi:10.1029/94JB00715
Sun, S., Su, B., Li, F., You, L. P., Qi, Y. M., Chen, W. J., et al. (2019). Effects of water and sediment discharge regulation on environment in the Yellow River Estuary and adjacent waters. Mar. Envir. Sci. 38 (3), 399–406. (in China).
Turner, R. E., Rabalais, N. N., Alexander, R. B., McIsaac, G., and Howarth, R. W. (2007). Characterization of nutrient, organic carbon, and sediment loads and concentrations from the Mississippi River into the northern Gulf of Mexico. Estuaries Coasts 30 (5), 773–790. doi:10.1007/BF02841333
Vilmin, L., Mogollón, J. M., Beusen, A. H. W., and Bouwman, A. F. (2018). Forms and subannual variability of nitrogen and phosphorus loading to global river networks over the 20th century. Glob. Planet. Change 163, 67–85. doi:10.1016/j.gloplacha.2018.02.007
Wang, H., and Sun, F. B. (2021). Variability of annual sediment load and runoff in the Yellow River for the last 100 years (1919-2018). Sci. Total Environ. 758, 143715. doi:10.1016/j.scitotenv.2020.143715
Wang, B. D., Wang, X. L., and Zhan, R. (2003). Nutrient conditions in the Yellow sea and the East China sea. Estuar. Coast. Shelf Sci. 58, 127–136. doi:10.1016/S0272-7714(03)00067-2
Wang, H. J., Yang, Z. S., Saito, Y., Liu, J. P., Sun, X. X., Wang, Y., et al. (2007). Stepwise decreases of the huanghe (Yellow River) sediment load (1950-2005): Impacts of climate change and human activities. Glob. Planet. Change 57, 331–354. doi:10.1016/j.gloplacha.2007.01.003
Wang, S., Fu, B., Piao, S., Lü, Y., Ciais, P., Feng, X., et al. (2015). Reduced sediment transport in the Yellow River due to anthropogenic changes. Nat. Geosci. 9, 38–41. doi:10.1038/ngeo2602
Wang, H., Wu, X., Bi, N., Li, S., Yuan, P., Wang, A., et al. (2017). Impacts of the dam-orientated water-sediment regulation scheme on the lower reaches and delta of the Yellow River (huanghe): A review. Glob. Planet. Change 157, 93–113. doi:10.1016/j.gloplacha.2017.08.005
Wang, Y., Zhang, J. J., Lv, Q. M., Lv, Z. B., Wang, Y. H., Gao, Y. J., et al. (2021). Effect of water and sediment regulation scheme on phytoplankton community and abundance in the Yellow River Estuary. Mar. Envir. Sci. 40 (3), 369–378. (in China). doi:10.13634/j.cnki.mes.2021.03.006
Wu, X., Bi, N., Xu, J., Nittrouer, J. A., Yang, Z., Saito, Y., et al. (2017). Stepwise morphological evolution of the active Yellow River (huanghe) delta lobe (1976-2013): Dominant roles of riverine discharge and sediment grain size. Geomorphology 292, 115–127. doi:10.1016/j.geomorph.2017.04.042
Xu, B. C., Yang, D. S., Burnett, W. C., Ran, X. B., Yu, Z. G., Gao, M. S., et al. (2016). Artificial water sediment regulation scheme influences morphology, hydrodynamics and nutrient behavior in the Yellow River estuary. J. Hydrology 539, 102–112. doi:10.1016/j.jhydrol.2016.05.024
Yang, Z. S., and Liu, J. P. (2007). A unique Yellow River-derived distal subaqueous delta in the Yellow Sea. Mar. Geol. 240, 169–176. doi:10.1016/j.margeo.2007.02.008
Yao, Q. Z., Yu, Z. G., Wang, T., Chen, H. T., and Mi, T. Z. (2009). Effect of the first water-sediment regulation on the variations of dissolved inorganic nutrients' concentrations and fluxes in the lower main channel of the Yellow River. Huan Jing Ke Xue 30 (12), 3534–3540. (in China). doi:10.13227/j.hjkx.2009.12.043
Yonggui, Y., Xuefa, X., Houjie, H., Chengkun, C., Shenliang, S., Yanguang, Y., et al. (2013). Effects of dams on water and sediment delivery to the sea by the huanghe (Yellow River): The special role of water-sediment modulation. Anthropocene 3, 72–82. doi:10.1016/j.ancene.2014.03.001
YRSB (2018). “Yellow River water resources conservation commission,” in Yellow River water resources bulletin, 2001–2017. Available online: http://www.yrcc.gov.cn/other/hhgb/.
Zarfl, C., Lumsdon, A. E., Berlekamp, J., Tydecks, L., and Tockner, K. (2015). A global boom in hydropower dam construction. Aquat. Sci. 77 (1), 161–170. doi:10.1007/s00027-014-0377-0
Zhang, X. L., Qiu, H., X., and Zhang, Q. (2001). Current situation of water resources in the circum-Bohai Area and its sustainable utilization measures. Coast. Eng. 20, 64–71. (in China). doi:10.3969/j.issn.1002-3682.2001.01.010
Zhang, J., Yu, Z. G., Raabe, T., Liu, S. M., Starke, A., Zou, L., et al. (2004). Dynamics of inorganic nutrient species in the Bohai seawaters. J. Mar. Syst. 44, 189–212. doi:10.1016/j.jmarsys.2003.09.010
Keywords: water and sediment regulation scheme, lijin station, nutrient variations, nutrient limitations, the lower yellow river
Citation: Li C, Wang Z, Liu H, Zuo L, Lu Y, Wu P and Lu Y (2022) Impact of a water-sediment regulation scheme on nutrient variations at the Lijin station of the Yellow River. Front. Environ. Sci. 10:900508. doi: 10.3389/fenvs.2022.900508
Received: 20 March 2022; Accepted: 29 June 2022;
Published: 18 July 2022.
Edited by:
Jeffrey Cornwell, University of Maryland, College Park, United StatesReviewed by:
Yonghong Bi, Institute of Hydrobiology (CAS), ChinaBing Deng, East China Normal University, China
Copyright © 2022 Li, Wang, Liu, Zuo, Lu, Wu and Lu. This is an open-access article distributed under the terms of the Creative Commons Attribution License (CC BY). The use, distribution or reproduction in other forums is permitted, provided the original author(s) and the copyright owner(s) are credited and that the original publication in this journal is cited, in accordance with accepted academic practice. No use, distribution or reproduction is permitted which does not comply with these terms.
*Correspondence: Zhili Wang, emx3YW5nQG5ocmkuY24=; Yongjun Lu, eWpsdUBuaHJpLmNu