 Jian Wang
 Xuying Yang
 Sikandar Ali Qalati
 Yuzhou Deng
- 1School of Finance and Economics, Jiangsu University, Zhenjiang, China
- 2School of Automotive and Traffic Engineering, Jiangsu University, Zhenjiang, China
As an important driving force for economic growth, transportation infrastructure can effectively integrate regional resources, deepen regional cooperation, and promote the rational utilization of resources. The cross-regional connectivity of transportation infrastructure makes its spatial spillover effect more prominent. In this article, the entropy weight method is used to construct a comprehensive index reflecting the traffic infrastructure of 41 prefecture-level cities in the Yangtze River Delta, and the spatial distribution characteristics are analyzed. Based on three spatial weight matrices, the spatial Durbin optimization model is used to investigate the spatial effect of transportation infrastructure on economic growth in the Yangtze River Delta. The results show that the regional transportation infrastructure and economic growth have significant spatial agglomeration characteristics and that the development of eastern cities is better. The transportation infrastructure of each city not only drives its own economic growth but also has a positive spatial spillover effect on the economic growth of adjacent areas. In order to achieve high-quality and integrated development in transportation, and to narrow the gap of transportation development in the Yangtze River Delta, we recommend that the spatial spillover effect of the transportation infrastructure on economic construction should be given full consideration.
1 Introduction
As a driver of economic development, transportation accelerates the flow of production factors and resource integration among cities along the line and effectively promotes complementary advantages among regions, which is an important pre-requisite for economic and social development. As evidenced by the early expansion of China’s domestic demand policy through the “Belt and Road Initiative” development strategy, the state regards transportation infrastructure as a priority area for development. This can be achieved by expanding the coverage of the transportation network and improving the level of transportation construction supply. Since the 19th National Congress of the Communist Party of China formulated a major plan to become a transportation power, the highway infrastructure of each county village in China has been further improved; the Yangtze River Delta, Chengdu Chongqing, and other urban agglomerations have invested in the construction of new railway trunk lines, and the western region has planned to add new airport branches. The construction of the transportation infrastructure across the country has thus shown a new development trend.
With its superior geographical location and excellent strategic position, the Yangtze River Delta connects Shanghai, Jiangsu, Zhejiang, and Anhui provinces. Shanghai plays a key role as an international city that has now become the sixth-largest urban agglomeration in the world. The development of these regions entails the construction of a large number of national roads, integrated as part of a high-quality road network, and a high-speed rail network. The construction of the transportation infrastructure has always been an important driving force of the cities’ economic development. The integrated development plan for higher quality transportation in the Yangtze River Delta issued in 2020 pointed out that a multi-level modern transportation network based on highway transportation and supported by railways network, aviation, and other forms of transportation should be completed by 2035. However, in the context of economic development, based on such constructions in these cities, there remain some transportation problems in the Yangtze River Delta, such as unbalanced development and incompatibility with other material flow factors.
Therefore, this article explores the spatial spillover effect of the transportation infrastructure on the regional economic growth of 41 prefecture-level cities in the Yangtze River Delta. Based on the spatial Durbin model (SDM), we present the spatial evolution of transportation and economic growth from the perspective of road network planning by comparing the local effect and spatial spillover effect of transportation infrastructure, and then analyzing the problems that need to be addressed in the process of planning and construction.
The remainder of this article is structured as follows. Section 2 provides a review of the relevant literature. Section 3 discusses the theoretical and model specifications. Section 4 details the data sources, variable selection, and empirical results. Finally, Section 5 presents the conclusions and recommendations.
2 Literature Review
As one of the national macro-control policy tools, transportation infrastructure construction is an important fulcrum to optimize industrial layout, promote industrial upgrading, and promote economic globalization. As early as in the 18th century, Adam Smith explained the positive effect of a good traffic environment on the economy and society from a theoretical point of view. In modern times, Aschauer (1989) and others have introduced transportation infrastructure into the traditional econometric model and verified Adam Smith’s theory by using time series. However, such studies have also been questioned because of the use of non-stationary data and high output values (Aschauer, 1989). Subsequently, scholars have gradually begun to use panel data to quantitatively study the impact of transportation construction investment or transportation infrastructure on economic growth.
The overall promoting effect of the transportation infrastructure on regional economic development has been confirmed by many studies (Donaldson and Hornbeck, 2016; Zhang et al., 2019). Transportation infrastructure has both network and externality characteristics. In addition to directly acting on output through investment, transport infrastructure can also act on the economic growth indirectly, with the agglomeration effect of transportation infrastructure having the most prominent effect in this context. Transportation improvement creates favorable conditions for economic agglomeration and promotes economic growth. Specifically, the improvement of transportation facilities reduces the transportation cost of enterprises, saves more funds for technology research and development investment, and attracts more enterprises (Holl, 2016). The development of transportation leads to more exchanges between the subjects of economic activities, promotes mutual help among individuals, and creates a good learning environment (Yang et al., 2019). Transportation connectivity shortens people’s commuting time, promotes more labor mobility across regions, relatively concentrates the labor force, and provides more employment opportunities (Duranton and Turner, 2012; Giuliano et al., 2019). In addition, resource allocation among enterprises can be optimized (Wang N. et al., 2020; Raicu et al., 2021), business inventories can be influenced (Datta, 2012), and household income and home values can be increased (Churchill et al., 2021; Ouyang et al., 2022). When measuring various types of transportation infrastructures in a country or region, scholars usually use single indicators, such as fixed investment in transportation, transportation network density, freight flow density, and passenger flow density. There are also differences in the directions and sizes of different transport infrastructures. Foreign scholars such as Jin Suk and others believe that, among all kinds of transport modes in OECD countries, sea transportation is far more important to economic growth than air transportation and land transportation (Park et al., 2019). Arbués et al. (2015), meanwhile, found that only road traffic has a positive impact on the economy. Domestic research at the provincial level asserts that road transportation plays a greater role in promoting the economy than railway and water transportation (Han et al., 2019; Wang et al., 2019). Another study found that the rail infrastructure in Central and Eastern European EU member states is chronically inefficient and obsolete, and that road infrastructure contributes to economic growth (Lenz et al., 2019).
As the link in regional connection, transportation infrastructure has a network attribute. In the context of regional integration, transportation construction provides a medium for the flow of various factors. With the continuous optimization of the transportation network structure, its spatial spillover effect is becoming increasingly obvious. With the rise of a new economic geography theory, scholars have begun to explore the impact of transportation infrastructure on economic growth from the perspective of space (Isaev, 2015; Chacon-Hurtado et al., 2020; Woo et al, 2014). Most scholars believe that transportation construction enhances the spatial spillover effect of economic growth, such as Du et al. (2021), who studied the impact of transportation infrastructure in the Yangtze River Economic Belt on economic growth. Lu et al. (2021) deeply analyzed the long- and short-term effects of the spatial spillover of provincial transportation construction. In the context of uncoordinated development in the region, Huang and Xu (2021) compared the differences in the spillover effects of traffic construction in the four major regions of China, finding that the spillover effect of roads in the central region was greater, while that of water transportation in the northeast region was greater. However, based on the railway and road data of countries along the “Belt and Road Initiative” area, the spillover effect of transport infrastructure in Central and Southeast Asia and CIS countries has been found to be significantly negative (Wang C. et al., 2020). In addition, few scholars have studied the spatial effect of transportation infrastructure from the perspective of prefecture-level cities (Bo et al., 2019; Wang C. et al., 2020).
In the relevant literature, several studies have been conducted on the spatial spillover effect of transportation infrastructure. However, most have used a single indicator to measure the regional transportation construction level, with the overall transportation construction level representing the transportation construction level of each city in the region. Such studies cannot therefore fully reflect the spatial differences of the transportation development of each city. In order to avoid overestimating the effect of transportation infrastructure on the regional economic growth, this article analyzes the spatial spillover effect of transportation infrastructure on the economic growth of 41 cities in the Yangtze River Delta based on the SDM. This method is helpful in grasping the differences in transportation development among cities in Jiangsu, Zhejiang, Shanghai, and Anhui, in improving the connection between transportation and various flow factors, in refining the transportation construction objectives of each region, and in building a regional cooperation mechanism.
3 Theoretical Analysis and Model Construction
3.1 Theoretical Analysis
The theory of the division of labor put forward by Adam Smith elaborates the essence of logistics. The construction of transportation logistics is constantly strengthened and the social division of labor is refined, which is conducive to regional economic growth, and transportation infrastructure directly promotes economic growth through the amplification of the investment multiplier (Guangzhen et al., 2019). The improvement of the transportation infrastructure level in a region means that there is an improvement in the transportation accessibility and transportation capacity in the region, thus bringing convenience to all aspects of economic, political, and social life. The development of the transportation industry can shorten the time of goods transportation, reduce the cost of goods transportation, improve the business efficiency of enterprises, promote the development of trade, and subsequently promote the macro-economy from the perspective of industries. The development of the transportation industry itself will also promote economic growth, such as all kinds of transportation services, government investment in transportation infrastructure projects, etc.
The improvement of regional transportation construction does not only bring a direct effect to the local economic growth, but also brings an indirect effect to the economic growth of neighboring areas. Transportation infrastructure, as the leading capital, has the characteristics of a network. Through the transportation network, all regions can overcome communication barriers to achieve cross-regional communication. Under the continuous optimization of the transportation network structure, human capital, technology, and other production factors can flow fully. Through the expansion effect and agglomeration effect, the transportation infrastructure also has the characteristics of a network. Through the spreading of transportation construction in advantageous areas, relatively inferior areas will obtain more social resources and development opportunities, and the output level of the area will be improved. This implies that the transportation infrastructure will have a positive spillover effect. In addition, the transportation infrastructure may also produce a negative spillover effect. The siphon effect of urban development shows that, in the later stages of urban development (Nian, 2019), those cities in a dominant position will absorb the production factors of the disadvantaged areas, so that the output of the advantageous areas will further expand, while the output of the disadvantaged areas will continue to decrease; at the same time, the local transport infrastructure will inhibit the economy of the surrounding areas, resulting in a negative spillover effect. Accordingly, the following hypotheses are proposed:
H1: The construction of transportation infrastructure has a positive impact on the economic growth of the city.
H2: The construction of transportation infrastructure promotes the economic growth of the surrounding cities.
3.2 Model Specification
Following Boarnet (1998), the present article introduces transportation infrastructure investment into the Cobb–Douglas production function. Combined with the development status of the Yangtze River Delta, we further introduce transportation infrastructure investment and new economic growth factors into the production function, thus obtaining the output model for each city:
Here,
The variables in the model should meet the following requirements:
Furthermore, considering the influence of spatial factors, combined with the output model, the spatial weight matrix and the spatial lag term of economic growth are introduced to construct: the spatial Durbin model (SDM); the spatial error model (SEM); and the spatial lag model (SAR):
where
This article is based on the following three spatial weight matrices.
According to W1, the “first law of geography,” the closer the two cities are in space, the closer the relationship is, and vice versa:
where
The adjacency matrix, W2, reflects the adjacency relationship of each spatial unit most intuitively:
where 1 represents when a city
In the economic geographical distance matrix, W3, generally speaking, the cities with a better economic development have stronger radiation effects on the neighboring cities. In order to avoid the same economic impact intensity between the two units in the economic distance (Wij = Wji), the economic geographical distance matrix is expressed as follows:
where
4 Variable Selection and Empirical Analysis
4.1 Selection and Explanation of Variables
The explained variable of this article is the per capita real GDP (PGDP) of 41 prefecture-level cities in the Yangtze River Delta region. In order to eliminate the influence of price and other factors in each year, we first use the GDP index of each city to deduce the regional GDP and then compare the number of permanent residents to obtain the per capita real GDP from 2007 to 2018. The core explanatory variables are as follows.
For transportation infrastructure (Kt), the current research mostly uses two kinds of methods to measure transportation infrastructure: the first is to reflect the monetary form of transportation public investment (Lin et al., 2019); the second is to reflect the physical form of transportation infrastructure construction, such as transportation network density and traffic flow density (Wang C. et al., 2020). However, transportation infrastructure includes not only public investment but also private investment, in which public investment is not stock. In order to avoid systematic error (Guangzhen et al., 2019) and the singleness of the index, this article constructs a comprehensive index reflecting the physical form of the transportation infrastructure in the Yangtze River Delta by using the entropy weight method. Compared with other modes of transportation, highway transportation has the characteristics of fast capital turnover, strong adaptability, and higher coverage of highway networks. Therefore, the specific indicators of this article are highway passenger volume (10,000 persons), highway freight volume (10,000 tons), highway passenger transport turnover (10,000 million persons-km), highway freight transport turnover (100 million tons-km), highway density (km/100 km2), and per capita civil car ownership (10,000 units/10,000 persons), which reflect the transportation capacity, traffic carrying capacity, and road construction level of each prefecture-level city.
When constructing comprehensive indicators of a transportation infrastructure, the entropy method can effectively avoid the shortcomings of the subjective weight assignment and better solve the problem of information duplication that may exist among multiple indicators. The specific steps are as follows.
The first step is to standardize the original data of transportation infrastructure by year:
where i = 1.2, … ,n, j = 1.2, … ,m,
The second step is to calculate the proportion of the ith index of each ith city in this index:
where i = 1.2, … ,n and j = 1.2, … ,m.
The third step is to determine the entropy weight of index
where i = 1.2, … ,n, j = 1.2, … ,m, and
The fourth step is to determine the difference coefficient
where
The fifth step is to calculate the comprehensive index of the transportation infrastructure of each prefecture in each year:
where i = 1.2, … ,n and j = 1.2, … ,m.
The control variables considered in this article are as follows:
• Capital investment (k): this article adopts the international general perpetual inventory method to calculate the capital stock. Referring to Zhang et al. (2019), taking the depreciation rate as 9.6%, using the fixed asset price index to reduce the fixed capital investment of each city, we can get the constant price capital stock of each prefecture-level city in 2007 as the base period (unit: 100 million yuan).
• Labor input (L): according to the output model, labor is an important input factor of regional output. This article uses the year-end employment for each city to measure (unit: 10,000 persons).
• Education investment (Edu): generally speaking, increasing regional human capital investment can promote the development of the regional economy, and human capital investment is mainly investment in education. Therefore, this article uses Xie’s (2019) method for reference to show that the number of ordinary universities in each city is higher than the number of permanent residents in the region (unit: 10,000 persons/10,000 persons).
• R&D investment intensity (R&D): science and technology investment provides a guarantee for regional, scientific, and technological progress, and R&D investment is the most innovative part. As the main force of R&D innovation, enterprises and universities have been increasing R&D investment. This article uses the proportion of scientific research and experimental development (R&D) in GDP to express the intensity of R&D investment (unit: 10,000 persons/10,000 persons).
• Environmental regulation (En): with the transformation of China’s economic growth model from extensive growth to the pursuit of total factor productivity growth, the restrictive relationship between environmental protection and economic growth is becoming increasingly prominent. In order to avoid the further intensification of the contradiction between environmental pollution and economic growth, the degree of the government’s environmental regulation is particularly important. In this article, industrial SO2 removal rate (%), comprehensive utilization rate of industrial solid waste (%), and domestic sewage treatment rate of each city (%) are selected and calculated using the entropy weight method. The specific construction process is the same as the comprehensive index of transportation infrastructure (Zhou and Wang, 2017).
• Government fiscal expenditure (Gov): as an important guarantee to promote social progress and social equity, government fiscal expenditure plays an extremely important role in short- and long-term macro-control, especially for the stable development of the economy and society. This article uses the general budget expenditure of the government to measure government fiscal expenditure (unit: 100 million yuan/100 million yuan).
• Foreign investment (Invest): with the increasing frequency of international exchanges and cooperation, foreign investment also affects the regional output. This article uses the average exchange rate of the US dollar to RMB to calculate the annual actual amount of foreign investment in each prefecture-level city (unit: 10,000 yuan).
The data for the aforementioned variables come from the Statistical Yearbook of Chinese Cities, the Statistical Yearbook of Cities in the Yangtze River Delta, and the Statistical Bulletin. In order to avoid the influence of heteroscedasticity on the empirical results, the natural logarithms of per capita real GDP, capital investment, labor input, government fiscal expenditure, and actual foreign investment are used. Regarding the price index, government expenditure and actual foreign investment are adjusted to the constant price based from 2007. The descriptive statistics for each variable are shown in Table 1.
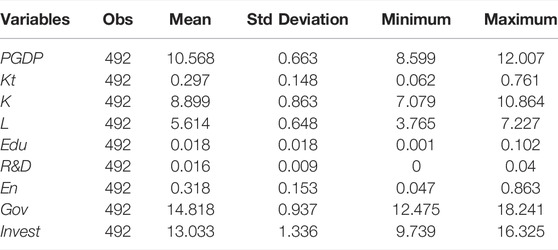
TABLE 1. Descriptive statistical analysis of the variables.
4.2 Spatial Autocorrelation Test
4.2.1 Spatial Distribution Characteristics
In the spatial distribution map, the deeper the color block is, the higher the level of economic growth, and the lighter the color block is, the lower the level of economic growth. In the past decade, the economic strength of the provinces in the Yangtze River Delta region has been greatly improved. With the implementation of regional integration-related policies, the radiation scope of the economic activities in the Yangtze River Delta region has been expanding. However, it can be seen from Figure 1 that the regions with a strong economic strength in the Yangtze River Delta are mainly distributed in the East, showing the characteristics of “strong in the East and weak in the West.”
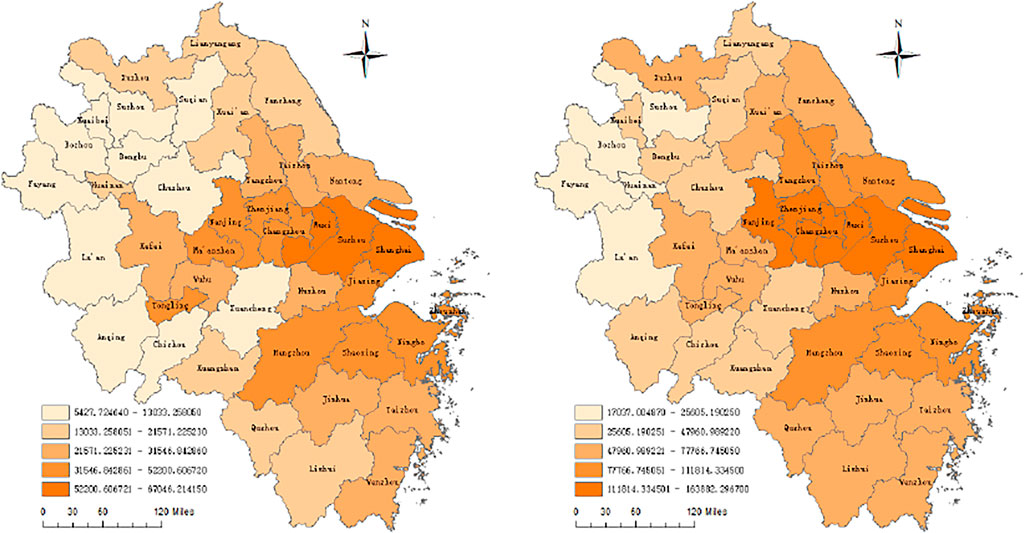
FIGURE 1. Spatial distribution of the economic growth in the Yangtze River Delta in 2007 and 2018.
The distribution in Figure 2 shows that the transportation infrastructure in the Yangtze River Delta presents the characteristics of spatial dependency and heterogeneity. Compared with the year 2007, the transportation infrastructure of most cities has been strengthened by 2018. Anhui Province, which had been developing slowly in the initial stage, has been striving to make up for the lack of transportation infrastructure; in particular, infrastructure constructions in Fuyang City and Bozhou City have broken through the development bottleneck, rising from the low level to the medium and high levels. Shanghai’s transportation infrastructure has always been in a leading position, benefitting also from its superior geographical location and advanced economic development level. Jiangsu and Zhejiang, as the first batch of pilot provinces for traffic power, have improved the overall level of transportation infrastructure construction. However, the transportation infrastructure development of some cities is relatively weak, which restricts the economic activities to a certain extent.
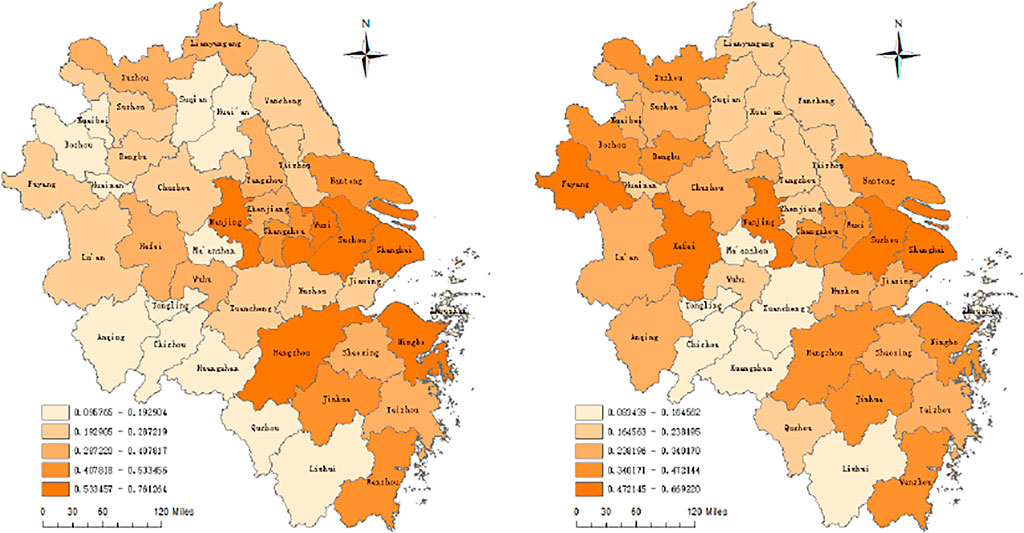
FIGURE 2. Spatial distribution characteristics of the transportation infrastructure in the Yangtze River Delta in 2007 and 2018.
4.2.2 Global Spatial Autocorrelation
Spatial autocorrelation examines the similarity of variables located in neighboring cities, and testing spatial autocorrelation is the basis for estimating spatial spillover effects. First, the weight matrix of geographical distance is used for verification and estimation purposes. The results in Table 2 show that the corresponding p-values of Moran’s I statistics for the economic growth in each year are less than 0.05, and that the spatial positive correlation of regional economic growth is increasing. In most years, the transportation infrastructure has passed the spatial correlation test, but the overall fluctuation is large, and the Moran’s I statistic has declined in recent years.
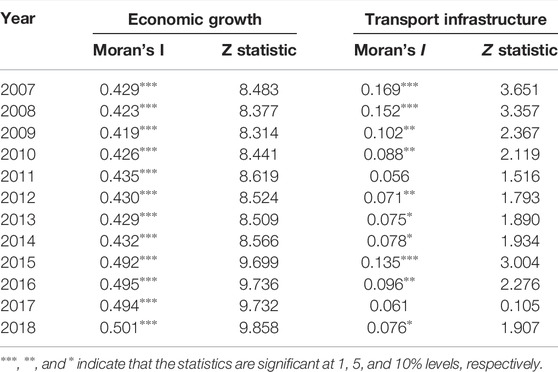
TABLE 2. Moran’s I statistics for economic growth and transportation infrastructure in the Yangtze River Delta.
4.2.3 Local Spatial Autocorrelation
The Moran’s I scatter diagram (Figure 3) reflects the local characteristics of variables. The economic growth of most cities in the Yangtze River Delta in 2007 and 2018 is distributed in the first and third quadrants, with a strong spatial positive correlation. Jiangsu, Zhejiang, and Shanghai are mainly in high-value agglomeration areas, while the Anhui Province is mainly in low-value agglomeration areas, which indicates that cities with active economic development can often promote the development of their surrounding cities, while cities with a relatively weak economic development will often hinder the development of their surrounding cities. There is also a positive spatial correlation in the distribution of the transportation infrastructure in the Yangtze River Delta, among which Bozhou and Fuyang have changed from low-value agglomeration in the early stage to high-value agglomeration in 2018, while the transportation construction of some cities in the Anhui Province, Northern Jiangsu Province, and Southern Zhejiang Province still needs to be strengthened. It can be seen that the transportation and economic growth in the Yangtze River Delta show the characteristics of massive clusters, and the spatial positive correlation is significant.
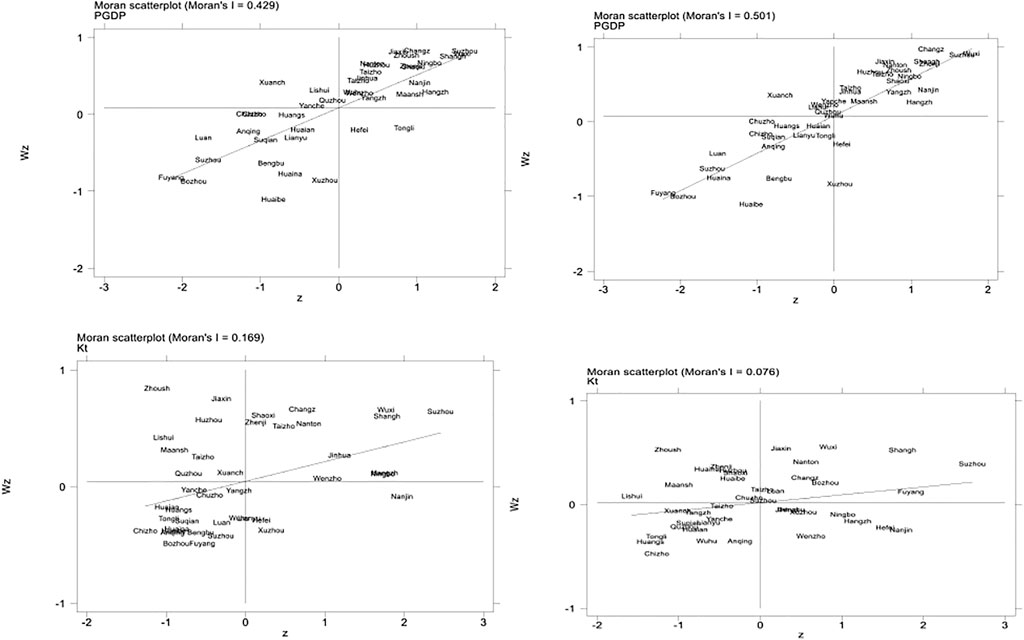
FIGURE 3. Moran’s I scatter plot of economic growth and transportation infrastructure in the Yangtze River Delta in 2007 and 2018.
4.3 Selection of a Spatial Panel Model
First, the Lagrange multiplier (LM) test results for the SEM, SAR, and SDM models show that lmlag, r-lmlag, lmerr, and r-lmerr all pass the significance test (See Table 3). According to the LM test criterion proposed by Anselin and Tam Cho (2002), both SEM and SAR models are established, so the SDM model combining the two models is preferred. Second, the Hausman test statistic was 88.03 (p < 0.01), which rejects the original hypothesis that the model is random effect, i.e., it is fixed effect. To further test the specific form of the fixed effect, the likelihood ratio (LR) test of time- and space-fixed effect revealed a p-value of less than 1%, thus suggesting a mixed fixed-effect model. Subsequently, in order to better estimate the spatial effect between variables, it is necessary to further test the adaptability of the SDM model. The Wald and LR statistics in Table 4 are significant at the 1% confidence level, so the original hypothesis that the SEM and SAR models degenerate into SDM models is rejected.

TABLE 3. LM test results.
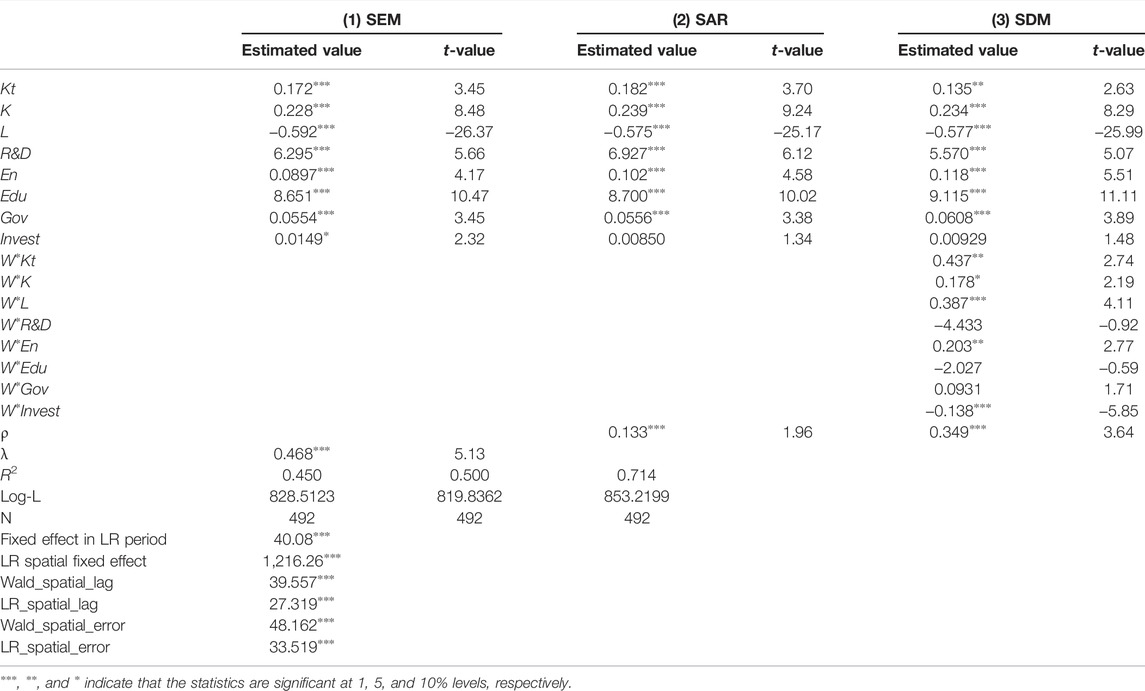
TABLE 4. The estimated results of SAR, SEM, and SDM models of transportation infrastructure on the economic growth in the Yangtze River Delta.
4.4 Model Estimation
Compared with SEM and the model of SAR, the SDM model can effectively solve the sample data of the regional spatial regression model of the problem: when an ordinary least-squares regression model of spatial correlation of the disturbance, the second is when processing the area of sample data, and there will be some explanation of the variables in the model of the covariance is not zero explanation variable is ignored. The estimation results in Table 4 show that the R2 and maximum likelihood estimation (MLE) of the SDM model are higher than those for the SAR and SEM models. Based on the aforementioned tests, the SDM model with the spatiotemporal mixed fixed-effect is selected. Regarding the spatial autoregressive coefficient of PGDP, the ρ of the corresponding p-value is less than 0.05, which indicates that the spatial spillover effect of the economic growth in the Yangtze River Delta region is significant. Generally, the improvement of the economic level of a city will promote the development of its surrounding cities. In addition, the spatial autoregressive coefficients for transportation infrastructure and other control variables are also significant, which indicates that the spatial transmission effect of the explanatory variables should also be considered when studying the spatial impact of transportation on economic growth.
4.5 Direct Effect and Indirect Effect
Since the coefficient of the spatial autocorrelation term of PGDP is significantly not zero, there is a systematic error indirectly using the model estimation coefficient to measure the spatial spillover effect of the explanatory variables. Therefore, according to the partial differential method proposed by LeSage (2008), the coefficients of the explanatory variables are decomposed into direct effect, indirect effect, and total effect. The direct effect, namely the local effect, reflects the effect of the local explanatory variables on the local economic growth, and the indirect effect reflects the spatial spillover effect of the local explanatory variables on the economic growth of the neighboring cities.
The decomposition results in Table 5 show that the direct effect of transportation infrastructure is 0.155 (p < 0.05), and the indirect effect is 0.757 (p < 0.05), which means that the spatial spillover effect of transportation infrastructure on the regional economic growth in the Yangtze River Delta is significant, which is consistent with the views of most scholars. The improvement of the transportation infrastructure construction in the Yangtze River Delta not only promotes the local economy but also actively promotes the development of its adjacent cities. It is not difficult to find that the indirect effect of transportation is much greater than the direct effect. This may be due to the improvement of transportation infrastructure, which shortens the time of factor flow between regions and plays an irreplaceable role in cross-regional communication. Although the competition among the cities in the Yangtze River Delta is fierce, transportation construction alone cannot meet the development needs of the national integration strategy, and the integration of transportation construction helps to break the barriers of all lifestyles in this space.
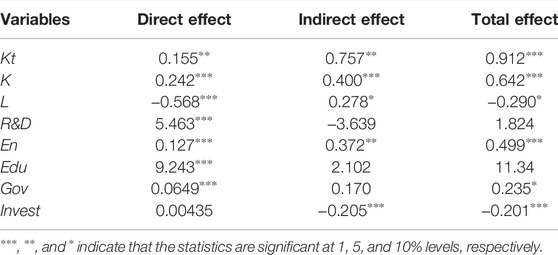
TABLE 5. Direct and indirect effects of transportation infrastructure and control variables on economic growth.
The impact of capital stock on economic growth is similar to that of transportation, which indicates that infrastructure is still an important engine of regional economic development. The direct effect and total effect of the labor force are negative, while the spillover effect is positive. According to Geng and Sun (2017), the reason is that the population agglomeration and aging brought by urbanization make the “demographic dividend” of cities continue to decline, and even worsen to “population liabilities,” while the siphoning effect of neighboring cities also absorbs a large number of the young labor force. The direct effects of R&D (5.463, p < 0.001) and educational resources (9.423, p < 0.001) are significantly higher relative to other variables (transportation infrastructure, capital stock, environment, government, and investment). As a highly innovative region, cities adhere to the concept of rejuvenating the country through science and education and increasing investment in R&D and education. However, the spatial spillover effect of the two is not significant, and the coefficient of R&D is negative, which indicates that there is still a lack of coordination in the development of science and education among cities in the Yangtze River Delta. The direct and indirect effects of environmental regulation are significant, which indicates that the environmental protection of each city has actively promoted the local and surrounding economic growth, and the construction of ecological civilization has become deeply embedded in the daily work of local governments and enterprises. The direct effect of foreign investment is not significant, while the spillover effect is negative. This shows that the negative impact of foreign investment on regional unbalanced development has been ignored in the past, and excessively attracting foreign investment is not necessarily a good thing. It not only requires higher costs but also may have adverse effects on economic development. According to Yu and Shuang (2021), the direct effect of government fiscal expenditure is significantly positive, but the spillover effect is not significant, which indicates that, although the fiscal expenditure of the cities in the Yangtze River Delta has promoted local economic growth, it has not achieved the rational allocation of resources, thus inhibiting the economic growth of the neighboring cities.
4.6 Robustness Check
To further test the robustness of the empirical results, following Hongchao et al. (2019), the present article estimates the model based on the adjacency matrix W2 and the economic geography matrix W3. LM, Hausman, and Wald test statistics all passed the significance test of less than 5%, and the results in Table 6 show that the goodness of fit of the models under the two matrices is better, which again shows that the SDM model is suitable for estimation.
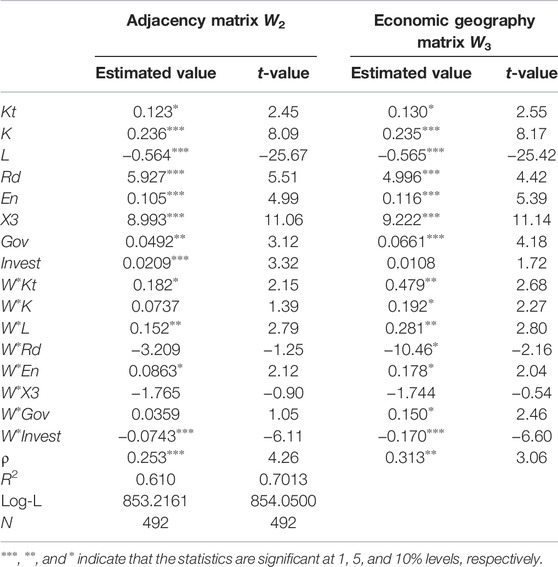
TABLE 6. Robustness test for the SDM model.
The results in Table 7 show that, on the whole, the direct and indirect effects of each variable are basically stable, and that the spatial spillover effect of transportation infrastructure is significantly positive regardless of the matrix, which is greater than the direct effect, indicating that the transportation construction in the Yangtze River Delta has played a leading role in the economy. In addition, under the economic geography matrix, the indirect effect and total effect of R&D investment are less than 0 and not significant, which further shows that the Yangtze River Delta should not ignore scientific research investment while paying attention to infrastructure investment.
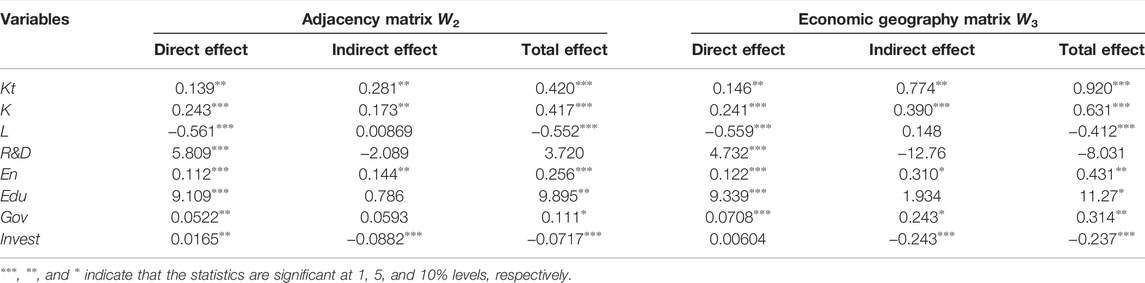
TABLE 7. Robustness test of direct and indirect effects.
5 Conclusion
As the most representative urban agglomeration in China’s modernization drive, the Yangtze River Delta region is the key intersection of the “Belt and Road Initiative” and the Yangtze River Economic Belt. Therefore, to study the spatial spillover effect of transportation infrastructure in the Yangtze River Delta region on economic growth, it was hypothesized that transportation infrastructure development in the Yangtze River Delta region would affect the surrounding underdeveloped areas, thus showing that transportation infrastructure construction plays an important role in economic growth. Based on the relevant panel data for 41 prefecture-level cities in the Yangtze River Delta from the 2007 to 2018, this article used the entropy method to construct the transportation infrastructure indicators, reflecting the transportation capacity, transportation carrying capacity, and road construction level in the Yangtze River Delta. The spatial distribution characteristics of the transportation infrastructure and economic growth were presented through the spatial distribution characteristic map, and the spatial correlation between the two was tested according to Moran’s I index; SDM, SAR, and SEM models were used to study the spatial spillover effect of the transportation infrastructure on the economic growth in the Yangtze River Delta.
There were three key findings. First, the spatial distribution of the transportation and economic growth of the 41 cities in the Yangtze River Delta is heterogeneous. The areas with higher economic levels are mainly concentrated in the eastern coastal cities along the river, while the development of the western region is relatively slow. The areas with high traffic levels are more dispersed in space, and the traffic level of each province has been improved overall. Second, the transportation and economic growth of each city have strong agglomeration characteristics, and the spatial positive correlation is significant. Shanghai has always been in a leading position in terms of economy and transportation. Furthermore, Fuyang City and Bozhou City in the Anhui Province are developing rapidly. In terms of economic growth, there are still some cities in Jiangsu, Zhejiang, and Anhui in low and high concentration areas.
Third, the Yangtze River Delta transportation infrastructure has a significant spatial spillover effect. Transportation construction has driven the economic growth of local and adjacent cities, and the positive impact on the surrounding cities is far greater than that on the local cities. From the decomposition effect of the control variables, we can see that in the coefficient for the local effect (except for the significant negative labor input and insignificant foreign investment), capital, environmental regulation, government expenditure, science and technology, and education investment all have a positive impact on economic growth, with science and education investments having the greatest impact. Regarding the spatial spillover effect coefficient, science and technology, education investment, government financial support, and foreign investment hinder the economic growth of neighboring cities to a certain extent.
5.1 Recommendations
This study has several implications. First, it is necessary to acknowledge the leading role of the core cities in the Yangtze River Delta, and to promote the formation of urban agglomeration accordingly. Since the implementation of the Yangtze River Delta regional planning, the transportation and economic constructions of the cities in Jiangsu, Zhejiang, Shanghai, and Anhui have usually focused on the central cities in terms of space. Generally speaking, the premise for radiation and spillover play a role is the spatial agglomeration of economic activities (Boya, 2020). The central city promotes the development of neighboring cities under the centripetal force and then radiates to the whole region. Balanced development is more conducive to the sustainable development of the economy. In view of this, central cities such as Shanghai, Nanjing, and Hangzhou should play a leading role in promoting the common development of potential cities, while non-central cities should play a connecting role in order to create a balanced linkage development network in space. In addition, the Anhui Province, which is developing slowly, needs to strengthen communication and cooperation with Jiangsu, Zhejiang, and Shanghai cities.
Second, it is necessary to promote the high-quality development of transportation infrastructure in the Yangtze River Delta region and to promote regional integration. In the planning of regional transportation construction, we cannot blindly pursue transportation investment. For small and medium-sized cities, excessive investment may lead to the gradual transfer of resources from inferior regions to superior regions, thus aggravating the imbalance in regional development. Jiangsu and Zhejiang, as the first batch of pilot provinces for the construction of transportation infrastructure, should play a key role. By continuously optimizing the layout of transportation networks among the Anhui Province, Southern Zhejiang Province, and Northern Jiangsu Province, it should be possible to make up for the regional transportation weakness, as well as by continuously coordinating the transportation construction of various regions, in order to give full play to the spatial spillover effect of transportation. By 2035, a high-quality integrated transportation infrastructure in the Yangtze River Delta region will be formed, following which, regional integration and the Yangtze River Delta becoming a transportation power will be accelerated.
Third, it is necessary to strengthen the suitability of transportation infrastructure and production factors in the Yangtze River Delta, and to coordinate the common development of all factors. The results of the decomposition effect show that only the direct and indirect effects of capital investment and environmental regulation are significantly positive. Although the spillover effect of transportation infrastructure in the Yangtze River Delta is significant, its adaptability to various flow factors still needs to be improved. For example, in the context of rapid developments in science and technology, universities, enterprises, and other scientific research organizations in different regions should give full play to their respective advantages, as well as exchange and learn from each other, in order to realize the driving role of science and technology in economic growth. In order to avoid further deterioration of the “demographic dividend,” the government should increase financial expenditure on people’s livelihood and improve the level of social security. Therefore, it is necessary to promote the benign interaction between traffic and environmental regulations, factor flow, economic development, etc., and to build a new pattern of traffic construction in the Yangtze River Delta in order to create a link between development inside and outside the region.
5.2 Limitation of the Study
Based on the availability of data, this article has measured the transportation infrastructure in the Yangtze River Delta region through highway stock. At present, the trunk highway network in the Yangtze River Delta region is convenient and efficient, and the road network area density is 2.8 times the national average level. Although the region has the most developed inland waterway network in China, the waterway mileage accounts for about 30% of the country’s total. It is, however, difficult to distinguish inland waterways at the level of prefecture-level cities, which is not considered in the final analysis of this article. Therefore, the selection and construction of the transportation infrastructure stock index is a valuable direction for future studies.
Data Availability Statement
The raw data supporting the conclusions of this article will be made available by the authors, without undue reservation.
Author Contributions
All authors listed have made a substantial, direct, and intellectual contribution to the work and approved it for publication.
Funding
This research was supported by the National Social Science Foundation of China (Project No. 21BTJ050), The 15th Batch of “Six Talent Peaks” Projects in Jiangsu Province (Project No. JXQC-038), National Statistical Research Program of China (Project No. 2021LY066), High Level Talents Project of Jiangsu University (Project No. 12JDG009), and the Postgraduate Research & Practice Innovation Program of Jiangsu Province (Project No. KYCX20_3056).
Conflict of Interest
The authors declare that the research was conducted in the absence of any commercial or financial relationships that could be construed as a potential conflict of interest.
Publisher’s Note
All claims expressed in this article are solely those of the authors and do not necessarily represent those of their affiliated organizations, or those of the publisher, the editors, and the reviewers. Any product that may be evaluated in this article, or claim that may be made by its manufacturer, is not guaranteed or endorsed by the publisher.
Acknowledgments
The authors would like to acknowledge the reviewer and colleagues for their valuable guidance and helpful comments.
References
Anselin, L., and Tam Cho, W. K. (2002). Spatial Effects and Ecological Inference. Polit. Anal. 10 (3), 276–297. doi:10.1093/pan/10.3.276
Arbués, P., Baños, J. F., and Mayor, M. (2015). The Spatial Productivity of Transportation Infrastructure. Transp. Res. Part A Policy Pract. 75, 166–177. doi:10.1016/j.tra.2015.03.010
Aschauer, D. A. (1989). Public Investment and Productivity Growth in the Group of Seven. Econ. Perspect. 13 (5), 17–25.
Awaworyi Churchill, S., Baako, K. T., Mintah, K., and Zhang, Q. (2021). Transport Infrastructure and House Prices in the Long Run. Transp. Policy 112, 1–12. doi:10.1016/j.tranpol.2021.08.006
Bo, L., Xiangjun, Z., Dongping, S., and Shouyang, W. (2019). The Spatial Effect of Highway Traffic Accessibility in Northeast China. Manag. Rev. 31 (9), 3–17.
Boarnet, M. G. (1998). Spillovers and the Locational Effects of Public Infrastructure. J. Regional Sci. 38 (3), 381–400. doi:10.1111/0022-4146.00099
Boya, L. (2020). Study on spatial structure evolution and spillover effect of Urban agglomeration in Yangtze River Delta. Macroeconomic research 05, 68–81. doi:10.16304/j.cnki.11-3952/f.2020.05.006
Chacon-Hurtado, D., Kumar, I., Gkritza, K., Fricker, J. D., and Beaulieu, L. J. (2020). The Role of Transportation Accessibility in Regional Economic Resilience. J. Transp. Geogr. 84 (C), 102695. doi:10.1016/j.jtrangeo.2020.102695
Datta, S. (2012). The Impact of Improved Highways on Indian Firms. J. Dev. Econ. 1. doi:10.1016/j.jdeveco.2011.08.005
Donaldson, D., and Hornbeck, R. (2016). Railroads and American Economic Growth: A "Market Access" Approach *. Quart. J. Econ. 131, 799–858. doi:10.1093/qje/qjw002
Du, X., Shen, L., Wong, S. W., Meng, C., and Yang, Z. (2021). Night-time Light Data Based Decoupling Relationship Analysis between Economic Growth and Carbon Emission in 289 Chinese Cities. Sustain. Cities Soc. 73, 103119. doi:10.1016/j.scs.2021.103119
Duranton, G., and Turner, M. A. (2012). Urban Growth and Transportation. Rev. Econ. Stud. 79, 1407–1440. doi:10.1093/restud/rds010
Geng, Z., and Sun, Q. (2017). Population Aging, Delaying Retirement Age and the Secondary Demographic Dividend. J. Financ. Res. 1, 52–68. doi:10.12094/1002-7246
Giuliano, G., Kang, S., and Yuan, Q. (2019). Agglomeration Economies and Evolving Urban Form. Ann. Reg. Sci. 63, 377–398. doi:10.1007/s00168-019-00957-4
Guangzhen, G., Ruiguo, L., and Zongxi, H. (2019). Economic Growth Model of Transportation Infrastructure Affecting Consumption. Econ. Res. 54 (3), 166–180.
Han, W., Zhang, Y., Cai, J., and Ma, E. (2019). Does Urban Industrial Agglomeration Lead to the Improvement of Land Use Efficiency in China? an Empirical Study from a Spatial Perspective. Sustainability 11 (4), 986. doi:10.3390/su11040986
Holl, A. (2016). Highways and Productivity in Manufacturing Firms. J. Urban Econ. 93, 131–151. doi:10.1016/j.jue.2016.04.002
Hongchao, D., Fuxin, J., and Lu, L. (2019). Transportation and Industrial Agglomeration from the Perspective of Space: An Empirical Analysis Based on Spatial Dubin Model. Exploration of Economic Problems 02, 118–129.
Huang, Y., and Xu, W. (2021). Spatial and Temporal Heterogeneity of the Impact of High-Speed Railway on Urban Economy: Empirical Study of Chinese Cities. J. Transp. Geogr. 91, 102972. doi:10.1016/j.jtrangeo.2021.102972
Isaev, A. G. (2015). Transport Infrastructure and Economic Growth: Spatial Effects. Prostranstvennaâ ÈkonomikaQ 3. doi:10.14530/se.2015.3.057-073
LeSage, J. P. (2008). An Introduction to Spatial Econometrics. Rev. Econ. Ind. 123 (3), 19–44. doi:10.4000/rei.3887
Lin, X., MacLachlan, I., Ren, T., and Sun, F. (2019). Quantifying Economic Effects of Transportation Investment Considering Spatiotemporal Heterogeneity in China: A Spatial Panel Data Model Perspective. Ann. Reg. Sci. 63 (3), 437–459. doi:10.1007/s00168-019-00937-8
Lu, X., Wang, M., and Tang, Y. (2021). The Spatial Changes of Transportation Infrastructure and its Threshold Effects on Urban Land Use Efficiency: Evidence from China. Land 10 (4), 346. doi:10.3390/land10040346
Nian, M. (2019). Transportation Infrastructure, Economic Growth and Spatial Equalization – Natural Experiment Based on High-Speed Railway in China. Financ. Trade Econ. 40 (8), 146–161. doi:10.3390/su132313316
Ouyang, Y., Cai, H., Yu, X., and Li, Z. (2022). Capitalization of Social Infrastructure into China's Urban and Rural Housing Values: Empirical Evidence from Bayesian Model Averaging. Econ. Model. 107, 105706. doi:10.1016/j.econmod.2021.105706
Park, J. S., Seo, Y.-J., and Ha, M.-H. (2019). The Role of Maritime, Land, and Air Transportation in Economic Growth: Panel Evidence from OECD and Non-OECD Countries. Res. Transp. Econ. 78, 100765. doi:10.1016/j.retrec.2019.100765
Raicu, S., Costescu, D., Popa, M., and Dragu, V. (2021). Dynamic Intercorrelations between Transport/traffic Infrastructures and Territorial Systems: From Economic Growth to Sustainable Development. Sustainability 13 (21), e11951. doi:10.3390/SU132111951
Vlahinić Lenz, N., Pavlić Skender, H., and Mirković, P. A. (2019). The Macroeconomic Effects of Transport Infrastructure on Economic Growth: The Case of Central and Eastern E.U. Member States. Econ. Research-Ekonomska Istraživanja 31 (1), 1953–1964. doi:10.1080/1331677X.2018.1523740
Wang, C., Lim, M. K., Zhang, X., Zhao, L., and Lee, P. T.-W. (2020a). Railway and Road Infrastructure in the Belt and Road Initiative Countries: Estimating the Impact of Transport Infrastructure on Economic Growth. Transp. Res. Part A Policy Pract. 134, 288–307. doi:10.1016/j.tra.2020.02.009
Wang, F., Wei, X., Liu, J., He, L., and Gao, M. (2019). Impact of High-Speed Rail on Population Mobility and Urbanisation: A Case Study on Yangtze River Delta Urban Agglomeration, China. Transp. Res. Part A Policy Pract. 127, 99–114. doi:10.1016/j.tra.2019.06.018
Wang, N., Zhu, Y., and Yang, T. (2020b). The Impact of Transportation Infrastructure and Industrial Agglomeration on Energy Efficiency: Evidence from China's Industrial Sectors. J. Clean. Prod. 244, 118708. doi:10.1016/j.jclepro.2019.118708
Woo, M., Ross, C. L., and Boston, T. D. (2014). Do Megaregions Produce Greater Regional Convergence or Divergence? Implications for Spatial Planning and Infrastructure Investment. Journal of Urban Planning and Development. J. Urban Plan. Dev. Div. ASCE 1. doi:10.1061/(ASCE)UP.1943-5444.0000198
Yang, X., Lin, S., Zhang, J., and He, M. (2019). Does High-Speed Rail Promote Enterprises Productivity? Evidence from China. J. Adv. Transp. 2019, 19. doi:10.1155/2019/1279489
Yu, W., and Shuang, S. (2021). Spatial Spillover Effect of Logistics Industry Agglomeration on Regional Economic Gowth: Based on the Empirical Analysis of Urban Agglomeration in Yangtze River Delta. Journal of Central South University (Social Science Edition) 01, 76–89.
Zhang, T., Chen, L., and Dong, Z. Q. (2019). Highway Construction, Enterprise Evolution and Regional Economic Efficiency. Chin. Ind. Econ. 1, 79–99. doi:10.19581/j.cnki.ciejournal.20180115.003
Keywords: transport infrastructure, economic growth, spatial spillover effect, spatial distribution characteristics, yangtze river delta
Citation: Wang J, Yang X, Qalati SA and Deng Y (2022) Spatial Spillover Effect and Spatial Distribution Characteristics of Transportation Infrastructure on Economic Growth: A Case of the Yangtze River Delta. Front. Environ. Sci. 10:900209. doi: 10.3389/fenvs.2022.900209
Received: 20 March 2022; Accepted: 29 April 2022;
Published: 09 June 2022.
Edited by:
Tieyu Wang, Shantou University, ChinaReviewed by:
Wenxiang Li, University of Shanghai for Science and Technology, ChinaHaozhi Pan, Shanghai Jiao Tong University, China
Copyright © 2022 Wang, Yang, Qalati and Deng. This is an open-access article distributed under the terms of the Creative Commons Attribution License (CC BY). The use, distribution or reproduction in other forums is permitted, provided the original author(s) and the copyright owner(s) are credited and that the original publication in this journal is cited, in accordance with accepted academic practice. No use, distribution or reproduction is permitted which does not comply with these terms.
*Correspondence: Sikandar Ali Qalati, c2lkcWFsYXRpQGdtYWlsLmNvbQ==, MTAwMDAwNTc3MkB1anMuZWR1LmNu; Xuying Yang, MjQwOTI5ODE2QHFxLmNvbQ==