- 1Agro-Environmental Protection Institute, Ministry of Agriculture and Rural Affairs, Tianjin, China
- 2Graduate School of Chinese Academy of Agricultural Sciences, Beijing, China
- 3Key Laboratory for Environmental Factors Control of Agro-Product Quality Safety, Ministry of Agriculture and Rural Affairs, Tianjin, China
Trade-offs between eco-environment protection and socioeconomic development hinder the success of sustainable development goals (SDGs). Solutions based on ecosystem services (ESs) provide the co-benefits and pathways for fulfilling the SDGs. However, assessing the progress towards SDGs based on the contribution of ESs to SDGs is lacking. Here we assessed the spatial-temporal changes of ecosystem service values (ESV) and the SDG scores in the Beijing-Tianjin-Hebei region (BTH) over the past 20 years using “ES-SDG linkages.” The total ESV and ES-SDG Index score in the BTH showed a spatial pattern of high values in the northern plateau and low values in the southern plain. The total ESV increased from 25,335 yuan ha−1 in 2000 to 27,344 yuan ha−1 in 2020, mainly attributed to water provision and water regulation. The decrease of cropland, grassland, and wetland in the BTH between 2000 and 2010 caused a decrease in the value of nine ESs, whereas the increase of forestland, waterbodies and wetland between 2010 and 2020 contributed to an increase in the value of seven ESs. The ES-SDG Index score decreased slightly from 36.8 in 2000 to 35.5 in 2010, and then increased to 36.0 in 2020 due to the control of rapid urbanization and strengthen of ecological restoration. Our study indicates that the changes of ES-SDG Index score mainly depended on food provision, water provision, climate regulation, nutrient cycling, habitat & biodiversity, and cultural services. The assessment of SDGs suggests that SDG6, SDG11, and SDG12 should be prioritized to advance the synergistic development of SDGs in the BTH, which will also enhance the understanding of stakeholders about the progress of achieving SDGs.
1 Introduction
Ecosystem services (ESs) are the foundation of human well-being and sustainable development (Costanza et al., 2016; Geijzendorffer et al., 2017; Wood et al., 2018). The interactions among ESs, human well-being, and sustainable development have become one of the core issues in sustainability science (Wu, 2013; Guerry et al., 2015; Fu, 2020). Since 17 sustainable development goals (SDGs) and 169 targets incorporating economic, social, and environmental dimensions of sustainability were proposed by the United Nations in 2015, most countries have made considerable progress towards achieving those SDGs, especially in terms of the elements of socioeconomic development (Sachs et al., 2021). However, much progress made in socioeconomic development was based on the unsustainable exploitation of nature. Approximately 60% of ESs have been degraded globally (MA, 2005). Fourteen of the 18 categories of nature’s contributions to people (NCP) have declined (IPBES, 2019). Biodiversity loss and ecosystem fragmentation have threatened the realization of 80% of the SDG targets (UNEP, 2021). Despite human activities having created substantial wealth by exploiting ecosystems intensively, it is difficult to compensate for the lost benefits caused by eco-environment deterioration (Wood et al., 2018; Yin et al., 2021). Achieving the SDGs was hindered by trade-offs between eco-environmental protection and human well-being (Yang et al., 2020).
Numerous studies have quantitatively evaluated the performance of SDGs through environmental and socioeconomic indicators (Schmidt-Traub et al., 2017; Xu et al., 2020; Huan et al., 2021; Zhang et al., 2022b). However, ES indicators were rarely considered in SDG assessment (Cochran et al., 2020; Pires et al., 2021). ES-based solutions with comprehensive consideration of land management, ecological restoration, and human well-being can offer co-benefits and pathways for the fulfillment of the SDGs (Keesstra et al., 2018; Johnson et al., 2019; Yang et al., 2020; Liu et al., 2022). Existing studies have linked ESs with SDGs systematically mainly through expert survey and network analysis. A science-policy tool using a Delphi process was developed to prioritize NCP-SDG bundles (Anderson et al., 2019). Online surveys that gather expert views on the importance of ESs to achieving the SDGs were conducted to evaluate the strengths of the SDG-ES relations (Wood et al., 2018; Yang et al., 2020). Network analysis was used to unravel the relationship between cryosphere services and SDGs based on the chain of causal effects and cascading effects (Zhang et al., 2022a). Additionally, bibliometric network analysis was also applied to explore the connections between ESs and SDGs (Hawken et al., 2021).
Twelve SDGs and 41 targets were identified to be closely related to 16 ESs (Wood et al., 2018). Food provision, water provision, carbon storage, and habitat & biodiversity were recognized as critical services contributing to >14 SDG targets, especially in SDG6 (Clean Water and Sanitation), SDG13 (Climate Action), SDG14 (Life Below Water), and SDG15 (Life on Land) (Wood et al., 2018; Yang et al., 2020). Water provision, water regulation, climate regulation and research & education among the cryosphere services were found to have strong contributions to SDG1 (No Poverty), SDG 2 (Zero Hunger), SDG 6 (Clean Water), SDG11 (Sustainable Cities and Communities), SDG12 (Responsible Production and Consumption) and SDG15 (Life on Land) (Zhang et al., 2022a). Different types of ESs contribute different amounts to SDGs. Even a single ES may benefit multiple SDGs, e.g. soil conservation is perceived to benefit SDG6 (Clean Water and Sanitation), SDG13 (Climate Action), and SDG15 (Life on Land) (Yin et al., 2022). Improved food provision contributed to SDG1 (No Poverty), SDG2 (Zero Hunger), and SDG13 (Climate Action), whereas, under scenarios tested in the Volta basin, losses in other ESs such as erosion control had negative consequences toward SDG15 (Life on Land), SDG6 (Clean Water), and SDG3 (Good Health) (Johnson et al., 2019). These all showed strong linkages between ESs and SDGs. However, few studies have assessed the progress of SDGs through the ES-SDG linkages. Therefore, it is vital to integrate ESs into the assessment of SDGs in order to identify critical ESs and SDGs for decision-making.
The Beijing-Tianjin-Hebei region (BTH) is one of the most developed areas in Northern China (Zhou et al., 2018). Socioeconomic development progressed considerably in the BTH over recent decades. The proportion of urban population has grown from 39% to 69%, the area of construction land has grown 57%, and GDP has grown 8-fold between 2000 and 2020 (National Bureau of Statistics of China, 2001; National Bureau of Statistics of China, 2021). However, environmental problems such as sandstorms, air pollution, water pollution, and soil erosion have also placed considerable pressure on the BTH (Yang et al., 2019b). Eco-environment protection has been strengthened since 2010. The rate of land urbanization has been controlled (Tian et al., 2020). Previous studies found that some important ESs such as sandstorm prevention and water retention have been improved in the BTH, and the SDG Index score continuously increased over this period (Ouyang et al., 2016; Wang et al., 2019; Xu et al., 2020). However, how the changes in ESV affect the achievement of SDGs in the BTH is still unclear. Here we analyzed the spatial-temporal changes of the value of 11 ESs and the ESV in the BTH at the county level from 2000 to 2020. Twelve SDG and ES-SDG Index scores were assessed based on the “ES-SDG linkages” (Wood et al., 2018). Critical ESs and SDGs were identified to inform land-use management and sustainable development in the BTH and other regions.
2 Materials and Methods
2.1 Study Area
BTH is located in northeastern China between 36°05′–42°40′N and 113°27′–119°50′E (Figure 1). It comprises 13 cities and covers an area of about 218,000 km2. BTH has a population of 110.37 million and a gross domestic product (GDP) of 8,639.32 billion yuan, accounting for 7.8% and 8.5% of the total Chinese population and GDP, respectively, in 2020. The geographical elevation descends from the northwest to the southeast. A variety of ecosystem types can be found in the BTH. Forestland and grassland, accounting for 21% and 16% of the total land area of BTH, respectively, are mainly distributed in the north and west where there is the Bashang Plateau, and the Yanshan and Taihang Mountains. The southeast is a wide plain where cropland (46%) predominates, whereas water areas and wetlands (4%) are mainly distributed in the alluvial coastal plain near the Bohai Sea. The study area was determined to be 153 counties (districts) excluding municipal district in the BTH.
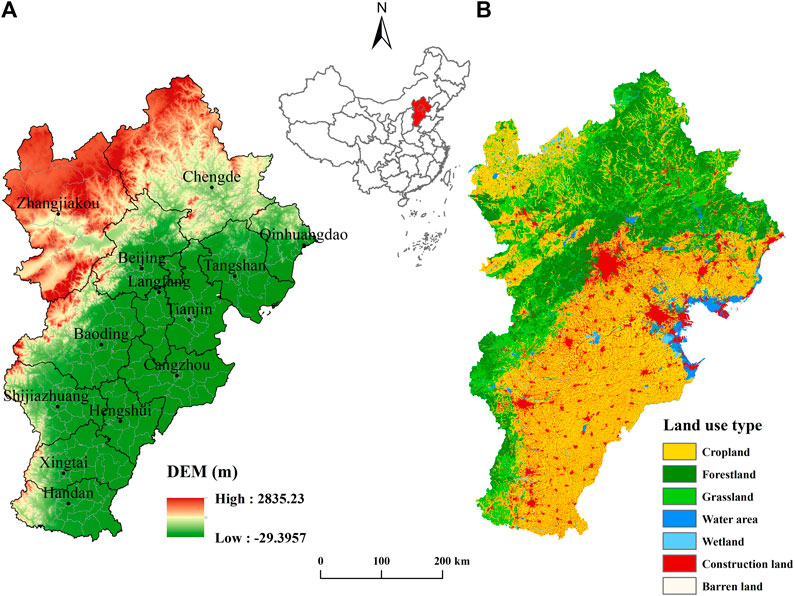
FIGURE 1. Location of the Beijing-Tianjin-Hebei region. (A) Administrative boundary and elevation. (B) Land use type in 2020.
2.2 Quantifying and Mapping ESV
Many studies have been performed on the evaluation of ESV (Costanza et al., 1997; de Groot et al., 2012; Gashaw et al., 2018). The equivalent factor method (Xie et al., 2003; Xie et al., 2017), based on a survey of 500 Chinese ecological experts, is widely used in ESV evaluations in China (Jiang et al., 2021). The method classifies ESs into 11 types: food provision (FP), raw material (RM), water provision (WP), air quality regulation (AQR), climate regulation (CR), waste treatment (WT), water regulation (WR), erosion prevention (EP), nutrient cycling (NC), habitat & biodiversity (HB), and cultural services (CS). The economic value of the standard equivalent factor for ESV is equal to 1/7th of the market value of national average food crops output per unit area (Hu et al., 2021). The area, yield, and price of the crops in 2020 were selected to calculate the economic value of the standard equivalent factor. The equation is as follows:
where VC0 is the economic value of the standard equivalent factor for ESV per unit area, n is the different crops (rice, wheat, and corn), pi is the yield of different crops, qi is the price of different crops, and m is the total area of all crops.
The calculation result of VC0 in the BTH was 2406.5 yuan ha−1. The value of individual ESs and the total ESV were calculated based on the following equation and mapped using ArcGIS10.7.
where AESVf and AESV refer to the value of ES type “f” and the total ESV per unit area, Ak is the area for the land-use “k,” ECfk is the equivalent coefficient for land-use “k” and ES type “f,” and S is the total land-use area. Given the different land-use types in the BTH, the equivalent coefficients for each ESV per unit area were listed in Table 1 (Xie et al., 2017).

TABLE 1. The equivalent coefficients for ecosystem service value per unit area in the Beijing-Tianjin-Hebei region.
2.3 Scoring ES-SDG Index
The ESV were standardized on a scale of 0–100 using min-max normalization.
Referring to the results of an expert survey on the contributions of 16 ESs to 44 targets across 12 SDGs conducted by Wood et al., 2018, we revised the contribution of 11 ESs to 12 SDGs: SDG1 (No Poverty), SDG2 (Zero Hunger), SDG3 (Good Health and Well-Being), SDG6 (Clean Water and Sanitation), SDG7 (Affordable and Clean Energy), SDG8 (Decent Work and Economic Growth), SDG9 (Industry, Innovation and Infrastructure), SDG11 (Sustainable Cities and Communities), SDG12 (Responsible Production and Consumption), SDG13 (Climate Action), SDG14 (Life Below Water), SDG15 (Life on Land) (Figure 2). SDG4 (Quality Education), SDG5 (Gender Equity), SDG10 (Reduced inequalities), SDG16 (Peace, justice and strong institution), SDG17 (Partnerships for the goals) and the other 125 targets were excluded since there was no clear environmental connection. Based on the “ES-SDG linkages”, the SDG score was calculated as follows (Chen et al., 2022):
where SDGj is the SDG j score, Tf, j is the number of ES-SDG target linkages under the SDG j, and xf and yj are the weights of ESj and targets within the SDG j, respectively. In assuming that every ES and target has the same priority within each SDG, x and y were set to 1. For example, there were three targets (1.1, 1.2, and 1.5) under SDG1, which were strongly supported by the five ESs (food provision, raw materials, water provision, habitat & biodiversity, and cultural services) (Figure 2). Consequently, the SDG1 score could be expressed as [(ESfood provision × 3) + (ESraw materials × 3) + (ESwater provision × 3) + (EShabitat & biodiversity × 3) + (EScultural services × 3)]/(3 + 3 + 3 + 3 + 3).
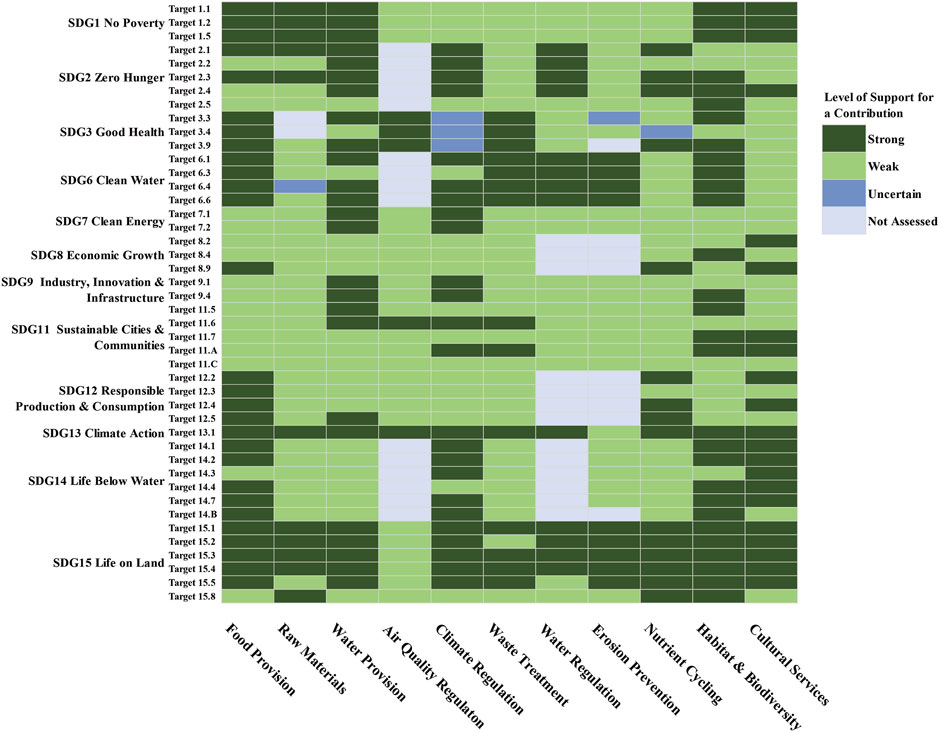
FIGURE 2. ES-SDG linkages (modified from Wood et al., 2018).
The integrated ES-SDG Index score was calculated as follows:
where m is the number of all evaluated SDGs.
2.4 Data Resources
Land-use data in 2000, 2010, and 2020 with a resolution of 30 m were obtained from the Resource and Environmental Science and Data Center of the Chinese Academy of Sciences (https://www.resdc.cn/). It was generated by manual visual interpretation from Landsat TM remote sensing images. The crop areas and crop yields were collected from the China Statistical Yearbook. The crop prices were collected from the Ministry of Agriculture and Rural Affairs of China (http://www.moa.gov.cn/).
3 Results
3.1 Changes of Land Use
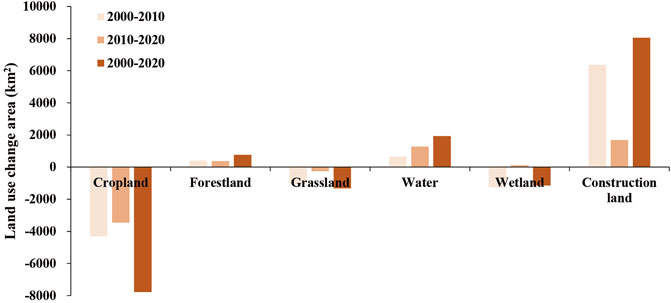
The land use of the BTH changed dramatically in terms of the cropland and construction land from 2000 to 2020 (Figure 3). Cropland decreased the most (7,775 km2), followed by grassland (1,323 km2) and wetland (1,143 km2). Construction land increased the most (8,058 km2), followed by water (1,927 km2) and forestland (765 km2). However, the construction land increased much less in the 2010s than 2000s. The decrease of cropland and grassland also slowed in the 2010s. The wetland increased from 2010 to 2020.
3.2 Spatial-Temporal Changes of ESV
3.2.1 Spatial-Temporal Changes of Individual ESV
The value of 11 ESs in the BTH showed different spatial variation (Figure 4). WR had the largest ESV in the BTH among the 11 ESs, followed by CR and EP, whereas the WP and NC had low ESV. The high-value areas of FP were concentrated in the southeastern BTH and the northwest of Zhangjiakou with dense cropland. The high-value areas of WP and WR were distributed in the eastern and northern BTH with large waters and wetlands. The high-value areas of the other eight ESs such as CR, EP, and HB were gathered in the north and western BTH with abundant forestland.
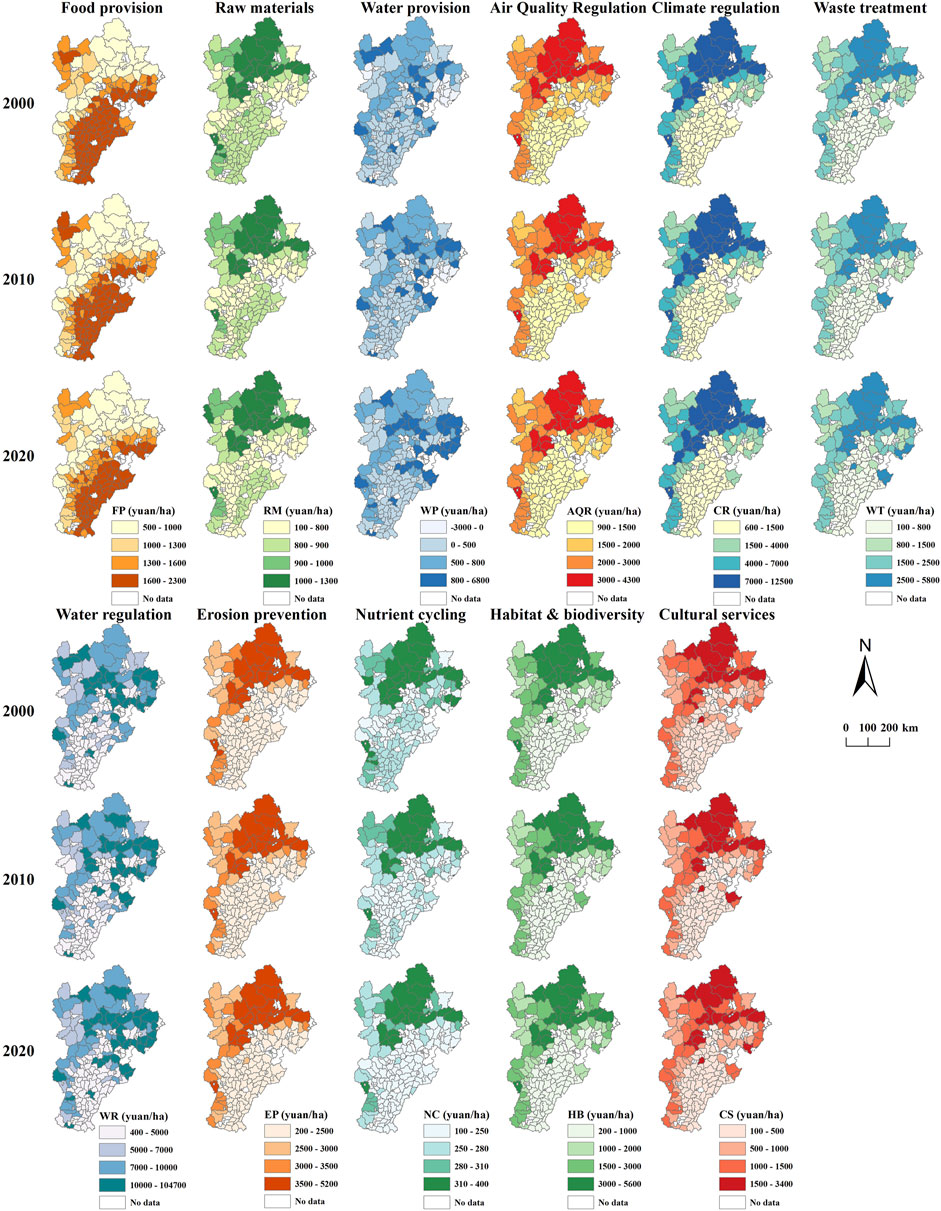
FIGURE 4. Spatial patterns of the individual ecosystem service values in the Beijing-Tianjin-Hebei region.
The value of four ESs increased, whereas the value of seven ESs decreased from 2000 to 2020 (Figure 5). The value of WP, WR, WT, and CR increased by 56.86%, 24.59%, 4.94%, and 0.55%, respectively. The value of FP, RM, AQR, and NC have continuously declined between 2000 and 2020, with decreased rates of 6.51%, 2.23%, 3.00%, and 4.56%, respectively. During 2000–2020, the Bohai Rim of the eastern BTH and Yanshan Mountain of the northern BTH improved the value of WT and WR significantly, whereas the southeastern BTH, especially the suburbs of Baoding, Shijiazhuang, and Handan decreased the value of FP, RM, and NC significantly. Additionally, the value of AQR in the suburbs of Beijing and Tianjin decreased (Figure 4).
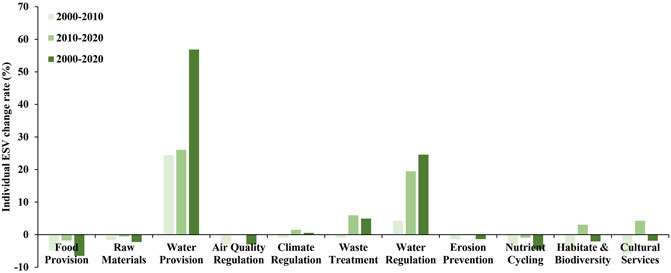
FIGURE 5. Temporal changes in individual ecosystem service values in the Beijing-Tianjin-Hebei region.
3.2.2 Spatial-Temporal Changes of the Total ESV
The high-value areas of the total ESV in the BTH were mainly found in Yanshan Mountain, Bashang Plateau, and Bohai Rim plain, where there were rich forests or wetlands, whereas low-value areas were distributed in the southern plain where most areas were cropland (Figure 6). 53% of counties increased the ESV notably from 2000 to 2020, especially counties in the Bohai Rim region. In contrast, some counties in the northwestern mountains such as Zhangjiakou and on the southern plain such as Hengshui experienced a decreased ESV. The Shenze county of Shijiazhuang had the maximum decline, of 37%. The ESV in different areas showed different changes between the 2 decades. The ESV in most areas of the BTH decreased from 2000 to 2010, especially the southern plain and suburbs of big cities, whereas the ESV in the southern plain and central BTH increased from 2010 to 2020. However, the northern plateau experienced a decreased ESV between 2010 and 2020. Overall, the total ESV of the BTH increased from 25,335 yuan ha−1 in 2000 to 27,344 yuan ha−1 in 2020, representing a growth of 7.93%.
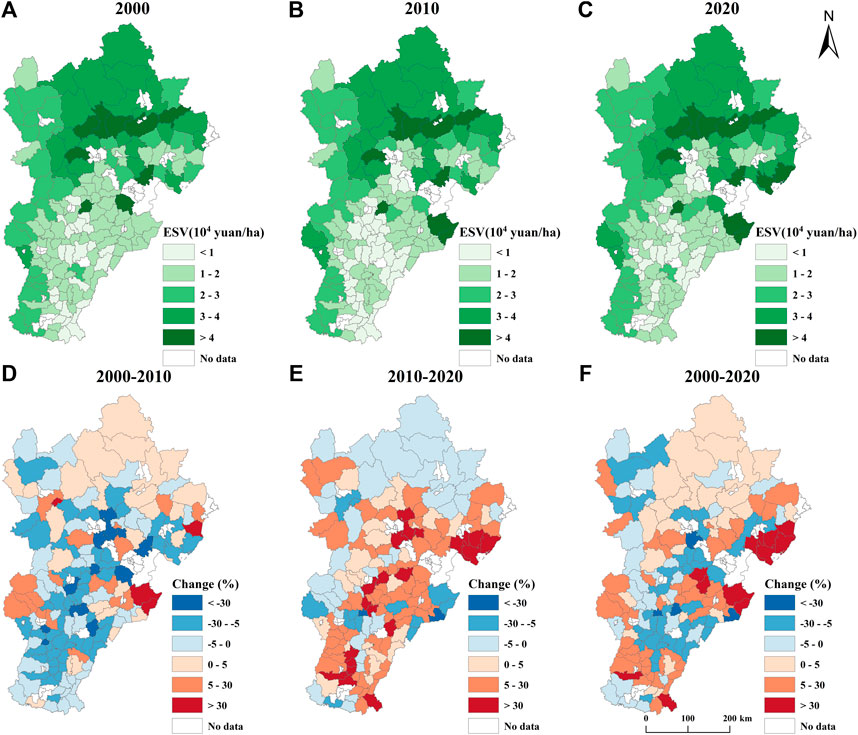
FIGURE 6. Spatial-temporal changes in total ecosystem service values in the Beijing-Tianjin-Hebei region.
3.3 Spatial-Temporal Changes of ES-SDG Index Scores
3.3.1 Spatial-Temporal Changes of Individual SDG Scores
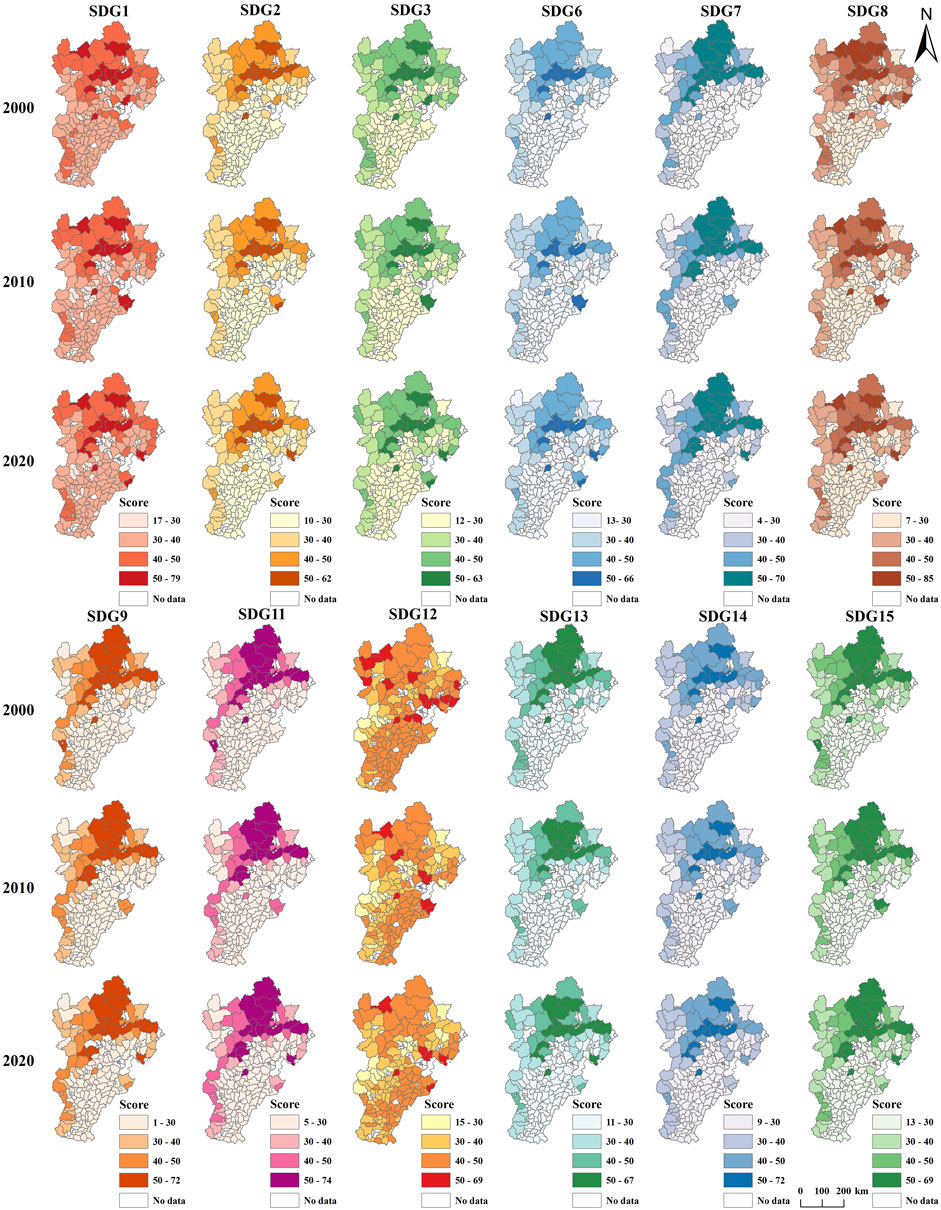
The scores of 11 SDGs (excluding SDG12) in the BTH showed a similar spatial pattern of high in the north and western mountains and low in the south (Figure 7). SDG1, SDG12, and SDG15 had the best performance in the BTH, whereas SDG6 and SDG11 performed poorly. The individual SDG scores in most of the counties in the southern BTH decreased from 2000 to 2010, whereas 30 counties, mainly located in Beijing, Shijiazhuang, Xingtai and Baoding increased all individual SDG scores from 2010 to 2020.
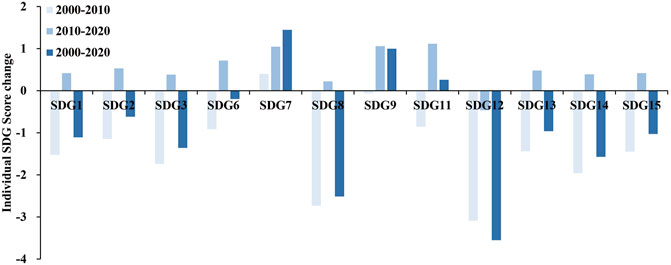
SDG7, SDG9, and SDG11 scores increased, whereas the other eight SDG scores, especially SDG12, SDG8, and SDG14, decreased between 2000 and 2020 (Figure 8). The SDG7 score increased steadily and SDG12 score decreased continuously from 2000 to 2020. Ten SDG scores showed a trend of decline between 2000 and 2010 and a rise between 2010 and 2020 in the BTH.
3.3.2 Spatial-Temporal Changes of ES-SDG Index Scores
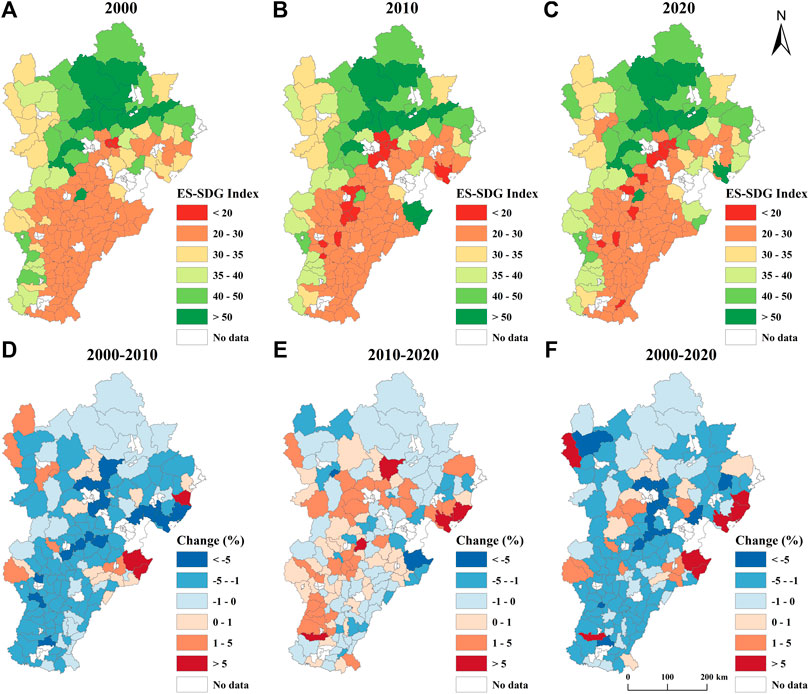
The ES-SDG Index score of counties in the northern plateau were high and the counties in the southern plain were low (Figure 9). The ES-SDG Index score of the entire BTH decreased slightly from 36.8 in 2000 to 35.5 in 2010, and then increased to 36.0 in 2020. 84% of counties exhibited a decrease in the ES-SDG Index score between 2000 and 2020. The areas that declined most notably were mainly found in the suburbs of big cities, of which Daxing District of Beijing declined the most (48.7%). Conversely, the counties near the Bohai Sea increased their ES-SDG Index scores substantially, with Caofeidian District increasing the most (86.7%). ES-SDG Index scores in most of the BTH decreased from 2000 to 2010, whereas 50% of counties, especially counties in Beijing, Baoding, Shijiazhuang, and Tangshan increased from 2010 to 2020.
4 Discussion
4.1 Impacts of Land Use Change on ESV and ES-SDG Index Scores
Land use change alters the ESV and ES-SDG Index scores through the cascade process of “structure-process-function-service-sustainability” (Chen et al., 2022). The decrease of cropland, grassland, and wetland in the BTH between 2000 and 2010 caused a decrease in the value of nine ESs, such as food provision, air quality regulation and nutrient cycling, whereas the increase of forestland, waterbodies and wetland between 2010 and 2020 contributed to an increase in the value of seven ESs, such as water provision, water regulation, waste treatment, and climate regulation. Although the value of seven ESs declined between 2000 and 2020, the total ESV of the BTH increased by 7.93% due to the increase in waterbodies and forestland that have very high equivalent coefficients (Zhang et al., 2015; Xie et al., 2017).
The ES-SDG Index score in the BTH showed a downward trend between 2000 and 2010 and an upward trend between 2010 and 2020, attributed to the urbanization and eco-environment protection policies. Rapid urbanization led to a large amount of cropland being converted to construction land, which resulted in the continuous decline of the value of food provision (Zhou et al., 2018; Wang et al., 2019). Expansion of construction land was controlled from 2010 for “New-Type Urbanization” (Zhao et al., 2018). Forestland and waterbodies were continuously expanded as a result of the implementation of the “Grain to Green Program” and “Beijing-Tianjin Sandstorm Source Control Project” since 2000 in the BTH (Bryan et al., 2018; Yang et al., 2019b). Increase of climate regulation, waste treatment, and erosion prevention were also found in another study in the BTH for growth of forestland (Tian et al., 2020). Water provision, waste treatment, and water regulation increased notably in the coastal areas due to wetland conservation and conversion of paddy fields to dry land (Ma et al., 2019; Zhang et al., 2019). Meanwhile, the restoration of forestland and waterbodies in rural areas has rapidly increased the ESV, offsetting the reduction of ESV caused by the expansion of urban construction land (Zhou et al., 2018).
Except for the improvement of SDG7, SDG9, and SDG11 scores between 2000 and 2020, the remaining 9 SDG scores declined, of which SDG8, SDG12, and SDG14 declined the most. According to “ES-SDG linkages,” water provision and climate regulation made strong contributions to SDG7, SDG9, and SDG11. Therefore, the increasing value of water provision and climate regulation in the BTH contributed to the improvement of SDG7, SDG9, and SDG11. Food provision, nutrient cycling, habitat & biodiversity, and cultural services made strong contributions to SDG8, SDG12, and SDG14. Therefore, the decrease of food provision, nutrient cycling, habitat & biodiversity, and cultural services caused the decrease of SDG8, SDG12 and SDG14. Overall, the changes of individual SDG and ES-SDG Index scores in the BTH was mainly due to food provision, water provision, climate regulation, nutrient cycling, habitat & biodiversity, and cultural services. The study in the Yangtze River Economic Belt also showed that the increase of SDG Index score was mainly attributed to the improvement of food and water provision (Chen et al., 2022).
4.2 Implications for Sustainable Development Management
ESs directly affected the performance of SDGs in the BTH. The trade-offs between provisioning services and regulating services, and the synergies between regulating services and supporting services, indicated that sound land-use management is required to enhance the synergies among multiple ESs (Yang et al., 2019a; Shen et al., 2020). Although the total ESV in the BTH increased from 2000 to 2020, seven of 11 ESs still decreased and 47% of areas experienced a decline in their ESV, especially the value of food provision and nutrient cycling in the southern plain and suburbs of big cities. Urbanization provides a driving force for socioeconomic development. However, it may have negative impacts on the realization of SDGs by occupying prime cropland and destroying ecological land (Zhang D. et al., 2017; Qiu et al., 2021). It is necessary to control the disorderly expansion of construction land. Land consolidation can release cropland for large-scale farming and promote food production in the southern BTH (Duan et al., 2021; Wang et al., 2021). The northern plateau and western mountains are important ecological barriers in the BTH which also achieved high scores in SDGs. However, the ESV of the north and west decreased from 2010 to 2020. Ecosystem conservation and restoration in the Yanshan-Taihang Mountains and Bashang Plateau should be strengthened through gross ecosystem product (GEP) accounting and transregional compensation payment for ecosystem services (Zhang L. et al., 2017; Ouyang et al., 2020). Additionally, lessons can learned from the “Paddy Land-to-Dry Land” program successfully conducted in Miyun Reservoir Watershed, Beijing to protect water quantity and quality in the BTH (Zheng et al., 2013).
The big cities such as Beijing have boosted its economy at the overuse of ESs and greatly increased demand for food, water and energy (Cumming et al., 2014). Advanced technologies and cleaner production facilities need to be deployed to improve water and nutrient use efficiency for SDG6 implementation (Wang et al., 2022). It is suggested to raise investment in ecological infrastructure, such as rehabilitating wetlands, to resist natural disasters and reduce environmental pollution for SDG11 implementation (Cumming et al., 2017). The score of SDG7 has increased steadily whereas the score of SDG12 has decreased continuously over the past 20 years, which was consistent with the findings at the provincial level in China (Zhang et al., 2022b). SDG6, SDG11, and SDG12 should be prioritized to advance the synergistic development of SDGs in the BTH.
4.3 Limitations
This study attempts to integrate ESs into SDGs assessment. However, the equivalent factor method based on land-use structure to quantify ESs has certain limitations due to the dynamic and complex nature of ecosystems (Zhang et al., 2020). Furthermore, the ES-SDG Index score based on the environmental indicators cannot fully reflect the progress of SDGs, especially in terms of socioeconomics.
5 Conclusions
Progress towards the SDGs was evaluated based on the “ES-SDG linkages” to detect the impact of ES change on SDGs in the BTH between 2000 and 2020. The total ESV and ES-SDG Index score in the BTH showed a spatial pattern of high in the north and western mountains, and low in the south. The total ESV increased from 25,335 yuan ha−1 in 2000 to 27,344 yuan ha−1 in 2020, and the improvement of ESV was mainly attributed to water provision and water regulation. However, the ES-SDG Index score decreased slightly from 36.8 in 2000 to 35.5 in 2010, and increased to 36.0 in 2020. Both ESV and ES-SDG Index scores showed obvious stage differences. In most counties, the ESV and ES-SDG Index scores decreased in the first 10 years and increased in the latter 10 years due to the phased differences in BTH’s urbanization and environmental protection policies. SDG1, SDG12, and SDG15 had the best performance, whereas SDG6 and SDG11 performed poorly. Ten SDG scores showed a trend of decline between 2000 and 2010 and a rise between 2000 and 2020 in the BTH. SDG7 scores increased steadily, attributed to the increase of water provision and climate regulation, whereas the SDG12 score declined continuously, attributed to the decrease of food provision and nutrient cycling. Our study indicated that regulating services are the core function of ESs in the BTH, and the changes of SDG and ES-SDG Index scores mainly depended on food provision, water provision, climate regulation, nutrient cycling, habitat & biodiversity, and cultural services. The assessment of SDGs suggests that SDG6, SDG11, and SDG12 should be prioritized to advance the synergistic development of SDGs in the BTH.
Data Availability Statement
The raw data supporting the conclusion of this article will be made available by the authors, without undue reservation.
Author Contributions
SH and YY designed and wrote the manuscript. SH, AL, KL, and CM analyzed the data and draw the figures. YY and RS contributed to supervision, funding, reviewing and editing.
Funding
This work was supported by the National Natural Science Foundation of China (grant number 42001264) and the Science and Technology Innovation Project of Chinese Academy of Agricultural Sciences (grant number 2021-CXGC-SRG).
Conflict of Interest
The authors declare that the research was conducted in the absence of any commercial or financial relationships that could be construed as a potential conflict of interest.
Publisher’s Note
All claims expressed in this article are solely those of the authors and do not necessarily represent those of their affiliated organizations, or those of the publisher, the editors and the reviewers. Any product that may be evaluated in this article, or claim that may be made by its manufacturer, is not guaranteed or endorsed by the publisher.
References
Anderson, C. B., Seixas, C. S., Barbosa, O., Fennessy, M. S., Díaz-José, J., and Herrera-F., B. (2019). Determining Nature's Contributions to Achieve the Sustainable Development Goals. Sustain. Sci. 14 (2), 543–547. doi:10.1007/s11625-018-0643-5
Bryan, B. A., Gao, L., Ye, Y., Sun, X., Connor, J. D., Crossman, N. D., et al. (2018). China's Response to a National Land-System Sustainability Emergency. Nature 559 (7713), 193–204. doi:10.1038/s41586-018-0280-2
Chen, D., Zhao, Q., Jiang, P., and Li, M. (2022). Incorporating Ecosystem Services to Assess Progress towards Sustainable Development Goals: A Case Study of the Yangtze River Economic Belt, China. Sci. Total Environ. 806, 151277. doi:10.1016/j.scitotenv.2021.151277
Cochran, F., Daniel, J., Jackson, L., and Neale, A. (2020). Earth Observation-Based Ecosystem Services Indicators for National and Subnational Reporting of the Sustainable Development Goals. Remote Sens. Environ. 244, 111796. doi:10.1016/j.rse.2020.111796
Costanza, R., d'Arge, R., de Groot, R., Farber, S., Grasso, M., Hannon, B., et al. (1997). The Value of the World's Ecosystem Services and Natural Capital. Nature 387 (6630), 253–260. doi:10.1038/387253a0
Costanza, R., Daly, L., Fioramonti, L., Giovannini, E., Kubiszewski, I., Mortensen, L. F., et al. (2016). Modelling and Measuring Sustainable Wellbeing in Connection with the UN Sustainable Development Goals. Ecol. Econ. 130, 350–355. doi:10.1016/j.ecolecon.2016.07.009
Cumming, G. S., Buerkert, A., Hoffmann, E. M., Schlecht, E., von Cramon-Taubadel, S., and Tscharntke, T. (2014). Implications of Agricultural Transitions and Urbanization for Ecosystem Services. Nature 515 (7525), 50–57. doi:10.1038/nature13945
Cumming, T. L., Shackleton, R. T., Förster, J., Dini, J., Khan, A., Gumula, M., et al. (2017). Achieving the National Development Agenda and the Sustainable Development Goals (SDGs) through Investment in Ecological Infrastructure: A Case Study of South Africa. Ecosyst. Serv. 27, 253–260. doi:10.1016/j.ecoser.2017.05.005
de Groot, R., Brander, L., van der Ploeg, S., Costanza, R., Bernard, F., Braat, L., et al. (2012). Global Estimates of the Value of Ecosystems and Their Services in Monetary Units. Ecosyst. Serv. 1 (1), 50–61. doi:10.1016/j.ecoser.2012.07.005
Duan, J., Ren, C., Wang, S., Zhang, X., Reis, S., Xu, J., et al. (2021). Consolidation of Agricultural Land Can Contribute to Agricultural Sustainability in China. Nat. Food 2 (12), 1014–1022. doi:10.1038/s43016-021-00415-5
Fu, B. (2020). Promoting Geography for Sustainability. Geogr. Sustain. 1 (1), 1–7. doi:10.1016/j.geosus.2020.02.003
Gashaw, T., Tulu, T., Argaw, M., Worqlul, A. W., Tolessa, T., and Kindu, M. (2018). Estimating the Impacts of Land Use/land Cover Changes on Ecosystem Service Values: The Case of the Andassa Watershed in the Upper Blue Nile Basin of Ethiopia. Ecosyst. Serv. 31, 219–228. doi:10.1016/j.ecoser.2018.05.001
Geijzendorffer, I. R., Cohen-Shacham, E., Cord, A. F., Cramer, W., Guerra, C., and Martín-López, B. (2017). Ecosystem Services in Global Sustainability Policies. Environ. Sci. Policy 74, 40–48. doi:10.1016/j.envsci.2017.04.017
Guerry, A. D., Polasky, S., Lubchenco, J., Chaplin-Kramer, R., Daily, G. C., Griffin, R., et al. (2015). Natural Capital and Ecosystem Services Informing Decisions: From Promise to Practice. Proc. Natl. Acad. Sci. U.S.A. 112 (24), 7348–7355. doi:10.1073/pnas.1503751112
Hawken, S., Rahmat, H., Sepasgozar, S. M. E., and Zhang, K. (2021). The SDGs, Ecosystem Services and Cities: A Network Analysis of Current Research Innovation for Implementing Urban Sustainability. Sustainability 13 (24), 14057. doi:10.3390/su132414057
Hu, Z., Yang, X., Yang, J., Yuan, J., and Zhang, Z. (2021). Linking Landscape Pattern, Ecosystem Service Value, and Human Well-Being in Xishuangbanna, Southwest China: Insights from a Coupling Coordination Model. Glob. Ecol. Conservation 27, e01583. doi:10.1016/j.gecco.2021.e01583
Huan, Y., Liang, T., Li, H., and Zhang, C. (2021). A Systematic Method for Assessing Progress of Achieving Sustainable Development Goals: A Case Study of 15 Countries. Sci. Total Environ. 752, 141875. doi:10.1016/j.scitotenv.2020.141875
IPBES (2019). Global Assessment Report on Biodiversity and Ecosystem Services of the Intergovernmental Science-Policy Platform on Biodiversity and Ecosystem Services. Bonn, Germany: IPBES secretariat.
Jiang, W., Wu, T., and Fu, B. (2021). The Value of Ecosystem Services in China: A Systematic Review for Twenty Years. Ecosyst. Serv. 52, 101365. doi:10.1016/j.ecoser.2021.101365
Johnson, J. A., Jones, S. K., Wood, S. L. R., Chaplin‐Kramer, R., Hawthorne, P. L., Mulligan, M., et al. (2019). Mapping Ecosystem Services to Human Well‐being: a Toolkit to Support Integrated Landscape Management for the SDGs. Ecol. Appl. 29 (8). doi:10.1002/eap.1985
Keesstra, S., Nunes, J., Novara, A., Finger, D., Avelar, D., Kalantari, Z., et al. (2018). The Superior Effect of Nature Based Solutions in Land Management for Enhancing Ecosystem Services. Sci. Total Environ. 610-611, 997–1009. doi:10.1016/j.scitotenv.2017.08.077
Liu, X., Zhao, W., Liu, Y., Hua, T., Hu, X., and Cherubini, F. (2022). Contributions of Ecological Programs to Sustainable Development Goals in Linzhi, over the Tibetan Plateau: A Mental Map Perspective. Ecol. Eng. 176. doi:10.1016/j.ecoleng.2021.106532
Ma, T., Li, X., Bai, J., Ding, S., Zhou, F., and Cui, B. (2019). Four Decades' Dynamics of Coastal Blue Carbon Storage Driven by Land Use/land Cover Transformation under Natural and Anthropogenic Processes in the Yellow River Delta, China. Sci. Total Environ. 655, 741–750. doi:10.1016/j.scitotenv.2018.11.287
National Bureau of Statistics of China (2001). China Statistical Yearbook 2001. Beijing: China Statistical Press.
National Bureau of Statistics of China (2021). China Statistical Yearbook 2021. Beijing: China Statistical Press.
Ouyang, Z., Song, C., Zheng, H., Polasky, S., Xiao, Y., Bateman, I. J., et al. (2020). Using Gross Ecosystem Product (GEP) to Value Nature in Decision Making. Proc. Natl. Acad. Sci. U.S.A. 117 (25), 14593–14601. doi:10.1073/pnas.1911439117
Ouyang, Z., Zheng, H., Xiao, Y., Polasky, S., Liu, J., Xu, W., et al. (2016). Improvements in Ecosystem Services from Investments in Natural Capital. Science 352 (6292), 1455–1459. doi:10.1126/science.aaf2295
Pires, A. P. F., Rodriguez Soto, C., and Scarano, F. R. (2021). Strategies to Reach Global Sustainability Should Take Better Account of Ecosystem Services. Ecosyst. Serv. 49, 101292. doi:10.1016/j.ecoser.2021.101292
Qiu, H., Hu, B., and Zhang, Z. (2021). Impacts of Land Use Change on Ecosystem Service Value Based on SDGs Report--Taking Guangxi as an Example. Ecol. Indic. 133, 108366. doi:10.1016/j.ecolind.2021.108366
Sachs, J., Kroll, C., Lafortune, G., Fuller, G., and Woelm, F. (2021). Sustainable Development Report 2021. Cambridge: Cambridge University Press.
Schmidt-Traub, G., Kroll, C., Teksoz, K., Durand-Delacre, D., and Sachs, J. D. (2017). National Baselines for the Sustainable Development Goals Assessed in the SDG Index and Dashboards. Nat. Geosci. 10 (8), 547–555. doi:10.1038/ngeo2985
Shen, J., Li, S., Liang, Z., Liu, L., Li, D., and Wu, S. (2020). Exploring the Heterogeneity and Nonlinearity of Trade-Offs and Synergies Among Ecosystem Services Bundles in the Beijing-Tianjin-Hebei Urban Agglomeration. Ecosyst. Serv. 43, 101103. doi:10.1016/j.ecoser.2020.101103
Tian, Y., Zhou, D., and Jiang, G. (2020). Conflict or Coordination? Multiscale Assessment of the Spatio-Temporal Coupling Relationship between Urbanization and Ecosystem Services: The Case of the Jingjinji Region, China. Ecol. Indic. 117, 106543. doi:10.1016/j.ecolind.2020.106543
UNEP (2021). Making Peace with Nature—A Scientific Blueprint to Tackle the Climate, Biodiversity and Pollution Emergencies. Nairobi: UNEP Secretariat.
Wang, J., Zhou, W., Pickett, S. T. A., Yu, W., and Li, W. (2019). A Multiscale Analysis of Urbanization Effects on Ecosystem Services Supply in an Urban Megaregion. Sci. Total Environ. 662, 824–833. doi:10.1016/j.scitotenv.2019.01.260
Wang, M., Janssen, A. B. G., Bazin, J., Strokal, M., Ma, L., and Kroeze, C. (2022). Accounting for Interactions between Sustainable Development Goals Is Essential for Water Pollution Control in China. Nat. Commun. 13 (1). doi:10.1038/s41467-022-28351-3
Wang, S., Bai, X., Zhang, X., Reis, S., Chen, D., Xu, J., et al. (2021). Urbanization Can Benefit Agricultural Production with Large-Scale Farming in China. Nat. Food 2 (3), 183–191. doi:10.1038/s43016-021-00228-6
Wood, S. L. R., Jones, S. K., Johnson, J. A., Brauman, K. A., Chaplin-Kramer, R., Fremier, A., et al. (2018). Distilling the Role of Ecosystem Services in the Sustainable Development Goals. Ecosyst. Serv. 29, 70–82. doi:10.1016/j.ecoser.2017.10.010
Wu, J. (2013). Landscape Sustainability Science: Ecosystem Services and Human Well-Being in Changing Landscapes. Landsc. Ecol. 28 (6), 999–1023. doi:10.1007/s10980-013-9894-9
Xie, G., Lu, C., Leng, Y., Zheng, d., and Li, S. (2003). Ecological Assets Valuation of the Tibetan Plateau. J. Nat. Resour. 18 (2), 189–196.
Xie, G., Zhang, C., Zhen, L., and Zhang, L. (2017). Dynamic Changes in the Value of China's Ecosystem Services. Ecosyst. Serv. 26, 146–154. doi:10.1016/j.ecoser.2017.06.010
Xu, Z., Chau, S. N., Chen, X., Zhang, J., Li, Y., Dietz, T., et al. (2020). Assessing Progress towards Sustainable Development over Space and Time. Nature 577(7788), 74. doi:10.1038/s41586-019-1846-3
Yang, S., Zhao, W., Liu, Y., Cherubini, F., Fu, B., and Pereira, P. (2020). Prioritizing Sustainable Development Goals and Linking Them to Ecosystem Services: A Global Expert's Knowledge Evaluation. Geogr. Sustain. 1 (4), 321–330. doi:10.1016/j.geosus.2020.09.004
Yang, Y., Zheng, H., Kong, L., Huang, B., Xu, W., and Ouyang, Z. (2019a). Mapping Ecosystem Services Bundles to Detect High- and Low-Value Ecosystem Services Areas for Land Use Management. J. Clean. Prod. 225, 11–17. doi:10.1016/j.jclepro.2019.03.242
Yang, Y., Zheng, H., Xu, W., Zhang, L., and Ouyang, Z. (2019b). Temporal Changes in Multiple Ecosystem Services and Their Bundles Responding to Urbanization and Ecological Restoration in the Beijing-Tianjin-Hebei Metropolitan Area. Sustainability 11 (7), 2079. doi:10.3390/su11072079
Yin, C., Zhao, W., Cherubini, F., and Pereira, P. (2021). Integrate Ecosystem Services into Socio-Economic Development to Enhance Achievement of Sustainable Development Goals in the Post-pandemic Era. Geogr. Sustain. 2 (1), 68–73. doi:10.1016/j.geosus.2021.03.002
Yin, C., Zhao, W., and Pereira, P. (2022). Soil Conservation Service Underpins Sustainable Development Goals. Glob. Ecol. Conservation 33, e01974. doi:10.1016/j.gecco.2021.e01974
Zhang, D., Huang, Q., He, C., and Wu, J. (2017a). Impacts of Urban Expansion on Ecosystem Services in the Beijing-Tianjin-Hebei Urban Agglomeration, China: A Scenario Analysis Based on the Shared Socioeconomic Pathways. Resour. Conservation Recycl. 125, 115–130. doi:10.1016/j.resconrec.2017.06.003
Zhang, J., Qu, M., Wang, C., Zhao, J., and Cao, Y. (2020). Quantifying Landscape Pattern and Ecosystem Service Value Changes: A Case Study at the County Level in the Chinese Loess Plateau. Glob. Ecol. Conservation 23, e01110. doi:10.1016/j.gecco.2020.e01110
Zhang, J., Wang, S., Zhao, W., Meadows, M. E., and Fu, B. (2022b). Finding Pathways to Synergistic Development of Sustainable Development Goals in China. Humanit Soc. Sci. Commun. 9 (1). doi:10.1057/s41599-022-01036-4
Zhang, J., Zhang, W., Liu, S., and Kong, W. (2022a). Cryosphere Services to Support SDGs in High Mountains. Sustainability 14 (2), 791. doi:10.3390/su14020791
Zhang, L., Peng, J., Liu, Y., and Wu, J. (2017b). Coupling Ecosystem Services Supply and Human Ecological Demand to Identify Landscape Ecological Security Pattern: A Case Study in Beijing-Tianjin-Hebei Region, China. Urban Ecosyst. 20 (3), 701–714. doi:10.1007/s11252-016-0629-y
Zhang, L., Zhen, Q., Cheng, M., and Ouyang, Z. (2019). The Main Drivers of Wetland Changes in the Beijing-Tianjin-Hebei Region. Ijerph 16 (14), 2619. doi:10.3390/ijerph16142619
Zhang, Y., Zhao, L., Liu, J., Liu, Y., and Li, C. (2015). The Impact of Land Cover Change on Ecosystem Service Values in Urban Agglomerations along the Coast of the Bohai Rim, China. Sustainability 7 (8), 10365–10387. doi:10.3390/su70810365
Zhao, Z., Bai, Y., Wang, G., Chen, J., Yu, J., and Liu, W. (2018). Land Eco-Efficiency for New-type Urbanization in the Beijing-Tianjin-Hebei Region. Technol. Forecast. Soc. Change 137, 19–26. doi:10.1016/j.techfore.2018.09.031
Zheng, H., Robinson, B. E., Liang, Y.-C., Polasky, S., Ma, D.-C., Wang, F.-C., et al. (2013). Benefits, Costs, and Livelihood Implications of a Regional Payment for Ecosystem Service Program. Proc. Natl. Acad. Sci. U.S.A. 110 (41), 16681–16686. doi:10.1073/pnas.1312324110
Keywords: ecosystem service values, sustainable development goals, urbanization, ecological restoration, land-use management
Citation: Hu S, Yang Y, Li A, Liu K, Mi C and Shi R (2022) Integrating Ecosystem Services Into Assessments of Sustainable Development Goals: A Case Study of the Beijing-Tianjin-Hebei Region, China. Front. Environ. Sci. 10:897792. doi: 10.3389/fenvs.2022.897792
Received: 16 March 2022; Accepted: 25 April 2022;
Published: 10 May 2022.
Edited by:
Yongsheng Wang, Institute of Geographic Sciences and Natural Resources Research (CAS), ChinaCopyright © 2022 Hu, Yang, Li, Liu, Mi and Shi. This is an open-access article distributed under the terms of the Creative Commons Attribution License (CC BY). The use, distribution or reproduction in other forums is permitted, provided the original author(s) and the copyright owner(s) are credited and that the original publication in this journal is cited, in accordance with accepted academic practice. No use, distribution or reproduction is permitted which does not comply with these terms.
*Correspondence: Yanying Yang, eWFuZ3lhbnlpbmdAY2Fhcy5jbg==; Rongguang Shi, d2luc29tZXNreUAxNjMuY29t
†These authors have contributed equally to this work and share first authorship
 Siwei Hu1,2†
 Yanying Yang