
94% of researchers rate our articles as excellent or good
Learn more about the work of our research integrity team to safeguard the quality of each article we publish.
Find out more
ORIGINAL RESEARCH article
Front. Environ. Sci., 28 June 2022
Sec. Atmosphere and Climate
Volume 10 - 2022 | https://doi.org/10.3389/fenvs.2022.897555
 Xiao Wang1,2,6
 Jun Li1,2,3*
 Chongguo Tian4Zheng Zong4Qilu Liu5Hongxing Jiang1Tingting Li1,2,6Jing Li1,2Haoyu Jiang1,2
 Shizhen Zhao1,2
 Gan Zhang1,2,3
The formation processes and potential sources of particulate nitrate can be revealed by nitrogen (δ15N-NO3−) and oxygen (δ18O-NO3−) isotopes; however, the linkage and comparative information over a large scale is limited. In this work, the feasibility of using quartz wool disk passive air samplers (Pas-QW) to identify and quantify the nitrate concentrations and their isotopic compositions was demonstrated. The results of a simultaneous sampling campaign from March to June showed that the NO3− concentration was largely attributed to the development of the regional economies. The regional distribution of δ15N-NO3− values was due to the source changes. The decreasing trend of δ18O-NO3− values with latitude from south to north was mainly a combination of oxygen isotopic fractionation of the oxidant induced by natural factors and anthropogenic changes in O3 concentrations. Coal combustion (CC) and mobile sources (MS) have a significant contribution to NOx in the typical urban agglomerations, while the high contribution from biomass burning (BB) and biogenic soil emission (BS) was mainly in areas with high natural productivity and intensive agricultural activities. By allowing simultaneous monitoring at multiple sites and over extended periods, passive sampling complements existing techniques for studying nitrate aerosol, and the results can provide a reference for the spatial distribution of its sources and formation in the China–Indochina Peninsula (CICP).
• A new method of Pas-QW was developed to monitor NO3− concentration and its dual isotopes.
• NO3− concentration and δ15N-NO3− values were controlled by the intensity and type of the regional pollution sources.
• The latitudinal trend of δ18O-NO3− values was attributed to a combination of natural variations and anthropogenic effects.
• CC and MS have a higher contribution to NOx in urban agglomerations, but BB and BS were different.
As a substantial component of ambient particulate matter, nitrate (NO3−) has an important impact on air quality, climate change, radiative heat budget, and biogeochemical cycling of reactive nitrogen (Ipcc, 2013; Liu et al., 2013; Altieri et al., 2021). According to data from the global air quality monitoring website AirVisual in 2017, Asia is home to 20 cities with the worst air pollution in the world, and NO3− was an important contributing factor to particulate matter haze formation in cities (Ding et al., 2017; Xiao et al., 2020; Guo et al., 2021). In addition, as the precursor of NO3−, the total NOx emissions in China have exceeded 1.5 million tons per year in the past 10 years, approaching or exceeding the upper limits of the environmental carrying capacity (Fang et al., 2011; Rollins et al., 2012; Azimi et al., 2018). Therefore, knowing NO3− sources and its formation mechanisms in Asian urban cities and even in remote areas forms a necessary basis for the further control of nitrogen emissions and improvement of air quality.
The isotope technique is a powerful tool to distinguish potential sources and formation pathways of nitrate aerosols. As the precursor of NO3−, NOx emitted from various sources has unique features of nitrogen isotopic signals (δ15N), and the contribution of different sources in a mixture can be well-investigated by combining isotope techniques with stable isotope models (Hastings et al., 2009; Miller et al., 2017; Zong et al., 2018). Oxygen isotopic composition (δ18O) was often used to estimate the transformation of NOx to NO3− since the different contribution of δ18O in nitrate aerosols (δ18O-NO3−) emanate from O3 (Supplementary Text S1 in the Supporting Information; Hastings et al., 2003; Chang et al., 2018; Fan et al., 2020). However, oxygen isotopic fractionation can occur in the process of the water vapor cycle (Zhang and Yao, 1994), which may affect the δ18O-NO3− values across a large scale. Previous studies mainly focused on the evaluation of samples collected by active air samplers (AASs) in a single city or limited regions, which may lack linkage and comparative information between different functional areas under the same analytical system. Recently, studies have shown significant differences in the contributions of NOx sources between urban sites and non-urban sites (Ding et al., 2017; Guo et al., 2021; Song et al., 2021) and the discrepancy in isotopic information (δ15N and δ18O) of NO3− among five Chinese megacities (Zong et al., 2020). Thus, a multi-area simultaneous study such as passive samplers, providing a deeper understanding of distribution characteristics and influencing factors, will be an inevitable trend for further exploration of nitrate aerosols.
In the last 2 decades, passive air samplers have been widely used to monitor organic and inorganic pollutants (Demirel et al., 2014; Jiang et al., 2018; Gaga et al., 2019). Since they are more cost-effective and easier to install and maintain compared to active samplers, passive air samplers may be an ideal tool for large-scale and long-term investigations (Jiang et al., 2018; Wang et al., 2021). Based on this knowledge, we recently developed a new method for monitoring atmospheric particulate matter by using the quartz wool disk passive air sampler (Pas-QW), and the ability of this sampler to provide time-integrated measurements of atmospheric sulfate was confirmed (Wang et al., 2021). As one kind of quartz fiber with a larger specific surface area, Pas-QW can provide a better measurement of particulate matter (PM) and is in contrast with other studies. This provides a good example for monitoring nitrate and its isotopes in the atmosphere.
Combined with passive sampling technologies, it is possible to conduct source-diagnostic observations based on stable nitrogen and oxygen isotopes over a large scale. The objectives of this study are to 1) develop a method for measuring atmospheric NO3− collected by the Pas-QW collector, 2) conduct a campaign of passive air sampling in CICP to assess the spatial distribution of NO3− concentrations and its stable isotope compositions, and 3) combine the Bayesian model to quantitatively apportion the contribution of each source.
A schematic of the Pas-QW used in this study is shown in Supplementary Figure S1,S2. The sampler consists of a quartz wool disk (14.0 cm diameter, 1.35 cm thickness, and 1.0 g mass), which was placed inside the pan and covered with a stainless-steel mesh (1 × 1 cm). For the uptake study, two batches of Pas-QW from different time periods were arranged in the field deployments for better contrast. The first batch of 15 passive samplers was set up and deployed in Yantai (YT) from January to April 2019, with every three parallel Pas-QW collecting at 15, 29, 44, 60, and 77 d intervals over the period. The second batch of 18 passive samplers was set up and deployed in Guangzhou (GZ) from October to December 2020, with every three parallel Pas-QW collecting at 15, 29, 41, 53, 62, and 74 d intervals (Supplementary Table S1,S2,S3). Neither of the sampling sites had any obvious point emission sources nearby. During field sampling, the AAS was operated continuously alongside passive sampling throughout the calibration exercise. The AAS was set at an identical height to deploy the passive sampler, and total suspended particle samples were collected on prebaked quartz fiber filters. The samples were collected for a 2–5-day duration at a stable flow rate of 300 L/min. Because of inevitable factors such as power interruption, heavy rainfall, and typhoons, the active sampling time did not completely match the retrieval time of the Pas-QW samplers. Therefore, the average concentrations of NO3− obtained from active sampling during the corresponding Pas-QW deployment time were used as the reference air concentrations during the calibration exercise. Detailed information on the calibration exercise is provided in Supplementary Text S2.
A total of 27 air-monitoring stations were selected as sampling sites in China from March to June in 2017, and 11 air-monitoring stations were selected in the Indochina Peninsula (ICP) from March to June in 2016. These included 25 urban sites, 10 rural or suburban sites, and three background sites. Detailed information and basic parameters of each sampling site are provided in Supplementary Table S4,S5. The air samplers were assembled at the deployment sites to avoid contamination during the transport process. After deployment, these quartz wool disks were retrieved, resealed, and transported back to Guangzhou for storage.
The quartz wool disk samples were soaked in Milli-Q water, ultrasonically extracted for 30 min, and then the extracts were filtered. Ionic species were measured via ion chromatography (Dionex ICS3000; Dionex Ltd., Sunnyvale, CA, United States) based on the reported analysis method (Zong et al., 2018). The analytical precision determined from the replicates was less than 5% for each ion. The detection limits were within the range of 0.01–0.05 μg/m3 for anions and 0.02–0.07 μg/m3 for cations. Blank values were used for calibration (Supplementary Text S3).
The δ15N and δ18O values of NO3− were determined by the N2O isotope analysis method (Mcilvin and Altabet, 2005). Briefly, NO3− extracted from the filter was reduced to NO2− using cadmium powder, and then NO2− was further reduced to N2O using sodium azide in an acetic acid buffer. δ15N and δ18O were analyzed using an isotope ratio mass spectrometer (MAT253; Thermo Fisher Scientific, Waltham, MA, United States). The detected δ15N and δ18O values (‰) were corrected by multi-point correction (r2 = 0.999) based on international reference standards (IAEA-NO3−, USGS32, USGS34, and USGS35) and reported in the standard delta notation relative to the Vienna Canyon Diablo Troilite standard. The standard deviation of the isotopic measurements for both standards and samples was less than 0.35‰ for δ15N and 0.70‰ for δ18O. In addition, NO2− concentrations in the quartz wool disk samples were usually less than 1% of that of NO3−; therefore, they were neglected in the δ15N and δ18O analyses.
The Bayesian mixing model could use stable isotopes to identify the probability distribution of the contributions of each source to a mixture and explicitly explain the uncertainty, which is associated with multiple sources, fractionation, and isotopic signatures (Parnell et al., 2013). Recently, the Bayesian model (MixSIR) was improved by incorporating the isotopic fractionation of the equilibrium/Leighton reaction, thereby constructing a suitable NOx source apportionment model (Zong et al., 2020). In our study, coal combustion (13.7 ± 4.6‰), biomass burning (1.0 ± 4.1‰), mobile sources (−7.2 ± 7.8‰), and microbial processes (−35.4 ± 10.7‰) were confirmed as the major contributors to NOx in the CICP (Supplementary Text S4 and Supplementary Table S6). The details of the isotopic fractionation are discussed in Supplementary Text S5 and Supplementary Table S7.
The uptake profiles of NO3− over time are shown in Figure 1A for both YT and GZ, with raw data and detailed information presented in Supplementary Table S1 and Supplementary Text S2. Linear uptakes of NO3− for Pas-QW during the calibration exercise period were found by good linear correlations between the values of uptake volume and deployment time. The average sampling rate was 2.5 ± 1.2 m3/day, which was comparable to the recently reported sampling rates of sulfate based on Pas-QW (Wang et al., 2021). To reflect the sampling rate as much as possible, two sampling calibrations were carried out in different seasons in the North and South of China. The sampling time of YT is the northern winter with relatively low temperature, humidity, and light intensity, which can cause relatively low oxidant concentration and low NOx oxidation rate in the atmosphere, thereby reducing the atmospheric NO3− concentration. The sampling time of GZ is the southern autumn characterized by low NOx concentration, but the high oxidant concentration caused by the relatively high temperature, humidity, and light intensity can increase atmospheric NO3− concentration. Although the growth trend of nitrate collected in the two cities is slightly different, the capture by Pas-QW both increased linearly over the period and the difference in sampling rates was not statistically significant (p > 0.05). This suggested that the Pas-QW offered a feasible tool for monitoring studies and the sampling rate was stable and not greatly affected by atmospheric NO3− concentration. In addition, the sampling rate is not only affected by the physical and chemical properties of the target compound but also influenced by atmospheric conditions. Information on the correlation between sampling rates and environmental and meteorological parameters is given in Supplementary Table S2. The results showed that the correlation between the sampling rate and these basic parameters is not significant, indicating that the influence of changes on meteorological parameters may be weakened during the long-term sampling process and would not have a great impact on the time-weighted average concentration.
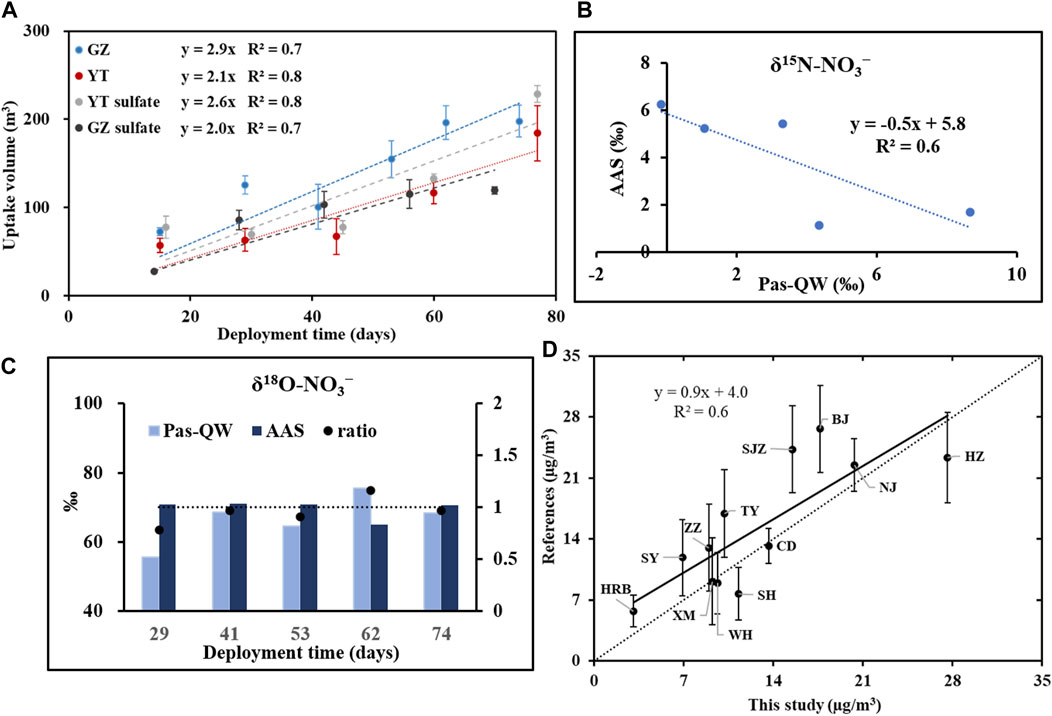
FIGURE 1. During the calibration exercise, (A) equivalent air volumes for nitrate and sulfate using Pas-QW in Yantai and Guangzhou field sites, (B) comparison of δ15N-NO3− values collected by Pas-QW and the AAS for GZ, (C) comparison of δ18O-NO3− values collected by Pas-QW and AAS for GZ, and (D) concentrations of NO3− in the literatures and this study at twelve sites.
The isotopic information (δ15N and δ18O) of NO3− collected with Pas-QW and AAS is presented in Figure 1B and Figure 1C, respectively, with raw data listed in Supplementary Table S3. Only the values for GZ were compared to avoid the isotopic fractionation effects due to unavoidable factors such as transportation or long-term storage. A considerable discrepancy in δ15N-NO3− values was observed between Pas-QW and AAS at 29-, 41-, 53-, 62-, and 74-d intervals. Considering the uncertainty caused by the adsorption of nitric acid gas during sampling (Zhang and Mcmurry, 1992; Schaap et al., 2004), the δ15N-NO3− values collected by the AAS are generally slightly depleted than those collected by Pas-QW (Figure 1B). However, the δ15N-NO3− values collected by Pas-QW were linearly enriched over 74 days, indicating that nitrate mainly collected with alkali metals has been retained in the quartz wool disk due to the evaporation of semi-volatile ammonium nitrate (Zhang and Mcmurry, 1992; Schaap et al., 2004). Comparing the time-averaged δ15N-NO3− values collected by Pas-QW and the AAS during the sampling period, the correlation (δ15NAAS-NO3− = -0.5×δ15NPas-QW-NO3− + 5.8, r = 0.6) between the two samplers is reasonable. Therefore, to ensure comparability, the δ15N-NO3− values collected by Pas-QW in this study have been corrected to those of AAS using this equation. As for the δ18O of nitrate aerosol, there was no significant difference in δ18O-NO3− values between Pas-QW and the AAS during the sampling period (Figure 1C). The two were in the same order of magnitude, and the variability of each period was between 0.9 and 1.2, indicating that the oxygen isotopes collected by Pas-QW were basically consistent with those collected by the AAS over the long-term sampling process.
To further verify the feasibility of Pas-QW, samples from twelve sampling sites (HRB, SY, XM, WH, SH, CD, ZZ, TY, SJZ, BJ, NJ, and HZ) were collected in March–June of 2017 and compared with those of the previous studies conducted in the same regions and in the same year. The mass size distribution of NO3− is dominated by the accumulation mode, and its concentration in PM2.5 is about 75% of that in TSP (Lijiang, 2003; Wang et al., 2003; Fang et al., 2013). The results for the collection of target compounds from both fine PM and coarse PM using Pas-QW were comparable to those of most of the previous studies conducted on PM2.5 samples, which have been corrected to the concentrations in TSP (Hong et al., 2018; Huang et al., 2018; Wang P et al., 2019; Wang Y. et al., 2019; Huang et al., 2019; Sun et al., 2019; Wu et al., 2019; Zhang et al., 2019; Wang et al., 2020; Dong et al., 2021; Liu et al., 2021; Luo et al., 2021). The comparison between the literature values and the measured values in this study is shown in Figure 1D. Two values at the same site are in the same order of magnitude, and the slope was close to 1 (R2 = 0.6). This suggested that the detected concentrations of NO3− in this study were comparable to the concentrations reported in the literature. The Pas-QW provides a direct and effective measurement of atmospheric NO3− over a large scale.
Spatial information on NO3− concentrations in the CICP is provided in Figure 2 and Supplementary Table S4. During the sampling period, the temperature, relative humidity, and wind speed were within the ranges 9.1–35.1°C (21.5 ± 7.3°C), 36.0–84.0% (63.4 ± 14.0%), and 0.9–3.8 m/s (2.4 ± 0.8 m/s), respectively. The meteorological parameters of these sampling sites were comparable to the range of the calibration exercise time, except for a few sites. Among the 38 sampling sites, the average NO3− concentration in the ICP (6.4 ± 2.3 μg/m3) was slightly lower than that in China (7.8 ± 5.0 μg/m3). Higher values typically appeared in urban sites (8.8 ± 4.5 μg/m3), followed by rural sites (5.3 ± 2.8 μg/m3) and background sites (2.7 ± 0.4 μg/m3). Analysis of variance showed that there was a significant difference between the NO3− concentrations of different functional areas (p < 0.05). The lowest NO3− concentration was in Alxa, which was located in the northwest of China, with a vast area surrounded by desert. The highest NO3− concentration was in Hangzhou, located in the Yangtze River Delta in China. As a major commercial and financial center in mainland China, it has a prosperous economy, with thriving industrial activity and rapidly developing tourism (Tian et al., 2018; Jin et al., 2021). The spatial distribution of NO3− concentrations was largely attributed to the development of the regional economies, and cities with intensive human activities usually have higher NO3− concentrations. A similar phenomenon was found in the NOx emission study derived from satellite observations (Supplementary Figure S3) (Ding et al., 2017).
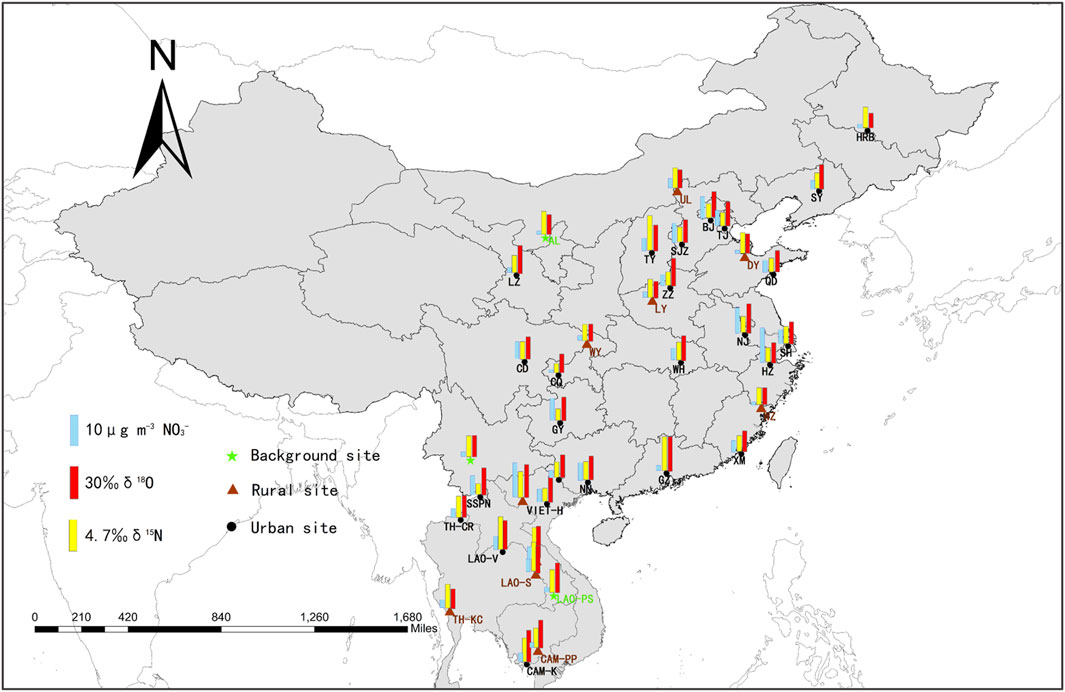
FIGURE 2. Spatial distribution of NO3− concentrations, δ15N, and δ18O in 38 sampling sites of the CICP. The NO3−concentrations, δ15N, and δ18O values are indicated by blue, yellow, and red bar, respectively.
In terms of its isotopic compositions, the average δ15N-NO3− values in China (4.9 ± 1.6‰) were lower than those in the ICP (6.4 ± 1.6‰). The values in background sites (6.1 ± 0.2‰) and rural sites (6.1 ± 1.3‰) are higher than those in urban sites (4.9 ± 1.8‰). The highest δ15N-NO3− value was in Taiyuan (9.5‰), which was located in central China, and the contribution of the coal industry to total production is more than one third (Yearbook S. S, 2018). The lowest δ15N-NO3− value was in Chongqing (2.5‰), located in the Sichuan Basin, with large populations and intensive agricultural activities (Yearbook S. S, 2018). The average δ18O-NO3− value in this study was 42.3 ± 8.5‰, which is consistent with that of the previous studies in the same season (Su et al., 2020; Zong et al., 2020). The values of background sites (41.5 ± 7.6‰), rural sites (40.2 ± 10.8‰), and urban sites (43.2 ± 7.3‰) were not significantly different (p > 0.05). The δ18O-NO3− values were largely affected by the different pathways of nitrate formation (Hastings et al., 2003; Chang et al., 2018; Fan et al., 2020). According to the global models, the contribution of the •OH generation pathway to nitrate production was equal to that of the N2O5 generation pathway in the troposphere below 1 km altitude, especially in spring and summer, and the dominant •OH generation pathway under high OH-level conditions may result in low δ18O-NO3− values (Alexander et al., 2020; Luo et al., 2020). In addition, recent studies have shown that the peroxy radical reaction is also an important pathway for NO to NO2 conversion (Fang et al., 2011; Guha et al., 2017). These changes in the NOx oxidation pathways may lead to generally low δ18O-NO3− values in the atmosphere.
In the atmosphere, NO3− is mainly produced by the conversion of NOx, which exhibits different δ15N-NOx signatures from its distinctive emissions. As previously mentioned, NOx from coal combustion or biomass burning has higher δ15N values, while δ15N from mobile sources or microbial processes tends to be more negative (Hastings et al., 2009; Miller et al., 2017; Zong et al., 2018). During the transformation process of NOx to NO3−, the nitrogen isotopic fractionation effects on δ15N cannot be neglected (Walters et al., 2015; Walters and Michalski, 2015). Certifiably, the δ15N-NO3− values in this study had a significant correlation with temperature (r = 0.32, p < 0.05; Supplementary Table S5). According to the fractionation theory in the conversion of NOx to NO3−, changes in temperature can result in the variation of nitrogen isotopic fractionation (Walters and Michalski, 2016), which may further affect the δ15N-NO3− values. To assess the impact of temperature on the δ15N-NO3− value, we calculated the nitrogen isotopic fractionation in these regions (Supplementary Text S5 and Supplementary Table S7). The fractionation factor of δ15N for the sampling sites varied from 8.8 to 10.6‰, with a mean value of 9.7 ± 1.8‰. The nitrogen isotopic fractionation between the sites with the highest temperatures (LAO-V) and that with the lowest temperatures (HRB) was approximately 1.8‰, which is lower than the difference in real nitrogen isotope values between the two regions (3.2 ‰). This indicated that although the variation of δ15N-NO3− values was affected by isotopic fractionation, source differences were still a vital factor affecting the regional distribution of δ15N-NO3− values. The low values in urban sites and high values in background and rural sites can be attributed to increased contributions of mobile sources and coal combustion, respectively. Regional differences were also observed in five Chinese megacities based on the isotopic information and modeling (Zong et al., 2020).
Previous studies have suggested that the oxidation of NO2 by •OH (•OH + NO2) in the gas phase and the hydrolysis of N2O5 on pre-existing aerosols (N2O5+H2O, heterogeneous process) were considered to be the two main reactions controlling the formation of NO3− (Morin et al., 2009; Xiao et al., 2020). The conversion process of NO to NO2 mainly includes O3 oxidation and peroxy radical (HO2 and its organic homolog RO2) oxidation. According to the global models, we assumed that 15% of NO to NO2 conversion was through HO2/RO2 oxidation and 85% by O3 oxidation (Alexander et al., 2020). The details of oxidation pathways and balance equations are discussed in Supplementary Text S1. The use of δ18O-H2O ranges from −27.5 to 0‰, and the terminal δ18O-O3 value (δ18O-O3*) is 130.4 ± 12.9‰ (Fang et al., 2011; Vicars and Savarino, 2014). Through the temperature-dependent equilibrium isotope exchange between •OH and H2O, the resulting minimum and maximum estimates of δ18O-OH were from −67.4‰ to −41.0‰ (Walters and Michalski, 2016). Using these assumptions and equations, the expected δ18O-NO3− value for the •OH oxidation pathway is 46.5–71.4‰, and for the N2O5 pathway, it is 88.7–113.5‰. In this study, the observed δ18O-NO3− values in most regions were less than 60‰, suggesting that NOx oxidation by •OH during this period was, indeed, the dominant pathway for the formation of NO3− in the atmosphere.
The characteristics of isotope compositions and basic environmental parameters of 38 sampling sites are shown in Figure 3. The relatively high δ18O-NO3− values of China were mainly found in megacities (such as GZ, NJ, ZZ, and BJ), which were consistent with the O3 distribution in China during 2016 (Li et al., 2018). Moreover, the δ18O-NO3− values share a significant positive correlation with NO3− concentrations (r = 0.36, p < 0.05), and the spatial distribution of the latter was mainly attributed to the development of regional economies. These evidence imply that the high O3 concentrations induced by human activities increase the proportion of N2O5 heterogeneous reactions, affecting the regional distribution of δ18O-NO3− values. Using the linear regression method (Supplementary Table S5), we also found that the δ18O-NO3− values share a significant negative correlation with latitude (r = −0.43, p < 0.01). This indicated that in addition to anthropogenic factors, there are other factors that may affect the regional distribution of δ18O-NO3− values, especially when multiple functional areas were included over a large scale. The wind field in the CICP during the sampling period is provided in Supplementary Figure S4 and Supplementary Text S6. The CICP has a definitive monsoonal climate, with a prevailing approximately southerly wind from March to June. This leads to the transport of water vapor from the evaporation of tropical and subtropical oceans to higher latitudes and inland through meridional and zonal circulations (Zhang and Yao, 1994). Given the preferential condensation of heavy isotopes, oxygen isotopes in atmospheric precipitation continue to be lighter as water vapor condenses and evaporates (Dansgaard, 1964; Yuetsever, 1975). The decreasing trend of δ18O-NO3− values from south to north in the CICP was consistent with the variation of δ18O-H2O values at latitude, indicating that changes in the oxygen isotopic fractionation of the oxidant induced by natural factors may have a significant impact on the δ18O-NO3− values over a large spatial scale.
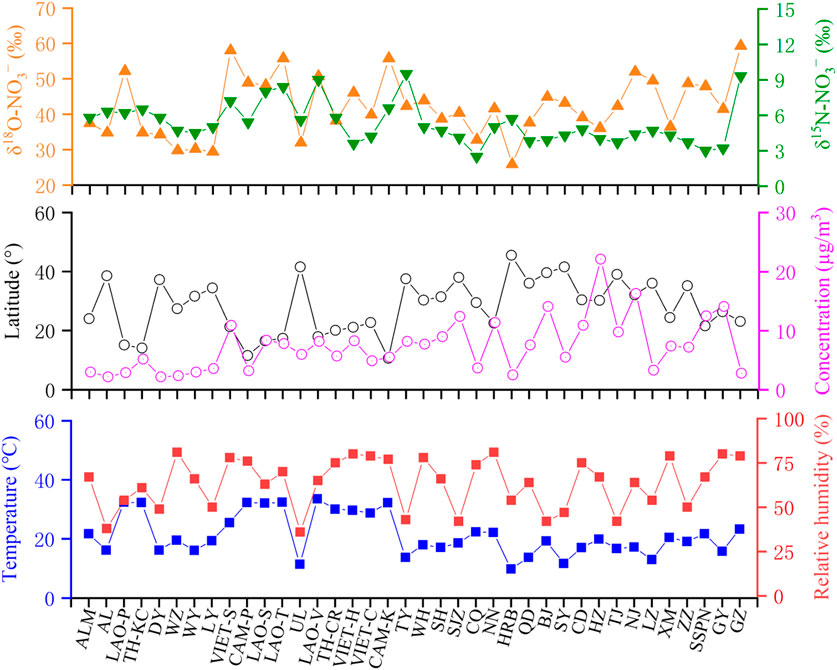
FIGURE 3. Characteristics of (A) δ15N-NO3− and δ18O-NO3− values, (B) NO3− concentrations and latitude, and (C) relative humidity and ambient temperature in the CICP during the sampling period.
The overall estimation showed that coal combustion was the most important source for NOx, followed by biomass burning, mobile sources, and biogenic process, with the contribution of 38.6 ± 8.0%, 25.5 ± 1.9%, 22.6 ± 2.8%, and 13.3 ± 3.4%, respectively (Supplementary Figure S5). Hence, the fractional concentration of the total NO3− that was derived from CC, BB, MS, and BS was 2.8 ± 1.6 μg/m3, 1.9 ± 1.2 μg/m3, 1.7 ± 1.1 μg/m3, and 1.0 ± 0.7 μg/m3, respectively (Figure 4). This finding was in agreement with the characteristics of energy consumption in China, which showed that coal combustion is dominant in energy combustion, but the proportion is gradually decreasing (Supplementary Figure S6). According to the “Twelfth Five-Year Plan for National Environment Protection,” 95% of all power plants in China were installed with NOx removal systems by the end of 2015 (Shang et al., 2016). NOx emissions decreased from 28 million tons in 2012 to 21 million tons in 2017, with significant proportion of the decrease attributed to the reduction in emissions from power plants (Supplementary Figure S7) (Liu et al., 2015; Li et al., 2017). The cities in Beijing–Tianjin–Hebei (BTH) and Yangtze River Delta (YRD) have higher CC concentrations, which can be partly attributed to their large populations and substantial coal consumption. In 2017, the power consumption in Jiangsu, Zhejiang, and Hebei provinces ranked second, fourth, and fifth, respectively, and their thermal power generation all exceeded 280 TWh (Yearbook C. S, 2018). In addition, GY, SSPN, and most sites in the ICP also have higher CC concentrations. These may be due to the anthropogenic emissions from local households, inefficient combustion, and the impact on the regional transmission of pollutants in the Sichuan Basin (SC), South Asia, and the northwestern Pearl River Delta. In China, residential consumption of coal has been calculated to be approximately 2.7 billion tons in 2017, and the pollution load of these households without pollution control devices would be equivalent to that of 170 billion tons of coal-fired power plants based on the emission calculation (Zhang et al., 2017). The higher CC concentrations typically appeared in urban sites (3.2 ± 1.5 μg/m3), followed by rural sites (2.3 ± 1.5 μg/m3) and background sites (1.1 ± 0.5 μg/m3). This result was consistent with that of previous research, that is, coal combustion in residential stoves was a widespread source from urban to remote areas in the CICP (Chen et al., 2017; Song et al., 2021).
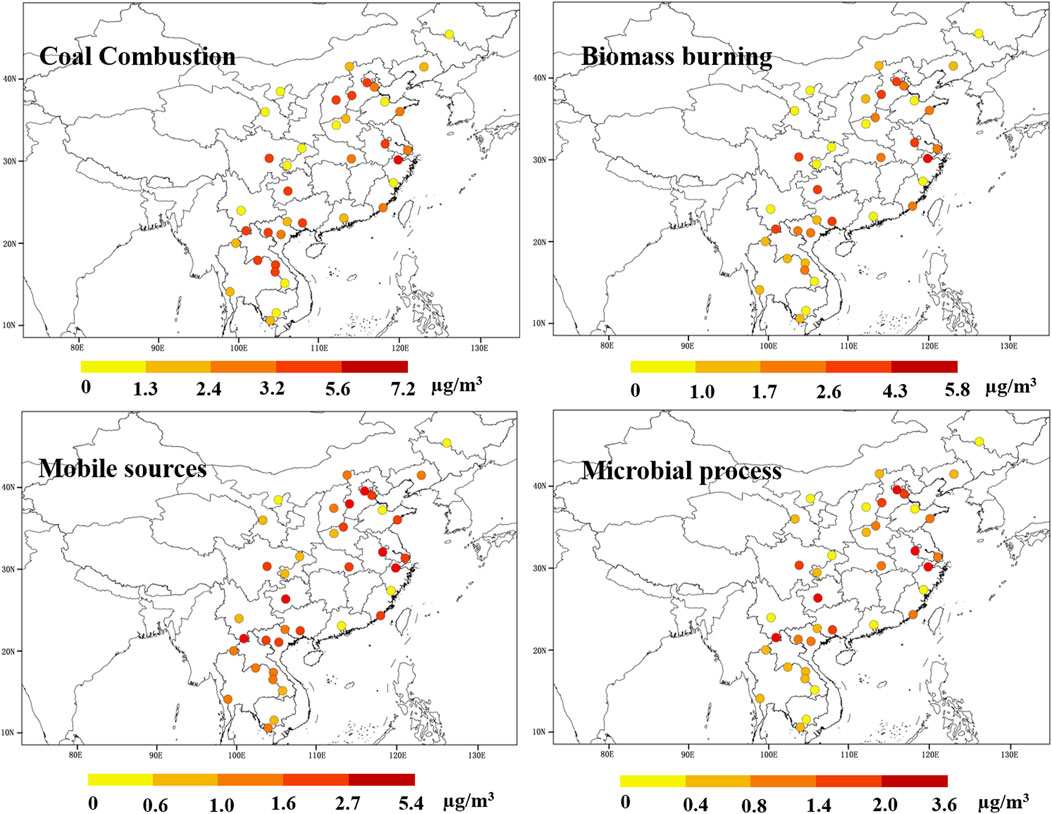
FIGURE 4. Source-divided NO3− concentrations of coal combustion, biomass burning, mobile sources, and microbial processes at the 38 sampling sites in the CICP.
The model results showed that biomass burning was the second largest contributor to NOx with the concentrations of 1.6 ± 0.5 μg/m3 and 2.0 ± 1.3 μg/m3 in the ICP and China, respectively. The higher BB concentrations were found in SC and YRD of China, which is consistent with the distribution of cultivated land (Supplementary Figure S8). In cultivated areas, agricultural wastes are usually stored as fuel for household cooking or heating, while other wastes are consumed by open burning in the fields. China ranks third in the world with 1.43 million square kilometers of arable land, and the NOx emissions induced by biomass burning increased more than six-fold from 1990 to 2013 (Li et al., 2016). The ICP is a typical high-incidence area of global biomass burning and occupies the leading position of biomass combustion pollution emission in Asia (Streets et al., 2003). The higher BB concentrations in this study may be mainly attributed to the highly concentrated combustion before farming in spring (from March to April) and various types of combustion (burning which includes natural (wildfire) and man-made forest fire (clearing forest)) (Streets et al., 2003). The high BB concentrations were observed in both rural and urban sites, indicating that biomass fuel is used as a conventional fuel and its emission intensity could not be ignored.
The mobile source was another important contributor to NOx, and high concentrations were observed in urban sites (2.1 ± 1.2 μg/m3), especially in the typical urban agglomerations such as BTH and YRD. According to automobile industry surveys, the average annual growth rate of car ownership in China reached 14% since 2009, and more than one-half of motor vehicles occurred in megacities (Yearbook C. S, 2018). Since the mass ratio of NOx/SOx from gasoline combustion and coal combustion has been estimated to be 13:1 and 1:2, respectively, the ratio of NO3−/SO42− has often been used as an indicator of automobile exhaust emissions and coal combustion (Wang et al., 2006). The mass ratio of NO3−/SO42− in this study ranged from 0.12 to 2.87, and a high NO3−/SO42− ratio in cities was consistent with the result obtained by the Bayesian model. These suggested that the explosive growth of car ownership in recent years may lead to vehicle exhaust emissions becoming an important source of NOx pollution. In addition, it has been estimated that the NOx emissions from ships in China reached 11.3% of the total emissions in recent years (Zhang et al., 2016). The high MS concentrations in this study were also observed in coastal areas, indicating that ship emissions from the Bohai Sea, the East China Sea, the South China Sea, and the Bay of Bengal may be another important mobile source. This finding was consistent with the conclusions of a maritime NOx emission study over Chinese seas based on satellite observation (Ding et al., 2018).
Microbial activity in wetlands and soils can consume accumulated nitrogen and release large pulses of NO, especially in environments with relatively high temperature and humidity (Zong et al., 2020). Thus, compared with other sources, microbial processes are more uniformly distributed in the ICP. Under high natural productivity and intensive agricultural activities, the extensive use of nitrogen fertilizers in cultivated land can lead to high NOx emission (Jaeglé et al., 2004). In addition, high MS concentrations were also observed in cities around the YRD and Bohai Bay, indicating that oceanic sources (especially in marine sediments and estuaries) may be another important component of microbial processes. Although the contribution of marine bacteria to NOx has not been widely reported, marine sediments and estuaries can be part of denitrification areas (Wankel et al., 2006). Based on the similar activity mechanism of bacteria, the oceans around the CICP may also be one of the contributors to NOx emissions.
We developed a wool disk passive air sampler to identify and quantify atmospheric nitrate concentrations and its isotopic compositions over a large scale and carried out a field study at 38 sampling sites in the CICP and then combined the measured isotope data and the Bayesian model to quantitatively apportion the contribution of NOx sources. Important findings of this study include 1) atmospheric nitrate showed nearly linear uptake profiles with the mass collected on the samplers proportional to the accumulated time, and the average sampling rate collected by Pas-QW was 2.5 ± 1.2 m3/d; 2) results of simultaneous sampling showed that the NO3− concentration and δ15N-NO3− values were controlled by the intensity and type of the regional pollution sources, and the latitudinal trend of δ18O-NO3− values was mainly a combination of oxygen isotopic fractionation of the oxidant induced by natural factors and man-induced changes of O3 concentrations; and 3) coal combustion was the most important source of NOx in the CICP, followed by biomass burning, mobile sources, and biogenic processes. Coal combustion and mobile sources have a significant contribution to NOx in typical urban agglomerations such as Beijing–Tianjin–Hebei and Yangtze River Delta, while biomass burning and biogenic soil emission contribute mainly in areas with high natural productivity and intensive agricultural activities (such as the Indochina Peninsula and Sichuan Basin). Our study, which provided a method for simultaneous monitoring at multiple sites and over extended periods, has complemented existing techniques for studying nitrate aerosol. This could be used in future regional or even global research to better understand the spatial distribution of its sources and formation.
The original contributions presented in the study are included in the article/Supplementary Material, further inquiries can be directed to the corresponding author.
XW: data curation, methodology, software, visualization, investigation, and writing—original draft, review, and editing. JL: conceptualization, methodology, software, supervision, validation, and writing—review and editing. CT: conceptualization, methodology, software, supervision, validation, and writing—review and editing. ZZ: investigation, methodology, and visualization. QL: methodology, software, supervision, and validation. HJ: investigation and methodology. TL: investigation, methodology, and visualization. JL: methodology, software, supervision, and validation. HJ: investigation and methodology. SZ: visualization and investigation. GZ: methodology, software, supervision, and validation.
This study was supported by the Natural Science Foundation of China (NSFC; No. 41977190), the Alliance of International Science Organizations (Grant No. ANSO-CR-KP-2021-05), Guangdong Foundation for Program of Science and Technology Research (Grant Nos. 2019B121205006 and 2020B1212060053), Guangzhou Foundation for Program of Science and Technology Research (No. 202102080251), and Guangdong Basic and Applied Basic Research Foundation (2021A1515011456).
The authors declare that the research was conducted in the absence of any commercial or financial relationships that could be construed as a potential conflict of interest.
All claims expressed in this article are solely those of the authors and do not necessarily represent those of their affiliated organizations, or those of the publisher, the editors, and the reviewers. Any product that may be evaluated in this article, or claim that may be made by its manufacturer, is not guaranteed or endorsed by the publisher.
The Supplementary Material for this article can be found online at: https://www.frontiersin.org/articles/10.3389/fenvs.2022.897555/full#supplementary-material
Alexander, B., Sherwen, T., Holmes, C. D., Fisher, J. A., Chen, Q., Evans, M. J., et al. (2020). Global Inorganic Nitrate Production Mechanisms: Comparison of a Global Model with Nitrate Isotope Observations. Atmos. Chem. Phys. 20 (6), 3859–3877. doi:10.5194/acp-20-3859-2020
Altieri, K., Fawcett, S., and Hastings, M. (2021). Reactive Nitrogen Cycling in the Atmosphere and Ocean. Annu. Rev. Earth Planet. Sci. 49 (1), 523–550. doi:10.1146/annurev-earth-083120-052147
Azimi, M., Feng, F., and Yang, Y. (2018). Air Pollution Inequality and its Sources in SO2 and NOX Emissions Among Chinese Provinces from 2006 to 2015. Sustainability 10 (2), 367. doi:10.3390/su10020367
Chang, Y., Zhang, Y., Tian, C., Zhang, S., Ma, X., Cao, F., et al. (2018). Nitrogen Isotope Fractionation during Gas-To-Particle Conversion of NOx to NO3- in the Atmosphere - Implications for Isotope-Based NOx Source Apportionment. Atmos. Chem. Phys. 18 (16), 11647–11661. doi:10.5194/acp-18-11647-2018
Chen, S., Xu, L., Zhang, Y., Chen, B., Wang, X., Zhang, X., et al. (2017). Direct Observations of Organic Aerosols in Common Wintertime Hazes in North China: Insights into Direct Emissions from Chinese Residential Stoves. Atmos. Chem. Phys. 17 (2), 1259–1270. doi:10.5194/acp-17-1259-2017
Dansgaard, W. (1964). Stable Isotopes in Precipitation. Tellus 16 (4), 436–468. doi:10.3402/tellusa.v16i4.8993
Demirel, G., Özden, Ö., Döğeroğlu, T., and Gaga, E. O. (2014). Personal Exposure of Primary School Children to BTEX, NO2 and Ozone in Eskişehir, Turkey: Relationship with Indoor/outdoor Concentrations and Risk Assessment. Sci. Total Environ. 473-474, 537–548. doi:10.1016/j.scitotenv.2013.12.034
Ding, J., Miyazaki, K., van der A, R. J., Mijling, B., Kurokawa, J.-i., Cho, S., et al. (2017). Intercomparison of NOx Emission Inventories over East Asia. Atmos. Chem. Phys. 17 (16), 10125–10141. doi:10.5194/acp-17-10125-2017
Ding, J., van der A, R. J., Mijling, B., Jalkanen, J.-P., Johansson, L., and Levelt, P. F. (2018). Maritime NOx Emissions over Chinese Seas Derived from Satellite Observations. Geophys. Res. Lett. 45 (4), 2031–2037. doi:10.1002/2017gl076788
Dong, Z., Yuan, M.-H., Fang-Cheng, S., Zhang, J.-F., Sun, J.-B., and Rui-Qin, Z. (2021). Spatiotemporal Variations in Fine Particulate Matter and the Impact of Air Quality Control in Zhengzhou (In Chinese). Environ. Sci. 42 (5), 2180–2188. doi:10.13227/j.hjkx.202009208
Fan, M. Y., Zhang, Y. L., Lin, Y. C., Cao, F., Zhao, Z. Y., Sun, Y., et al. (2020). Changes of Emission Sources to Nitrate Aerosols in Beijing after the Clean Air Actions: Evidence from Dual Isotope Compositions. J. Geophys. Res. Atmos. 125 (12), e2019JD031998. doi:10.1029/2019jd031998
Fang, Y. T., Koba, K., Wang, X. M., Wen, D. Z., Li, J., Takebayashi, Y., et al. (2011). Anthropogenic Imprints on Nitrogen and Oxygen Isotopic Composition of Precipitation Nitrate in a Nitrogen-Polluted City in Southern China. Atmos. Chem. Phys. 11 (3), 1313–1325. doi:10.5194/acp-11-1313-2011
Fang, G.-C., Wu, Y.-S., Lin, S. M., and Lin, C.-H. (2013). Study of Ambient Air Particulates (Particulate Matter [PM]2.5, PM10, and Total Suspended Particulates [TSP]) Ionic Species Concentrations in Asian Countries during 1995-2009. Environ. Forensics 14 (2), 121–132. doi:10.1080/15275922.2013.781083
Gaga, E. O., Harner, T., Dabek-Zlotorzynska, E., Celo, V., Evans, G., Jeong, C.-H., et al. (2019). Polyurethane Foam (PUF) Disk Samplers for Measuring Trace Metals in Ambient Air. Environ. Sci. Technol. Lett. 6 (9), 545–550. doi:10.1021/acs.estlett.9b00420
Guha, T., Lin, C. T., Bhattacharya, S. K., Mahajan, A. S., Ou-Yang, C.-F., Lan, Y.-P., et al. (2017). Isotopic Ratios of Nitrate in Aerosol Samples from Mt. Lulin, a High-Altitude Station in Central Taiwan. Atmos. Environ. 154, 53–69. doi:10.1016/j.atmosenv.2017.01.036
Guo, W., Luo, L., Zhang, Z., Zheng, N., Xiao, H., and Xiao, H. (2021). The Use of Stable Oxygen and Nitrogen Isotopic Signatures to Reveal Variations in the Nitrate Formation Pathways and Sources in Different Seasons and Regions in China. Environ. Res. 201, 111537. doi:10.1016/j.envres.2021.111537
Hastings, M. G., Sigman, D. M., and Lipschultz, F. (2003). Isotopic Evidence for Source Changes of Nitrate in Rain at Bermuda. J. Geophys. Res. Atmos. 108 (D24), 22/1–22/12. doi:10.1029/2003jd003789
Hastings, M. G., Jarvis, J. C., and Steig, E. J. (2009). Anthropogenic Impacts on Nitrogen Isotopes of Ice-Core Nitrate. Science 324 (5932), 1288. doi:10.1126/science.1170510
Hong, Y., Li, C., Li, X., Ma, Y., Zhang, Y., Zhou, D., et al. (2018). Analysis of Compositional Variation and Source Characteristics of Water-Soluble Ions in PM2.5 during Several Winter-Haze Pollution Episodes in Shenyang, China. Atmosphere 9 (7), 280. doi:10.3390/atmos9070280
Huang, X., Zhang, J., Luo, B., Wang, L., Tang, G., Liu, Z., et al. (2018). Water-soluble Ions in PM2.5 during Spring Haze and Dust Periods in Chengdu, China: Variations, Nitrate Formation and Potential Source Areas. Environ. Pollut. 243 (Pt B), 1740–1749. doi:10.1016/j.envpol.2018.09.126
Huang, F., Zhou, J., Chen, N., Li, Y., Li, K., and Wu, S. (2019). Chemical Characteristics and Source Apportionment of PM2.5 in Wuhan, China. J. Atmos. Chem. 76 (3), 245–262. doi:10.1007/s10874-019-09395-0
Ipcc (2013). “Clouds and Aerosols,” in Climate Change 2013: The Physical Science Basis. Contribution of Working Group I to the Fifth Assessment Report of the Intergovernmental Panel on Climate Change. Editors T. F. Stocker, D. Qin, G.-K. Plattner, M. Tignor, S. KAllen, J. Boschunget al. (Cambridge, United Kingdom and New York, NY, USA: Cambridge University Press).
Jaeglé, L., Martin, R. V., Chance, K., Steinberger, L., Kurosu, T. P., Jacob, D. J., et al. (2004). Satellite Mapping of Rain-Induced Nitric Oxide Emissions from Soils. J. Geophys. Res. Atmos. 109 (D21), 1–10. doi:10.1029/2004JD004787
Jiang, H., Zhong, G., Wang, J., Jiang, H., Tian, C., Li, J., et al. (2018). Using Polyurethane Foam-Based Passive Air Sampling Technique to Monitor Monosaccharides at a Regional Scale. Environ. Sci. Technol. 52 (21), 12546–12555. doi:10.1021/acs.est.8b02254
Jin, Z., Qian, L., Shi, Y., Fu, G., Li, G., and Li, F. (2021). Quantifying Major NOx Sources of Aerosol Nitrate in Hangzhou, China, by Using Stable Isotopes and a Bayesian Isotope Mixing Model. Atmos. Environ. 244, 117979. doi:10.1016/j.atmosenv.2020.117979
Li, J., Li, Y., Bo, Y., and Xie, S. (2016). High-resolution Historical Emission Inventories of Crop Residue Burning in Fields in China for the Period 1990-2013. Atmos. Environ. 138, 152–161. doi:10.1016/j.atmosenv.2016.05.002
Li, M., Zhang, Q., Kurokawa, J.-i., Woo, J.-H., He, K., Lu, Z., et al. (2017). MIX: a Mosaic Asian Anthropogenic Emission Inventory under the International Collaboration Framework of the MICS-Asia and HTAP. Atmos. Chem. Phys. 17 (2), 935–963. doi:10.5194/acp-17-935-2017
Li, X. Y., Li, S. J., Liul, P. F., Kong, Y. F., and Song, H. Q. (2018). Spatial and Temporal Variations of Ozone Concentration in China in 2016 (In Chinese). Acta Sci. Circumstantiae 38 (4), 1263–1274. doi:10.13671/j.hjkxxb.2017.0399
Liu, X., Zhang, Y., Han, W., Tang, A., Shen, J., Cui, Z., et al. (2013). Enhanced Nitrogen Deposition over China. Nature 494 (7438), 459–462. doi:10.1038/nature11917
Liu, F., Zhang, Q., Tong, D., Zheng, B., Li, M., Huo, H., et al. (2015). High-resolution Inventory of Technologies, Activities, and Emissions of Coal-Fired Power Plants in China from 1990 to 2010. Atmos. Chem. Phys. 15 (23), 13299–13317. doi:10.5194/acp-15-13299-2015
Liu, Y., Li, H., Cui, S., Nie, D., Chen, Y., and Ge, X. (2021). Chemical Characteristics and Sources of Water-Soluble Organic Nitrogen Species in PM2.5 in Nanjing, China. Atmosphere 12 (5), 574. doi:10.3390/atmos12050574
Luo, L., Pan, Y-Y., Zhu, R-G., Zhang, Z-Y., Zheng, N-J., Liu, Y-H., et al. (2020). Assessment of the Seasonal Cycle of Nitrate in PM2.5 Using Chemical Compositions and Stable Nitrogen and Oxygen Isotopes at Nanchang, China. Atmos. Environ. 225, 117371. doi:10.1016/j.atmosenv.2020.117371
Luo, L., Zhu, R.-g., Song, C.-B., Peng, J.-F., Guo, W., Liu, Y., et al. (2021). Changes in Nitrate Accumulation Mechanisms as PM2.5 Levels Increase on the North China Plain: A Perspective from the Dual Isotopic Compositions of Nitrate. Chemosphere 263, 127915. doi:10.1016/j.chemosphere.2020.127915
Mcilvin, M. R., and Altabet, M. A. (2005). Chemical Conversion of Nitrate and Nitrite to Nitrous Oxide for Nitrogen and Oxygen Isotopic Analysis in Freshwater and Seawater. Anal. Chem. 77 (17), 5589–5595. doi:10.1021/ac050528s
Miller, D. J., Wojtal, P. K., Clark, S. C., and Hastings, M. G. (2017). Vehicle NOx Emission Plume Isotopic Signatures: Spatial Variability across the Eastern United States. J. Geophys. Res. Atmos. 122 (8), 4698–4717. doi:10.1002/2016jd025877
Morin, S., Savarino, J., Frey, M. M., Domine, F., Jacobi, H. W., Kaleschke, L., et al. (2009). Comprehensive Isotopic Composition of Atmospheric Nitrate in the Atlantic Ocean Boundary Layer from 65°S to 79°N. J. Geophys. Res. 114 (D5), 1–19. doi:10.1029/2008jd010696
Parnell, A. C., Phillips, D. L., Bearhop, S., Semmens, B. X., Ward, E. J., Moore, J. W., et al. (2013). Bayesian Stable Isotope Mixing Models. Environmetrics 24 (6), 387–399. doi:10.1002/env.2221
Rollins, A. W., Browne, E. C., Min, K.-E., Pusede, S. E., Wooldridge, P. J., Gentner, D. R., et al. (2012). Evidence for NOx Control over Nighttime SOA Formation. Science 337 (6099), 1210–1212. doi:10.1126/science.1221520
Schaap, M., Spindler, G., Schulz, M., Acker, K., Maenhaut, W., Berner, A., et al. (2004). Artefacts in the Sampling of Nitrate Studied in the "INTERCOMP" Campaigns of EUROTRAC-AEROSOL. Atmos. Environ. 38 (38), 6487–6496. doi:10.1016/j.atmosenv.2004.08.026
Shang, X. G., Si, C. H., and Y, L. (2016). Industrial Policy Guiding and Development Trend of Dust Removal, Desulfurization and Denitration in the Thirteenth Five-Year Plan. China Environ. Prot. Ind. 10 (21-23), 21–23. doi:10.3969/j.issn.1006-5377.2016.10.002
Song, W., Liu, X.-Y., Hu, C.-C., Chen, G.-Y., Liu, X.-J., Walters, W. W., et al. (2021). Important Contributions of Non-fossil Fuel Nitrogen Oxides Emissions. Nat. Commun. 12 (1), 243. doi:10.1038/s41467-020-20356-0
Streets, D. G., Yarber, K. F., Woo, J. H., and Carmichael, G. R. (2003). Biomass Burning in Asia: Annual and Seasonal Estimates and Atmospheric Emissions. Glob. Biogeochem. Cycles 17 (4), 10/1–10/20. doi:10.1029/2003gb002040
Su, T., Li, J., Tian, C., Zong, Z., Chen, D., and Zhang, G. (2020). Source and Formation of Fine Particulate Nitrate in South China: Constrained by Isotopic Modeling and Online Trace Gas Analysis. Atmos. Environ. 231, 117563. doi:10.1016/j.atmosenv.2020.117563
Sun, W., Wang, D., Yao, L., Fu, H., Fu, Q., Wang, H., et al. (2019). Chemistry-triggered Events of PM2.5 Explosive Growth during Late Autumn and Winter in Shanghai, China. Environ. Pollut. 254 (Pt A), 112864. doi:10.1016/j.envpol.2019.07.032
Tian, L., Hou, W., Chen, J., Chen, C., and Pan, X. (2018). Spatiotemporal Changes in PM2.5 and Their Relationships with Land-Use and People in Hangzhou. Int. J. Environ. Res. Public Health 15 (10), 2192. doi:10.3390/ijerph15102192
Vicars, W. C., and Savarino, J. (2014). Quantitative Constraints on the 17O-Excess (Δ17O) Signature of Surface Ozone: Ambient Measurements from 50°N to 50°S Using the Nitrite-Coated Filter Technique. Geochimica Cosmochimica Acta 135, 270–287. doi:10.1016/j.gca.2014.03.023
Walters, W. W., and Michalski, G. (2015). Theoretical Calculation of Nitrogen Isotope Equilibrium Exchange Fractionation Factors for Various NOY Molecules. Geochimica Cosmochimica Acta 164, 284–297. doi:10.1016/j.gca.2015.05.029
Walters, W. W., and Michalski, G. (2016). Theoretical Calculation of Oxygen Equilibrium Isotope Fractionation Factors Involving Various NOY Molecules, OH, and H2O and its Implications for Isotope Variations in Atmospheric Nitrate. Geochimica Cosmochimica Acta 191, 89–101. doi:10.1016/j.gca.2016.06.039
Walters, W. W., Goodwin, S. R., and Michalski, G. (2015). Nitrogen Stable Isotope Composition (δ15N) of Vehicle-Emitted NOx. Environ. Sci. Technol. 49 (4), 2278–2285. doi:10.1021/es505580v
Wang, G., Wang, H., Yu, Y., Gao, S., Feng, J., Gao, S., et al. (2003). Chemical Characterization of Water-Soluble Components of PM10 and PM2.5 Atmospheric Aerosols in Five Locations of Nanjing, China. Atmos. Environ. 37 (21), 2893–2902. doi:10.1016/s1352-2310(03)00271-1
Wang, Y., Zhuang, G., Zhang, X., Huang, K., Xu, C., Tang, A., et al. (2006). The Ion Chemistry, Seasonal Cycle, and Sources of PM2.5 and TSP Aerosol in Shanghai. Atmos. Environ. 40 (16), 2935–2952. doi:10.1016/j.atmosenv.2005.12.051
Wang, Q., Fang, J., Shi, W., and Dong, X. (2020). Distribution Characteristics and Policy-Related Improvements of PM2.5 and its Components in Six Chinese Cities. Environ. Pollut. 266 (Pt 3), 115299. doi:10.1016/j.envpol.2020.115299
Wang, X., Li, J., Sun, R., Jiang, H., Zong, Z., Tian, C., et al. (2021). Regional Characteristics of Atmospheric δ34S-SO42− over Three Parts of Asia Monitored by Quartz Wool-Based Passive Samplers. Sci. Total Environ. 778, 146107. doi:10.1016/j.scitotenv.2021.146107
Wang, P., Chun, X., Wu, Y., Lizhen, G. P., Xue, C., Yu, Sh., et al. (2019). A Heavy Haze Episode in Hangzhou City in the Winter of 2017: Characteristics of PM2.5 Water-Soluble Components,causes and Origins (In Chinese). J. Zhejiang Univ. Ed. 46 (3), 346–352. doi:10.3785/j.issn.1008-9497
Wang, Y., Zhang, H., Zhai, J., Wu, Y., Cong, L., Yan, G., et al. (2019). Seasonal Variations and Chemical Characteristics of PM2.5 Aerosol in the Urban Green Belt of Beijing, China. Pol. J. Environ. Stud. 29 (1), 361–370. doi:10.15244/pjoes/104358
Wankel, S. D., Kendall, C., Francis, C. A., and Paytan, A. (2006). Nitrogen Sources and Cycling in the San Francisco Bay Estuary: A Nitrate Dual Isotopic Composition Approach. Limnol. Oceanogr. 51 (4), 1654–1664. doi:10.4319/lo.2006.51.4.1654
Wu, X., Xu, L., Hong, Y., Chen, J., Qiu, Y., Hu, B., et al. (2019). The Air Pollution Governed by Subtropical High in a Coastal City in Southeast China: Formation Processes and Influencing Mechanisms. Sci. Total Environ. 692, 1135–1145. doi:10.1016/j.scitotenv.2019.07.341
Xiao, H. W., Zhu, R. G., Pan, Y. Y., Guo, W., Zheng, N. J., Liu, Y. H., et al. (2020). Differentiation between Nitrate Aerosol Formation Pathways in a Southeast Chinese City by Dual Isotope and Modeling Studies. J. Geophys. Res. Atmos. 125 (13), e2020JD032604. doi:10.1029/2020jd032604
Zhang, X., and Mcmurry, P. H. (1992). Evaporative Losses of Fine Particulate Nitrates during Sampling. Atmos. Environ. Part A. General Top. 26 (18), 3305–3312. doi:10.1016/0960-1686(92)90347-n
Zhang, X., and Yao, T. (1994). Distribution Characteristics of Oxygen Isotope Ratio in Global Precipitation (In Chinese). J. Glaciol. Geocryol. 16 (P426612), 202–210.
Zhang, F., Chen, Y., Tian, C., Lou, D., Li, J., Zhang, G., et al. (2016). Emission Factors for Gaseous and Particulate Pollutants from Offshore Diesel Engine Vessels in China. Atmos. Chem. Phys. 16 (10), 6319–6334. doi:10.5194/acp-16-6319-2016
Zhang, Z., Gao, J., Zhang, L., Wang, H., Tao, J., Qiu, X., et al. (2017). Observations of Biomass Burning Tracers in PM2.5 at Two Megacities in North China during 2014 APEC Summit. Atmos. Environ. 169, 54–64. doi:10.1016/j.atmosenv.2017.09.011
Zhang, M., Li, Z., Xu, M., Yue, J., Cai, Z., Yung, K. K. L., et al. (2019). Pollution Characteristics, Source Apportionment and Health Risks Assessment of Fine Particulate Matter during a Typical Winter and Summer Time Period in Urban Taiyuan, China. Hum. Ecol. Risk Assess. Int. J. 26 (10), 1–14. doi:10.1080/10807039.2019.1684184
Zong, Z., Tan, Y., Wang, X., Tian, C., Fang, Y., Chen, Y., et al. (2018). Assessment and Quantification of NOx Sources at a Regional Background Site in North China: Comparative Results from a Bayesian Isotopic Mixing Model and a Positive Matrix Factorization Model. Environ. Pollut. 242 (Pt B), 1379–1386. doi:10.1016/j.envpol.2018.08.026
Keywords: China–Indochina Peninsula, passive air sampler, nitrate aerosols, nitrogen/oxygen isotope, source apportionment
Citation: Wang X, Li J, Tian C, Zong Z, Liu Q, Jiang H, Li T, Li J, Jiang H, Zhao S and Zhang G (2022) Sources and Formation of Atmospheric Nitrate Over China–Indochina Peninsula in Spring: A Perspective From Oxygen and Nitrogen Isotopic Compositions Based on Passive Air Samplers. Front. Environ. Sci. 10:897555. doi: 10.3389/fenvs.2022.897555
Received: 16 March 2022; Accepted: 05 May 2022;
Published: 28 June 2022.
Edited by:
Joseph Felix, Texas A&M University Corpus Christi, United StatesReviewed by:
Yu-Chi Lin, Nanjing University of Information Science and Technology, ChinaCopyright © 2022 Wang, Li, Tian, Zong, Liu, Jiang, Li, Li, Jiang, Zhao and Zhang. This is an open-access article distributed under the terms of the Creative Commons Attribution License (CC BY). The use, distribution or reproduction in other forums is permitted, provided the original author(s) and the copyright owner(s) are credited and that the original publication in this journal is cited, in accordance with accepted academic practice. No use, distribution or reproduction is permitted which does not comply with these terms.
*Correspondence: Jun Li, anVubGlAZ2lnLmFjLmNu
Disclaimer: All claims expressed in this article are solely those of the authors and do not necessarily represent those of their affiliated organizations, or those of the publisher, the editors and the reviewers. Any product that may be evaluated in this article or claim that may be made by its manufacturer is not guaranteed or endorsed by the publisher.
Research integrity at Frontiers
Learn more about the work of our research integrity team to safeguard the quality of each article we publish.