
94% of researchers rate our articles as excellent or good
Learn more about the work of our research integrity team to safeguard the quality of each article we publish.
Find out more
ORIGINAL RESEARCH article
Front. Environ. Sci., 25 May 2022
Sec. Environmental Informatics and Remote Sensing
Volume 10 - 2022 | https://doi.org/10.3389/fenvs.2022.897248
This article is part of the Research TopicAdvanced Numerical and Spatial Analysis of Forest and Environmental ManagementView all 9 articles
 Miloš Manić1*
 Milan Đorđević2Mrđan Đokić2Ranko Dragović2Dušan Kićović3Dejan Đorđević4,5Mihajlo Jović6Ivana Smičiklas6Snežana Dragović6
Hilly terrains characterized by the looseness of the surface soil layer and the slope of the topographic surface are subjected to diverse erosion processes, which could greatly impact forest management. An erosive process was identified along the unstable slopes in most of the Crveni potok catchment in the southeastern part of Serbia. The results of this study indicate two erosion types of variable intensity, dominated by weak and moderate erosion, while severe erosion is identified at several locations. Water pressure in the pores of loose soil in the Crveni potok catchment generates gully erosion in parts of the catchment that are geologically predisposed by the composition of the parent substrate. The paper discusses the factors influencing gully erosion, such as soil density, the slope of the topographic surface, rainfall (precipitation amount, annual distribution), and vegetation characteristics. The set of used methodologies, including remote sensing, nuclear, and geospatial ones, provided an integrated assessment of factors affecting erosion in unstable forest areas. The soil erosion rates in the study area are estimated from inventories of fallout radionuclide 137Cs using conversion models. Airborne photogrammetry, terrestrial Structure-from-Motion 360-degree camera photogrammetry, and Terrestrial LiDAR Scanning (TLS) are used to model complex geomorphological features of forest terrain. These techniques are found to be convenient for the quantification of the existing state of erosion (length, width, volume, and density of the gully systems) in the forest gullies. The remote sensing techniques provided an insight into the physiographic characteristics of the studied area important for determining its parts affected by erosion. The models obtained using different techniques are compared, techniques are evaluated, and their advantages and disadvantages are pointed out. This approach enables the identification of priority targets for soil conservation and site-specific remediation measures to foster sustainable forest management.
Soil erosion is a major environmental issue causing both on-site land degradation and off-site impacts such as sediment deposition in the watercourses. Although basically a natural process driven by climate change, soil characteristics, and topography, it can be accelerated by improper land management (Kosmas et al., 1996; Poesen 2018; Rodrigo-Comino et al., 2020; Rodrigues et al., 2021). Accelerated soil erosion and associated land degradation represent a threat not only to environmental ecosystem functions but also to socio-economic development at regional and global scales.
Undisturbed forests are generally characterized by low susceptibility to erosion. The management practices such as timber harvesting result in a decrease in evapotranspiration, increased subsurface flow, and soil compaction, increasing soil erosion and impacting forest ecosystem functioning (Yoho 1980; Romeo et al., 2020). Forest degradation by soil erosion can further affect forest services by reducing water availability, nutrients, and organic matter (FAO (Food and Agriculture Organization of the United Nations) 2011). The forest-related operation may particularly trigger the initialization of gully erosion, an important land degradation process causing on-site and off-site environmental effects such as sedimentation of eroded soils down the catchment area and consequent siltation of water bodies. Notwithstanding the adverse impacts of gully erosion on forest services, the research addressing gullies on forest land is still limited (Strunk 2003; James et al., 2007; Parkner et al., 2007).
The methods for identifying areas susceptible to soil erosion based on land use, soil quality, topography, and other factors developed in recent decades have shown acceptable results (Alewell et al., 2019; Dimotta 2019). A wide variety of methods including physical, empirical, statistical, and process-based models, have been used by many researchers to predict soil erosion worldwide (Dimotta 2019). However, some of these methods require high-density sampling, which is sometimes not feasible due to the inaccessibility of some areas and limited resources. The conception and development of remote sensing techniques have contributed to significant improvements in analyzing forest areas’ conditions, by providing accurate 3D spatial data relating to both the forest stands and characteristics of the underlying terrain (Andersen et al., 2006; Gao et al., 2020). As a cost-effective approach to survey large and inaccessible areas, remote sensing has also found its application in soil erosion studies, by detecting areas at the risk of extensive soil erosion (Xu H. et al., 2019), their mapping (Arabameri et al., 2019) and linking to the controlling factors (Garosi et al., 2018). One of the typical remote sensing products is the digital elevation model (DEM), used for geometric corrections of remotely sensed data and terrain modeling, and as such, essential input in soil erosion research and soil erosion modeling. Common remote sensing methods for obtaining DEM surfaces are satellite interferometry, photogrammetry, and light detection and ranging (LiDAR). Those models represent the Earth’s surface that contains height points of terrain, vegetation, and manmade objects. For soil erosion research, especially in the forest areas, models that are suitable for extracting terrain surface and representing a bare Earth are of great importance. The quality of the DEM directly impacts secondary products, including slope, slope length, and slope steepness, which reliability is vital for soil erosion estimations (Romshoo et al., 2021). Because topography is one of the most critical variables in soil erosion, DEMs with high spatial resolution and precision are essential (Garosi et al., 2018). High-resolution DEMs are particularly useful for smaller areas that need to be analyzed in more detail.
The concerns for problems of accelerated soil erosion and its associated impacts on forest ecosystems generated the need for reliable quantitative data on the extent of soil erosion for establishing effective soil conservation and forest management. Traditional monitoring for obtaining erosion rates, particularly erosion plots, faces numerous problems in terms of costs and representativeness of the results. The nuclear techniques, i.e., the use of fallout radionuclides (FRNs) for soil erosion assessment, possess some advantages as compared to traditional methods, such as cost-effectiveness and the possibility to derive information on soil erosion rates at a sampling retrospectively based on a single site visit (Walling et al., 2006; Mabit et al., 2008; Mabit et al., 2014). Cesium-137 is by far the most widely used radionuclide in soil erosion and sedimentation research due to its high affinity for fine soil particles, its relatively long half-life, and its relative ease of measurement (Ritchie and Mc Henry 1990; Walling and Quine 1993). Cesium-137 is an artificial radionuclide (fission product) with a half-life of 30.2 years released in the atmosphere after nuclear tests and accidental events at nuclear facilities. Most 137Cs is retained in the organic layer in forest soils, and downward migration and leaching of 137Cs in the forest floor are very slow (Rafferty et al., 2000). Soil erosion processes could be considered responsible for any subsequent redistribution of 137Cs within the landscape, making it an effective tracer of erosion and sedimentation processes. Over the years, many empirical and theoretical models have been developed for cultivated and uncultivated lands to derive estimates of rates of soil loss and soil redistribution from measurements of the increase or decrease in the soil 137Cs inventory, relative to a local reference inventory, such as models developed by Walling et al., 2006 - Proportional Model, Mass Balance Model I, II and III, Profile Distribution Model and Diffusion and Migration Model, by Arata et al. (2016a), Arata et al. (2016b) - Modelling Deposition and Erosion Rates with RadioNuclides (MODERN), by Soto and Navas (2004), Soto and Navas (2008), etc.
The integration of remote sensing and soil erosion models has proven to be an effective tool for mapping erosion-prone areas for the development of sustainable conservation plans (Prasannakumar et al., 2011; El Jazouli et al., 2017; Almasalmeh et al., 2022). However, to the authors’ best knowledge, this is the first study to apply the approach combining remote sensing and nuclear techniques in soil erosion research so far. The main objectives of this study were to: 1) to identify the erosion-prone areas using remote sensing in Crveni potok catchment; 2) to evaluate and compare the efficiency of different remote sensing methods, instruments, and software for analyses of morphometric and morphologic features of gullies identified in the investigated area; 3) to quantify the soil erosion rates using nuclear techniques and 4) to recommend site-specific forest management practices measures for reducing erosion and protecting the entire catchment area, including the forest areas and the village of Malča which is directly endangered by torrential floods and suspended sediment load.
The study area covers the Crveni potok River Basin, located in Eastern Serbia, in the border area of the mountainous system of Carpatho-Balkanides, which spreads through several countries, including neighboring Bulgaria and Romania (Figure 1). The Crveni potok is the biggest tributary of the Malčanska River, which belongs to the Nišava River system and the Black Sea drainage basin. The Crveni potok River Basin is primarily hilly, covers about 8 km2, and is elongated in the meridian direction. The basin altitude ranges from 284 m at the confluence of the Crveni potok River and the Malčanska River, to the 729 m at the northern watershed.
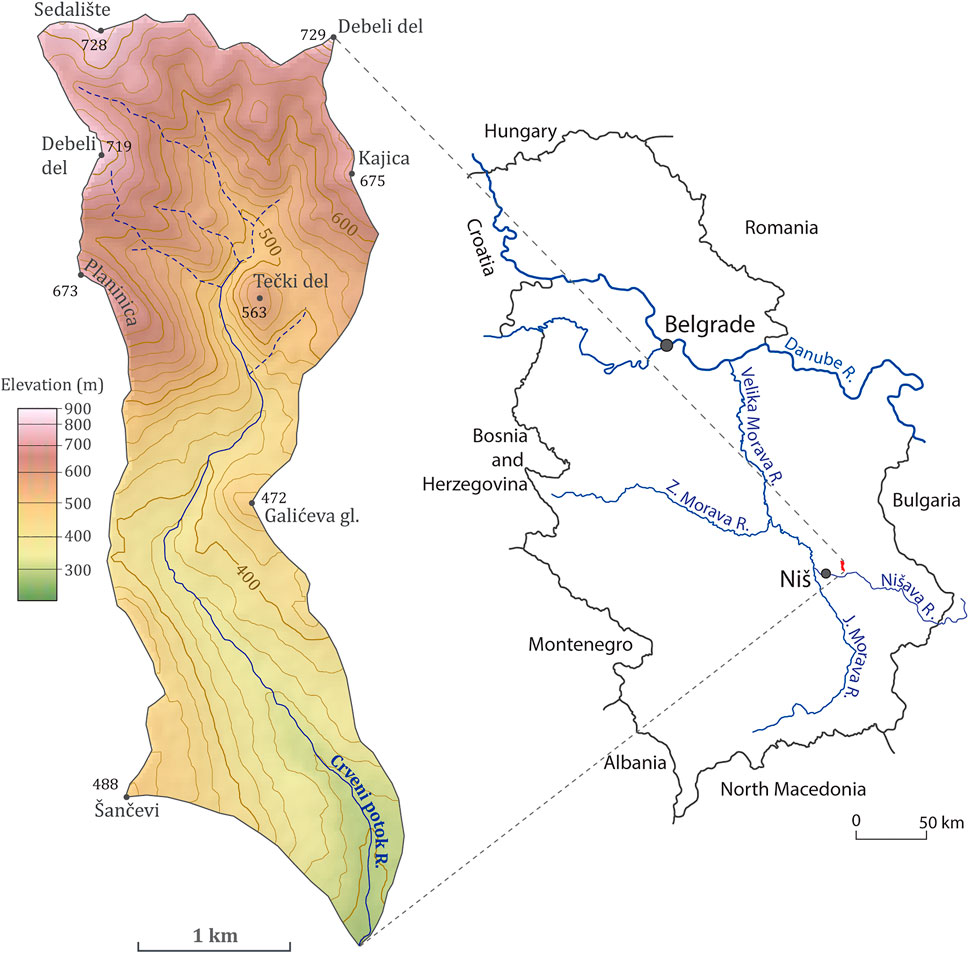
FIGURE 1. The Crveni potok River Basin and its geographical location in Serbia.
The main geographical factors of soil erosion in the Crveni potok Basin are physical characteristics of the soil, relatively large slope of the terrain, intensive rainfalls in late spring and late autumn, physical characteristics of the parent material, and vegetation. The complex geological structure of the river basin generates a variety of geomorphological forms, including the surface erosion ones. Soils in the Crveni potok River Basin result from several pedogenetic factors, but it seems that the most important is the geological composition in this small area (Group of Authors 1979). Sandstone, conglomerate, and siltstone are type of parent material that is susceptible to mechanical disintegration, well-drained, and thus water erosion-prone. On the other hand, small particles in the parent material make the soil more clayey and less prone to erosion.
The northern areas of the basin are covered by haplic cambisol (eutric) formed on red sandstone (Figure 2). This soil is loamy, well-drained, medium-deep to deep, and erosion-prone. Limestone areas are characterized by mollic leptosol formed on limestone, which is loamy and clayey, moderately drained, shallow or medium-deep, less erosion-prone compared to soils formed on red sandstone. Southern parts of the basin are covered mostly by different types of vertisols on lacustrine deposits, poorly drained, shallow to medium-deep. Clay particles reduce soil erodibility. The southwestern part of the basin is covered by leptic calcisol on marl, which is clayey and shallow (Nikodijević 1979). At the furthermost downstream sector, along the Crveni potok River, there is a small area covered by recent haplic fluvisol which consists of gravel, sand, loam, and clay, of shallow depth. Steeper slopes cause water to move faster and increase soil erodibility. The most erosion-prone area of the Crveni potok River Basin, the northern part, is characterized by large slopes. Terrain slope values (based on DEM 30 m) are in general over 10°, often over 20°, and even over 25° (Figure 2). In the middle and downstream parts of the river basin, slope values are mostly under 10°.
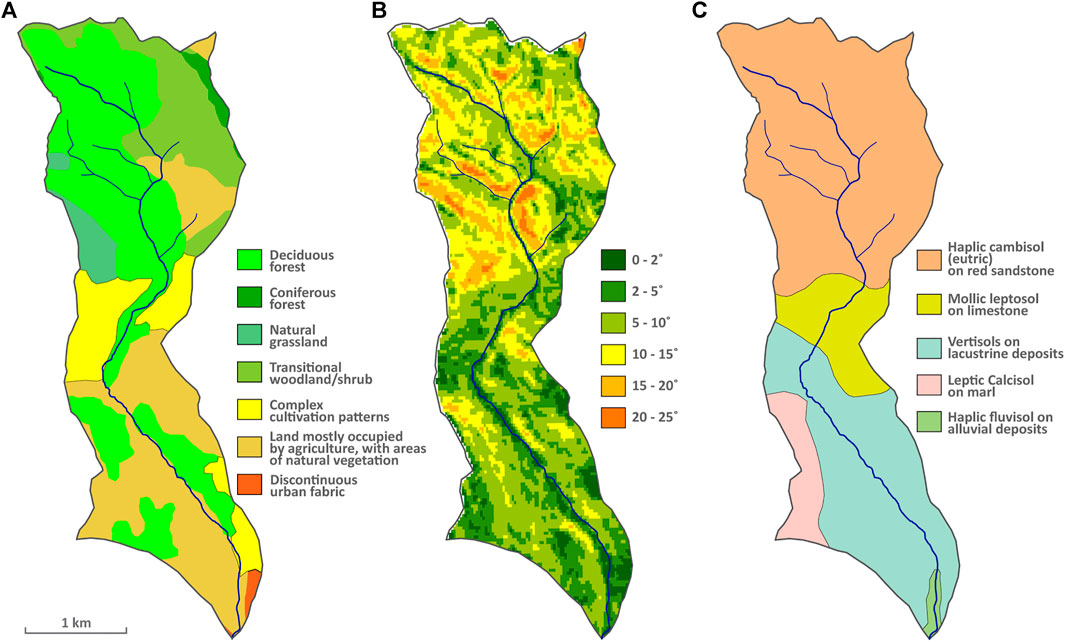
FIGURE 2. (A) Land Cover (B) slope and (C) soil map of the Crveni potok River Basin.
During the summer and early autumn, all flows in the Crveni potok River drainage basin dries up, but during short periods of intensive precipitations, flows are torrential and characterized by huge oscillations of the runoff and the suspended sediment load. Water soil erosion is mainly related to extreme meteorological and hydrological events during which the water flow and the transport of eroded material increase significantly during a relatively short period, while water soil erosion is weak in some years.
The Crveni potok River Basin is located in an area characterized by a temperate continental climate. Precipitation and temperature are the most important climate elements that influence soil erosion intensity. The predicted average annual precipitation is between 632 mm in the lower parts of the river basin and 861 mm in the highest parts of the river basin (Đokić 2015). The largest amount of precipitation occurs during June, May, and April, and the smallest amount during February, January, and August. According to Živković (2009), we can assume that the average annual temperature in the basin is between 8.8 and 10.9°C, depending on the altitude. Temperature rise in early spring often leads to fast snow cover melting and intense water soil erosion, especially if snow melting coincides with rainfalls.
The vegetation cover (Figure 2) includes forest, transitional woodland/shrub, natural grassland, and agricultural land (Copernicus 2018). The northern, higher areas of the basin, which are the focus of this study, are covered with forest and transitional woodland/shrub vegetation. Deciduous forest dominates, while planted coniferous forest (Scots pine - Pinus sylvestris) spread out in a small area at the basin foremost northeast. Different tree species are heavily mixed in a deciduous forest, with oak dominating. The edificatory species is the Balkan sessile oak (Quercus delechampii). Other noticeable species are hornbeam (Carpinus), hawthorn (Crataegus), and hazel bush (Corylus). Full strength forest areas, which consist of old, tall, thick trees are very rare, as the result of unplanned deforestation. Weak vegetation of low ecological value is common in this area. Vegetation of shrubs is partially developed from the stumps. Transitional woodland/shrub consists of herbaceous vegetation and dispersed solitary adult trees. The sparse canopy of degraded Balkan sessile oak and the relatively large distance between the trees do not significantly reduce and slow down the erosion process. Also, young sessile oak trees have an axial root that provides poorer protection against soil erosion than the older trees with a laterally branched root system.
It is noticeable that many oak trees are affected by epiphytes and lichens (Evernia prunastri), which reduce the life potential of the trees by absorbing moisture from the air and reducing dissimilation and decreasing the wood volume growth. The tree bark is often moist, which favors the development of fungi and the spread of lichens. With pathogenic bacteria and fungi development, the vascular cambium of woody vegetation is exposed to necrosis and rapid decay. Significant forest areas are heavily damaged by freezing rain or the snow weight, especially peripheral parts covered by Scots pine forest. The pine trees have an elevated, sparse canopy and high branching, and grow in acidic edaphic soil conditions. However, such stands do not significantly prevent erosion of the solum, especially in inclined positions, due to the axial root system. A smaller area of deciduous forest covers the middle part of the basin, as well as downstream and lower altitude areas. In the middle and particularly downstream parts of the Crveni potok River Basin, there are significant areas used for agricultural production, mainly wheat, corn, clover, sunflower, orchards, and vineyards. Agricultural production is extensive and implies small fields, modest labor inputs, farm mechanization, and fertilizers. Also, agricultural production is constantly declining caused by the depopulation of rural areas. Many fields are not cultivated for years and are completely abandoned.
The upstream area of the Crveni potok River Basin is characterized by intense surface water soil erosion, which is manifested primarily through gully erosion. Gully erosion represents the removal of the soil along drainage lines by surface water runoff. The gullies have formed a huge and dense network. The gully depth ranges from a few dozens of centimeters to several meters, occasionally up to 8 m, while the length is from a few meters to several hundred meters.
In this study, freely available DEMs with horizontal resolutions from 1 arc-second (30 m) (SRTM) to 12.5 m (ALOS PALSAR RT1) were used. Furthermore, terrain/surface models based on airborne laser scanning created by the Republic Geodetic Authority of Serbia (Republički geodetski zavod - RGZ) in 10 m grid were used, as well as a digital surface model in a 3 m grid created by Military Geographical Institute (Vojnogeografski institut - VGI) (Stanojević et al., 2022). The photogrammetric data acquisition of the second one is conducted by an ADS80 airborne sensor from Leica Geosystems that provides multiple stereo coverage. This system captures objects from different angles and allows a pairing of identical points of stereo pairs and applying Semi-Global Matching (SGM) principle developed by Hirschmüller (Hirschmuller 2008; Hirschmuller and Bucher 2010). Using this algorithm, multi-image matching resulted in a dense point cloud that was later used for deriving of Digital surface model (DSM) of a 3 m grid.
Even though VGI SGM DEM has a higher resolution than ALOS PALSAR for the watershed delineation of Crveni potok river, the ALOS PALSAR 12,5 m model was used for hydrological modeling. The drawback of VGI DSM for watershed delineation was the presence of artificial structures and vegetation canopy that led to errors in river networks, watershed boundaries, and drainage directions. The only way of using of DSMs for watershed delineation is with a previous thorough examination of barriers represented by linear vegetation, built-up structures, and river embankments and their elimination by flattening them (Đorđević et al., 2016). The next step of watershed extraction was making hydrologically correct DEM. It was obtained by removing pits from the model using the flooding approach. That way, all sinks were eliminated, thus creating conditions to compute flow directions.
Tools used for watershed extraction was TauDEM (Terrain Analysis Using Digital Elevation Models). Those open-source algorithms work as a plug-in for ArcGIS and QGIS. Despite other software packages being able to do watershed delineation, like ArcHydro, HEC-GeoHMS, and PCRaster, TauDEM was chosen because it offers the D-infinity method, which provides improved computation of flow directions and watershed delineation (Zhang and Chu 2015). The D-infinity method defines flow direction as an angle in radians toward the steepest downward slope, unlike the D8 method, which determines the flow direction in eight discrete horizontal angles toward one of the adjacent cells (Tarboton 1997).
A topography-based index–Index of Connectivity (IC) (Cavalli et al., 2013) is used to show sediment movement pathways and optionally reveal possible gullies within a forest. It is based on the approach of Borselli et al. (2008), who defined IC as:
where Dup and Ddn are the upslope and downslope components of connectivity. A precondition for producing Index of Connectivity maps was eliminating sinks. All the earlier mentioned DEMs were used and resulting IC maps were compared afterward.
In this study, high-resolution terrestrial Light Detection and Ranging (LiDAR) was used to scan the sector of the typical gully in the northern part of the Crveni potok River Basin. The LiDAR model used to scan the gully was Stonex X300 3D Laser Scanner. As LiDAR is designed so that the most rays are oriented upwards (65° above the horizontal plane), a special custom-made holder for LiDAR was used (Figure 3) to enable scanning of the terrain below the instrument.
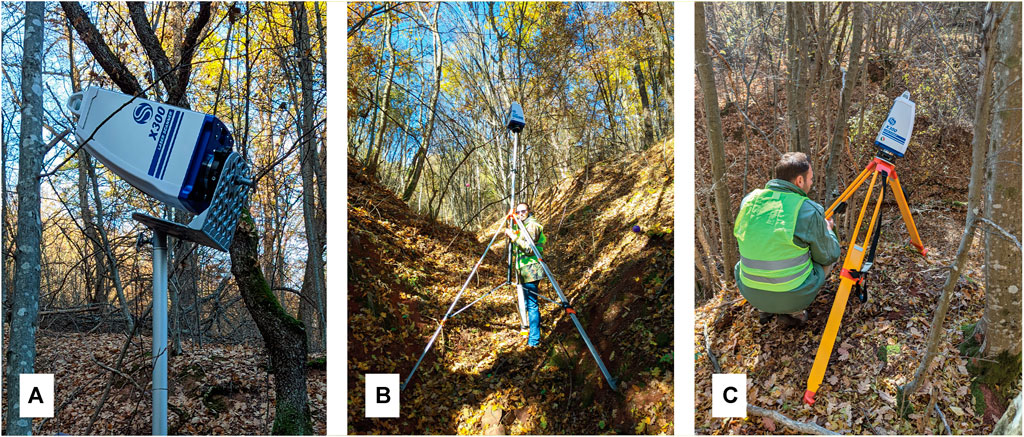
FIGURE 3. (A) Stonex X300 3D Laser Scanner on the special custom-made holder, (B) scanning at the bottom and (C) from the edge of the gully.
The Stonex X300 is characterized by high precision, range, and relatively fast scanning in standard quality mode (Table 1). Our research has shown that high-quality, time-consuming scanning is not necessary.
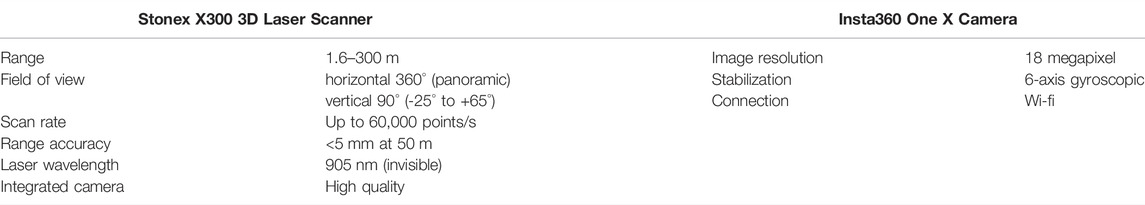
TABLE 1. Technical specifications of Stonex X300 3D Laser Scanner and Insta360 One X camera.
The sector of a gully about 50 m long was scanned. The sector was chosen because of the significant depth of the gully (4–6 m) and the width of more than 10 m. Also, the gully is complex and consists of several widenings and narrowings. It is characterized by different cross-sections, while a slight change in the direction can be noticed several times on the longitudinal profile. Since vegetation complicates the LiDAR scanning process and creates shadows in the resulting point clouds, the gully was scanned in November when all the leaves fell off trees.
Before scanning, position markers necessary to fit the point clouds obtained by individual images into a single cloud were set. Plastic printed markers with a diameter of 20 cm were attached to firm Styrofoam and placed in the gully. The white color of the markers differed from the surrounding terrain, which provided good visibility in the point cloud. Markers were positioned at the bottom of the gully and on its sides so that at least three markers can be seen on two neighboring point clouds, which enables the precise merging of two clouds as accurately as possible. In described conditions, LiDAR scanning requires a dense network of position markers, unlike the terrestrial photogrammetry method. In total, 25 position markers were placed on the scanned sector of the gully. The Garmin Glo GPS device was used for obtaining precise geographical coordinates of the position markers.
The gully was scanned from a total of eight positions, of which three positions were at the bottom of the gully and five positions from the edge of the gully (Figure 3). The total number of ground control points was 25, which was later used for aligning and georeferencing separate scans. The positions were chosen to cover the surface of the gully as efficiently as possible from at least two different angles to eliminate shadows and get a more precise cloud. Scanning at the bottom of the gully was performed using a special custom-made holder that allows covering the terrain below LiDAR. For better terrain covering, a special tripod with an extension (Figure 3) was used to scan from a height of up to 3.5 m. Scanning from the edge of the gully was performed using a regular tripod.
Processing raw LiDAR point cloud includes many steps. For initial processing, the Stonex Reconstructor software was used. In this case, automatic preregistration did not give desired results, so manual registration was performed. The alignment was later refined using ICP registration and Bundle Adjustment. ICP Registration is an algorithm to automatically perform fine registration of a moving point cloud against one or more reference clouds. The ICP algorithm has the advantage of very high registration accuracy (He et al., 2021). Bundle Adjustment algorithm allows registering together many point clouds, distributing the registration error evenly. The global registration error was 0.3 mm. The point cloud was georeferenced and exported as. las for further processing. There are numerous methods and algorithms for filtering and classifying 3D point clouds. The software CloudCompare v2.12 was used for point cloud classification. Cloth Simulation Filter (CSF) (Zhang et al., 2016) were applied to extract ground points from LiDAR points. Point cloud (Supplementary Figures S1, S2) shows how dense vegetation is on the sides of a gully, while on the other hand, the cross-section and longitudinal profile of point clouds present total vegetation from both shoulders and inside a gully. The initial points cloud contained 76,381,657 points from which ground points were extracted (47,339,828 points). DEM was generated with a spatial resolution of 4.94 mm.
Terrestrial photogrammetry of the gully was performed using Insta360 One X camera. This is a high-resolution, fast shooting 360-degree camera controlled via smartphone (Table 1). About 190 m long sector of the gully was scanned, including the sector scanned by LiDAR. Before taking photos, in total 20 position markers that are necessary for georeferencing were set in the gully. The camera was mounted on a firm stick whose low end was attached to the researcher’s belt for increased stability. The shooting was done at a height of about 1 m above the researcher. The images were taken mostly along the gully bottom but also on the sides, especially in the widenings of the gully. This way, the terrain was covered as precisely as possible. In total, 453,360-degree images were taken at the average distance of two adjacent images of about half a meter. A comparison of summary statistics for TLS and TPS point clouds could be seen in (Supplementary Table S1).
For processing and modeling purposes, Agisoft Metashape software was used. The first phase is to align photos. At this stage, the algorithm searches for common points in the photos and compares them, thus finding the camera position for each image and specifying the camera calibration parameters. As a result, a sparse point cloud and a set of camera positions are formed. The sparse point cloud represents the results of photo alignment and is not used in further processing. After settlement, it is possible to insert the values of the collected GCPs. The next phase is the creation of a dense point cloud, which is built based on estimated camera positions and the images themselves. A dense point cloud must be classified before moving on to the next phase.
Ground classification separates terrain points from other points from the cloud, building a surface model. Metashape includes a ground point filtering implementation that allows adjustment of threshold parameters related to the maximum angle between the terrain model and the point connection line (Andres et al., 2019). Parameter settings can be adjusted manually to create, visually, the best results. The filtering techniques widely used to process LiDAR data may not be directly applicable to photogrammetric point clouds. A laser pulse can penetrate partly through the vegetation layer, generating actual ground points below a vegetated surface. Aerial photos do not contain the information below dense vegetation, hence there are very few or no ground points in such areas. The result is that points in photogrammetric point clouds are often more clustered, affecting the accuracy of ground point classification using existing methods. Due to the complex and dense forest cover, terrestrial photogrammetry was applied to obtain a topographic surface.
The set parameters depend primarily on the terrain configuration. Upon completion of the automatic classification, a DSM is created, and a visual inspection is performed to eliminate the errors. Errors in the process of automatic classification can occur from several sources and can be eliminated in several ways. Part of the errors can be eliminated by choosing the appropriate classification parameters, while the other can be eliminated by manually editing data. After data processing, the obtained DEM was exported with a spatial resolution of 17.8 mm, and a reprojection error of 1.01 px.
Two flat plateaus in the catchment with low herb cover and no evidence of erosion or deposition were selected to provide sampling sites for assessing the local reference 137Cs inventory. Depth-incremental 137Cs profiles (5 cm increments) were sampled at both sampling points, to a depth of 25 cm, by a metal cylinder of 10 cm diameter. Soil sampling from 41 points involved collecting bulk samples to a depth of 25 cm using the same sampling procedure as used for the reference points (metal cylinder). One group of soil samples was taken from the entire basin area, with a total of 25 samples. In the northern part of the basin, the samples were collected densely by a 500 m grid because it is a forest area, and the expressive rill/gully type of erosion is represented. Considering the soil type, relief forms, and the vegetation cover in the southern part of the basin, the representative samples were collected wherever needed (Table 2). The other group of samples was taken to investigate differences in the erosion intensity over a smaller area. It includes two transects, 100 and 90 m long, at a distance of about 20 m from each other, as well as the samples in a nearby gully, in total 16 soil samples. All samples were cleaned from decayed organic matter, plant roots, stones, and other debris, then air-dried, homogenized, and sieved to pass through a 2 mm mesh.
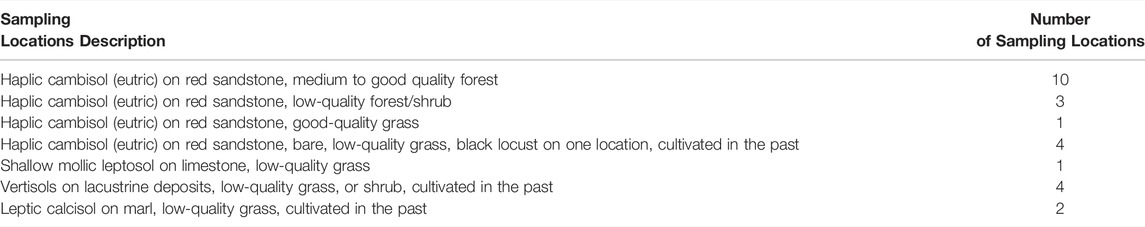
TABLE 2. Concise description of the sampling locations.
The 137Cs activity concentrations in soil samples were measured on an HPGe gamma-ray spectrometer (Baltic Scientific Instruments, 65% relative efficiency and 1.74 keV energy resolution for 60Co at 1.33 MeV). A mixed calibration source (MBSS 2) from the Czech Metrological Institute was used for efficiency calibration in the same geometry as the soil samples. The counting time for the samples was 1 h, providing a counting error for 137Cs up to 10%. The SpectraLine 1.6 software was used for the analysis of the gamma-ray spectra (LSRM 2019). The 137Cs inventories (Bq m−2) were derived using its activity concentrations (Bq kg−1) and the bulk density values for each soil profile.
The profile distribution (PD) model developed by Walling and He (1999) was used to derive estimates of soil erosion and deposition rates from the 137Cs inventories.
Since about 80% of 137Cs fallout in the investigated area can be ascribed to the Chernobyl accident in 1986 (FCLHSP 1987), the PD model modified to take into account 1986 instead 1963 was used in this study:
where Y is the annual soil loss (t ha−1 yr−1); t is the year of sample collection (yr); and X is the percentage reduction in the 137Cs inventory relative to the local 137Cs reference value. The percentage reduction in the 137Cs inventory X is calculated as:
where Aref is the reference inventory (Bq m−2) and
The profile shape factor h0 is derived by fitting the following exponential function to the vertical distribution of 137Cs measured at the reference site at the time of sampling (Porto et al., 2001; Porto et al., 2003):
where A(x) is the 137Cs activity concentration at depth x (Bq kg−1); A (0) is the 137Cs activity concentration in the surface soil (Bq kg−1); and x is the mass depth from the soil surface (kg m−2).
Although the PD model involves a number of simplifying assumptions, it is user-friendly, and it has been widely used to estimate soil erosion rates from 137Cs inventories in areas with undisturbed soil.
High-resolution and accurate topographic models of gullies were produced using TLS and TPS approaches. The observed gully is 980 m long. The first 50 m of the gully is scanned by terrestrial LiDAR, and the first 200 m is covered with 360-degree camera photogrammetry (Figure 4). A 200 m long gully model has an area of 327 m2, and its fill volume is 6160.427 m3. A morphometric property of this model shows it is deepest in its highest sector with a depth of 6 m. The altitude of the shoulder lines of the gully range from 675 to 640 m, while the altitude of the bottom is from 670 to 635 m. All the way to its junction with the left tributary gully, the left shoulder line is higher than the right one by 1–2.5 m. The width of the gully varied from 11.5 m to more than 20 m after a junction. The average slope of the gully’s bottom is 26% or 15°. The size and appearance of the TPS model gully with removed vegetation could be seen on a 3D textured mesh (Figure 5).
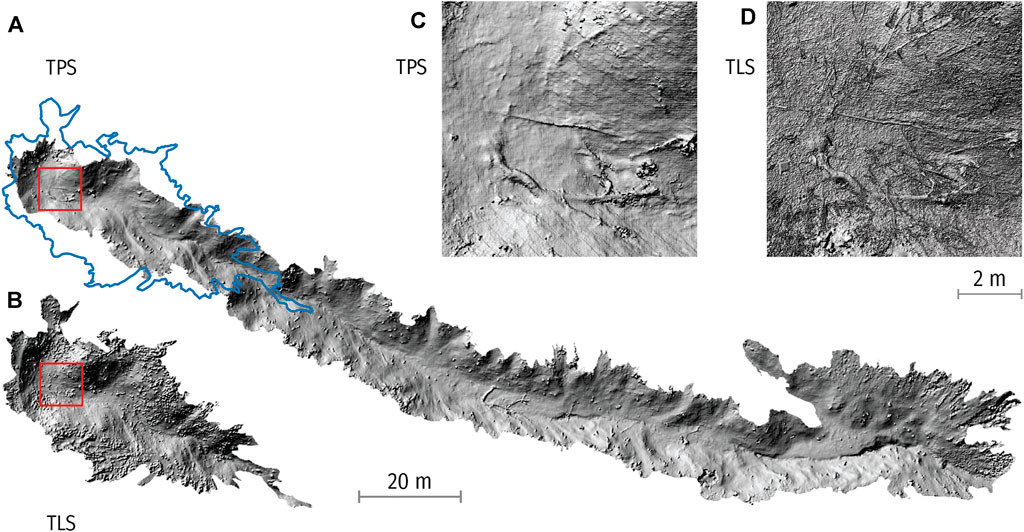
FIGURE 4. (A) Hillshade of TPS DEM; (B) hillshade of TLS DEM; (C) largescale TPS DEM detail (D) largescale TLS DEM detail.
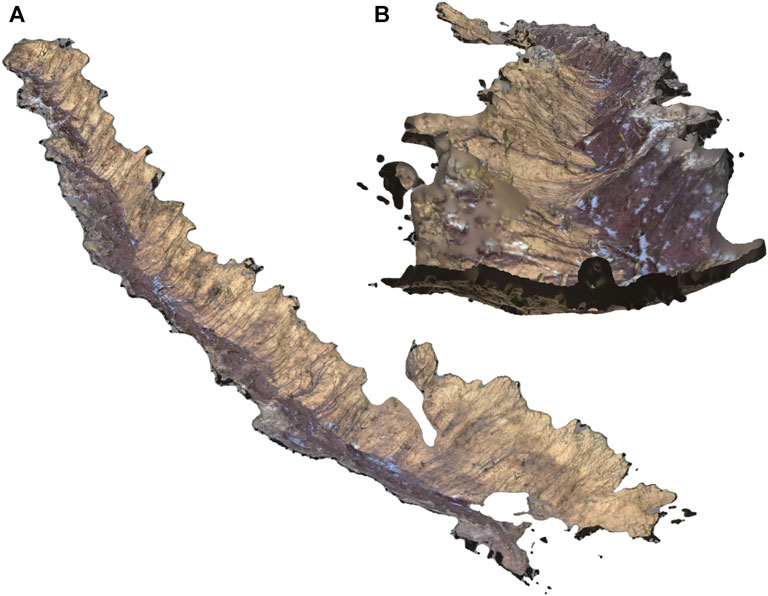
FIGURE 5. Perspective view of 3D mesh 200 m TPS model of the gully (with a junction with left, smaller, tributary gully) (A) and a view from the west (highest) point-of-view (B).
A blue line over a hillshade (Figure 4A) shows an area scanned with Lidar, while a TLS hillshade is shown in Figure 4B. A TLS model covers a broader area because the LiDAR scanning was carried out even from gully shoulders, and capturing spherical images with a 360-degree camera was performed by walking inside a gully and raising the camera higher or climbing from time to time upon gully sides.
One of the essential variables of DEM accuracy is terrain morphology. With drainage networks and elevations ranging from 284 to 729 m, the landscape of the Crveni potok catchment watershed is very complex. The applied metrics, i.e., MIN (Minimum elevation), MAX (Maximum elevation the MEAN (Mean error), STD (Standard deviation error) (Figure 6) of selected data gave comparable values across the DEMs, indicating an overall good accuracy and similarity between TLS, TPS, VGI SGM, RGZ compared to ALOS-PALSAR and SRTM. Due to the significant difference in the resolution, a direct comparison without resampling data is not possible because, for example, the entire DEM taken by the LiDAR is represented on the SRTM DEM in the form of 2 pixels.
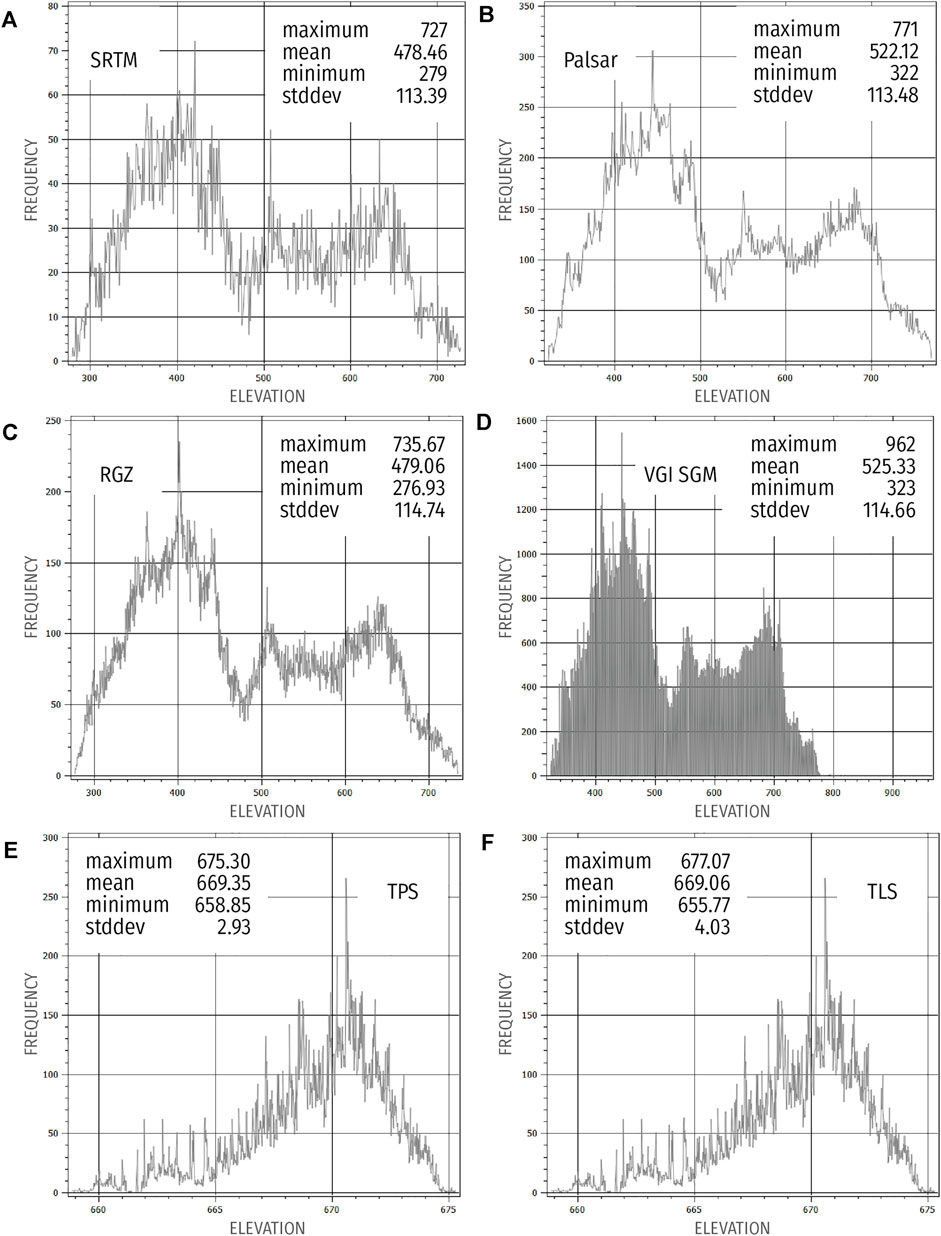
FIGURE 6. Histogram of elevation frequency for analyzed DEMs: (A) SRTM; (B) PALSAR; (C) RGZ; (D) VGI SGM; (E) TPS; (F) TLS.
When the resolution of the grid cell size is reduced, the presence of noise shown as small false peaks between the dominant histogram shapes is induced. It is especially noticeable on the VGI SGM, which has a maximum height of 962 m (false peak) compared to other DEMs that elevation range from 727 to 771 m. DEMs generated using ALOS-PALSAR data produced ellipsoidal heights (Das et al., 2015); therefore, DEM is corrected to match geoid altitudes and be comparable via cross-sections (Figure 7).
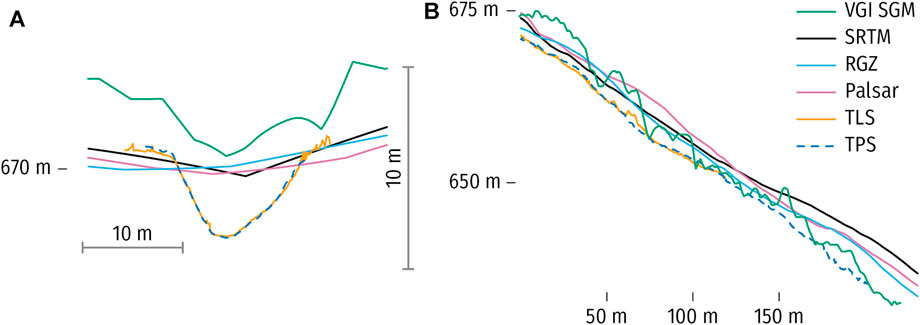
FIGURE 7. (A) Cross-section and (B) longitudinal profile with 2x vertical exaggeration of the observed gully.
Topography has a strong influence on the IC, which considers the drainage area’s properties and the length of a particle’s flow path to the target (Koci, et al., 2019). The computed IC maps pointed out the increased connectivity in gully areas. The IC maps derived from SRTM, PALSAR, RGZ, and VGI SGM, and their enlarged details could be seen in Figure 8. The area with gullies is marked by brighter pink/yellow color, and without gully erosion by purple and darker colors (Figure 8). A difference in IC values is visible between the data watersheds. In comparison to the southern half of the examined area, where arable land is represented, IC models demonstrate increased connectivity in higher altitude parts where a larger number of gullies (northern section) was documented. Low IC ranges from -2.6 VGI SGM, -1.29 PALSAR, -1.08 SRTM to -1.05 RGZ. High IC values are expected at a higher resolution DEM. The results showed that IC decreased significantly in VGI SGM with resolution 3 m and did not give expected results. The maximum IC value derived from SGM (2.25) is lower compared to the RGZ-based value (3.60) despite SGM’s higher resolution. Lower connectivity is a consequence of the presence of some vegetation in the model. Although the IC maximum value of SGM is lower, potential gullies are easier to spot. IC values range from −1.05 to 3.60 (based on RGZ DEM) indicating a similarity between SRTM and PALSAR data. Statistical parameters (Mean, median, and StdDev) do not show significant differences. Although standard deviation values of the IC for the different data are quite similar (Figure 9), ranging from 0.33 to 0.38 (SRTM, PALSAR, and RGZ), the spatial patterns showed differences. High-resolution VGI SGM deviates from these data with a median value of 0.63. Comparable (TPS and TLS) differences may be seen in the connection index maps (Figure 10) for the second area of scanned gullies. Due to the remains of fallen leaves in the field, some of which are included in the model and disrupt the continuity in the micro-relief at this scale resolution, TLS data has a lower max IC value (5.57) than TPS (6.04).
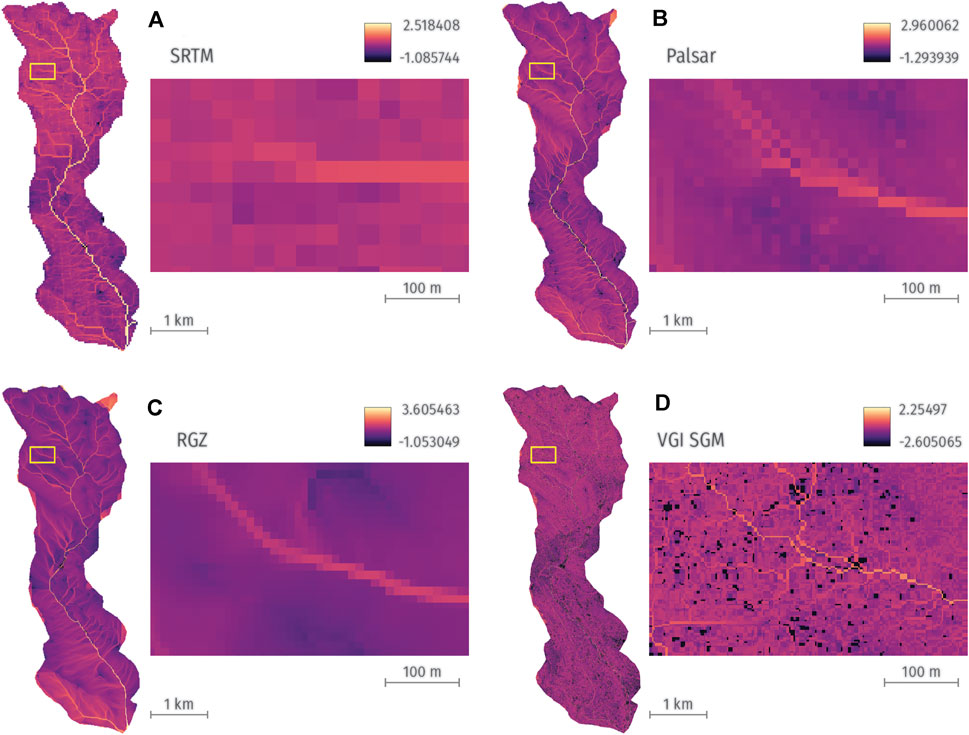
FIGURE 8. Sediment connectivity maps estimated with the IC model with different resolution DEMs for the Crveni potok catchment: (A) SRTM; (B) PALSAR; (C) RGZ; (D) VGI SGM.
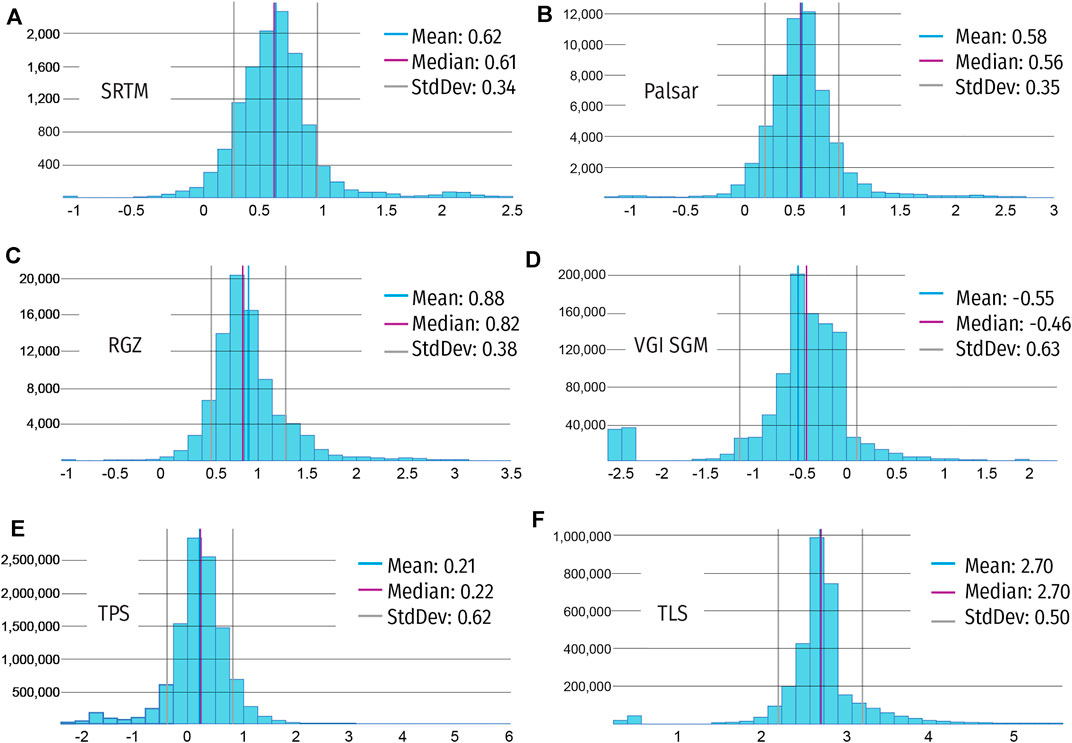
FIGURE 9. Histogram and descriptive statistics of IC values from the analyzed DEMs: (A) SRTM; (B) PALSAR; (C) RGZ; (D) VGI SGM; (E) TPS; (F) TLS.

FIGURE 10. Sediment connectivity maps of (A) TPS model and (B) TLS model, with some enlarged details of (C) TPS and (D) TLS.
The estimates of the annual soil redistribution rate obtained for the sampling points are summarized in Table 3, and the basic descriptive statistics of the annual soil redistribution rate are given in Table 4. According to Lazarević's (1983) water erosion intensity scale, the Crveni potok River Basin is characterized by very weak erosion (1.4–5.6 t ha−1 yr−1), weak erosion (5.6–11.2 t ha−1 yr−1), moderate erosion (11.2–16.8 t ha−1 yr−1) and severe erosion (16.8–42 t ha−1 yr−1). Excessive erosion (˃42 t ha−1 yr−1) was not detected in the basin. Lazarević's erosion scale uses m3 km−2 yr−1 as an erosion intensity measurement unit, thus, erosion intensity was converted to t ha−1 yr−1 as a measurement unit, concerning the soil samples density.
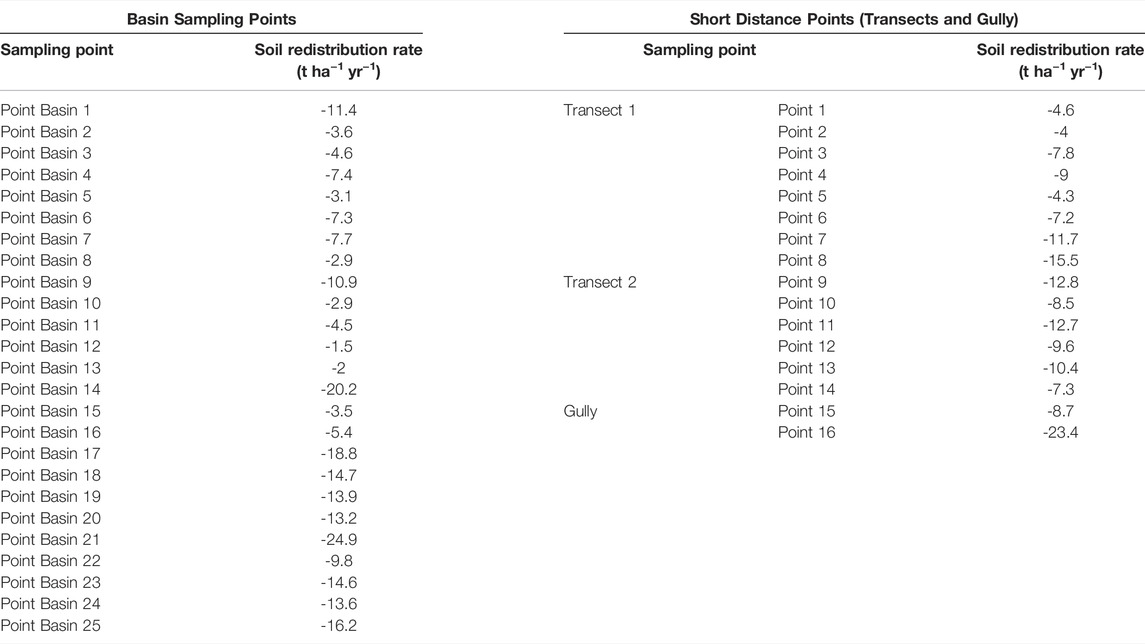
TABLE 3. Annual soil redistribution rates (t ha−1 yr−1) obtained for the sampling points.
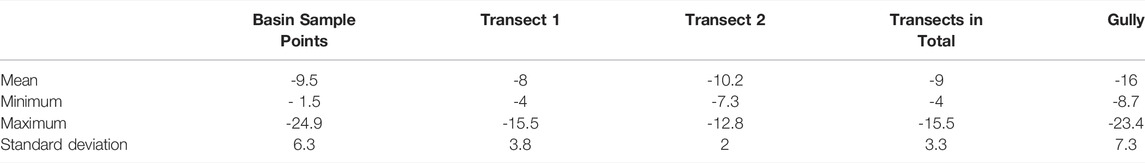
TABLE 4. Basic descriptive statistics of annual soil redistribution rate (t ha−1 yr−1).
Considering the soil samples taken from the entire basin area, the analysis of 10 samples indicated very weak erosion, 5 samples indicated weak erosion, 7 samples indicated moderate erosion, and 3 samples indicated severe erosion. The average annual soil redistribution rate for these samples is 9.5 t ha−1 yr−1. Taking into consideration short distance sampling points, two transects analysis indicated very weak erosion on 3 sites, weak erosion on 7 sites, moderate erosion on 4 sites, with the average value of 9 t ha−1 yr−1. In the gully, as expected, higher erosion rates of 8.7 and 23.4 t ha−1 yr−1 are estimated.
It was expected that gullies could not be determined on SRTM, PALSAR, and RGZ (the ellipsoid altitudes of the last two were corrected to match geoid altitudes) due to a DEM resolution. As can be seen in the cross-section profiles of those three lower resolution DEMs, the gully could not be spotted (Figure 7). One reason could be its width which is much lower than the pixel size of DEM, and the other one is the technique of data acquisition that could not penetrate the canopy. It started to be visible on 3 m resolution VGI SGM. On VGI SGM, the presence of gullies of this size could be confirmed with near certainty, and the main reason is a higher resolution of DEM. The higher altitudes of VGI SGM of around 4 m could be assigned to a vegetation canopy that is also evident on the longitudinal profile by its choppy appearance. Millimeter resolution elevation models of TLS and TPS show evident soil erosion-shaped gully morphology. Both TLS and TPS cross-section profiles show that a gully is V-shaped.
Both TPS and TLS model details show some of the remains of classified and removed trees from the point cloud that is visible at the bottom of the model, as well as fallen branches and leaves. A detail of fallen branches and a detail of a downed tree could be seen in the lower part of the square pictures (Figure 4) and fallen leaves on TLS are much more visible than on TPS. Even after the classification, those objects remained there and are an integral part of ground class points. Using an automated vegetation classification technique is not always possible when LiDAR data is taken in forested terrain with thick impenetrable understory (Choma et al., 2005). Microrelief and rills are visible on both models.
Gullies affect terrain morphology by receiving streams with large amounts of sediment. Surface erosion models do not accurately describe sediment export from gullied terrain (Sidle et al., 2019). The initial problem was to detect gullies of smaller dimensions with the help of DEMs with different spatial resolutions. For that purpose, the index of connectivity (IC) is calculated. A high degree of connection indicates that the sediment will be discharged more quickly and consistently (Pauli 2017).
Index of connectivity is used for the assumption of gully locations. Analyzing details of IC maps (Figure 8) where the observed gully is located, its presence could be identified even on SRTM, but it is hard to state that the existence of all gullies within a catchment could be confirmed especially the smaller ones. All other IC maps made by higher resolution DEMs clearly show its presence.
Deriving accurate high-resolution DEM and efficient terrain mapping is challenging in the complex forest environment on steep terrain (Podobnikar and Vreč ko 2012; Muhadi et al., 2020). Due to terrain constraints and dense forest cover, fieldwork with TLS could be practical in scanning only narrow and small areas (Dabek et al., 2013). Already impeded movement on this challenging terrain becomes even harder by carrying sensitive equipment. A TPS fieldwork is much simpler given that a 360-degree camera weighs around 100 g (350 g with the holder). For comparison, the weight of LiDAR with a tripod and homemade adapter is 27 kg. Furthermore, the time needed for scanning with LiDAR in not the finest mode was around 6 h for a 50 m model, while the time necessary for capturing 200 m with a 360-degree camera was 1.5 h.
Detection of morphological changes over time in this specific gully would not be easy because it is relatively old. It has been present on topographic maps since the 1960’s, and it seems that its development now is not intensive. One of the reasons is that the plant’s roots bind the soil slowing the erosion. The other difficulty will be a load of fallen branches and leaves at its bottom and sides.
The only possibility for studying temporal changes of the gully with a terrain laser scanner could be on one or a few specific profiles. There is no need for scanning the broader area of a gully if the aim is to track the changes in profiles or compare the same narrow sectors of a gully. Avoiding multiple scans will also eliminate an error in the alignment of point clouds. Setting some permanent targets on a stable rock surface on gully shoulders for georeferencing and aligning a model with previous and future ones will improve accuracy and make the comparison of models easier.
A standard scan mode is used in this study to shorten the time required for scanning and cover a more significant part of a gully. However, as a consequence, some distant targets were covered with an insufficient number of points and are impossible to use for georeferencing and aligning. Since there is no need to scan the entire gully with a terrestrial laser scanner, scanning with the finest resolution will be recommended even though it doubles the scan time. The selected area would be covered with a denser point cloud and all the targets will be visible, resulting in a more refined model and more precise georeferencing.
Fixed targets could also reduce the time of a scanning procedure. Carrying targets every time and carrying a GPS rover in hardly passable forest terrain would not be necessary, which will shorten the time needed to set a GPS base station. A narrow strip could be easily cleaned up of fallen leaves and branches that would otherwise compromise the comparison of models over time.
A tripod-mounted LiDAR Stonex X300 was not designed for scanning large areas downwards. Most of its rays are oriented upwards for scanning areas not readily available for ground measurement, particularly building infrastructure. The only officially available accessory that enables tilted scanning is meant for ceilings of caves, architectural structures, and tunnels, and it holds LiDAR in such a way covering rays aimed downwards. When put horizontally, the center of gravity rotates LiDAR directing it upward. Therefore, the custom-made adapter for scanning downwards proved to be very helpful in scanning narrow strips of a gully.
To the best knowledge of the authors, this is the first study that uses the 360-degree camera for terrain modeling and DEM generation. Results obtained with a 360-degree camera gave a satisfactorily detailed model with sub-centimeter details. This method covered a much larger area in less time and at an unrivaled price. The 360-degree camera demonstrated a high practical value in morphometry for gullies. The size of the targets should be considered in relation to camera resolution because some of the targets were not visible on spherical images.
The development of SfM algorithms has brought many advantages over traditional photogrammetry and stereo image processing. The main difference between traditional photogrammetry and SfM is that the traditional one is based on straight lines of overlapping imagery, while with SfM, it is possible to use photos from different angles (Westoby et al., 2012; Micheletti et al., 2015; Iglhaut et al., 2019). SfM refers to the procedure of assessing camera poses corresponding to 2D image sequences and reconstruction of a rare 3D scene (sparse point cloud) (Giang et al., 2017; Verykokou and Ioannidis 2018). A large number of images is required with a lot of overlap to be able to merge and get good results. The whole process is very demanding in terms of hardware. The use of SfM to obtain various products such as DEM and DTM has increased significantly over the years due to increasingly available equipment such as computers, cameras, UAVs, etc. However, techniques or algorithms for separating bare soil and vegetation from point clouds still represent a big issue.
Gully erosion processes and gully modeling could be better represented by utilizing remote-sensing tools, like UAV LiDAR, handheld LiDAR with SLAM technology (Simultaneous Localization and Mapping), and UAV photogrammetry. UAV LiDAR would be the option for studying the whole gullies network within a watershed because of the advantage of covering a wide area and penetrating vegetation cover. For monitoring the evolution of the gully systems, UAV SfM is a tool that can be used (Niculiță et al., 2020). UAV photogrammetry could also give good results of bare earth mapping in a forest while there are no leaves on trees. The use of handheld SLAM LiDAR would be capable of covering much more area in less time compared to both tripod-mounted LiDAR and a 360-degree camera.
The FRN-based soil erosion assessment showed that in the Crveni potok River Basin, the erosion process dominates in comparison to the deposition. At each sampling point, more or less intense soil loss was determined, and no deposition at all. We can assume with great certainty that soil deposition also occurs locally, but only in relatively small areas. That is certainly the case at the confluence of the Crveni potok River into the Malčanska River. The confluence is located in the village itself, where the soil is highly disturbed, so the sampling was not performed.
By analyzing the most important pedogenetic factors at each sampling location, a grouping of sampling points was performed, and seven groups were singled out. The first four groups of the soil samples were taken in the area covered by haplic cambisol (eutric) soil formed on red sandstone in the northern part of the river basin. Haplic cambisol is erosion-prone soil, which is confirmed in many studies (Aparecida da Silva, 2014; Gotardo et al., 2016). The first and the largest group consisting of 10 samples locations, in addition to the mentioned soil type and parent material, is also characterized by a medium-quality to a good-quality forest. In this area, very weak erosion (7 locations), weak erosion (1 location), and moderate erosion (1 location) were detected, with an average erosion intensity of 4.5 t ha−1 yr−1.
The second group with 3 samples covers the area distinguished by poor quality forest/shrub where weak erosion was detected, and the average erosion intensity of 8.5 t ha−1 yr−1 is higher compared to the previous group. Poorer vegetation quality explains the difference in the erosion rate. The third type of vegetation cover is a good quality dense grass where a very weak erosion intensity (4.5 t ha−1 year−1) was recorded at one location. This indicates that the dense grass protects the soil as effectively as a good-quality forest, but additional sampling is necessary to prove this claim. The fourth group consisting of 4 samples includes the soil cultivated in the past (probably a few decades ago), which is bare today or covered by weak grass, and at one sampling location black locust shrubs. Erosion rates in these conditions are among the highest detected in this study, with moderate erosion at 2 locations, severe erosion at 2 locations, and an average erosion intensity of 16.9 t ha−1 yr−1. These results indicate that in similar pedogenetic conditions (soil, parent material, slope), vegetation has a crucial role in the intensity of the erosive process. The lowest values of soil erosion were recorded in the good-quality forest, with slightly higher values in the shrub and the highest on the bared soil and/or the soil cultivated in the past.
The next group consisting of 4 samples was taken from the locations characterized by vertisols formed on lacustrine deposits and the vegetation of low-quality grass or shrub. The soil was cultivated in the past. Although this soil is clayey and thus less susceptible to the erosion process and the slope values are lower, the higher values of erosion intensity were recorded, which could be explained by the low-quality vegetation cover and the soil cultivation in the past. Three sampling locations are distinguished by moderate erosion, one location by weak erosion, and the average erosion rate is relatively high (13.2 t ha−1 yr−1). Two samples were taken on leptic calcisol soil formed on marl, cultivated in the past, and covered by low-quality grass. The results indicate moderate and severe erosion, and the average soil loss is 19.7 t ha−1 yr−1. Relatively high soil redistribution rate can be explained by poor vegetation and former land cultivation. One sample was taken on the shallow mollic leptosol soil formed on limestone and covered by low-quality grass. Weak erosion is detected, only 3.5 t ha−1 yr−1. The low erosion rate can be explained by the shallow soil, which is slowly formed on this type of parent material.
The soil sampling was performed in two transects to determine variations of the water soil erosion intensity in a small area. In total, 14 soil samples showed that variations in erosion rates are significant (Table 3). Variations can be explained by micro-relief conditions. The forest surface is intersected by small dimension rills and gullies (a few centimeters to a few decimeters in depth) in which the water soil erosion process is more intense. In-between the rills, the terrain is flatter, and the erosion process is weaker. Two soil samples taken from the gully bottom showed higher erosion rates, but not excessive as could be assumed by visual field observation.
Afforestation can be the solution for erosion-prone areas in the basin, as many studies concluded that planting trees could significantly reduce erosion rates. Assisted natural regeneration (ANR) in southeastern China reduced surface runoff up to 4.4-times compared to the cultivated areas and reduced erosion to 1.3 t ha−1 yr−1 from more than 10 t ha−1 yr−1 (Xu C. et al., 2019). In the deforested Pčinja region, South Serbia, the soil loss from 11.1 t ha−1 yr−1 to as much as 44 t ha−1 yr−1 was detected, regardless of high-quality grass cover (Petrović et al., 2016). In south Spain study conducted in two river basins showed a significant reduction in the number of gullies in 1956–2004 because of the afforestation and the growth of vegetation cover (Martínez-Murillo et al., 2011). Afforestation of the slopes in northern-central Poland reduces the soil erosion 30 to 70 times compared to the slopes used for cultivation (Wiśniewski and Märker 2019). Soil erosion rates on forested mountain slopes in southern Japan estimated using Cesium-137 (Wakiyama et al., 2010) showed that bare Japanese cypress stand is more prone to erosion (1.61 t ha−1 yr−1) compared to the same forest covered with fern (1.13 t ha−1 yr−1). This research results indicate that the vegetation cover type is the most important factor influencing the soil erosion intensity in the Crveni potok River Basin. High-quality forest areas are characterized by the lowest soil redistribution rates. Areas covered by low-quality forests and shrubs are characterized by a higher erosion rate, but erosion is still mostly weak or moderate. It has been shown that the highest erosion is detected in the southern part of the river basin, where there are fewer high-quality forest areas, and the terrain is covered by poor vegetation (bare soil, weak grass, shrubs), even if the soils are not susceptible to erosion (vertisols).
The study has determined that two types of soil erosion are present in the basin, rill/gully linear erosion and sheet erosion. In the northern parts of the basin, covered by haplic cambisol soil formed on red sandstone, rill erosion is the dominant type. During and after rainfalls and snowmelt, water is running through streamlets, headcuts, rills, and gullies, while soil removal over the surface in-between these erosion forms is not that expressed. This type of erosion has been represented due to the hilly mountain area and high dissected relief, high slope values, and the soil that is susceptible to erosion. In the southern parts of the basin, where the terrain is covered by poor vegetation, the soil was cultivated in the past or occasionally cultivated in the present time, the sheet type of erosion dominates. Rills are rare in this area, and the water more or less evenly removes the soil in thin layers from the entire terrain surface. This type of erosion is conditioned primarily by low slope values. Observing the entire Crveni potok River Basin, we can incorrectly conclude that the intensity of the soil erosion process is higher in the northern part of the basin due to numerous expressive rills and gullies. On the other hand, erosion is not so evident in the southern parts of the basin, but research results indicate higher erosion rates. Sheet erosion sometimes can be more intense compared to the rill erosion, which was confirmed in the hilly areas of Nepal, covered with forest and shrubs, where the rill erosion rate was estimated to be 14 t ha−1 yr−1, while sheet erosion was estimated to be 16 t ha−1 yr−1 (Ghimire et al., 2013). Erosion rates study in Nepal (Koirala et al., 2019) showed that erosion is more intensive in agricultural areas (29 t ha−1 yr−1) compared to shrubland (25 t ha−1 yr−1), grassland (23 t ha−1 yr−1), and forest areas (22 t ha−1 yr−1). This study showed that visually obvious erosion does not necessarily imply a higher soil erosion intensity.
Results obtained in this study can be compared with the mean annual soil redistribution rate values extracted from the erosion map of Serbia (Lazarević 1983). This map is highly generalized but, it can be seen that the northern part of the basin is characterized by very weak (1.4–5.6 t ha−1 yr−1) and weak erosion (5.6–11.2 t ha−1 yr−1), which greatly matches with the results obtained in this study. According to Lazarević, severe erosion (16.8–42 t ha−1 yr−1) occurs in the southern parts of the basin. Several sampling locations showed severe erosion in this study, but moderate erosion prevails. The differences are not substantial and can presumably be explained by the cessation of agricultural activities in the 1990s.
It is feasible to apply several combined biotechnical and hydrotechnical procedures to slow down the erosion processes in the gully area and its immediate surroundings. On terrains with sparse forest vegetation, it is necessary to establish new plantations of woody species that correspond to the type of edaphic substrate, the slope of the terrain, and other plant species (Kostadinov et al., 2019). In positions where, due to the configuration and slope of the terrain and the depth of the solum successful afforestation is not certain, a combined biotechnical procedure of alternating belt arrangement of mixed deciduous forest plantations and the establishment of mixed grass associations of non-invasive species appropriate to the substrate, slope, and climatic conditions can be applied (Gavrilović 1972; Borisavljević and Kostadinov 2012).
The mixed stands corresponding to the physical-geographical characteristics of the area should include Balkan sessile oak, European beech Fagus sylvatica, hornbeam Carpinus betulus, common mountain maple Acer pseudoplatanuses, and white maple Fraxinus excelsior. The beech, hornbeam, and common mountain maple are characterized by a dense and branched canopy and a deep and developed axial root system with long lateral veins adaptable to the configuration of the terrain. The lateral veins of the common mountain maple go into the deeper horizons of the soil and thus affect the stabilization of the sloping terrain. The maple and acacia have a light and airy canopy that does not significantly slow down the rainfall. The maple has a shallow but branched root and long lateral veins. Due to its ecological characteristics, especially the great outgrowth potential, acacia (Robinia pseudoacacia) would have a significant effect on slowing down erosion in a few years. The afforestation process is preceded by the planned removal of degraded stands or parts of stands (broken, diseased, and poorly rooted trees), preservation of healthy stands and trees, and the measures of assisted natural regeneration and resuscitation of trees.
Some technical measures such as the construction of cross barriers, stone partitions, and fixation belts could also be applied on steep sides of the gully (Figure 11). The role of these measures is to slow down the erosion process until the growth of new forest plantations that would form a more closed set of canopies and a branched root system at all positions of intensive erosion.
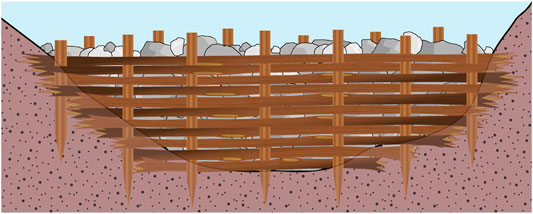
FIGURE 11. Sketch of a gully plug.
It is of particular interest for the investigated area to undertake measures to prevent the formation of new gullies, which is an easier and more economical approach than remediation of the existing ones (FAO (Food and Agriculture Organization of the United Nations) 2011). This requires more effective forest management plans, including the protection of the existing low-quality forest areas from deforestation and planting high-quality tree vegetation at locations proven to be impacted by soil erosion.
Three remote sensing techniques were successfully applied for erosion modeling in the investigated area. Airborne photogrammetry was found to be appropriate for the identification of gully-prone areas. The results obtained by Terrestrial Structure-from-Motion (SfM) 360-degree camera photogrammetry indicated its usefulness for modeling any terrain, including densely wooded areas, that could be reached by foot and for generating DEM from it. It could be successfully used for 3D modeling entire gullies or other terrain forms and features. For higher model precision and future comparison of small differences in details, tripod-mounted LiDAR suits better, but for the area that could be covered with a single scan. Those terrestrial methods are not suitable only for modeling large areas, which should be done from the air. Index of Connectivity could be used for the assumption of gully locations. The results obtained by nuclear techniques used to quantify the soil erosion rates indicated a moderate to high vulnerability of soils of the investigated area to water erosion. The study showed the usefulness of the combined approach of remote sensing for identifying and prioritizing the forest areas most impacted by soil erosion and nuclear techniques to assess the actual soil loss. The applied approach could serve as a tool in establishing soil conservation practices to manage soil erosion and reduce risks associated with gullies’ development, thus supporting effective forest management.
The raw data supporting the conclusions of this article will be made available by the authors, without undue reservation.
MM and MiĐ: study conceptualization, soil sampling, data analyses, LiDAR scanning and 360-camera images capturing, methodology, mapping and modeling by remote sensing techniques, writing, reviewing, made graphical and cartographic materials. MrĐ: study conceptualization, soil sampling, data analyses, LiDAR scanning and 360-camera images capturing, methodology, writing, reviewing, made graphical and cartographic materials. RD: study conceptualization, soil sampling, data analyses, methodology, writing, reviewing, made graphical and cartographic materials. DK: study conceptualization, methodology, writing, reviewing, funding acquisition. DĐ: study conceptualization, methodology, mapping and modeling by remote sensing techniques, writing, reviewing. MJ, IS and SD: study conceptualization, 137Cs and other soil properties analysis, data analyses, methodology, writing, reviewing.
This work was supported by the Ministry of Education, Science and Technological Development of the Republic of Serbia (contracts 451-03-68/2022-14/200,017 and 451-03-68/2022-14/200,124).
The authors declare that the research was conducted in the absence of any commercial or financial relationships that could be construed as a potential conflict of interest.
All claims expressed in this article are solely those of the authors and do not necessarily represent those of their affiliated organizations, or those of the publisher, the editors and the reviewers. Any product that may be evaluated in this article, or claim that may be made by its manufacturer, is not guaranteed or endorsed by the publisher.
The Supplementary Material for this article can be found online at: https://www.frontiersin.org/articles/10.3389/fenvs.2022.897248/full#supplementary-material
Alewell, C., Borrelli, P., Meusburger, K., and Panagos, P. (2019). Using the USLE: Chances, Challenges and Limitations of Soil Erosion Modelling. Int. Soil Water Conservation Res. 7 (3), 203–225. doi:10.1016/j.iswcr.2019.05.004
Almasalmeh, O., Saleh, A. A., and Mourad, K. A. (2022). Soil Erosion and Sediment Transport Modelling Using Hydrological Models and Remote Sensing Techniques in Wadi Billi, Egypt. Model. Earth Syst. Environ. 8, 1215–1226. doi:10.1007/s40808-021-01144-1
Anders, N., Valente, J., Masselink, R., and Keesstra, S. (2019). Comparing Filtering Techniques for Removing Vegetation from UAV-Based Photogrammetric Point Clouds. Drones 3, 61–14. doi:10.3390/drones3030061
Andersen, H.-E., Reutebuch, S. E., and McGaughey, R. J. (2006). “Active Remote Sensing,” in Computer Applications in Sustainable Forest Management: Including Perspectives on Collaboration and Integration. Editors G. Shao, and K. M. Reynolds (Netherlands: Springer), 43–66. doi:10.1007/978-1-4020-4387-1_3
Arabameri, A., Cerda, A., Rodrigo-Comino, J., Pradhan, B., Sohrabi, M., Blaschke, T., et al. (2019). Proposing a Novel Predictive Technique for Gully Erosion Susceptibility Mapping in Arid and Semi-Arid Regions (Iran). Remote Sens. 11, 2577. doi:10.3390/rs11212577
Arata, L., Alewell, C., Frenkel, E., A’Campo-Neuen, A., Iurian, A.-R., Ketterer, M. E., et al. (2016b). Modelling Deposition and Erosion Rates with RadioNuclides (MODERN) - Part 2: A Comparison of Different Models to Convert 239+240 Pu Inventories into Soil Redistribution Rates at Unploughed Sites. J. Environ. Radioact. 162-163, 97–106. doi:10.1016/j.jenvrad.2016.05.009
Arata, L., Meusburger, K., Frenkel, E., and A’Campo-Neuen, A., Iurian, A.-R., Ketterer, M. E., et al. (2016a). Modelling Deposition and Erosion Rates with RadioNuclides (MODERN) - Part 1: A New Conversion Model to Derive Soil Redistribution Rates from Inventories of Fallout Radionuclides. J. Environ. Radioact. 162-163, 45–55. doi:10.1016/j.jenvrad.2016.05.008
Borisavljevic, A., and Kostadinov, S. (2012). Integrated River Basin Management of Juzna Morava River. B Serbian Geogr. 92, 135–160. doi:10.2298/GSGD1201135B
Borselli, L., Cassi, P., and Torri, D. (2008). Prolegomena to Sediment and Flow Connectivity in the Landscape: A GIS and Field Numerical Assessment. Catena 75, 268–277. doi:10.1016/j.catena.2008.07.006
Cavalli, M., Trevisani, S., Comiti, F., and Marchi, L. (2013). Geomorphometric Assessment of Spatial Sediment Connectivity in Small Alpine Catchments. Geomorphology 188, 31–41. doi:10.1016/j.geomorph.2012.05.007
Choma, A., Ratcliff, C., and Frisina, R. (2005). “Evaluation of Remote Sensing Technologies for High-Resolution Terrain Mapping,” in Proceedings of SSC 2005, September 2005 (Melbourne, Australia: Spatial Sciences Institute), 751–760.
Copernicus (2018). Corine Land Cover. Available at: https://land.copernicus.eu/pan-european/corine-land-cover (Accessed January 15, 2022).
Dabek, P., Żmuda, R., Ćmielewski, B., and Szczepański, J. (2013). Analysis of Water Erosion Processes Using Terrestrial Laser Scanning. Acta Geodyn. Geomater. 11, 45–52. doi:10.13168/AGG.2013.0054
Das, A., Agrawal, R., and Mohan, S. (2015). Topographic Correction of ALOS-PALSAR Images Using InSAR-Derived DEM. Geocarto Int. 30, 1–9. doi:10.1080/10106049.2014.883436
Dimotta, A. (2019). Soil Erosion Interdiscplinary Overview: Modelling Approaches, Ecosystem Services Assessment and Soil Quality Restoration. Applications and Analyses in the Basilicata Region (Italy). [dissertation]. Potenza, Italy: Università degli Studi della Basilicata. doi:10.13140/RG.2.2.30609.58726
Đorđević, M., Filipović, I., and Đokić, M. (2016). DEM-Based Approach of Watershed Delineation in Vojvodina. Serb. J. Geosci. 2, 61–69. Available at: https://www.pmf.ni.ac.rs/download/casopisi/srbjgeosci/2016/6-2016.pdf
El Jazouli, A., Barakat, A., Ghafiri, A., El Moutaki, S., Ettaqy, A., and Khellouk, R. (2017). Soil Erosion Modeled with USLE, GIS, and Remote Sensing: A Case Study of Ikkour Watershed in Middle Atlas (Morocco). Geosci. Lett. 4, 25. doi:10.1186/s40562-017-0091-6
FAO (Food and Agriculture Organization of the United Nations) (2011). Assessing Forest Degradation—Towards the Development of Globally Applicable Guidelines. Forest Resources Assessment Working Paper 177, 1–99. Full Text.
Federal Committee for Labour, Health and Social Policy. (1987). The Level of Radioactive Contamination of Human Environment and Exposure of Population in Yugoslavia in 1986 Due to Nuclear Power Plant Disaster in Chernobyl. (Belgrade, Serbia, in Serbian).
Federico, R., Paolo, P., Katharina, K., Axel, M., and Adele, M. (2020). Soil Biological Indicators and Caesium-137 to Estimate Soil Erosion in Areas with Different Forest System Management. Eur. J. For. Res. 139, 67–81. doi:10.1007/s10342-019-01230-1
Gao, Y., Skutsch, M., Paneque-Gálvez, J., and Ghilardi, A. (2020). Remote Sensing of Forest Degradation: A Review. Environ. Res. Lett. 15, 103001. doi:10.1088/1748-9326/abaad7
Garosi, Y., Sheklabadi, M., Pourghasemi, H. R., Besalatpour, A. A., Conoscenti, C., and Van Oost, K. (2018). Comparison of Differences in Resolution and Sources of Controlling Factors for Gully Erosion Susceptibility Mapping. Geoderma 330, 65–78. doi:10.1016/j.geoderma.2018.05.027
Gavrilović, S. (1972). Engineering on Torrents and Erosion. Belgrade: Construction, Special edition. [In serbian].
Ghimire, S., Higaki, D., and Bhattarai, T. (2013). Estimation of Soil Erosion Rates and Eroded Sediment in a Degraded Catchment of the Siwalik Hills, Nepal. Land 2, 370–391. doi:10.3390/land2030370
Giang, N. V., Long, P. V., Chat, V. V., Son, T. S., Long, V. H., Toan, L. Q., et al. (2017). “UAV Photogrammetry for 3d Mapping – a Case Study in Vietnam,” in The 38th Asian Conference on Remote Sensing (ACRS), New Delhi, India (Accessed October 23–27, 2017). ID:209.
Gotardo, R., Piazza, G. A., A. Piazza, G., Torres, E., Kaufmann, V., and Pinheiro, A. (2016). Soil Loss Vulnerability in an Agricultural Catchment in the Atlantic Forest Biome in Southern Brazil. AIMS Geosci. 2, 345–365. doi:10.3934/geosci.2016.4.345
Group of Authors (1979). Geologic Map, Sheet K 34-21 Knjaževac, 1:100,000. Belgrade: Geological Survey of Serbia.
He, Y., Yang, J., Hou, X., Pang, S., and Chen, J. (2021). ICP Registration with DCA Descriptor for 3D Point Clouds. Opt. Express 29 (13), 20423–20439. doi:10.1364/OE.425622
Hirschmuller, H., and Bucher, T. (2010). “Evaluation of Digital Surface Models by Semi-Global Matching,” in Conference or Workshop Item, Vienna, Austria, July 2010.
Hirschmuller, H. (2008). Stereo Processing by Semiglobal Matching and Mutual Information. IEEE Trans. Pattern Anal. Mach. Intell. 30, 328–341. doi:10.1109/TPAMI.2007.1166
Iglhaut, J., Cabo, C., Puliti, S., Piermattei, L., O’Connor, J., and Rosette, J. (2019). Structure from Motion Photogrammetry in Forestry: A Review. Curr. For. Rep. 5, 155–168. doi:10.1007/s40725-019-00094-3
James, L. A., Watson, D. G., and Hansen, W. F. (2007). Using LiDAR Data to Map Gullies and Headwater Streams under Forest Canopy: South Carolina, USA. Catena 71, 132–144. doi:10.1016/j.catena.2006.10.010
Koci, J., Sidle, R. C., Jarihani, B., and Cashman, M. J. (2019). Linking Hydrological Connectivity to Gully Erosion in Savanna Rangelands Tributary to the Great Barrier Reef Using Structure‐from‐Motion Photogrammetry. Land. Degrad. Dev. 31, 20–36. doi:10.1002/ldr.3421
Koirala, P., Thakuri, S., Joshi, S., and Chauhan, R. (2019). Estimation of Soil Erosion in Nepal Using a RUSLE Modeling and Geospatial Tool. Geosciences 9, 147. doi:10.3390/geosciences9040147
Kosmas, C., Moustakas, N., Danalatos, N. G., and Yassoglou, N. (1996). “The Effect of Land Use Change on Soil Properties and Erosion along a Catena,” in Mediterranean Desertification and Land Use. Editors J. B. Thornes, and C. J. Brandt (Chichester: Wiley), 207–227. doi:10.1002/(SICI)1096-9837(199908)24:8<761::AID-ESP988>3.0.CO;2-X
Kostadinov, S., Tošić, R., Hrkalović, D., Nikolić, S., Sudar, N., Kapović Solomun, M., et al. (2019). Soil Erosion Control in Order to Reduce the Risk of Floods in the Vrbas River Basin, Republika Srpska. Vodoprovreda 51, 211–224. [In serbian].
Laboratory of Spectrometry and Radiometry (LSRM), Moscow (2019). SpectraLine (1.6). [Software]. Available at: http://lsrm.ru/en/products/detail.php?ELEMENT_CODE=spectraline_1.6
Lazarević, R. (1983). Erosion Map of SR Serbia, 1:500,000. Belgrade: Institute of Forestry and Wood Industry of Serbia, Department of Erosion and Melioration.
Mabit, L., Benmansour, M., and Walling, D. E. (2008). Comparative Advantages and Limitations of the Fallout Radionuclides 137Cs, 210Pbex and 7Be for Assessing Soil Erosion and Sedimentation. J. Environ. Radioact. 99, 1799–1807. doi:10.1016/j.jenvrad.2008.08.009
Mabit, L., Chhem-Kieth, S., Dornhofer, P., Toloza, A., Benmansour, M., Bernard, C., et al. (2014). “137Cs: A Widely Used and Validated Medium-Term Soil Tracer,” in Guidelines for Using Fallout Radionuclides to Assess Erosion and Effectiveness of Soil Conservation Strategies (Vienna, Austria: IAEA-TECDOC-1741), 27–77. IAEA TECDOC No. 1741.
Martínez-Murillo, J. F., López-Vicente, M., Poesen, J., and Ruiz-Sinoga, J. D. (2011). Modelling the Effects of Land Use Changes on Runoff and Soil Erosion in Two Mediterranean Catchments with Active Gullies (South of Spain). Landf. Anal. 17, 99–104.
Micheletti, N., Chandler, J., and Lane, S. N. (2015). “Structure from Motion (SFM) Photogrammetry (Version 1),” in Geomorphological Techniques. London: British Society for Geomorphology, 1–12. Chap. 2.
Muhadi, N. A., Abdullah, A. F., Bejo, S. K., Mahadi, M. R., and Mijic, A. (2020). The Use of LiDAR-Derived DEM in Flood Applications: A Review. Remote Sens. 12, 2308. doi:10.3390/rs12142308
Niculiță, M., Mărgărint, M. C., and Tarolli, P. (2020). Using UAV and LiDAR Data for Gully Geomorphic Changes Monitoring. Dev. Earth Surf. Process. 23, 271–315. doi:10.1016/B978-0-444-64177-9.00010-2
Nikodijević, V. (1979). Soil Map of SFRJ, Zaječar-3, 1:50,000. Belgrade: Military Geographical Institute.
Parkner, T., Page, M., Marden, M., and Marutani, T. (2007). Gully Systems under Undisturbed Indigenous Forest, East Coast Region, New Zealand. Geomorphology 84, 241–253. doi:10.1016/j.geomorph.2006.01.042
Pauli, T. (2017). Influence of the Gully Erosion on Connectivity Patterns in Small Semiarid Catchment Areas. [bachelor's thesis]. Netherlands: University of Twente.
Petrović, J., Dragović, S., Dragović, R., Đorđević, M., Đokić, M., Zlatković, B., et al. (2016). Using 137Cs Measurements to Estimate Soil Erosion Rates in the Pčinja and South Morava River Basins, Southeastern Serbia. J. Environ. Radioact. 158-159, 71–80. doi:10.1016/j.jenvrad.2016.04.001
Podobnikar, T., and Vrečko, A. (2012). Digital Elevation Model from the Best Results of Different Filtering of a LiDAR Point Cloud. Trans. GIS 16, 603–617. doi:10.1111/j.1467-9671.2012.01335.x
Poesen, J. (2018). Soil Erosion in the Anthropocene: Research Needs. Earth Surf. Process. Landforms 43, 64–84. doi:10.1002/esp.4250
Porto, P., Walling, D. E., Ferro, V., and Di Stefano, C. (2003). Validating Erosion Rate Estimates provided by Caesium-137 Measurements for Two Small Forested Catchments in Calabria, Southern Italy. Land Degrad. Dev. 14, 389–408. doi:10.1002/ldr.561
Porto, P., Walling, D. E., and Ferro, V. (2001). Validating the Use of Caesium-137 Measurements to Estimate Soil Erosion Rates in a Small Drainage Basin in Calabria, Southern Italy. J. Hydrology 248, 93–108. doi:10.1016/S0022-1694(01)00389-4
Prasannakumar, V., Shiny, R., Geetha, N., and Vijith, H. (2011). Spatial Prediction of Soil Erosion Risk by Remote Sensing, GIS and RUSLE Approach: A Case Study of Siruvani River Watershed in Attapady Valley, Kerala, India. Environ. Earth. Sci. 64, 965–972. doi:10.1007/s12665-011-0913-3
Rafferty, B., Brennan, M., Dawson, D., and Dowding, D. (2000). Mechanisms of 137Cs Migration in Coniferous Forest Soils. J. Environ. Radioact. 48, 131–143. doi:10.1016/S0265-931X(99)00027-2
Ritchie, J. C., and McHenry, J. R. (1990). Application of Radioactive Fallout Cesium-137 for Measuring Soil Erosion and Sediment Accumulation Rates and Patterns: A Review. J. Environ. Qual. 19, 215–233. doi:10.2134/jeq1990.00472425001900020006x
Rodrigo-Comino, J., Terol, E., Mora, G., Giménez-Morera, A., and Cerdà, A. (2020). Vicia Sativa Roth. Can Reduce Soil and Water Losses in Recently Planted Vineyards (Vitis vinifera L.). Earth. Syst. Environ. 4, 827–842. doi:10.1007/s41748-020-00191-5
Rodrigues, A. R., Marques, S., Botequim, B., Marto, M., and Borges, J. G. (2021). Forest Management for Optimizing Soil Protection: A Landscape-Level Approach. For. Ecosyst. 8, 50. doi:10.1186/s40663-021-00324-w
Romshoo, S. A., Yousuf, A., Altaf, S., and Amin, M. (2021). Evaluation of Various DEMs for Quantifying Soil Erosion under Changing Land Use and Land Cover in the Himalaya. Front. Earth Sci. 9, 782128. doi:10.3389/feart.2021.782128
Sidle, R. C., Jarihani, B., Kaka, S. I., Koci, J., and Al-Shaibani, A. (2019). Hydrogeomorphic Processes Affecting Dryland Gully Erosion: Implications for Modelling. Prog. Phys. Geogr. Earth Environ. 43, 46–64. doi:10.1177/0309133318819403
Silva, M. A. d., Silva, M. L. N., Curi, N., Oliveira, A. H., Avanzi, J. C., and Norton, L. D. (2014). Water Erosion Risk Prediction in Eucalyptus Plantations. Ciênc. Agrotec. 38, 160–172. doi:10.1590/S1413-70542014000200007
Soto, J., and Navas, A. (2004). A Model of 137Cs Activity Profile for Soil Erosion Studies in Uncultivated Soils of Mediterranean Environments. J. Arid Environ. 59, 719–730. doi:10.1016/j.jaridenv.2004.02.003
Soto, J., and Navas, A. (2008). A Simple Model of Cs-137 Profile to Estimate Soil Redistribution in Cultivated Stony Soils. Radiat. Meas. 43, 1285–1293. doi:10.1016/j.radmeas.2008.02.024
Stanojević, V., Milonjić, Z., Đorđević, D., Bakrač, S., Stojanović, M., and Stevanović, Z. (2022). Digital Surface Model Generation with Aerial Surveying System “LEICA ADS80”. GISTAM 2022. [Unpublished].
Strunk, H. (2003). Soil Degradation and Overland Flow as Causes of Gully Erosion on Mountain Pastures and in Forests. Catena 50, 185–198. doi:10.1016/S0341-8162(02)00140-6
Tarboton, D. G. (1997). A New Method for the Determination of Flow Directions and Upslope Areas in Grid Digital Elevation Models. Water Resour. Res. 33, 309–319. doi:10.1029/96WR03137
Verykokou, S., and Ioannidis, C. (2018). A Photogrammetry-Based Structure from Motion Algorithm Using Robust Iterative Bundle Adjustment Techniques. ISPRS Ann. Photogramm. Remote Sens. Spat. Inf. Sci. IV-4/W6, 73–80. doi:10.5194/isprs-annals-IV-4-W6-73-2018
Wakiyama, Y., Onda, Y., Mizugaki, S., Asai, H., and Hiramatsu, S. (2010). Soil Erosion Rates on Forested Mountain Hillslopes Estimated Using 137Cs and 210Pbex. Geoderma 159, 39–52. doi:10.1016/j.geoderma.2010.06.012
Walling, D. E., and He, Q. (1999). Improved Models for Estimating Soil Erosion Rates from Cesium‐137 Measurements. J. Environ. Qual. 28, 611–622. doi:10.2134/jeq1999.00472425002800020027x
Walling, D. E., and Quine, T. A. (1993). Use of 137Cs as a Tracer of Erosion and Sedimentation: Handbook for the Application of the 137Cs Technique. Exeter, UK: Report to the UK Overseas Development Administration.
Walling, D. E., Zhang, Y., and He, Q. (2006). Models for Converting Measurements of Environmental Radionuclide Inventories (137Cs, Excess 210Pb, and 7Be) to Estimates of Soil Erosion and Deposition Rates (Including Software for Model Implementation). Exeter, EX4 4RJ U.K: Department of Geography, University of Exeter.
Westoby, M. J., Brasington, J., Glasser, N. F., Hambrey, M. J., and Reynolds, J. M. (2012). 'Structure-from-Motion' Photogrammetry: A Low-Cost, Effective Tool for Geoscience Applications. Geomorphology 179, 300–314. doi:10.1016/j.geomorph.2012.08.021
Wiśniewski, P., and Märker, M. (2019). The Role of Soil-Protecting Forests in Reducing Soil Erosion in Young Glacial Landscapes of Northern-Central Poland. Geoderma 337, 1227–1235. doi:10.1016/j.geoderma.2018.11.035
Xu, C., Yang, Z., Qian, W., Chen, S., Liu, X., Lin, W., et al. (2019a). Runoff and Soil Erosion Responses to Rainfall and Vegetation Cover under Various Afforestation Management Regimes in Subtropical Montane Forest. Land Degrad. Dev. 30, 1711–1724. doi:10.1002/ldr.3377
Xu, H., Hu, X., Guan, H., Zhang, B., Wang, M., Chen, S., et al. (2019b). A Remote Sensing Based Method to Detect Soil Erosion in Forests. Remote Sens. 11, 513. doi:10.3390/rs11050513
Yoho, N. S. (1980). Forest Management and Sediment Production in the South-A Review. South J. Appl. For. 4, 27–36. doi:10.1093/sjaf/4.1.27
Zhang, J., and Chu, X. (2015). Impact of DEM Resolution on Puddle Characterization: Comparison of Different Surfaces and Methods. Water 7, 2293–2313. doi:10.3390/w7052293
Zhang, W., Qi, J., Wan, P., Wang, H., Xie, D., Wang, X., et al. (2016). An Easy-To-Use Airborne LiDAR Data Filtering Method Based on Cloth Simulation. Remote Sens. 8, 501. doi:10.3390/rs8060501
Keywords: soil erosion, gully, DEM, 360-degree camera, terrestrial LIDAR, nuclear techniques, forest management, photogrammetry
Citation: Manić M, Đorđević M, Đokić M, Dragović R, Kićović D, Đorđević D, Jović M, Smičiklas I and Dragović S (2022) Remote Sensing and Nuclear Techniques for Soil Erosion Research in Forest Areas: Case Study of the Crveni Potok Catchment. Front. Environ. Sci. 10:897248. doi: 10.3389/fenvs.2022.897248
Received: 15 March 2022; Accepted: 03 May 2022;
Published: 25 May 2022.
Edited by:
Ivica Milevski, Saints Cyril and Methodius University of Skopje, North MacedoniaReviewed by:
Jelena Golijanin, University of East Sarajevo, Bosnia and HerzegovinaCopyright © 2022 Manić, Đorđević, Đokić, Dragović, Kićović, Đorđević, Jović, Smičiklas and Dragović. This is an open-access article distributed under the terms of the Creative Commons Attribution License (CC BY). The use, distribution or reproduction in other forums is permitted, provided the original author(s) and the copyright owner(s) are credited and that the original publication in this journal is cited, in accordance with accepted academic practice. No use, distribution or reproduction is permitted which does not comply with these terms.
*Correspondence: Miloš Manić, bWlsb3MubWFuaWNAcG1mLmVkdS5ycw==
Disclaimer: All claims expressed in this article are solely those of the authors and do not necessarily represent those of their affiliated organizations, or those of the publisher, the editors and the reviewers. Any product that may be evaluated in this article or claim that may be made by its manufacturer is not guaranteed or endorsed by the publisher.
Research integrity at Frontiers
Learn more about the work of our research integrity team to safeguard the quality of each article we publish.