 Ivan Potić
 Ljiljana M. Mihajlović
 Vanja Šimunić1
 Nina B. Ćurčić
- 1Military Geographical Institute “General Stevan Bošković“, Belgrade, Serbia
- 2Faculty of Geography, University of Belgrade, Belgrade, Serbia
- 3Geographical Institute “Jovan Cvijic”, SASA, Belgrade, Serbia
In the past two decades, the South part of Serbia has been affected by exploitive and illegal logging. As this trend is not decreasing to this day, there is a need to determine the area where this logging occurred precisely. The consequences of these actions are tremendous, causing the forest owners’ financial loss (regardless of whether it is private or state property) and a negative impact on the environment. Significant environmental and forest management problems deriving from these actions are erosion increase and more frequent torrential floods occurrence in the catchment. Since it is difficult to update the national forest inventories in remote areas, remote sensing techniques using different satellite imagery types can provide up-to-date data. The initial analysis that employed Normalized Difference Vegetation Index (created using Landsat 7 and Landsat 8 imagery) indicates massive deforestation in the research area between 1999 and 2021. Headwaters of the Štavska river catchment is selected as the research area to determine the amount of erosion in two periods—before and after deforestation occurred. Change in land cover (LC) is presented with two LC maps created applying supervised classification to Landsat 7 imagery from 1999 as a pre-deforestation LC state and Landsat 8 imagery acquired in 2021 as the current LC state. The erosion in the catchment for both periods is determined using the Soil and Water Assessment Tool (SWAT). The analysis results show the erosion change incurred as a deforestation effect in the river catchment. With the data obtained by remote sensing and SWAT analysis, it is possible to track changes in the area and acquire essential data, making the right and fast decisions to protect the natural resources economy and make sustainable development possible in this impoverished region.
Introduction
In 2003, the European Commission adopted the EU Action Plan for Forest Law Enforcement, Governance, and Trade (FLEGT1). The Action Plan outlines many initiatives to address the issue of illegal logging in the country. In 2010 EU member states agreed to make it illicit to import illegally harvested timber. Specifically, the “due diligence” regulation obliges operators to implement a system that will provide a sufficient guarantee that wood they place on the EU market comes from legal sources. The long-term aim of the FLEGT Action Plan is sustainable forest management (Osepashvili, 2011). Governments, the private sector, civil society, and forest-dependent people have all committed to taking voluntary actions to protect forests, either individually or collectively (e.g., pledges, zero-deforestation commitments, certification standards). However, recent research shows that these voluntary commitments and standards have not affected deforestation (Haywood and Henriot, 2019). In the absence of land-use planning, or in addition to it, sectoral laws on forestry, land, agriculture, and mining may regulate land distribution; nevertheless, these regulations are frequently inconsistent and subject to competing interpretations (Sartoretto et al., 2017; Haywood and Henriot, 2019).
For more than four decades, in Central and Eastern European countries with centrally planned economies, the state-controlled forest resources and forest management (Food and Agriculture Organization, 2006). With the political changes during the transition period, countries have begun to explore the possibility of reforms in the forestry sector and the return of confiscated property to former owners through restitution (Nonić et al., 2011). The relatively difficult economic situation in Serbia and the high percentage of the population living on the edge of existence are the leading causes of illegal activities in all social spheres. The forest is a particularly suitable resource for various unlawful activities because it spreads over a large area, and it is practically impossible to provide its complete protection. Any increase in the degree of protection simultaneously causes a significant increase in the costs of forest management, which are usually economically unacceptable for state-owned enterprises and forest owners. Serbia’s total forest area status, primarily the percentage of forest cover, is typically shown using out-of-date statistics. The latest officially available data were from 2008, when the National Forest Inventory of the Republic of Serbia was completed (which did not include the area of the southern Autonomous Province of Kosovo and Metohija). According to these data, the forest cover in Serbia is 29.1%, or 2,250,000 ha. Of the total forest area, about 47% is state-owned, while about 53% is privately owned. In Serbia, national forest inventories (NFIs) are rarely produced, at approximately 20-years intervals: 1961, 1979, and 2003–2006. After 2006, official forest area estimates exist only for 2011 and 2014. However, these data are highly inaccurate and based on outdated cadastral data.
According to the official definition of the forest area in Serbia, “the forest includes all the inventory unit areas larger than 0.5 ha covered with forest trees ...” (Banković et al., 2009), which is very similar to the FAO definition (Food and Agriculture Organization, 2004). Over time, NFI characteristics for individual countries have been developed to adapt to their unique topographies, climates, forest types, commercial interests, and others. Although the FAO reference definition is used as the basis for national forest definitions in many countries, national definitions can vary significantly: the minimum forest area in the Czech Republic is 0.04 ha, in Austria 0.05 ha, in China 0.0667 ha, in Germany 0.1 ha, in Estonia 0.1 ha, in Ireland 0.1 ha, in Latvia 0.1 ha, in Lithuania 0.1 ha, in Luxembourg 0.1 ha, in Slovenia 0.25 ha, in Slovakia 0.3 ha, in United States 0, 4 ha (Lawrence et al., 2010).
Given that illegal logging has a 30% share in the global market (more than $ 20 billion a year), official statistics are losing relevance in terms of presenting adequate data, as even the latest forest resource data from official Central and Eastern Europe statistics often do not allow for forest degradation and illegal logging (Taff et al., 2010). According to the World Bank, Albania is one of the countries with the most striking illegal logging, and Serbia does not even have uniform records of unlawful forest activities (World Bank, 2005). Illegal logging is most prevalent in Serbia’s southern regions, particularly along the border with Autonomous Province of Kosovo and Metohija. Serbia is on a level with Indonesia in those areas, as the world’s country with the highest rates of illegal logging (Harou and Hajredini, 2009). This type of action is especially prevalent in southern Serbian municipalities bordering the administrative line of the Autonomous Province of Kosovo and Metohija, such as Kuršumlija, as indicated in this research (Figure 1). Kuršumlija is a municipality in South Serbia’s central-east. It shares an administrative line with Serbia’s southern Autonomous provinces of Kosovo and Metohija and is surrounded by the municipalities of Brus, Blace, Prokuplje, and Medveđa (Valjarević et al., 2018a). This southern part is one of Serbia’s most forested areas, and due to geological and pedological factors, it is extremely vulnerable terrain to erosive processes.
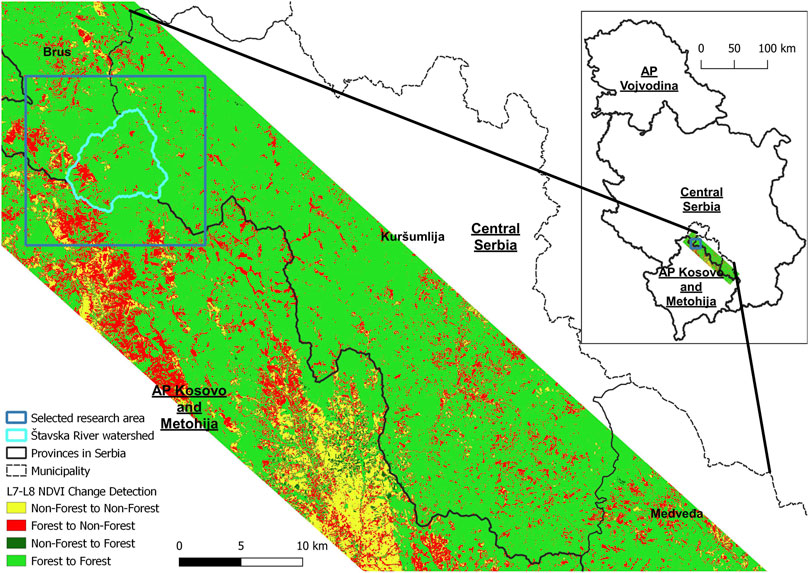
FIGURE 1. The southern part of the Republic of Serbia with Research area - NDVI change detection map.
To deter illegal logging which increases the extent of erosive processes and other environmental stresses, specific legislative measures must be adopted. Efficient law enforcement is essential for translating the legislation on paper into forest protection on the ground, but it requires clear regulatory mandates and adequate financial and human capability (Haywood and Henriot, 2019).
The vegetation comprises a critical component of ecosystems connecting the atmospheric, hydrological, and pedological systems (Zhu et al., 2021). Environmental preservation and protection largely depend on economic stability. It is undisputed that most post-socialist European countries still have limited financial, human, and political resources. However, in the last two decades, due to publicly available satellite data about deforestation and degradation obtained by remote sensing techniques, evaluation costs have been dramatically reduced (Woodcock et al., 2008; Blackman, 2013). Earth observation (EO) data, i.e., satellite, aerial or ground-based observations and geospatial data, is crucial to monitor changes in forest ecosystems, especially to identify tree mortality (Lausch et al., 2016; Montzka et al., 2021). Land use and land cover changes monitoring are an essential aspect of the ecosystem, and remote sensing has considerable potential in monitoring land cover, land use, and land changes due to natural cycles and anthropogenic activities (Kaplan and Avdan, 2017).
Remote sensing implies observing, identifying, or evaluating objects on the Earth’s surface using a remote sensing instrument (Franklin, 2001). The Normalized Difference Vegetation Index (NDVI) is among the incredibly promising remote sensing techniques that allow monitoring of forest cover changes over time (MacDicken, 2015; Romijn et al., 2015). NDVI, like all VIs, associates the absorption spectrum of chlorophyll in the red region of the spectrum with the phenomenon of reflection in the near-infrared spectrum range, which is influenced by the leaf structure type (Wang and Tenhunen, 2004). NDVI also allows comparisons of images obtained at different times (Lillesand et al., 2004). NDVI showed the initial deforestation zones and facilitated the basin selection process in which this phenomenon is widespread (Figure 1).
Forests are considered to function as both “pumps” and “sponges,” enhancing evapotranspiration and soil moisture retention (Bruijnzeel, 2004; Arancibia, 2013). Heavily forested watersheds have lower streamflow rates than watersheds covered with other classes. Deforestation reduces albedo, aerodynamic roughness, leaf area, and rooting depth, lowering evapotranspiration and affecting streamflow (Costa et al., 2003; Farley et al., 2005), increases water yield (Bosch and Hewlett, 1982), and reduces dry season flow (Bruijnzeel, 1989; Arancibia, 2013; Ogden et al., 2013; Liu et al., 2015). Observed changes in LC, primarily deforestation and changes in LC from forest class to class such as agriculture, pastures or bare land have a major impact on the flow regime and increases surface runoff (Bewket and Sterk, 2005; Nie et al., 2011; Truong et al., 2018). To ensure sustainable watershed management, it is necessary to understand the effect of LC change on river flow regimes and erosion extension (Kashaigili, 2008), and its relation to flood frequency, flood severity, base flow, and annual mean discharge (Li et al., 2009). The occurrence of deforestation and LC change that emerge in this process inevitably leads to a shift (increase) in surface runoff and total discharge (Bosch and Hewlett, 1982; Lal, 1993).
The hydrometeorological data available for this part of Republic of Serbia are imprecise since the nearest monitoring stations are over 40 km away from the studied area (Kopaonik about 42 km, Niš—53 km, Kruševac—50 km, Leskovac—58 km, Vranje—80 km, Priština—50 km). Additional data from the Autonomous Province of Kosovo and Metohija measuring sites has not been available since 1999.
Materials and Methods
Study Area
Confirmation of a severe problem of illegal logging in the Republic of Serbia’s southern region, particularly in the municipality of Kuršumlija, was obtained by Land cover change detection procedure using available satellite images (Figure 1). Multispectral analysis of satellite images acquired by sensors Landsat 7 from 1999 and Landsat 8 from 2021 (United States Geological Survey, Earth Resources Observation, and Science Center, 2021a; United States Geological Survey, Earth Resources Observation, and Science Center, 2021b) highlighted the problem of illegal logging. They proved the hypothesis of massive unnatural deforestation in the area. The NDVI was calculated for both satellite images in the first stage of the analysis, and then reclassification was performed using Eq. 1 for the image acquired in 1999 and Eq. 2 for the image acquired in 2021:
where non-forest values are marked with a value of 1, while areas under forests are marked with a value of 2.
The single threshold is not suitable for both years due to different acquiring periods and different climatic conditions, which indicates false detection of the desired phenomenon (Xiao et al., 2002; Montandon and Small, 2008; Jovanović et al., 2017). The thresholds had to be adjusted to detect the forest and non-forest phenomena correctly. Even though the most common minimum NDVI value for broad-leaved forests is 0.4 (Jovanović et al., 2017), the various threshold had to be used in the correct detection of different types of forests (Myneni et al., 1998; Xiao et al., 2002).
The selected research area is in the territory of central Serbia, in the northwestern part of the municipality of Kuršumlija within the UTM34N coordinates 490482.6874000001698732, 4771908.8211000002920628 and 505036.7903000004589558, 4785615.1121999993920326 (Figure 1), within which is Štavska river located (Figures 1, 3). Initial research area—Štavska river watershed, covers 40.1866 km2. The surface is very dissected and stretches from 759 m to 1,683 m a.s.l., with a mean elevation of 1,147.03.
Methodology
A SWAT was employed to meet the study’s goals and determine the amount of sediment in the basin. SWAT is a semi-distributed hydrological and powerful watershed model widely utilized by researchers (Li et al., 2015). SWAT provides a possibility to simulate a variety of hydrology-related environmental phenomena, such as hydrological conditions, pollution and sediment transport, erosion; and an excellent tool for addressing a wide range of water resource issues and analyzing a variety of situations and is an advantageous method for assessing water supplies, erosion, and other pollution causes in remote catchments. The United States Department of Agriculture Research Service (USDA-ARS) created a semi-diffuse, process-based integrated hydrological model based on 30-years hydrological research data (Gassman et al., 2007). The model predicts the daily water cycle, crop development, sediment, nutrient, and pesticide transfer in a basin (Arnold et al., 2012; Vigiak et al., 2015).
The SWAT workflow contains separate phases: a land phase that is solved at the HRU (hydrological response unit) level and a water phase solved at the reach (sub-basin) level. The HRU daily water balance and sediment yields are determined in the land phase. Precipitation, irrigation, evapotranspiration, surface runoff, lateral flow, and percolation to shallow and deep aquifers are all variables in the HRU daily water balance (Neitsch et al., 2011).
The Digital Elevation Model (DEM), a land use-land cover (LULC) map, a soil map, and meteorological data are mandatory input variables for SWAT analysis and simulation. These elements are used to distribute HRUs throughout the area and run hydrological and erosion assessments on the HRUs produced (Potić et al., 2021). A DEM with a vertical accuracy of 4.4 m (Tadono et al., 2016) and a spatial resolution of 22.45 m was utilized. The watershed delineation SWAT process was performed using the JAXA ALOS Global Digital Surface Model AW3D30 (Japan Aerospace Exploration Agency, 2017) interpolated to 15 m. FAO/UNESCO’s Soil Map of the World (The digital Soil Map of the World-DSMW v.3.6, 2003) provided a soil map for the research area. The soil mapping unit covering the research area is joined to QSWAT using the FAO soil code compatible with the updated usersoil table in the QSWATRef2012 database. The data originated in the mwswat database (MWSWAT 2012, 2021), which is now integrated into the QSWAT database (MWSWAT 2012, 2021; QSWAT3, 2022), allowing direct linking to FAO soil data.
Landsat 7 and 8 satellite imagery were obtained from the USGS EarthExplorer application to create land cover maps (United States Geological Survey, Earth Resources Observation, and Science Center, 2021a; United States Geological Survey, Earth Resources Observation, and Science Center, 2021b). The data utilized in the study spans two time periods: acceptable cloudless Landsat 7 imaging acquired on 20 August 1999, and adequate cloudless Landsat 8 images from 8 August 2021.
The satellite data was analyzed and classified using RGB and NIR bands. The Random Forest machine learning method was used to classify the satellite imagery into five categories: urban, barren, forest, pastures, and agriculture using the Dzetsaka classification plugin (Karasiak, 2016) in QGis (QGIS Development Team, 2021).
Temperature (°C), precipitation (mm), wind (m/s), relative humidity (percent), and solar energy (MJ/m2) were obtained from the National Centre for Environmental Prediction (NCEP) and the Climate Forecast System Reanalysis (CFSR) Archive (University Corporation for Atmospheric Research & National Centre for Environmental Prediction, 2018). The data is SWAT-ready in.csv format and spans the years 1979–2014. CFSR data is compiled from satellite products and the worldwide weather station network on an hourly basis. The data has a spatial resolution of about 38 km and can be downloaded in desirable SWAT format. From the accessible dataset, annual weather data from 1990 to 2006 are retrieved and used to analyze two meteorological stations near the research area - s43556n20625e and s43556n21250e.
Three phases are required in the SWAT workflow. The first SWAT phase, watershed delineation, employs DEM. The DEM is loaded, and the accumulation and flow direction are determined. A watercourse occurrence must cover at least 1 km2. The outlets’ selection and stream network creation are the following steps. Sub-basin parameters are calculated, and watersheds are defined when all necessary outlets are chosen. HRUs are formed in the second SWAT phase: DEM is used to construct multiple slopes divided into five classes and additional maps a Land Cover (LC) map and a Soil map. It is required for all input data to be in the same coordinate system, UTM34n.
The SWAT simulation is the final step, and it is carried out for two annual periods, 1999 and 2021. The input data for the first simulation period (1999) are a DEM, soil map, LC map derived from Landsat 7 satellite imagery acquired in 1999, and meteorological data from 1999. The same input data are used for the second simulation period (DEM, soil map, and meteorological data from 1999), except that LC data based on Landsat 8 imagery acquired in 2021 is analyzed. The land cover change will indicate the potential difference in sedimentation and surface runoff since the same DEM, soil, and weather data were used in the two simulations. The warm-up period as a pre-step in the simulation process is 7 years, starting from 1990. Simulation is set from 1999 to 2006, and simulated data for 1999 is used to compare the results.
The HRU sediment yields in SWAT are calculated using the Modified Universal Soil Loss Equation—MUSLE (Williams, 1995). Equation 3 (Williams, 1995) shows the MUSLE estimation of HRU sediment production for non-urban land-use types:
where SY = HRU sediment yield (t/day); Q = daily runoff volume (mm); qp = runoff peak discharge (m3/s); A = HRU area (ha); C, P, K, and LS are dimensionless factors accounting for HRU crop cover, soil protection, soil erodibility, and topography as defined in the original Universal Soil Loss Equation (USLE) (Wishmeier and Smith, 1978); and FCRFG is a dimensionless factor to account for coarse fragment cover (stoniness).
Surface runoff (Qsurf, mm H2O) is calculated using Soil Conservation Service Curve Number (SCS-CN) model (Rallison and Miller, 1981), which describes watershed runoff at the macroscopic scale (Eq. 4). The model considers the relationship between total actual retention and total rainfall (Li et al., 2015).
where Rd—actual daily rainfall (mm H2O); Ia—Initial abstraction from rainfall (mm H2O); S—the depth of effective available storage within the watershed, and it is calculated using Eq. 5:
where CN—the curve number originally derived as a function of soil and land use types (Simić et al., 2004; Kumar et al., 2016; Potić, 2018). Surface runoff is possible only if the condition Rd > Ia is met.
The SCS model in SWAT has made the SCS-CN method popular to calculate runoff (Gassman et al., 2007).
The total basin runoff SWAT model calculates using two components: Surface runoff Qsurf and Underground runoff (Qgw) for all HRUs at the given moment i (Qj) (Eq. 6) (Simić et al., 2004; Potić, 2018).
SWAT scenarios are calibrated and validated using the Calibration Uncertainty Program for SWAT (SWAT-CUP, 2021). SWATCUP-2019 is a program that allows for the calibration of SWAT models to be performed. SWATCUP-2019 performs calibration, validation, sensitivity analysis, and uncertainty analysis. Additionally, the application connects SWAT to the SUFI2, GLUE, ParaSol, MCMC, and PSO algorithms (SWAT-CUP, 2021). The observed variable used to calibrate the model includes observed monthly discharge data from comparable basins in the area from 1997 to 2005. The observed data came from gauges Kruščica and Kruševo (Hidrološki godišnjak, 1997; Hidrološki godišnjak, 1998; Hidrološki godišnjak, 1999; Hidrološki godišnjak, 2000; Hidrološki godišnjak, 2001; Hidrološki godišnjak, 2002; Hidrološki godišnjak, 2003; Hidrološki godišnjak, 2004; Hidrološki godišnjak, 2005) located at similar altitudes and similar catchment size areas with the discharge location for which we are modelling the scenario. The primary constraint on the quality of parameter calibration is the absence of hydrological and meteorological measurement sites. Additionally, the researched zone is situated in a security-vulnerable region, and there is a severe lack of data from these stations. With all mentioned limitations, the calibration process was started by employing the SUFI2 algorithm (Abbaspour et al., 2007; Abbaspour et al., 2015; Abbaspour et al., 2017; Mehan et al., 2017) to calculate 14 parameters (Table 1).
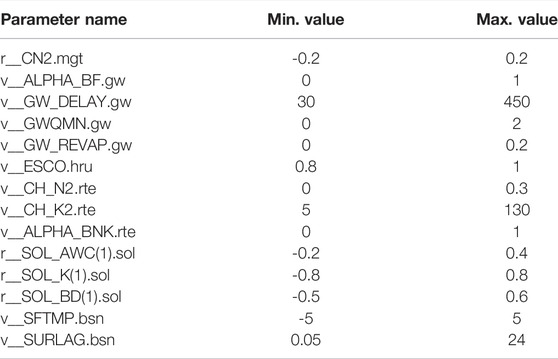
TABLE 1. Input calibration parameters.
Nash_Sutcliff (NS) objective function was selected for the calibration goal type with 500 simulations. The best simulation iteration number is 427. Since low-quality input data, calibration results are as follows in Table 2.

TABLE 2. SWAT CUP summary statistics.
Calibration results and fitted values are presented in Table 3.
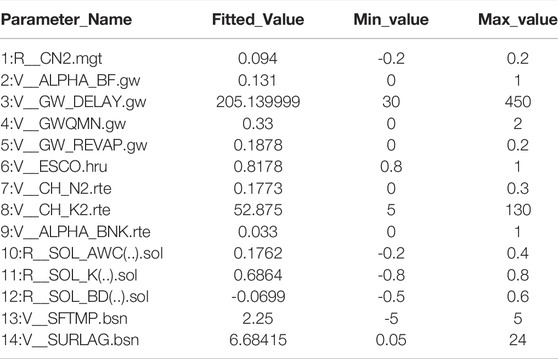
TABLE 3. The best-fitting parameters calculated using NS.
The diagram (Figure 2) illustrates the calibration and validation processes concerning the observed data.
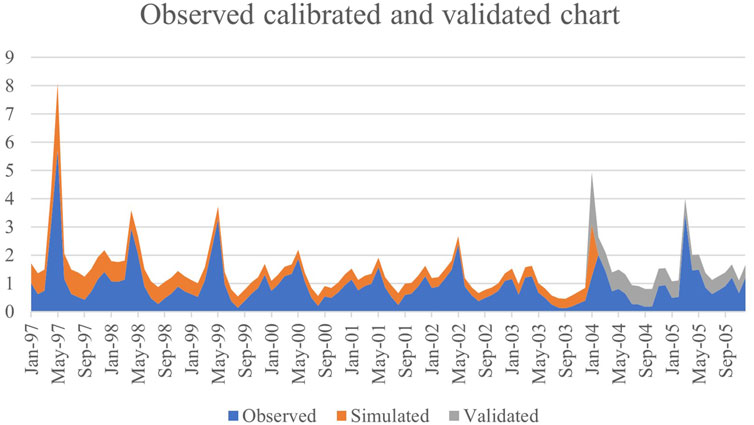
FIGURE 2. Calibration and validation chart.
Fitted calibration parameters are written to SWAT, and simulation was performed using new data.
Results
The initial findings for the watershed are shown in Table 4, where a minor rise in the forest (FRSE) class is found. The analysis revealed that forest cover increased in the northern part of the Štavska River basin, but active deforestation, especially illegal logging, affected the basin’s southern part (Figure 3).
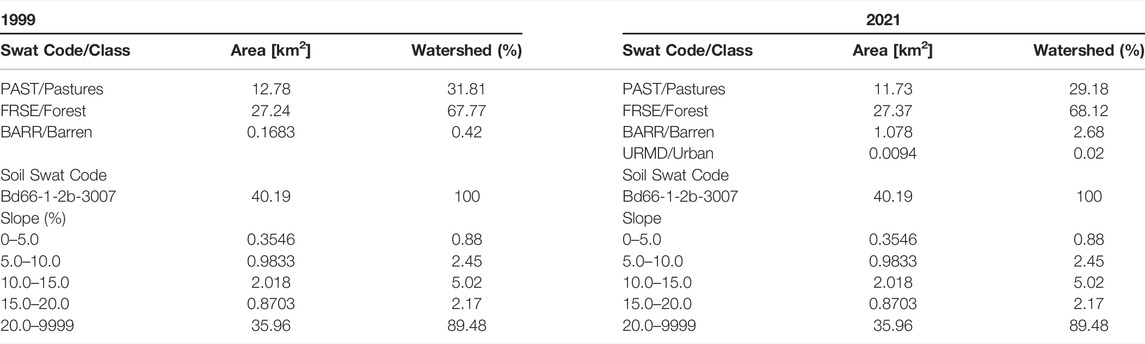
TABLE 4. HRU report for Štavska River basin.
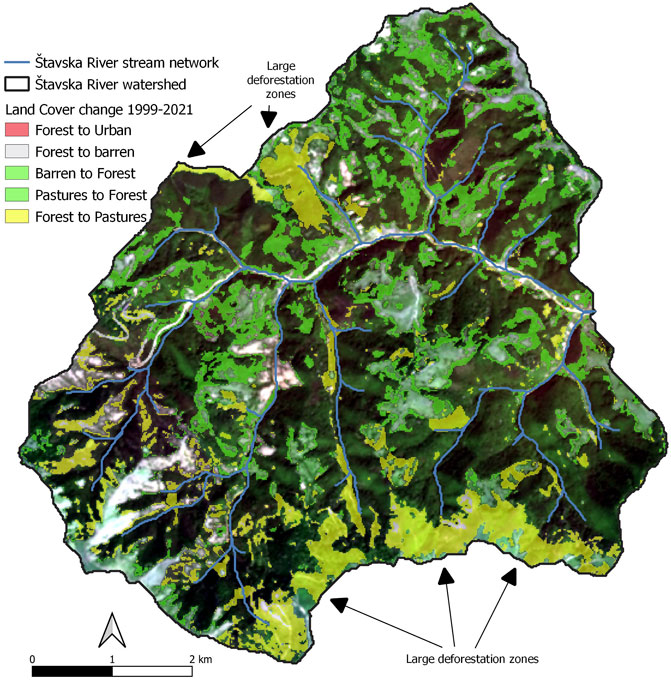
FIGURE 3. Štavska river watershed, selected change detection classes.
The Land Cover change matrix shows the extension of land cover change over 22 years (Table 5).
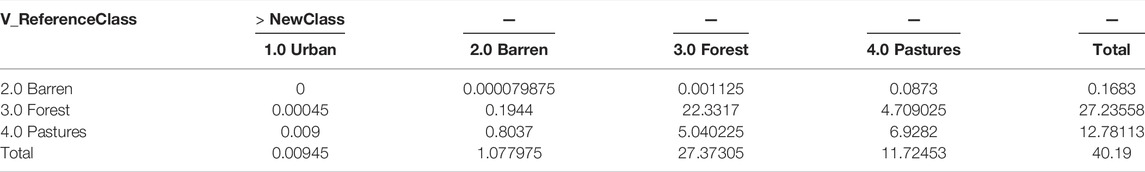
TABLE 5. Land Cover change matrix (km2) for the whole watershed.
The most significant changes occurred in the class Pastures in the observed period, where 4.79 km2 of other classes changed to this class compared to 1999, mainly from the Forest class on 4.7 km2. Losses of the Forest class in favor of other classes are 4.9 km2, while gains from other classes are 5.04 km2. The area in which class remained unchanged during this period was omitted from the calculation.
The initial topographic report shows that this is a primarily mountainous area with a mean elevation of 1,147.03 m a.s.l. (Table 6).

TABLE 6. Topographic report for Štavska River basin (elevation above sea level).
More than 67% of the watershed is covered by forest for both years, while pastures cover more than 29% of the watershed. Soil is presented with one class, Dystric Cambisols, while most of the terrain is highly sloped, with more than 89% of the area sloped above 20%.
The simulation outcomes for the entire Štavska river basin indicate no significant difference between results for water balance ratios and sediment budget from instream processes for simulated years—1999 and 2021 (Table 7).
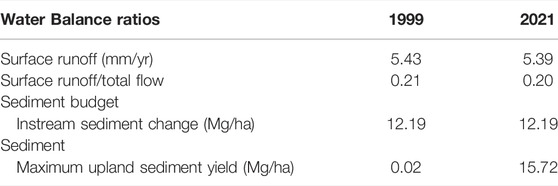
TABLE 7. SWAT results for the Štavska River watershed.
Due to changes in land cover, significantly different data is presented as sediment yield in Table 7. One of the most important reasons for this increase in maximum upland sediment yield is illegal logging.
The uncertain data generated by the simulation for the whole Štavska river basin illustrate the basin’s conflicting dynamics. Additional scenarios were simulated for two mountainous streams in the southern section of the Štavska River watershed to get conclusive results on the impact of illegal logging on increased water balance ratios and erosion dynamics (Figure 4).
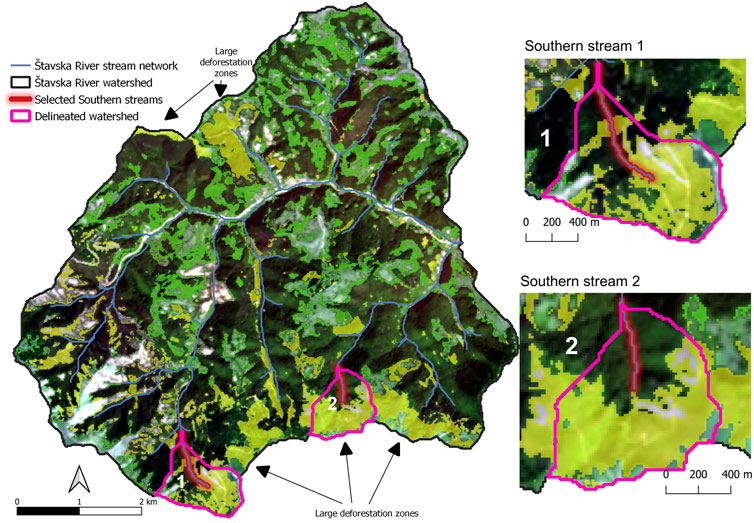
FIGURE 4. Štavska River selected Southern mountainous streams.
Both streams’ water balance ratios confirm the significant change in the water cycle process. The sediment budget shows a loss in available sediment material from the corresponding watersheds for 2021.
Surface runoff for both cases increases as deforestation occurs. While stream 1 is under a more negligible impact, stream two is heavily influenced by deforestation, where runoff is more than twice in 2021 and the Surface Runoff/Total Flow indicator (Table 8).
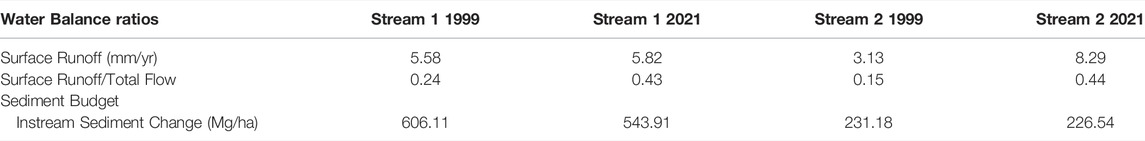
TABLE 8. SWAT results for Štavska River selected Southern mountainous streams.
Discussion
Forests play a vital role in human society that cannot be overstated. Its role is not solely productive; the pressures on this natural resource are becoming increasingly severe due to climate change, overexploitation, inadequate management, and increasing illegal logging. For this reason, there is an increasing need for information about this natural resource, both in quantitative and qualitative terms, at all planning and decision-making levels - from local to global. The state of the environment in many developing countries, such as Serbia, is often portrayed through inadequate and outdated data. Apart from the fact that the information used is obsolete, there is also the problem of insufficient presentation of causes for forest area loss.
Advances in remote sensing and available data from remote sensors and GIS analysis have given significant new perspectives for mapping land cover changes. GIS has a wide application in forest modelling, dispersion, and identification of essential features, allowing for a deeper understanding of the forest fund and its relationship with other elements (Valjarević et al., 2018a). This kind of action provides complete information on the quality and extent of forest cover in Serbia and contributes to the effectiveness and efficiency of the country’s forest conservation program (Potapov et al., 2015).
Illegal logging, without a doubt, has a significant negative influence on the environment. Modelling the outputs of this process demonstrates a new domain that SWAT, a technique that has been used for a variety of reasons, can represent. Within the USDA Conservation Effects Assessment Program, the model is used to examine maximum daily loads (Borah et al., 2006), substantial water regions (Jha et al., 2006), and environmental protection (Mausbach and Dedrick, 2004). SWAT is also used in hydrological modelling to show how climate change affects the ecosystem and how soil erosion affects the water balance (Yang and Zhang, 2016; Setyorini et al., 2017; Singh and Goyal, 2017). SWAT has been used to estimate the impact of urbanization on the hydrology of an area, assess an area, and execute a hydrological simulation for the development of a small hydropower plant (Goyal et al., 2015; Rospriandana and Fujii, 2017; Potić, 2018; Potić et al., 2021).
The impact of illegal logging in southern Serbia, specifically in the municipality of Kuršumlija, is examined. Unresolved political and administrative issues between Serbia and its south Autonomous Province of Kosovo and Metohija have aggravated the situation in this area, making it more challenging to implement the law. AP Kosovo and Metohija have been under the interim administration of the United Nations (UNMIK) since the end of the NATO bombing of the FRY in 1999, following UN Security Council Resolution 1244. AP share borders with Albania, Northern Macedonia, and Montenegro, with the administrative line to Serbia. Furthermore, it is a region that the processes of deruralization and deagrarization have significantly impacted. The study’s findings suggest that forest vegetation is growing in the northern areas of the municipality, where the population has declined dramatically, and settlements are nearly extinct. The forest cover has decreased near the administrative line in the southern region of the analyzed area because the southern province has a lower rate of depopulation, a substantial number of people illegally cross the administrative line and engage in illegal logging to provide energy for the winter. These consequences occur as the primary energy source in the research area is dirty energy or non-renewable energy obtained primarily from deforestation (Valjarević et al., 2018b). In addition to the severe economic repercussions, the devastation of land and increased erosion in the basin have significant environmental consequences.
When all the natural elements stated above are taken into consideration, the issue arises as to whether the environment has a ready response to each of them. The change in land cover impacts the surface runoff, and the river regimes are also changed; erosion increases; however, the implications are substantially more than indicated. In the northern part of the observed watershed, we have the appearance of active forestation, which was caused by a large population loss (migration). On the southern part of the basin, we have the appearance of large environmental stress—deforestation, initiated by human factors. The specificity of this region, which persists for a long period, is a result of the indicated sociological dynamics. The environment has its response to this specificity, which is presented in this paper using hydrological processes for the area where large deforestation occurs. Variable levels of surface runoff are deeply connected to vegetation dynamics (Syversen, 2005; El Kateb et al., 2013), and the shift in this indicator has been used as a basis to determine man’s destructive influence on the environment. Besides increased surface runoff, this type of human interference with nature has an impact on the total water balance of the basin, which includes altering the river flow regime and sediment yield (Truong et al., 2018), all of which contribute to a significant level of environmental stress. These hydrological processes must be monitored regularly, but there are many examples in which this is not feasible due to a lack of measurement stations in the area, as in this case.
Given Serbia’s status as a developing country, almost no field data required for this type of environmental analysis has been collected. Therefore, SWAT is well suited for performing computations and simulations of water cycles and erosion in remote basins where data is unavailable. A powerful tool for spatial analysis is acquired by combining remote sensing methods that may be utilized to obtain both climatological and land cover data.
The data used in this study are medium-resolution spatial data. It is desirable to get high-resolution satellite imagery to classify land cover, produce a more accurate digital elevation model, collect more exact field meteorological data where it is feasible, and do precise soil analysis and mapping to produce precise calculations.
Conclusion
During the last several decades, the southern part of Central Serbia has been under significant environmental changes, including depopulation as a social factor and deforestation as a natural factor at first glance. In this process, meadows and pastures are abandoned due to population aging and emigration, while forest areas expand. Illegal logging and timber trafficking are becoming a significant threat to entire ecosystems, and legal trade flows despite the transition to renewable energy sources. Illegal logging and timber trade have various causes in different countries, like challenging forest protection due to inaccessible terrain, poverty, the need for illegal logging to provide livelihoods, law enforcement inconsistency, an insufficient supply of alternative energy sources, and others.
Besides these socio-trends, alpine locations in Serbia, not only in Kuršumlija municipality, are experiencing severe land degradation due to this illegal activism. The current research focuses on natural-based consequences: increased surfaced runoff and soil erosion in the watershed. The available input data determine the hydrological model’s quality. Different data types were used in the analysis, including a DEM, a land cover map, a soil map, and weather data. The land cover map was produced using satellite data from various times to compare the results. This methodology sheds light on the environment’s response to human impact during the study period, while the results show an expansion in surface runoff and sediment in the research area, concluding that illegal logging is rapidly expanding. The most effective solution for the observed changes in the environment is to stop illegal logging and timber trading by resolving the leading causes.
The combination of remote sensing and SWAT methodologies demonstrates that these techniques are viable instruments for analyzing environmental changes and processes and may thus be used to forecast future trends and more sophisticated studies of land change and degradation.
Data Availability Statement
The original contributions presented in the study are included in the article/Supplementary Material, further inquiries can be directed to the corresponding author.
Author Contributions
IP and LM have started a drafting project. VŠ, NĆ and MM all contributed to the work’s design and production. LM gathered and analyzed relevant research. IP set up the database, processed all of the data, and created graphics. IP also drafted a rough draft of the manuscript. Parts of the manuscript were written by VŠ, MM, LM, and NĆ. All authors participated to the manuscript’s editing and reviewed and approved the final version. They have made major contributions to this field of study as a team.
Conflict of Interest
The authors declare that the research was conducted in the absence of any commercial or financial relationships that could be construed as a potential conflict of interest.
Publisher’s Note
All claims expressed in this article are solely those of the authors and do not necessarily represent those of their affiliated organizations, or those of the publisher, the editors and the reviewers. Any product that may be evaluated in this article, or claim that may be made by its manufacturer, is not guaranteed or endorsed by the publisher.
Footnotes
1FLEGT Proposal for an EU Action Plan, 21 May 2003. Communication from the Commission to the Council and the European Parliament.
References
Abbaspour, K. C., Rouholahnejad, E., Vaghefi, S., Srinivasan, R., Yang, H., and Kløve, B. (2015). A Continental-Scale Hydrology and Water Quality Model for Europe: Calibration and Uncertainty of a High-Resolution Large-Scale SWAT Model. J. Hydrology 524, 733–752. doi:10.1016/j.jhydrol.2015.03.027
Abbaspour, K. C., Yang, J., Maximov, I., Siber, R., Bogner, K., Mieleitner, J., et al. (2007). Modelling Hydrology and Water Quality in the Pre-alpine/alpine Thur Watershed Using SWAT. J. Hydrology 333 (2–4), 413–430. doi:10.1016/j.jhydrol.2006.09.014
Abbaspour, K., Vaghefi, S., and Srinivasan, R. (2017). A Guideline for Successful Calibration and Uncertainty Analysis for Soil and Water Assessment: A Review of Papers from the 2016 International SWAT Conference. Water 10 (1), 6. doi:10.3390/w10010006
Arancibia, J. L. P. (2013). Impacts of Land Use Change on Dry Season Flows across the Tropics Forests as ‘Sponges’ and ‘Pumps’. dissertation. London, GB: University of London, 262 p.
Arnold, J. G., Kiniry, J. R., Srinivasan, R., Williams, J. R., Haney, E. B., and Neitsch, S. L. (2012). Soil and Water Assessment Tool, Input/Output Documentation, Version 2012. Texas, USA: Texas Water Resources Institute.
Banković, S., Medarević, M., Pantić, D., and Petrović, N. (2009). “The National Forest Inventory of Serbia,” in Ministry of Agriculture Forestry and Water Management of the Republic of Serbia (Belgrade: Planeta Print).
Bewket, W., and Sterk, G. (2005). Dynamics in Land Cover and its Effect on Stream Flow in the Chemoga Watershed, Blue Nile Basin, Ethiopia. Hydrol. Process. 19, 445–458. doi:10.1002/hyp.5542
Blackman, A. (2013). Evaluating Forest Conservation Policies in Developing Countries Using Remote Sensing Data: An Introduction and Practical Guide. For. Policy Econ. 34, 1–16. doi:10.1016/j.forpol.2013.04.006
Borah, D. K., Yagow, G., Saleh, A., Barnes, P. L., Rosenthal, W., Krug, E. C., et al. (2006). Sediment and Nutrient Modeling for TMDL Development and Implementation. Trans. ASABE 49 (4), 967–986. doi:10.13031/2013.21742
Bosch, J. M., and Hewlett, J. D. (1982). A Review of Catchment Experiments to Determine the Effect of Vegetation Changes on Water Yield and Evapotranspiration. J. Hydrology 55, 3–23. doi:10.1016/0022-1694(82)90117-2
Bruijnzeel, L. A. (1989). (De)forestation and Dry Season Flow in the Tropics: a Closer Look. J. Trop. For. Sci. 1 (3), 229–243. Retrieved: http://www.jstor.org/stable/43594578.
Bruijnzeel, L. A. (2004). Hydrological Functions of Tropical Forests: Not Seeing the Soil for the Trees? Agric. Ecosyst. Environ. 104, 185–228. doi:10.1016/j.agee.2004.01.015
Costa, M. H., Botta, A., and Cardille, J. A. (2003). Effects of Large-Scale Changes in Land Cover on the Discharge of the Tocantins River, Southeastern Amazonia. J. Hydrology 283, 206–217. doi:10.1016/s0022-1694(03)00267-1
El Kateb, H., Zhang, H., Zhang, P., and Mosandl, R. (2013). Soil Erosion and Surface Runoff on Different Vegetation Covers and Slope Gradients: A Field Experiment in Southern Shaanxi Province, China. Catena 105, 1–10. doi:10.1016/j.catena.2012.12.012
Farley, K. A., Jobbagy, E. G., and Jackson, R. B. (2005). Effects of Afforestation on Water Yield: a Global Synthesis with Implications for Policy. Glob. Change Biol. 11 (10), 1565–1576. doi:10.1111/j.1365-2486.2005.01011.x
Food and Agriculture Organization (2004). “Global Forest Resources Assessment Update 2005,” in Terms and Definitions (Final Version) Forest Resources Assessment Programme Working Paper 83/E (Rome: FAO).
Food and Agriculture Organization. (2006). Institutional Development and Capacity Building for the National Forest Program and FAO Project GCP/FRY/003/FIN: "Forest Sector Development in Serbia". Project FAO/TCP/YUG/2902(A). Available at: https://www.fao.org/3/k9589e/k9589e13.pdf. (Accessed March 12, 2022).
Franklin, S. E. (2001). Remote Sensing for Sustainable Forest Management (1st ed). CRC Press. doi:10.1201/9781420032857
Goyal, M. K., Singh, V., and Meena, A. H. (2015). Geospatial and Hydrological Modeling to Assess Hydropower Potential Zones and Site Location over Rainfall Dependent Inland Catchment. Water Resour. Manage 29 (8), 2875–2894. doi:10.1007/s11269-015-0975-1
Haywood, C., and Henriot, C. (2019). Protecting Forests from Conversion: The Essential Role of Supply-Side National Laws. Front. For. Glob. Change 2, 35. doi:10.3389/ffgc.2019.00035
Hidrološki godišnjak (1997). Republički Hidrometeorološki Zavod, 1. Površinske Vode. Retrieved from https://www.hidmet.gov.rs/latin/hidrologija/povrsinske_godisnjaci.php. (Accessed January 10, 2022).
Hidrološki godišnjak (1998). Republički Hidrometeorološki Zavod, 1. Površinske Vode. Retrieved from https://www.hidmet.gov.rs/latin/hidrologija/povrsinske_godisnjaci.php. (Accessed January 10, 2022).
Hidrološki godišnjak (1999). Republički Hidrometeorološki Zavod, 1. Površinske Vode. Retrieved from https://www.hidmet.gov.rs/latin/hidrologija/povrsinske_godisnjaci.php. (Accessed January 10, 2022).
Hidrološki godišnjak (2000). Republički Hidrometeorološki Zavod, 1. Površinske Vode. Retrieved from https://www.hidmet.gov.rs/latin/hidrologija/povrsinske_godisnjaci.php. (Accessed January 10, 2022).
Hidrološki godišnjak (2001). Republički Hidrometeorološki Zavod, 1. Površinske Vode. Retrieved from https://www.hidmet.gov.rs/latin/hidrologija/povrsinske_godisnjaci.php. (Accessed January 10, 2022).
Hidrološki godišnjak (2002). Republički Hidrometeorološki Zavod, 1. Površinske Vode. Retrieved from https://www.hidmet.gov.rs/latin/hidrologija/povrsinske_godisnjaci.php. (Accessed January 10, 2022).
Hidrološki godišnjak (2003). Republički Hidrometeorološki Zavod, 1. Površinske Vode. Retrieved from https://www.hidmet.gov.rs/latin/hidrologija/povrsinske_godisnjaci.php. (Accessed January 10, 2022).
Hidrološki godišnjak (2004). Republički Hidrometeorološki Zavod, 1. Površinske Vode. Retrieved from https://www.hidmet.gov.rs/latin/hidrologija/povrsinske_godisnjaci.php. (Accessed January 10, 2022).
Hidrološki godišnjak (2005). Republički Hidrometeorološki Zavod, 1. Površinske Vode. Retrieved from https://www.hidmet.gov.rs/latin/hidrologija/povrsinske_godisnjaci.php. (Accessed January 10, 2022).
Japan Aerospace Exploration Agency (2017). “ALOS Global Digital Surface Model,” in ALOS World 3D - 30m (AW3D30). [Data set]. Tokyo, Japan. Retrieved from http://www.eorc.jaxa.jp/ALOS/en/aw3d30/index.htm (Accessed March 15, 2022).
Jha, M., Arnold, J. G., Gassman, P. W., Giorgi, F., and Gu, R. R. (2006). Climate Chhange Sensitivity Assessment on Upper Mississippi River Basin Streamflows Using Swat. J. Am. Water Resour. Assoc. 42, 997–1015. doi:10.1111/j.1752-1688.2006.tb04510.x
Jovanović, M., Milanović, M. M., and Vračarević, B. R. (2017). Comparing NDVI and Corine Land Cover as Tools for Improving National Forest Inventory Updates and Preventing Illegal Logging in Serbia. Vegetation. Editor A. Sebata (London: IntechOpen). doi:10.5772/intechopen.71845
Kaplan, G., and Avdan, U. (2017). Algorithm for Snow Monitoring Using Remote Sensing Data. Anadolu Univ. J. Sci. Technol. A- Appl. Sci. Eng. 18 (1), 238–246. doi:10.18038/aubtda.273972
Karasiak, N. (2016). Dzetsaka Qgis Classification Plugin. Available at: https://github.com/nkarasiak/dzetsaka (Accessed December 15, 2021).
Kashaigili, J. J. (2008). Impacts of Land-Use and Land-Cover Changes on Flow Regimes of the Usangu Wetland and the Great Ruaha River, Tanzania. Phys. Chem. Earth, Parts A/B/C 33, 640–647. doi:10.1016/j.pce.2008.06.014
Kumar, S., Singh, A., and Shrestha, D. P. (2016). Modelling Spatially Distributed Surface Runoff Generation Using SWAT-VSA: a Case Study in a Watershed of the North-West Himalayan Landscape. Model. Earth Syst. Environ. 2 (4), 1–11. doi:10.1007/s40808-016-0249-9
Lal, R. (19931993). “Challenges in Agriculture and Forest Hydrology in the Humid Tropics,” in Hydrology and Water Management in the Humid Tropics. Editors M. Bonell, M. M. Hufschmidt, and J. S. Gladwell (Cambridge, UK: Cambridge University Press), 395–404. ISBN 0-521-02002-6. doi:10.1017/cbo9780511564468.021
Lausch, A., Erasmi, S., King, D., Magdon, P., and Heurich, M. (2016). Understanding Forest Health with Remote Sensing -Part I-A Review of Spectral Traits, Processes and Remote-Sensing Characteristics. Remote Sens. 8, 1029. doi:10.3390/rs8121029
Lawrence, M., McRoberts, R. E., Tomppo, E., Gschwantner, T., and Gabler, K. (2010). “Comparisons of National Forest Inventories,” in National Forest Inventories. Editors E. Tomppo, T. Gschwantner, and M. L. Rem (New York: Springer). doi:10.1007/978-90-481-3233-1_2
Li, J., Liu, C., Wang, Z., and Liang, K. (2015). Two Universal Runoff Yield Models: SCS vs. LCM. J. Geogr. Sci. 25 (3), 311–318. doi:10.1007/s11442-015-1170-2
Li, Z., Liu, W.-z., Zhang, X.-c., and Zheng, F.-l. (2009). Impacts of Land Use Change and Climate Variability on Hydrology in an Agricultural Catchment on the Loess Plateau of China. J. Hydrology 377, 35–42. doi:10.1016/j.jhydrol.2009.08.007
Lillesand, T. M., Kiefer, R. W., and Chipman, J. W. (2004). Remote Sensing and Image Interpretation, 3. New York: John Wiley and Sons, 756.
Liu, W., Wei, X., Fan, H., Guo, X., Liu, Y., Zhang, M., et al. (2015). Response of Flow Regimes to Deforestation and Reforestation in a Rain-Dominated Large Watershed of Subtropical China. Hydrol. Process. 29, 5003–5015. doi:10.1002/hyp.10459
MacDicken, K. G. (2015). Global Forest Resources Assessment 2015: what, Why and How? For. Ecol. Manag. 352, 3–8. doi:10.1016/j.foreco.2015.02.006
Mausbach, M. J., and Dedrick, A. R. (2004). The Length We Go: Measuring Environmental Benefits of Conservation Practices. J. Soil Water Conservation 59 (5), 96A–103A. Retrieved from https://www.jswconline.org/content/59/5/96A.
Mehan, S., Neupane, R. P., and Kumar, S. (2017). Coupling of SUFI 2 and SWAT for Improving the Simulation of Streamflow in an Agricultural Watershed of South Dakota. Hydrol. Curr. Res. 8, 280. doi:10.4172/2157-7587.1000280
Montandon, L., and Small, E. (2008). The Impact of Soil Reflectance on the Quantification of the Green Vegetation Fraction from NDVI. Remote Sens. Environ. 112 (4), 1835–1845. doi:10.1016/j.rse.2007.09.007
Montzka, C., Bayat, B., Tewes, A., Mengen, D., and Vereecken, H. (2021). Sentinel-2 Analysis of Spruce Crown Transparency Levels and Their Environmental Drivers after Summer Drought in the Northern Eifel (Germany). Front. For. Glob. Change 4, 667151. doi:10.3389/ffgc.2021.667151
MWSWAT 2012 (2021). Soil & Water Assessment Tool. Retrieved from https://swat.tamu.edu/software/mwswat/. (Accessed February 10, 2022).
Myneni, R. B., Tucker, C. J., Asrar, G., and Keeling, C. D. (1998). Interannual Variations in Satellite-Sensed Vegetation Index Data from 1981 to 1991. J. Geophys. Res. 103, 6145–6160. doi:10.1029/97jd03603
Neitsch, S. L., Arnold, J. G., Kiniry, J. R., and Williams, J. R. (2011). Soil and Water Assessment Tool, Theoretical Documentation. Texas, USA: Texas Water Resources Institute.
Nie, W., Yuan, Y., Kepner, W., Nash, M. S., Jackson, M., and Erickson, C. (2011). Assessing Impacts of Landuse and Landcover Changes on Hydrology for the Upper San Pedro Watershed. J. Hydrology 407, 105–114. doi:10.1016/j.jhydrol.2011.07.012
Nonić, D., Ranković, N., Nedeljković, J., Glavonjić, P., and Marinković, M. (2011). “Transition Process in Forestry in Serbia and Selected CSEE Countries: Policy and Property Rights Reforms,” in Proceedings of the 13 th International Symposium. Legal Aspects of European Forest Sustainable Development. Editors R. Deltuvas, P. Herbst, and G. Činga (Kaunas, Lithuania: Aleksandras Stulginskis University), 177–188.
Ogden, F. L., Crouch, T. D., Stallard, R. F., and Hall, J. S. (2013). Effect of Land Cover and Use on Dry Season River Runoff, Runoff Efficiency, and Peak Storm Runoff in the Seasonal Tropics of Central Panama. Water Resour. Res. 49, 8443–8462. doi:10.1002/2013wr013956
Osepashvili, I. (2011). “Towards Improvement of the Wood Verification System in Georgia,” in Proceedings of the 13 th International Symposium. Legal Aspects of European Forest Sustainable Development. Editors R. Deltuvas, P. Herbst, and G. Činga (Kaunas, Lithuania: Aleksandras Stulginskis University), 41–54.
Potapov, P. V., Turubanova, S. A., Tyukavina, A., Krylov, A. M., McCarty, J. L., Radeloff, V. C., et al. (2015). Eastern Europe's Forest Cover Dynamics from 1985 to 2012 Quantified from the Full Landsat Archive. Remote Sens. Environ. 159, 28–43. doi:10.1016/j.rse.2014.11.027
Potic, I., Curcic, N., Radovanovic, M., Stanojevic, G., Malinovic-Milicevic, S., Yamashkin, S., et al. (2021). Estimation of Soil Erosion Dynamics Using Remote Sensing and Swat in Kopaonik National Park, Serbia. J. Geogr. Inst. Cvijic 71 (3), 231–247. doi:10.2298/ijgi2103231p
Potić, I. (2018). Geosystem Analysis of Multiple Environmental Stresses in the Evaluation of Small Hydro Power Plants in Serbia (In Serbian). Belgrade: University of Belgrade - Faculty of Geography.
P. W. Gassman, P. W., M. R. Reyes, M. R., C. H. Green, C. H., and J. G. Arnold, J. G. (2007). The Soil and Water Assessment Tool: Historical Development, Applications, and Future Research Directions. Trans. ASABE 50 (4), 1211–1250. doi:10.13031/2013.23637
QGIS Development Team (2021). QGIS Geographic Information System. Open-Source Geospatial Foundation Project. Available at: http://qgis.osgeo.org. (Accessed February 10, 2022).
QSWAT3 (2022). Soil & Water Assessment Tool Version 1.1. Retrieved from https://swat.tamu.edu/software/qswat/. (Accessed February 10, 2022).
Rallison, R. E., and Miller, N. (1981). “Past, Present and Future SCS Runoff Procedure,” in Rainfall Runoff Relationship. Editor V. P. Singh (Littleton, CO: Water Resources Publication), 353–364.
Romijn, E., Lantican, C. B., Herold, M., Lindquist, E., Ochieng, R., Wijaya, A., et al. (2015). Assessing Change in National Forest Monitoring Capacities of 99 Tropical Countries. For. Ecol. Manag. 352, 109–123. doi:10.1016/j.foreco.2015.06.003
Rospriandana, N., and Fujii, M. (2017). Assessment of Small Hydropower Potential in the Ciwidey Subwatershed, Indonesia: a GIS and Hydrological Modeling Approach. Hydrological Res. Lett. 11 (1), 6–11. doi:10.3178/hrl.11.6
Sartoretto, E., Henriot, C., Bassalang, M.-M., and Nguiffo, S. (2017). “How Existing Legal Frameworks Shape Forest Conversion to Agriculture,” in A Study of the Congo Basin (Rome: FAO). Legal Papers No. 102. Available online at: http://www.fao.org/3/a-i7947e.pdf.
Setyorini, A., Khare, D., and Pingale, S. M. (2017). Simulating the Impact of Land Use/land Cover Change and Climate Variability on Watershed Hydrology in the Upper Brantas Basin, Indonesia. Appl. Geomat. 9 (3), 191–204. doi:10.1007/s12518-017-0193-z
Simić, Z., Prohaska, S., Milivojević, N., and Orlić, A. (2004). Modeling of the Precipitation/runoff Process in Sub-catchments of the Drina River Basin by the SWAT Method (In Serbian). Vodoprivreda 36 (1-2), 113–122.
Singh, V., and Goyal, M. K. (2017). Unsteady High Velocity Flood Flows and the Development of Rating Curves in a Himalayan Basin under Climate Change Scenarios. J. Hydrol. Eng. 22 (8), 04017023. doi:10.1061/(asce)he.1943-5584.0001530
SWAT-CUP (2021). SWAT-CUP 2019, v. 5.2.1.1. Retrieved from https://www.2w2e.com/home/SwatCup. (Accessed February 17, 2022).
Syversen, N. (2005). Effect and Design of Buffer Zones in the Nordic Climate: The Influence of Width, Amount of Surface Runoff, Seasonal Variation and Vegetation Type on Retention Efficiency for Nutrient and Particle Runoff. Ecol. Eng. 24 (5), 483–490. doi:10.1016/j.ecoleng.2005.01.016
Tadono, T., Nagai, H., Ishida, H., Oda, F., Naito, S., Minakawa, K., et al. (2016). Generation of the 30 M-Mesh Global Digital Surface Model by Alos Prism. Int. Arch. Photogramm. Remote Sens. Spat. Inf. Sci. XLI-B4, 157–162. doi:10.5194/isprs-archives-xli-b4-157-2016
Taff, G. N., Müller, D., Kuemmerle, T., Ozdeneral, E., and Walsh, S. J. (2010). “Reforestation in Central and Eastern Europe after the Breakdown of Socialism,” in Reforesting Landscapes. Editors H. Nagendra, and J. Southworth (New York: Springer), 121–147.
The digital Soil Map of the World-DSMW v.3.6 (2003). FAO Soils Portal, FAO/UNESCO Soil Map of the World. Retrieved from https://www.fao.org/soils-portal/soil-survey/soil-maps-and-databases/faounesco-soil-map-of-the-world/en/. (Accessed January 07, 2022).
Truong, N., Nguyen, H., and Kondoh, A. (2018). Land Use and Land Cover Changes and Their Effect on the Flow Regime in the Upstream Dong Nai River Basin, Vietnam. Water 10 (9), 1206. doi:10.3390/w10091206
United States Geological Survey, Earth Resources Observation and Science Center (2021a). Landsat 7 ETM+ Level-2 [Data Set]. Reston, VA: USGS. doi:10.5066/F7Q52MNK
United States Geological Survey, Earth Resources Observation and Science Center (2021b). Landsat 8 OLI/TIRS C1 Level-1 [Data Set]. Reston, VA: USGS. doi:10.5066/F71835S6
University Corporation for Atmospheric Research & National Centre for Environmental Prediction (2018). NCEP Climate Forecast System Reanalysis. Retrieved from https://rda.ucar.edu. (Accessed January 08, 2022).
Valjarević, A., Djekić, T., Stevanović, V., Ivanović, R., and Jandziković, B. (2018a). GIS Numerical and Satellite Detection Analysis of Forest Changes in the Toplica District for the Period of (1953-2013). Appl. Geogr. 92, 131–139. doi:10.1016/j.apgeog.2018.01.016
Valjarević, A., Srećković-Batoćanin, D., Valjarević, D., and Matović, V. (2018b). A GIS-Based Method for Analysis of Energy Capacity and Efficiency of Thermo-Mineral Springs in the Municipality of Kuršumlija (Serbia). Renew. Sustain. Energy Rev. 92, 948–957. doi:10.1016/j.rser.2018.05.005
Vigiak, O., Malagó, A., Bouraoui, F., Vanmaercke, M., and Poesen, J. (2015). Adapting SWAT Hillslope Erosion Model to Predict Sediment Concentrations and Yields in Large Basins. Sci. Total Environ. 538, 855–875. doi:10.1016/j.scitotenv.2015.08.095
Wang, Q., and Tenhunen, J. D. (2004). Vegetation Mapping with Multitemporal NDVI in North Eastern China Transect (NECT). Int. J. Appl. Earth Observation Geoinformation 6 (1), 17–31. doi:10.1016/j.jag.2004.07.002
Williams, J. R. (1995). “The EPIC Model,” in Computer Models of Watershed Hydrology. Editor V. P. Singh (Highlands Ranch, US: Water Resources Publications). Chapter 25, (909-1000).
Wishmeier, W. H., and Smith, D. D. (1978). Predicting Rainfall Erosion Losses. Washington: USDA Agricultural Research Service. Handbook 537.
Woodcock, C. E., Allen, R., Anderson, M., Belward, A., Bindschadler, R., Cohen, W. B., et al. (2008). Free Access to Landsat Data (Letter). Science 80, 320. doi:10.1126/science.320.5879.1011a
World Bank (2005). Ensuring Sustainability of Forests and Livelihoods through Improved Governance and Control of Illegal Logging for Economies in Transition. Washington D. C: World Bank.
Xiao, X., Boles, S., Liu, J., Zhuang, D., and Liu, M. (2002). Characterization of Forest Types in Northeastern China, Using Multi-Temporal SPOT-4 VEGETATION Sensor Data. Remote Sens. Environ. 82, 335–348. doi:10.1016/s0034-4257(02)00051-2
Yang, Q., and Zhang, X. (2016). Improving SWAT for Simulating Water and Carbon Fluxes of Forest Ecosystems. Sci. Total Environ. 569-570, 1478–1488. doi:10.1016/j.scitotenv.2016.06.238
Keywords: forest overcut, land cover change detection, Kursumlija municipality, illegal logging, SWAT, simulation
Citation: Potić I, Mihajlović LM, Šimunić V, Ćurčić NB and Milinčić M (2022) Deforestation as a Cause of Increased Surface Runoff in the Catchment: Remote Sensing and SWAT Approach—A Case Study of Southern Serbia. Front. Environ. Sci. 10:896404. doi: 10.3389/fenvs.2022.896404
Received: 15 March 2022; Accepted: 03 May 2022;
Published: 01 June 2022.
Edited by:
Ivica Milevski, Saints Cyril and Methodius University of Skopje, North MacedoniaReviewed by:
Zbigniew Zwoliński, Adam Mickiewicz University, PolandGowhar Meraj, Government of Jammu and Kashmir, India
Copyright © 2022 Potić, Mihajlović, Šimunić, Ćurčić and Milinčić. This is an open-access article distributed under the terms of the Creative Commons Attribution License (CC BY). The use, distribution or reproduction in other forums is permitted, provided the original author(s) and the copyright owner(s) are credited and that the original publication in this journal is cited, in accordance with accepted academic practice. No use, distribution or reproduction is permitted which does not comply with these terms.
*Correspondence: Ljiljana M. Mihajlović, bGxqaWxqYUBnbWFpbC5jb20=