 Wei Yang1*
 Xiaoli Jiang2
- 1School of Geography Science, Taiyuan Normal University, Jinzhong, Shanxi, China
- 2Research Center for Scientific Development in Fenhe River Valley, Taiyuan Normal University, Jinzhong, Shanxi, China
Vegetation burning in China contributes significantly to atmospheric pollution and climate change. However, most recent studies have focused on forest fires, ignoring grassland fires. Besides, there was a generally high uncertainty in the estimated fire emission because of missing small fire data and limited local vegetation data. This study employed high-resolution burned area data (GABAM, global annual burned area map) and land cover data to develop a high-resolution (30 m) emission inventory of vegetation burning in China in 2000, 2005, 2010, 2015, and 2018. Eleven pollutants were estimated, including CO, CH4, NOx, non-methane volatile organic carbon (NMVOC), SO2, NH3, PM2.5, PM10, organic carbon (OC), black carbon (BC), and CO2. The cumulative pollutant emissions from the temporal and spatial variation analyses of the burned area and emissions reached 1.21 × 10⁵ Gg. Specifically, CO2 was the largest emission, with a mean annual emission of 2.25 × 10⁴ Gg, accounting for 92.46% of the total emissions. CO was the second-largest emission, with a mean annual emission of 1.13 × 10³ Gg. PM10 and PM2.5 emissions were also relatively high, with a mean annual emission of 200.5 and 140.3 Gg, respectively, with that of NMVOC (159.24 Gg) in between. The emissions of other pollutants, including OC, NOx, CH4, NH3, SO2, and BC, were relatively low. The South, Southwest, East, and Northeast of China contributed the most emissions. Shrubland contributed the most emissions for different vegetation types, followed by forest and grassland. Consequently, this study provides scientific evidence to support understanding the influence of fire on the local environment and policy on China’s air pollution control.
Introduction
Fire is a critical disturbance to the global ecological system (Kelly and Brotons, 2017; Ba et al., 2019) because it influences the vegetation system (Belenguer-Plomer et al., 2019). Meanwhile, the large amount of biomass burning causes significant emissions, affecting atmospheric composition (Chuvieco et al., 2019). The annual global average burned area is about 3 × 10⁸ ha, accounting for 3% of the global land area (Giglio et al., 2013; Forkel et al., 2019). Emissions from biomass fire have become a critical source of global atmospheric pollutants, accounting for 40%, 35%, and 20% of the total global CO, carbonaceous aerosol, and nitrogen oxide sources, respectively (Langmann et al., 2009). Moreover, burning discharges large amounts of particulate matter (PM), volatile organic compounds (VOC), organic carbon (OC), and black carbon (BC), which can significantly affect air quality, climate change, and human health (Keene et al., 2006; Qiu et al., 2016). Therefore, evaluating fire emissions is significant for atmospheric chemical processes and climate change research.
Two traditional methods have been widely used to estimate fire emissions: top-down (Wooster et al., 2005) and bottom-up (Seiler and Crutzen, 1980) methods. The top-down method assumes that fire radiative power (FRP) observed by satellite remote sensing, can be employed as a direct measurement of fire emissions, which leads to a high uncertainty (He et al., 2011). Whereas the bottom-up method, which is more popular, calculates fire emissions by estimating the amount of fuel consumed in the fire (Koplitz et al., 2018; Urbanski et al., 2018). Four factors are needed in the bottom-up model, viz. burned area (BA), fuel loading (FL), combustion efficiency (CE), and emission factor (EF). CE and EF can be derived experimentally, while BA and FL can be estimated via remote sensing (Zhang et al., 2011). Among the four factors, BA provides numerous information, including fire position, time, area, spatial extent, etc., toward identifying burned vegetation type and estimating FL (Meng and Zhao, 2017). In previous studies, remote sensing-based BA products were mostly used, such as MCD45A1, MCD64A1, and Fire_CCI (Chang and Song, 2010; Shi et al., 2014; Pessôa et al., 2020). These three BA products are based on MODIS (moderate-resolution imaging spectroradiometer) data with a spatial resolution of 500 and 250 m, respectively (Turco et al., 2019). The spatial resolution of these BA products is relatively low. Because of the remote sensing scale effect, low spatial resolution data yields low accuracy, such as feature extraction, spatial structure analysis, etc. (Duveiller and Defourny, 2010; Lázaro et al., 2013). Moreover, small fires also impact air quality significantly (Okoshi et al., 2014). However, because of the low spatial resolution, all BA products exhibit low small-fire detection accuracy (Brennan et al., 2019), resulting in a potential error in fire emission estimation. Therefore, to improve the accuracy, high spatial resolution BA products should be employed.
Forest fires are rampant in China, with about 3,880 incidents occurring annually, varying widely among the regions (Ying et al., 2018). Most existing studies on forest fire emissions were at the regional scale, including the boreal region of China (Guo et al., 2020), southwest China (Wang et al., 2020), central and eastern China (Wu et al., 2018), Heilongjiang province (Hu et al., 2007), etc. There is a need to calculate the total emissions among different regions. However, there is a lack of research on a national scale.
Moreover, grasslands cover 40% of the total area, of which 30% are impacted by fire annually (Liu et al., 2017). Evaluating the emissions from grassland fires is essential for atmospheric chemical processes and climate change research (Yu et al., 2020). Therefore, this paper assessed China’s emissions from vegetation burning (including forest, shrubland, and grassland burnings). To avoid the potential error caused by the low spatial resolution of BA data, we employed GABAM (global annual burned area map) at 30 m spatial resolution. The temporal and spatial characteristics of fire emissions were also analyzed. Our findings can potentially provide a scientific basis for air pollution assessment and related atmospheric research.
Methodology
Study area
China has abundant forests and grasslands. According to the seventh national forest resource inventory, the forests and grasslands cover about 20.36% and 40.00% of the total land area (Ji et al., 2011; Wang et al., 2018). According to the climatic conditions and the province boundary, the study area was divided into seven regions: Northeast, North, Central, East, South, Southwest, and Northwest China (Figure 1). The largest region was Northwest China, contains the Ningxia Hui Autonomous Region, the Xinjiang Uygur Autonomous Region, Qinhai, Shaanxi and Gansu province, the total area is about 3.08 × 10⁶ km2. The smallest region was South China, contains the Hong Kong Special Administrative Region, the Macao Special Administrative Region, Guangdong Guangxi and Hainan province. The division of the seven regions was commonly used in China. The inset is the border of the South China sea islands.
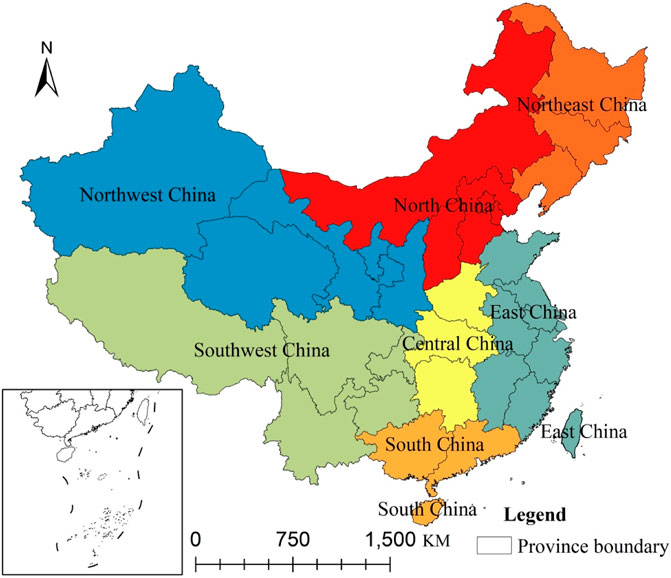
FIGURE 1. Map of the study area showing the seven regions in China considered in the study.
For different regions, South and Northeast China have higher forest coverage rates of 44.06% and 41.26%, respectively. The forest cover in Northwest China was the lowest (6.33%). The forest cover rate in Southwest, Central, East, and North China was 28.71%, 39.90%, 36.02%, and 17.51%, respectively. For grassland, Southwest and Northeast were also higher than other regions; the cover rate reached 44.03% and 39.29%. The lowest region was Central China, where the grass cover rate was a mere 5.52%.
Fire emission model
A bottom-up method (Seiler and Crutzen, 1980) was employed to estimate the emissions caused by vegetation fire. The model is as follows:
where BA is the burned area (km2), FL is the fuel loading factor (represented by biomass density, kt/km2), CE is combustion efficiency (represented by the proportion of burned biomass), and EF is the emission factor (represented by the mass of emissions per mass of dry biomass burned, g/kg).
Burned area
The GABAM dataset was employed as burned area. The dataset was released by the Chinese Academy of Science in 2018, and it was the first global burned area dataset with 30 m spatial resolution. GABAM generated based on Landsat images and analysis showed a high correlation with Fire_CCI (Long et al., 2019). The detail of GABAM is available at the download website: https://vapd.gitlab.io/post/gabam/.
Pu et al. (2020) employed a stratified random sampling method to validate GABAM accuracy in 2010 (Pu et al., 2020). The result showed that the overall accuracy reached 97.85%, and the commission and omission errors were 24.32% and 31.60%, respectively. The accuracy was higher than those of the MODIS products, whose commission and omission errors were approximately 44% and 70%, respectively (Padilla et al., 2014; Padilla et al., 2015). The dataset was grid-formatted with a 10° × 10° range for each image and provided burned area data in 2000, 2005, 2010, 2015, and 2018. The data were resampled into a 30 m × 30 m grid to develop a high-resolution map of vegetation burning (Figure 2).
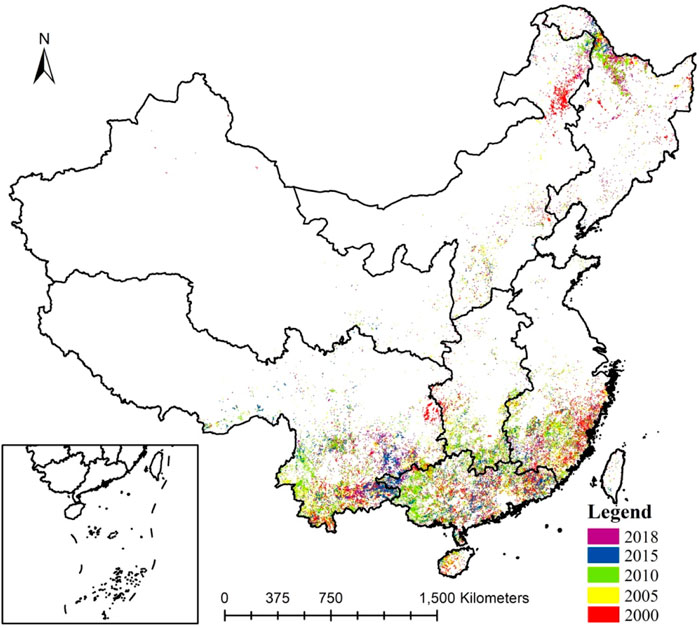
FIGURE 2. Burned area of vegetation fire from 2000 to 2018.
Fuel loading
The FL parameter was obtained based on the land cover type. The China multi-period land use land cover data (CNLUCC) were used. The data were generated with a visual interpretation method based on Landsat remote-sensing data, provided by the Data Center for Resources and Environmental Sciences, Chinese Academy of Science (http://www.resdc.cn). The data were 88.95% accurate, meeting the needs of this study (Liu et al., 2014). The forest, shrubland, and grassland areas were obtained based on CNLUCC. According to the Functional map of Vegetation in China (National Cryosphere Desert Data Center of China), the forest area was subdivided into evergreen coniferous forest, deciduous coniferous forest, deciduous broadleaf forest, evergreen broadleaf forest, and mixed forest. Finally, seven vegetation types were derived in 2015 (Figure 3).
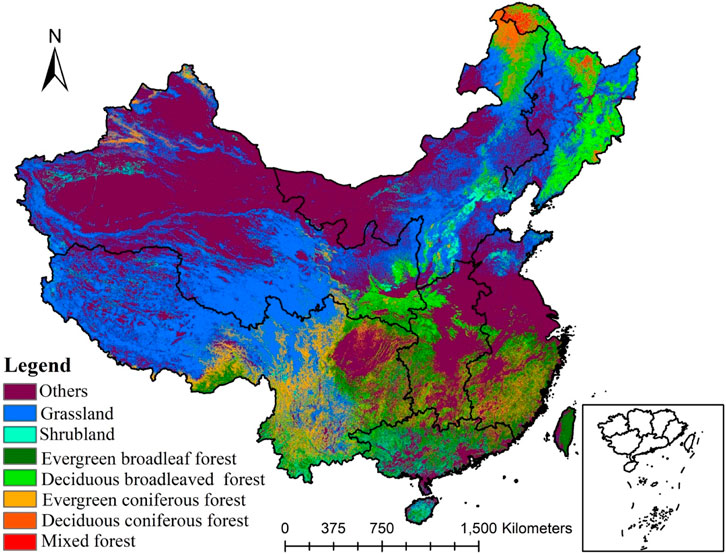
FIGURE 3. Distribution of vegetation types in China.
Previous studies that estimated fire emissions usually set an averaged FL value for each land cover type based on the aboveground biomass density (Duncan et al., 2003; Hoelzemann et al., 2004). However, a fixed value could not reflect the spatial difference in the various vegetations and biomasses, especially in China, where FL changes significantly with regions (Fang et al., 1998). In this study, biomass density data were collected for each vegetation type in different provinces in China. Then, an average value was calculated and used for each region (Table 1). The FL was determined based on vegetation type and biomass density (He et al., 2015).
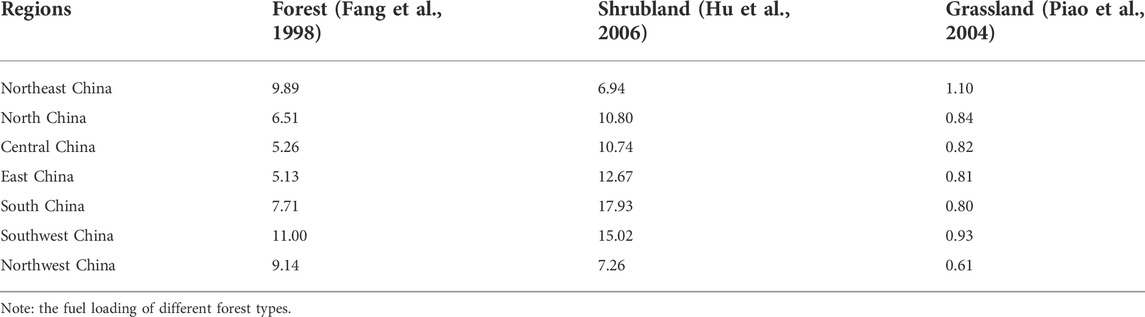
TABLE 1. Regional fuel loading (kt/km2) for various land cover types in China.
Combustion efficiency
The CE represents the proportion of burned biomass. The CE of the forest was set as 0.28, i.e., an average value reported by Qiu (Qiu et al., 2016) and Michel (Michel et al., 2005), whereas for shrubland and grassland, CE was set as 0.68 (Michel et al., 2005; Kato et al., 2011) and 0.95 (Keene et al., 2006; Kato et al., 2011), respectively.
Emission factor (EF)
The EF is the amount of trace gases and particulate matter released from burning 1 kg of dry matter. The value of EF was set according to the land cover type. All EF values were based on existing studies (Wooster et al., 2005; Keene et al., 2006; McMeeking, 2008; Van der Werf et al., 2010). Where the EF value was dissimilar among the studies, an average was calculated and used. The EF values and the standard deviations are shown in Table 2.
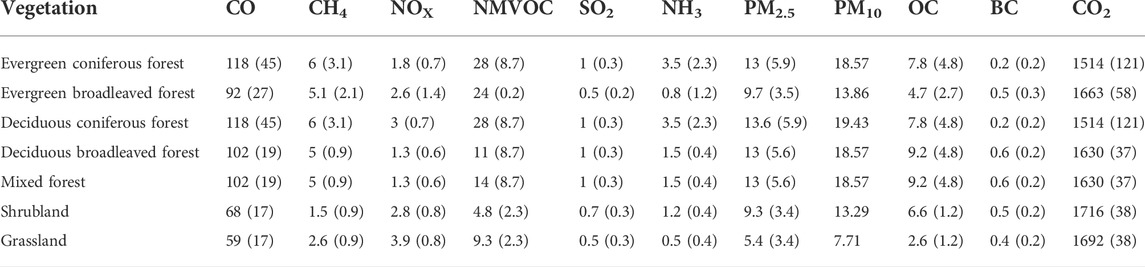
TABLE 2. Emission factor assigned to the various land cover types (g/kg dry matter).
Results
Burned area distribution
As shown in Figure 2, the vegetation system in China was severely disturbed by fire. In total, the burned area reached 1.54 × 10⁶ hm2 in the 5 years studied, with an annual average value of 3.08 × 10⁵ hm2. The burned areas vary widely from year to year. The most and least severe years were 2005 and 2015, when they reached 5.04 × 10⁵ and 9.42 × 10⁴ hm2, respectively. The burned area in other years was 4.68 × 10⁵ (2000), 2.99 × 10⁵ (2010), and 1.74 × 10⁵ hm2 (2018).
Also, the burned area differs significantly among the regions (Figure 4 and Table 3). Among the seven regions, South China, Southwest China, and Northeast China were substantially impacted by fire. High vegetation coverage, climatic conditions, and frequent human activities were the main reasons for the high fire occurrence in these regions. South China had the largest burned area (mean = 9.11 × 10⁴ hm2), accounting for 29.59% of the total burned area. Southwest China was the second most affected area by fire. The mean burned area reached 2.15 × 10⁴ hm2, accounting for 26.08% of the total burned area. Next in magnitude were the burned areas in Northeast China (mean = 4.79 × 10⁴ hm2) and East China (mean = 5.07 × 10⁴ hm2), accounting for 15.54% and 16.46%, respectively. The impact of fire on North and Central China was relatively small, resulting in 5.15% and 6.97% proportions, respectively. Overall, Northwest China had the smallest burned area of 637 hm2 during the 5 years, contributing 0.21% of the total burned area.
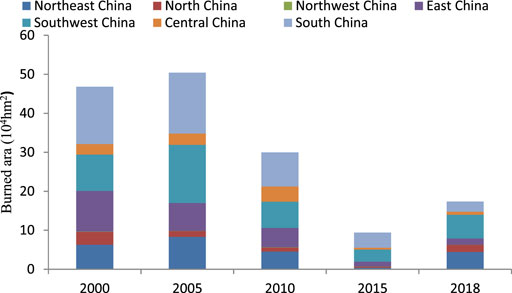
FIGURE 4. Burned areas of various regions in China.
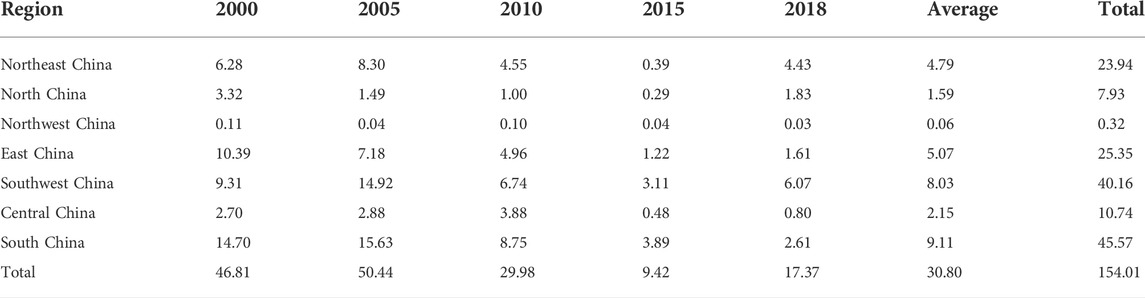
TABLE 3. Burned area in various Chinese regions (unit: 104 hm2).
Statistics have shown that the fire data and burned area from 2000 to 2005 were much higher than in other years, similar to our findings. The factors affecting fire occurrence are complex. Relevant studies showed that climate variables explained 37.1–43.5% of the fire occurrence variability, while human activities described 27.0–36.5% of variability (Wu et al., 2019).
As shown in Figure 5, forest fire is the primary fire type; the proportion was >60% during the study period. The largest and the least proportion of forest fire was in 2000 and 2010, accounted for 69.77% and 60.43% respectively. The average proportion of forest fire was 63.97%. The second is shrubland fire, the average proportion was 19.50% in the study period. The largest year was 2005, accounted for 22.26% of the total burned area. The least year was 2018, the proportion was 16.23%. Grassland fire had the least proportion with an average proportion of 16.54%. The largest and the least year of grassland fire was 2018 and 2000, accounted for 22.43% and 12.04% respectively.
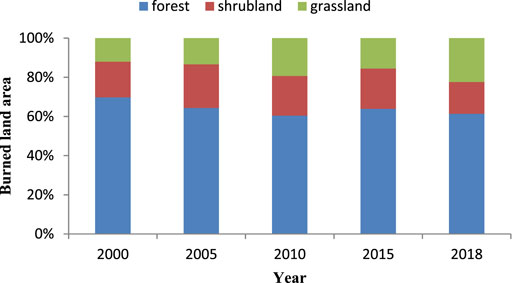
FIGURE 5. Burned area proportion of various vegetation type.
Pollutant emissions and regional contributions
Using the method in Section 2.2, eleven pollutant emissions were estimated at a spatial resolution of 30 m × 30 m. Figure 6 depicts the distribution of CO2 in 2018. The spatial distribution and patterns of the emissions were similar to the burned area. However, the emission amount of each grid was different. Take CO2 as an example, the value range in 2018 was 0.98–20.92 kt/km2.
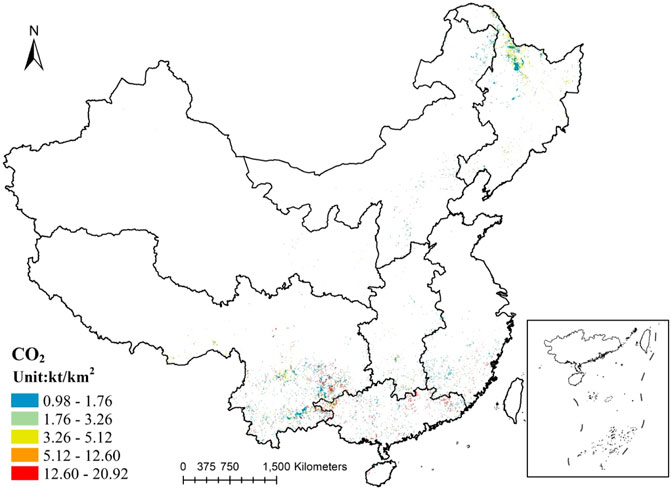
FIGURE 6. The spatial distribution of emissions of CO2 in China in 2018.
The total vegetation burning emissions of CO, CH4, NOx, non-methane VOC (NMVOC), SO2, NH3, PM2.5, PM10, OC, BC, and CO2 are listed in Table 4. The 5-year cumulative emission reached 1.21 × 10⁵ Gg, averaging 2.42 × 10⁴ Gg. The highest (4.21 × 10⁴ Gg) and lowest (7.84 × 10³ Gg) emissions were recorded in 2000 and 2015, respectively, indicating a significant difference in the emissions after a decade. Whereas the emission amounts in 2000, 2010, and 2018 were 4.22 × 10⁴, 2.23 × 10⁴, and 1.08 × 10⁴ Gg, respectively. CO2 was the most abundant pollutant from the fires, totaling 1.12 × 10⁵ Gg, which accounted for 92.46% of the total emissions. It was followed by CO (5.63 × 10³ Gg), accounting for 4.64%. The proportions of other pollutants were below 1% (Table 4).
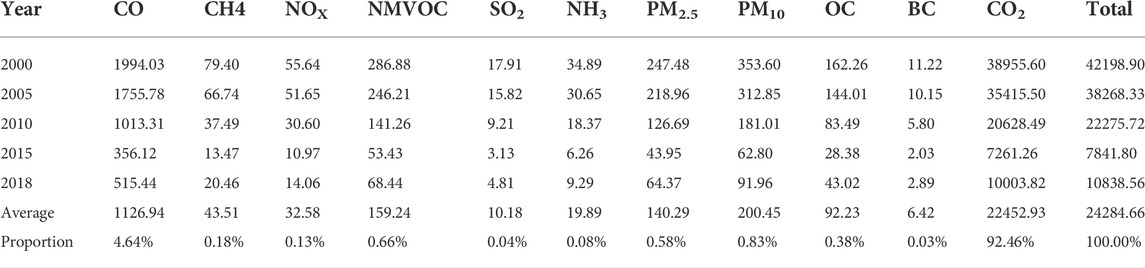
TABLE 4. Estimated annual emission of various pollutants from the study area between 2000 and 2018 (Unit: Gg).
The quantity of pollutant emissions in the various regions changed significantly (Table 5). The highest and lowest regions were South China (5.69 × 10⁴ Gg) and Northwest China (122.20 Gg), accounting for 46.85% and 0.10% of the total emissions, respectively. Southwest China is the second largest region with a total emission of 2.87 × 10⁴ Gg, accounting for 23.67% of the total emissions. The emissions of other regions were between 3.98 × 10³ and 1.57 × 10⁴ Gg, and the proportions were between 3.28% and 12.94%.
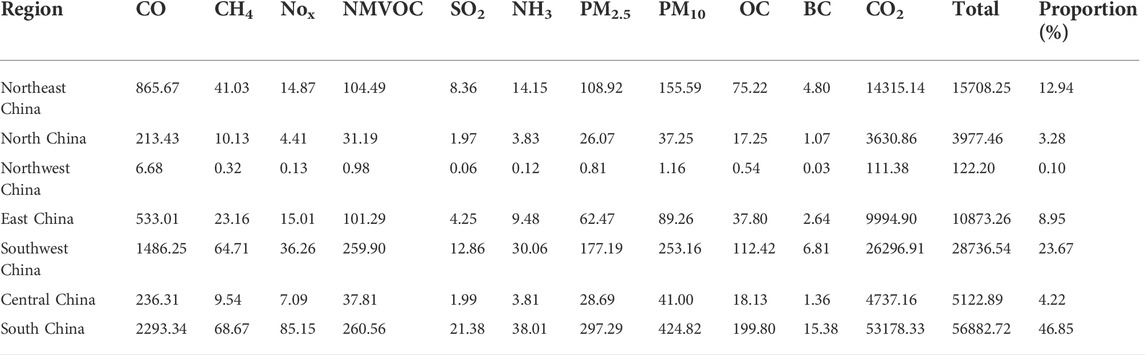
TABLE 5. Amount of pollutant emissions in the various regions (Unit: Gg).
Contribution of various vegetation types
Of the various vegetation types, shrubland contributed the highest emissions (Figure 7). The average amount of emissions from shrubland was 1.29 × 10⁴ Gg in the studied 5 years, with an average proportion of 53.07%. Still on shrubland, South China contributed the highest emissions in the study period, accounting for 60.70%, 60.27%, 62.76%, 59.55%, and 43.30%, respectively. The second-largest contributor from shrubland fires was Southwest China, contributing 17.26%, 21.60%, 12.13%, 17.09%, and 28.39% for the aforementioned years.
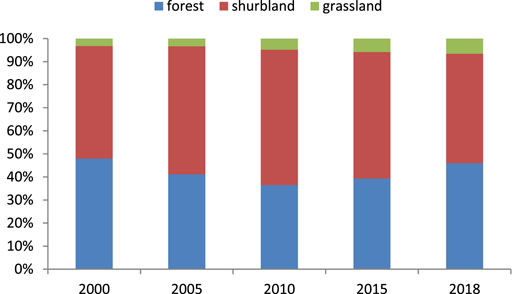
FIGURE 7. Contribution proportion of various vegetation types on the total emissions per year.
Forest fire was the second-largest emission source throughout the study period in the study location (Figure 7). The average emission amount from forest fires was 1.04 × 10⁴ Gg and the average proportion was 42.17%. For the forest area, Southwest China was the largest emission source in 2005, 2010, 2015, and 2018, contributing 40.54%, 36.02%, 44.99%, and 45.43%, respectively. Northeast China was the second most significant source, and it was the largest emission source in 2000, accounting for 31.68% of the total emission. In 2005, and 2018, Northeast China was the second-largest source, and the proportions were 22.65% and 29.58, respectively. South China was also important in forest fire emissions. In 2010 and 2015, South China was the second-largest source, and the proportions were 19.53% and 28.88%, respectively.
Overall, grasslands contributed the least emissions (Figure 7). The average amount of grassland fire emissions was 0.98 × 10³ Gg in the study period, resulting in an average contribution of 4.76%. Northeast China was the largest emission source of grassland fires for the study period. They accounted for 57.10%, 29.28%, 53.97%, 26.06%, and 42.11% of the total emissions, respectively. Second on order was North China, responsible for 31.06%, 32.84%, 21.49%, and 12.46% in 2000, 2005, 2010, and 2018, respectively. Southwest China was also crucial to grassland fire emissions, accounting for 15.30%, 21.17%, 33.00%, and 29.16% in 2005, 2010, 2015, and 2018, respectively. For all the vegetation types, Northwest China was the lowest contributor during the study period.
Discussion
Comparison to other studies
Most studies have estimated fire emissions in China at a regional scale. Yang et al. calculated emissions of six pollutants (CO, CO2, NOX, CH4, NMVOC, and PM2.5) in the southern provinces of China from 2000 to 2016 (Yang et al., 2018). The result showed that South China’s total average annual pollutant emission was 1.61 × 10⁴ Gg, higher than observed in the current study (1.12 × 10⁴ Gg) (Figure 8). For each pollutant, our results were also lower than those of Yang et al.
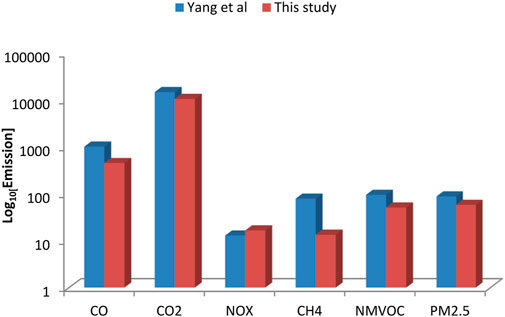
FIGURE 8. Comparison of previous studies on vegetation burning emissions.
Wei et al. estimated the average annual emissions of CO2, CO, and CH4 in the Heilongjiang province of China from 1953 to 2012 (Wei et al., 2014) as 3.15 × 10³, 177, and 10.5 Gg, respectively. Their results are similar to those of the current study, i.e., 2.72 × 10³, 171, and 8.1 Gg, respectively. Both compared studies were based on statistical calculations, while our result was based on satellite-derived data. There are some differences in the burned area, which could account for the discrepancy.
Elsewhere, Wang et al. estimated forest fire emissions in Southwest China from 2013 to 2017 based on MODIS burned area product (MCD64A1) (Wang et al., 2020). The result showed that the average emissions of CO2, CO, and CH4 were 1.42 × 10³, 91.66, and 4.52 Gg, respectively. Their result is much lower than our result; i.e., 5.26 × 10³, 297.25, and 12.94 Gg, respectively. The low spatial resolution of burned area data was majorly responsible for the difference. It caused the small fires (less than 500 m × 500 m) not considered in their study.
Burned area and emission analysis
Fire is an important disturbance of vegetation in China. Three different fires, including forest fires, shrubland fires, and grassland fires were analyzed in the study. The result showed that forest fires had the largest burned area, exceeding 60% of the total burned area in each studied year. For different regions, South China was mostly influenced by fire, as identified by a previous study (Wu et al., 2019). South China is an essential agroforestry region in China where the forest borders the farmland. Agricultural fire has become an important cause of fire such as field fires for land reclamation. Furthermore, the main causes of fires were related to human activities in China (Zhong et al., 2003), the population density in South China is large which increasing the risk of human-caused fires.
Although forest fire-burned area accounted for a much larger proportion, shurbland fire was the main contributor to air pollution. The reason is that shrubland was much higher than forest for other factors in calculating fire emissions, including the following: 1) Except for Northeast and Northwest China, in other regions, the FL of shrubland is larger than forest. Especially in South China (with the largest burned area), the FL of shrubland is 17.93 kt/km2, 2.33 times that of forest (7.71 kt/km2) (Qiu et al., 2016); 2) The CE of shrubland is 2.43 times that of forest, set with 0.68 and 0.28, respectively, according to the existed studies; 3) For most pollutant, the EF of shrubland is less than that of forest, such as CO, CH4, NMVOC, etc. But for CO2, which accounted for 92.43% of the total emissions, the EF of shrubland is larger than that of forest.
Limitation
In this study, GABAM was employed to improve the accuracy of burned area estimation. However, the other three factors, set by conventional methods, need to be improved.
Fuels in natural fires are often composed of different vegetation and non-plant matter. Vegetation includes forests, shrubland, grassland, dry branches, and fallen leaves, while non-plant matter predominantly includes humus and peat (Bennett et al., 2017). Most studies on evaluating FL have typically set a biome-averaged value for each land cover type at a large scale (Wooster et al., 2005; Wiedinmyer et al., 2006; Padilla et al., 2015). But this method has just considered forests, shrubland, and grassland; other fuel types are not considered, which could underestimate the fire emissions.
Remote sensing is an effective tool for mapping FL. For a high-spatial resolution remote sensing, more influencing factors (such as meteorological and environmental factors) should be employed in the FL estimation model. Furthermore, the fuel model in China is inadequate; it is necessary to construct a reliable and practical fuel model based on the domestic fuel distribution in China, toward meeting the needs of remote sensing applications (Wu et al., 2016).
CE is affected by fire intensity, fuel type, fuel load, and meteorological factors, such as wind speed, relative humidity (De Santis et al., 2010). CE is crucial to estimate emissions from fires accurately. At present, in the research of fire emission estimation, CE is often set as an empirical value (Wooster et al., 2005; Guo et al., 2020; Shi et al., 2021), which could cause a potential error in fire emission estimation (Sá et al., 2005). Another method to obtain CE has two stages viz. the fire intensity should be extracted first, and then, the fixed CE value is adjusted according to the relationship between fire intensity and CE (Veraverbeke and Hook, 2013). Fire intensity can be measured by spectral indexes calculated via remote sensing, such as the difference in normalized burn ratio and normalized burn ratio. However, this method is mainly used on a local scale and is difficult to apply to a large scale (Wu et al., 2016). Hence, new methods to calculate CE on large scale should be developed to reduce the uncertainty in fire emission estimation.
Conclusion
In this study, high spatial resolution burned area data were employed to evaluate the pollutant emissions from vegetation fires in China in 2000, 2005, 2010, 2015, and 2018. The main conclusions drawn are as follows:
(1) The vegetation system in China was severely disturbed by fire. In total, the burned area reached 1.54 × 10⁶ hm2 in the studied 5 years, with an annual average value of 3.08 × 10⁵ hm2. The distribution of burned areas varied considerably in the various regions. South, Southwest, and Northeast China were mostly affected by fire.
(2) The cumulative pollutant emissions in the 5 years reached 1.21 × 10⁵ Gg, and the total emissions of CO, CH4, NOx, NMVOC, SO2, NH3, PM2.5, PM10, OC, BC, and CO2 were 5.63 × 10³, 217, 162, 796, 50, 99, 701, 1.01 × 10³, 461, 32, and 1.12 × 10⁵ Gg, respectively. CO2 was the most abundant of the pollutants, accounting for 92.43% of the total emissions. It was followed by CO, contributing 4.64%. Other pollutants contributed <1% individually.
(3) Similar to burned area distribution, South China evinced the largest emissions, accounting for 46.85% of the total emission. It was followed by Southwest China with 23.67% contribution. In contrast, Northwest China accounted for the least emissions (0.10%).
(4) Finally, for the various vegetation types, shrubland contributed the maximum proportion of the total emissions in the 5 years, seconded by forest fires. Conversely, the contribution of grassland was the lowest. Overall, for shrubland, South China was the most prominent emission source. For forest, Southwest and Northeast China were the most significant contributors to pollutant emissions from fires in China. For grassland, Northeast and North China were the most significant contributors.
Data availability statement
The original contributions presented in the study are included in the article/Supplementary Material, further inquiries can be directed to the corresponding author.
Author contributions
WY wrote the paper, XJ processed the data.
Funding
Funding for this study was obtained through the Science and Technology Innovation Project of Universities in Shanxi Province, China (No. 2019L0815).
Acknowledgments
The authors thank the GABAM data provider and the reviewers for their valuable comments and suggestions.
Conflict of interest
The authors declare that the research was conducted in the absence of any commercial or financial relationships that could be construed as a potential conflict of interest.
Publisher’s note
All claims expressed in this article are solely those of the authors and do not necessarily represent those of their affiliated organizations, or those of the publisher, the editors and the reviewers. Any product that may be evaluated in this article, or claim that may be made by its manufacturer, is not guaranteed or endorsed by the publisher.
References
Ba, R., Song, W., Li, X., Xie, Z., and Lo, S. (2019). Integration of multiple spectral indices and a neural network for burned area mapping based on MODIS data. Remote Sens. 11, 326. doi:10.3390/rs11030326
Belenguer-Plomer, M. A., Tanase, M. A., Fernandez-Carrillo, A., and Chuvieco, E. (2019). Burned area detection and mapping using sentinel-1 backscatter coefficient and thermal anomalies. Remote Sens. Environ. 233, 111345. doi:10.1016/j.rse.2019.111345
Bennett, L. T., Bruce, M. J., Machunter, J., Kohout, M., Krishnaraj, S. J., and Aponte, C. (2017). Assessing fire impacts on the carbon stability of fire-tolerant forests. Ecol. Appl. 27 (8), 2497–2513. doi:10.1002/eap.1626
Brennan, J., Gómez-Dans, J. L., Disney, M., and Lewis, P. (2019). Theoretical uncertainties for global satellite-derived burned area estimates. Biogeosciences 16, 3147–3164. doi:10.5194/bg-16-3147-2019
Chang, D., and Song, Y. (2010). Estimates of biomass burning emissions in tropical asia based on satellite-derived data. Atmos. Chem. Phys. 10, 2335–2351. doi:10.5194/acp-10-2335-2010
Chuvieco, E., Mouillot, F., van der Werf, G. R., San Miguel, J., Tanase, M., Koutsias, N., et al. (2019). Historical background and current developments for mapping burned area from satellite earth observation. Remote Sens. Environ. 225, 45–64. doi:10.1016/j.rse.2019.02.013
De Santis, A., Asner, G. P., Vaughan, P. J., and Knapp, D. E. (2010). Mapping burn severity and burning efficiency in california using simulation models and landsat imagery. Remote Sens. Environ. 114, 1535–1545. doi:10.1016/j.rse.2010.02.008
Duncan, B. N., Martin, R. V., Staudt, A. C., Yevich, R., and Logan, J. A. (2003). Interannual and seasonal variability of biomass burning emissions constrained by satellite observations. J. Geophys. Res. 108, 4100. ACH 1-1-ACH 1-22. doi:10.1029/2002jd002378
Duveiller, G., and Defourny, P. (2010). A conceptual framework to define the spatial resolution requirements for agricultural monitoring using remote sensing. Remote Sens. Environ. 114, 2637–2650. doi:10.1016/j.rse.2010.06.001
Fang, J. Y., Wang, G. G., Liu, G. H., and Xu, S. L. (1998). Forest biomass of China: an estimate based on the biomass-volume relationship. Ecol. Appl. 8 (4), 1084–1091. doi:10.2307/2640963
Forkel, M., Andela, N., Harrison, S. P., Lasslop, G., Marle, M. v., Chuvieco, E., et al. (2019). Emergent relationships with respect to burned area in global satellite observations and fire-enabled vegetation models. Biogeosciences 16, 57–76. doi:10.5194/bg-16-57-2019
Giglio, L., Randerson, J. T., and Van Der Werf, G. R. (2013). Analysis of daily, monthly, and annual burned area using the fourth‐generation global fire emissions database (GFED4). J. Geophys. Res. Biogeosci. 118, 317–328. doi:10.1002/jgrg.20042
Guo, L., Ma, Y., Tigabu, M., Guo, X., Zheng, W., and Guo, F. (2020). Emission of atmospheric pollutants during forest fire in boreal region of china. Environ. Pollut. 264, 114709. doi:10.1016/j.envpol.2020.114709
He, M., Zheng, J., Yin, S., and Zhang, Y. (2011). Trends, temporal and spatial characteristics, and uncertainties in biomass burning emissions in the pearl river Delta, China. Atmos. Environ. 45 (24), 4051–4059. doi:10.1016/j.atmosenv.2011.04.016
He, M., Wang, X., Han, L., Feng, X., and Mao, X. J. H. j. k. x. H. k. (2015). Emission inventory of crop residues field burning and its temporal and spatial distribution in Sichuan province. Environ. Sci. 36, 1208–1216.
Hoelzemann, J. J., Schultz, M. G., Brasseur, G. P., Granier, C., and Simon, M. (2004). Global wildland fire emission model (GWEM): evaluating the use of global area burnt satellite data. J. Geophys. Res. 109, D14S04. doi:10.1029/2003jd003666
Hu, H. Q., Liu, Y. C., and Jiao, Y. (2007). Estimation of the carbon storage of forest vegetation and carbon emission from forest fires in heilongjiang province, China. J. For. Res. 18 (1), 17
Hu, H.-F., Wang, Z.-H., Liu, G.-H., and Fu, B.-J. (2006). Vegetation carbon storage of major shrublands in China. Chin. J. Plant Ecol. 30, 539–544. [In Chinese]. doi:10.17521/cjpe.2006.0071
Ji, L. Z., Wang, Z., Wang, X. W., and An, L. L. (2011). Forest insect pest management and forest management in China: an overview. Environ. Manag. 48 (6), 1107–1121. doi:10.1007/s00267-011-9697-1
Kato, E., Kawamiya, M., Kinoshita, T., and Ito, A. (2011). Development of spatially explicit emission scenario from land-use change and biomass burning for the input data of climate projection. Procedia Environ. Sci. 6, 146–152. doi:10.1016/j.proenv.2011.05.015
Keene, W. C., Lobert, J. M., Crutzen, P. J., Maben, J. R., Scharffe, D. H., Landmann, T., et al. (2006). Emissions of major gaseous and particulate species during experimental burns of southern african biomass. J. Geophys. Res. 111, D04301. doi:10.1029/2005jd006319
Kelly, L. T., and Brotons, L. (2017). Using fire to promote biodiversity. Science 355, 1264–1265. doi:10.1126/science.aam7672
Koplitz, S. N., Nolte, C. G., Pouliot, G. A., Vukovich, J. M., and Beidler, J. (2018). Influence of uncertainties in burned area estimates on modeled wildland fire PM2. 5 and ozone pollution in the contiguous US. Atmos. Environ. 191, 328–339. doi:10.1016/j.atmosenv.2018.08.020
Langmann, B., Duncan, B., Textor, C., Trentmann, J., and Van Der Werf, G. R. (2009). Vegetation fire emissions and their impact on air pollution and climate. Atmos. Environ. 43, 107–116. doi:10.1016/j.atmosenv.2008.09.047
Lázaro, J. R. G., Ruiz, J. A. M., and Arbeló, M. (2013). Effect of spatial resolution on the accuracy of satellite-based fire scar detection in the northwest of the Iberian Peninsula. Int. J. remote Sens. 34, 4736–4753. doi:10.1080/01431161.2013.781290
Liu, J., Kuang, W., Zhang, Z. X., Xu, X. L., Qin, Y. W., Ning, J., et al. (2014). Spatiotemporal characteristics, patterns, and causes of land-use changes in china since the late 1980s. J. Geogr. Sci. 24 (2), 195–210. doi:10.1007/s11442-014-1082-6
Liu, M., Zhao, J., Guo, X., Zhang, Z., Tan, G., and Yang, J. (2017). Study on climate and grassland fire in HulunBuir, Inner Mongolia autonomous region, China. Sensors 17, 616. doi:10.3390/s17030616
Long, T., Zhang, Z., He, G., Jiao, W., Tang, C., Wu, B., et al. (2019). 30 m resolution global annual burned area mapping based on Landsat Images and Google Earth Engine. Remote Sens. 11, 489. doi:10.3390/rs11050489
McMeeking, G. R. (2008). The optical, chemical, and physical properties of aerosols and gases emitted by the laboratory combustion of wildland fuels. Colorado: Colorado State University.
Meng, R., and Zhao, F. (2017). Remote sensing of fire effects: a review for recent advances in burned area and burn severity mapping. Remote Sensing of Hydrometeorological Hazards. Editors G. P. Petropoulos, and T. Islam (Boca Raton: CRC Press), 261–283.
Michel, C., Liousse, C., Grégoire, J. M., Tansey, K., Carmichael, G., and Woo, J. H. (2005). Biomass burning emission inventory from burnt area data given by the SPOT‐VEGETATION system in the frame of TRACE‐P and ACE‐Asia campaigns. J. Geophys. Res., 110, D09304. doi:10.1029/2004jd005461
Okoshi, R., Rasheed, A., Reddy, G. C., McCrowey, C. J., and Curtis, D. B. (2014). Size and mass distributions of ground-level sub-micrometer biomass burning aerosol from small wildfires. Atmos. Environ. 89, 392–402. doi:10.1016/j.atmosenv.2014.01.024
Padilla, M., Stehman, S. V., and Chuvieco, E. (2014). Validation of the 2008 MODIS-MCD45 global burned area product using stratified random sampling. Remote Sens. Environ. 144, 187–196. doi:10.1016/j.rse.2014.01.008
Padilla, M., Stehman, S. V., Ramo, R., Corti, D., Hantson, S., Oliva, P., et al. (2015). Comparing the accuracies of remote sensing global burned area products using stratified random sampling and estimation. Remote Sens. Environ. 160, 114–121. doi:10.1016/j.rse.2015.01.005
Pessôa, A. C. M., Anderson, L. O., Carvalho, N. S., Campanharo, W. A., Junior, C. H., Rosan, T. M., et al. (2020). Intercomparison of burned area products and its implication for carbon emission estimations in the amazon. Remote Sens. 12, 3864. doi:10.3390/rs12233864
Piao, S.-L., Fang, J.-Y., He, J.-S., and Xiao, Y. (2004). Spatial distribution of grassland biomass in China. Chin. J. Plant Ecol. 28, 491–498. doi:10.17521/cjpe.2004.0067
Pu, D. C., Zhang, Z. M., Long, T. F., He, G. J., Wang, G. Z., Sun, J. Y., et al. (2020). GABAM 2010 accruacy assessment using stratified radom sampling. J. Remote Sens. 24 (05), 550–558. doi:10.11834/jrs.20209171
Qiu, X., Duan, L., Chai, F., Wang, S., Yu, Q., and Wang, S. (2016). Deriving high-resolution emission inventory of open biomass burning in china based on satellite observations. Environ. Sci. Technol. 50, 11779–11786. doi:10.1021/acs.est.6b02705
Sá, A. C., Pereira, J. M., and Silva, J. M. (2005). Estimation of combustion completeness based on fire‐induced spectral reflectance changes in a dambo grassland (Western Province, Zambia). Int. J. Remote Sens. 26, 4185–4195. doi:10.1080/01431160500113468
Seiler, W., and Crutzen, P. J. (1980). Estimates of gross and net fluxes of carbon between the biosphere and the atmosphere from biomass burning. Clim. change 2, 207–247. doi:10.1007/bf00137988
Shi, Y., Gong, S., Zang, S., Zhao, Y., Wang, W., Lv, Z., et al. (2021). High-resolution and multi-year estimation of emissions from open biomass burning in northeast china during 2001–2017. J. Clean. Prod. 310, 127496. doi:10.1016/j.jclepro.2021.127496
Shi, Y., Sasai, T., and Yamaguchi, Y. (2014). Spatio-temporal evaluation of carbon emissions from biomass burning in southeast asia during the period 2001–2010. Ecol. Model. 272, 98–115. doi:10.1016/j.ecolmodel.2013.09.021
Turco, M., Herrera, S., Tourigny, E., Chuvieco, E., and Provenzale, A. (2019). A comparison of remotely-sensed and inventory datasets for burned area in mediterranean Europe. Int. J. Appl. Earth Obs. Geoinf. 82, 101887. doi:10.1016/j.jag.2019.05.020
Urbanski, S. P., Reeves, M. C., Corley, R. E., Silverstein, R. P., and Hao, W. M. (2018). Contiguous United States wildland fire emission estimates during 2003–2015. Earth Syst. Sci. Data 10, 2241–2274. doi:10.5194/essd-10-2241-2018
Van der Werf, G. R., Randerson, J. T., Giglio, L., Collatz, G., Mu, M., Kasibhatla, P. S., et al. (2010). Global fire emissions and the contribution of deforestation, savanna, forest, agricultural, and peat fires (1997–2009). Atmos. Chem. Phys. 10, 11707–11735. doi:10.5194/acp-10-11707-2010
Veraverbeke, S., and Hook, S. (2013). Evaluating spectral indices and spectral mixture analysis for assessing fire severity, combustion completeness and carbon emissions. Int. J. Wildland Fire 22, 707–720. doi:10.1071/wf12168
Wang, D. L., Wang, L., Liu, J. S., Zhu, H., and Zhong, Z. W. (2018). Grassland ecology in china: perspectives and challenges. Front. Agric. Sci. Eng. 5 (1), 24–43. doi:10.15302/j-fase-2018205
Wang, W., Zhang, Q., Luo, J., Zhao, R., and Zhang, Y. (2020). Estimation of forest fire emissions in southwest china from 2013 to 2017. Atmosphere 11, 15. doi:10.3390/atmos11010015
Wei, S. J., Luo, B. Z., Sun, L., and Hu, H. Q. (2014). Estimates of carbon emissions caused by forest fires in the temperate climate of Heilongjiang province, China, from 1953 to 2012. Acta Ecol. Sin. 34 (11), 3048–3063. doi:10.5846/stxb201212091770
Wiedinmyer, C., Quayle, B., Geron, C., Belote, A., McKenzie, D., Zhang, X., et al. (2006). Estimating emissions from fires in north america for air quality modeling. Atmos. Environ. 40, 3419–3432. doi:10.1016/j.atmosenv.2006.02.010
Wooster, M. J., Roberts, G., Perry, G. L. W., and Kaufman, Y. J. (2005). Retrieval of biomass combustion rates and totals from fire radiative power observations: FRP derivation and calibration relationships between biomass consumption and fire radiative energy release. J. Geophys. Res. 110, D24311. doi:10.1029/2005jd006318
Wu, J., Kong, S. F., Wu, F. Q., Cheng, Y., Zheng, S. R., Yan, Q., et al. (2018). Estimating the open biomass burning emissions in central and eastern china from 2003 to 2015 based on satellite observation. Atmos. Chem. Phys. 18 (16), 11623–11646. doi:10.5194/acp-18-11623-2018
Wu, Q., Chen, F., Wang, C., Li, B., Wu, W., Liu, S., et al. (2016). Estimationof carbon emissions from biomass burning based on parameters retrieved. J. Remote Sens. 20, 11–26.
Wu, Z., He, H. S., Keane, R. E., Zhu, Z. L., Wang, Y. Q., and Shan, Y. L. (2019). Current and future patterns of forest fire occurrence in china. Int. J. Wildland Fire 29 (2), 104–119. doi:10.1071/wf19039
Yang, X. j., Ma, Y. F., Peng, X. J., Guo, L. F., Cai, Q. J., and Guo, Z. F. (2018). Dynamic changes of pollutants released from forest fire in southern forested region during 2000-2016. China Environ. Sci. 38 (12), 4678
Ying, L., Han, J., Du, Y., and Shen, Z. (2018). Forest fire characteristics in china: spatial patterns and determinants with thresholds. For. Ecol. Manage. 424, 345–354. doi:10.1016/j.foreco.2018.05.020
Yu, S., Jiang, L., Du, W., Zhao, J. J., Zhang, H. Y., Zhang, Q. F., et al. (2020). Estimation and spatio-temporal patterns of carbon emissions from grassland fires in inner mongolia, china. Chin. Geogr. Sci. 30 (4), 572–587. doi:10.1007/s11769-020-1134-z
Zhang, J. H., Yao, F. M., Liu, C., Yang, L. M., and Boken, V. K. (2011). Detection, emission estimation and risk prediction of forest fires in china using satellite sensors and simulation models in the past three decades—an overview. Int. J. Environ. Res. Public Health 8 (8), 3156–3178. doi:10.3390/ijerph8083156
Keywords: fire emission, China, natural vegetation, temporal and spatial patterns, burned area
Citation: Yang W and Jiang X (2022) High-resolution estimation of air pollutant emissions from vegetation burning in China (2000–2018). Front. Environ. Sci. 10:896373. doi: 10.3389/fenvs.2022.896373
Received: 15 March 2022; Accepted: 20 July 2022;
Published: 19 August 2022.
Edited by:
Susana Barbosa, University of Porto, PortugalReviewed by:
Monika Friedemann, German Aerospace Center (DLR), GermanyLuciana Varanda Rizzo, Federal University of São Paulo, Brazil
Long Li, China University of Mining and Technology, China
Copyright © 2022 Yang and Jiang. This is an open-access article distributed under the terms of the Creative Commons Attribution License (CC BY). The use, distribution or reproduction in other forums is permitted, provided the original author(s) and the copyright owner(s) are credited and that the original publication in this journal is cited, in accordance with accepted academic practice. No use, distribution or reproduction is permitted which does not comply with these terms.
*Correspondence: Wei Yang, d2VpYWl3ZWl3ZWlAMTYzLmNvbQ==