 Chaoqun Li1†
 Mingchen Ma1†Wenbin Kou1Xinran Zeng2Wenxuan Cheng1Houwen Wang2
 Jiankai Zhang3
 Wuke Wang4Weili Lin5Hong Li6Yuanyuan Zhu7Xiaohong Yao1
 Huiwang Gao1
 Yang Gao1*
- 1Frontiers Science Center for Deep Ocean Multispheres and Earth System, and Key Laboratory of Marine Environment and Ecology, Ministry of Education, Ocean University of China, and Qingdao National Laboratory for Marine Science and Technology, Qingdao, China
- 2College of Oceanic and Atmospheric Sciences, Ocean University of China, Qingdao, China
- 3Key Laboratory for Semi-Arid Climate Change of the Ministry of Education, College of Atmospheric Sciences, Lanzhou University, Lanzhou, China
- 4Department of Atmospheric Science, China University of Geosciences, Wuhan, China
- 5Key Laboratory of Ecology and Environment in Minority Areas (Minzu University of China), National Ethnic Affairs Commission, Beijing, China
- 6State Key Laboratory of Environmental Criteria and Risk Assessment, Chinese Research Academy of Environmental Sciences, Beijing, China
- 7China National Environmental Monitoring Centre, Beijing, China
Stratospheric ozone intrusion plays an important role in affecting the tropospheric ozone concentrations in the troposphere through stratosphere to troposphere transport (STT). Nevertheless, there are very limited studies on the quantification of the effect. Focusing on a typical event on 9–12 May 2015, when STT occurs over the northeastern Qinghai–Tibet Plateau of China, the observations and reanalysis data indicate that STT is accompanied by high potential vorticity and low specific humidity. In order to quantify the extent to which the STT may elevate the ozone concentrations, an inert tracer is added to the boundary conditions of the Community Multiscale Air Quality (CMAQ), which is driven by the Weather Research and Forecasting (WRF) model. The meteorological conditions simulated by WRF nicely reproduce the distributions of potential vorticity (PV) and water vapor in the upper troposphere. Through the physical processes of diffusion, advection, and dry and wet deposition, the ozone tracer concentrations simulated from CMAQ well capture the spatial propagation and evolution of stratospheric ozone intrusion over Qinghai–Tibet Plateau, warranting the confidence in interpreting the simulated results in quantifying the STT. The STT event indicates the near-surface ozone enhancement of approximately 10–20 ppbv covering half of Qinghai province, even spreading to a broader area of eastern China. For the typical remote mountain such as Waliguan, clear ozone enhancement is obtained over the lower level of the troposphere. The method used in this study is applicable to other regions as well, which can be applied in the future to detect the STT at a wider spatiotemporal scale and help the policymakers identify the ozone sources and make efficient strategies for the ozone pollution control.
1 Introduction
Ozone in the stratosphere protects Earth’s life system from the threat of high-energy ultraviolet radiation (Ramanathan and Dickinson, 1979; Zhang et al., 2018). While in the troposphere, ozone may have a significant impact on human health and the ecosystem (Manisalidis et al., 2020; Landry et al., 2013). For instance, high concentrations of near-surface ozone can induce human respiratory and immune system diseases or even directly threaten life and jeopardize the physiological function of crops (Mills et al., 2018; Lefohn et al., 2018). Moreover, with high global warming potential, tropospheric ozone is an important greenhouse gas, which contributes substantially to global warming in the short term (Krupa and Kickert, 1989; Staehelin et al., 2001; Gauss et al., 2003).
From a global perspective, there are two main sources of ozone in the troposphere. One of the primary pathways is through the photochemical reactions in the planetary boundary layer, triggered by hydroxyl radicals with precursors such as volatile organic compounds (VOCs) and nitrogen oxides (NOx) (Sillman, 1999). The other one is the downward transport of ozone-rich air from the stratosphere (Xu et al., 2008; Holton et al., 1995; Lelieveld and Dentener, 2000). The first pathway mainly occurs in the areas with dense anthropogenic emissions, for example, the Beijing–Tianjin–Hebei region, Yangtze River Delta, and Pearl River Delta (Cheng et al., 2017; Lu et al., 2019), which have been intensively studied. In contrast, the tropospheric ozone through the stratosphere to troposphere transport (STT) may result in unexpected ozone pollution events even in remote areas (Hu et al., 2011; Xu et al., 2015). STT can transport ozone-rich stratospheric air down into the upper troposphere rapidly. In particular, deep STT can even transport ozone to the planetary boundary layer, subsequently inducing an increase in near-surface ozone concentration (Solomon, 1999; Stohl et al., 2003; Chen et al., 2013). The occurrence of STT is often associated with complex weather dynamical processes, such as Brewer–Dobson circulation (BD circulation), tropopause folding, and cut-off low (Sprenger et al., 2003; Brewer, 1949; Dobson and Massey, 1956; Traub and Lelieveld, 2003; Appenzeller and Davies, 1992).
STT is strongly affected by changes in stratospheric circulation, which is modulated by factors such as El Niño/Southern Oscillation (Neu et al., 2014), and the impact of STT on the northern hemisphere could be higher than that in the southern hemisphere (Greenslade et al., 2017). This phenomenon is particularly common and important in the mountainous areas, such as the western United States and the Qinghai–Tibet Plateau in China, where the surface ozone is more vulnerable to the influence of the upper air due to the high altitude. Lefohn et al. (2012) investigated the impact of stratospheric transport on near-surface ozone in the United States from 2007 to 2009, showing that the influence of stratospheric ozone intrusion on tropospheric ozone may differ by altitudes, with larger extent and probability at higher altitudes. In addition, stratospheric ozone intrusion shows significant seasonal variations. In the mid-latitudes of the northern hemisphere, stratospheric ozone usually has a greater impact on near-surface ozone concentration in winter and spring (Monks, 2000; Cui et al., 2005; Xu et al., 2015).
Recently, stratospheric ozone intrusion has been frequently reported. For instance, based on reanalysis and aircraft data, Hongyue Wang et al. (2020) found a clear STT event on 17–18 July 2016, triggering the ozone concentration enhancement over eastern China (i.e., approximately 15 ppbv over Nanjing). In a different STT event on 27–28 April 2018, a comparable magnitude of 15 ppbv is indicated for the surface ozone enhancement based on reanalysis and numerical modeling (Yiping Wang et al., 2020). The STT was found to affect the surface ozone concentrations in the Hong Kong regions, China, as well (Zhao et al., 2021). In addition, over the remote Mount Waliguan at the Qinghai–Tibet Plateau, there was an ozone increase in summer due to stratospheric intrusion (Ding and Wang, 2006). Starting with a springtime stratospheric ozone intrusion event accompanied by a strong horizontal trough over Qinghai–Tibet Plateau, this study comprehensively elucidates the characteristics and impact of stratospheric ozone intrusion by numerical modeling and observations.
2 Data and Model Configuration
2.1 Data Sources
Ozone concentration was available at China National Environmental Monitoring Centre (http://www.pm25.in, last access: 7 September 2021). Gridded hourly ozone concentration, potential vorticity, and specific humidity are available from the fifth generation of ECMWF atmospheric reanalysis global climate data (ERA5, https://cds.climate.copernicus.eu/cdsapp#!/search?type=dataset, last access: 7 September 2021), with a horizontal resolution of 0.1°×0.1° and 13 vertical layers from 1,000 to 100 hPa.
2.2 Model Configurations
In this study, a three-dimensional Weather Research and Forecasting (WRF) model version 4.1.1 coupled with the Community Multiscale Air Quality (CMAQ) model version 5.3 is used to conduct the simulations in May 2015. The lambert conformal conic projection is applied with a spatial resolution of 36 × 36 km and 34 vertical layers. The initial and boundary conditions are provided by Climate Forecast System Reanalysis (CFSR) version 2 (Saha et al., 2014). The parameterization schemes used are shown in Table 1. The meteorological field simulated by WRF is processed by Meteorological Chemistry Interface Processor (MCIP) to provide a meteorological input to the Community Multiscale Air Quality (CMAQ) model. For CMAQ, carbon-bond version 6 (CB6) (Luecken et al., 2019) and Aerosol Module Version 7 (AERO7) (Appel et al., 2021) are used to represent the gas chemistry and aerosol scheme. The anthropogenic emissions are available from the Multi-resolution Emission Inventory for China (MEIC) (Li et al., 2017). Biogenic emissions are generated by the Model of Emissions of Gases and Aerosols from Nature (MEGAN 2.1) (Guenther et al., 2012), similar to our previous study (Gao et al., 2022; Ma et al., 2022). The initial and boundary conditions for CMAQ are derived from the MOZART-4 (Emmons et al., 2010). A chemically inert tracer (O3_BC) with the same molecular weight as ozone has been added to the model, as well as the lower and upper boundary conditions, to track the impact of stratospheric intrusion on ozone concentration at a lower altitude.
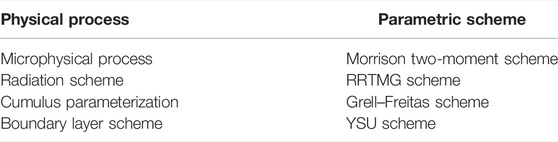
TABLE 1. Parameterization scheme of the WRF model.
3 Results and Discussions
3.1 The Analysis of Stratosphere to Troposphere Transport on Ozone Based on ERA5
Previous studies have shown that the potential vorticity on the isentropic surface of 300–350 K can be used to investigate the impact of STT on ozone concentrations (Wang et al., 2010; Xu et al., 2015). Similarly, 340 K isentropic potential vorticity is utilized by Ding and Wang (2006) to understand the mechanism modulating the transport of O3-rich air from the upper level to the surface. Therefore, the spatial distribution of isentropic potential vorticity at 340 K on 9–12 May 2015 is shown in Figure 1. On 9 May, a high value of potential vorticity appeared in Mongolia and Northern China. The continuous development and movement of the weather system trigger the formation of a PV trough eastward, passing the Qinghai–Tibet Plateau of China, including the location of Waliguan (black triangle) and eastern China on 10–11 May, and eventually moving further eastward on 12 May.
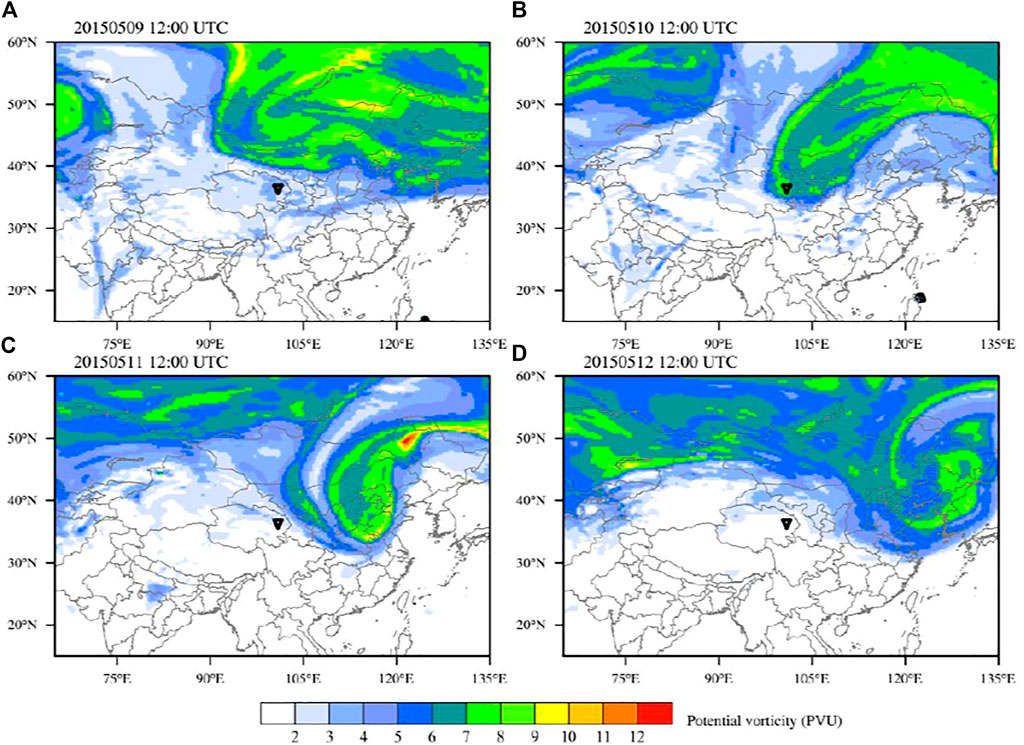
FIGURE 1. Spatial distribution of potential vorticity at 340 K (shading, unit: PVU, 10–6 m2 K kg−1 s−1) at 12:00 UTC on 9–12 May 2015 based on ERA5. The black triangle in each panel indicates the location of WLG.
The spatial distribution of specific humidity and wind vector at 320 K on 9–12 May 2015 is displayed in Figure 2 to further delineate the influence of stratosphere air on the troposphere through the downward transport. The selection of 320 K mainly considers that the pressure is approximately 300 hPa at Mount Waliguan. The water vapor over the free troposphere tends to decrease along with the increase in altitude, and a stratospheric air intrusion can be inferred when a substantially low value of water vapor appears, values smaller than 0.08 g kg−1 based on Shou et al. (2014). Consistent with the spatial distributions of PV, low specific humidity is concomitant with the atmospheric circulation over the areas with high PV values (Figures 2 vs. Figure 1). In particular, the white areas with specific humidity lower than 0.08 g kg−1 are implicative of the occurrence of stratospheric air intrusion.
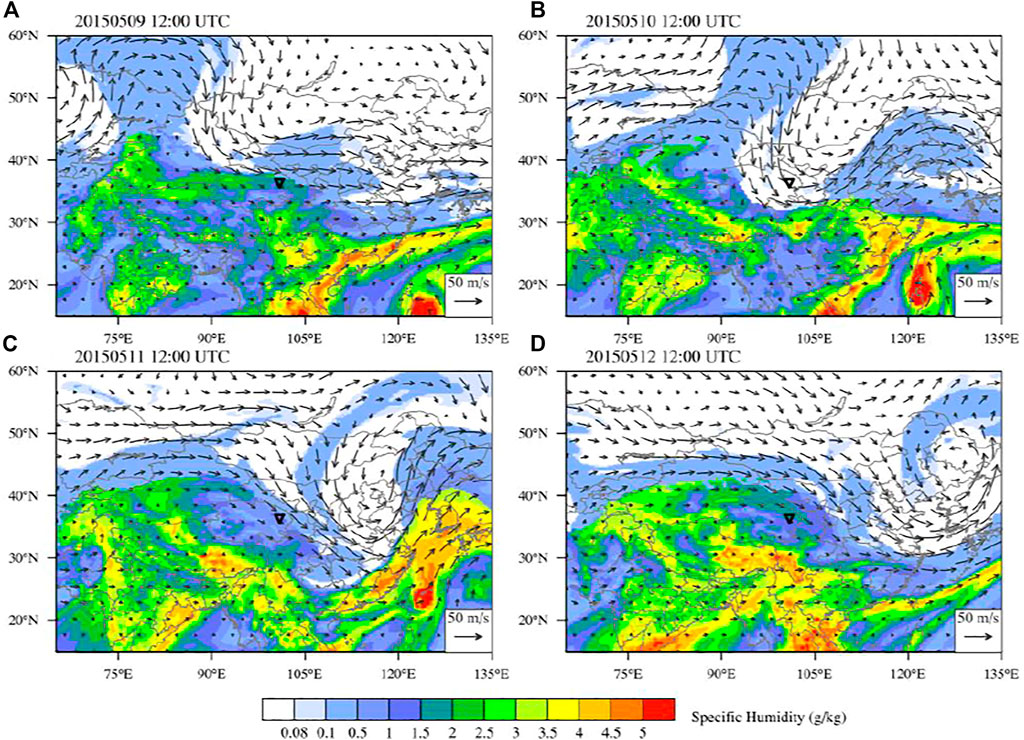
FIGURE 2. Spatial distribution of specific humidity (shading, unit: g kg−1) and wind vector (arrows, unit: m s−1) at 320 K on 9–12 May 2015 (24 h intervals; UTC), based on data from ERA5. The black triangle in each panel indicates the location of WLG.
In order to evaluate ozone exchanges between stratosphere and troposphere, the tropopause should be determined first. There are usually two methods used in the tropopause definition and calculation: the thermodynamic and dynamic tropopause (Hoerling et al., 1991; Wang et al., 2010). The dynamic tropopause defined based on potential vorticity can well reflect the conservative feature of the atmosphere in adiabatic and frictionless circumstances (Yang and Lü, 2004), which is widely used by the community in STT studies. In this study, the dynamical tropopause is applied to investigate the impact of STT on ozone concentration in Mount Waliguan and eastern China, and PV = 2 PVU (1 PVU = 10–6 m2 s−1 K kg−1) is used in the determination of dynamic tropopause based on previous studies (Hongyue Wang et al., 2020; Yiping Wang et al., 2020).
The vertical profile of PV and ozone concentration at Mount Waliguan is displayed in Figure 3 on 9–13 May 2015, from the surface of Mount Waliguan (∼ 600 hPa) to 100 hPa. The dynamic tropopause delineated by the 2 PVU isoline (white dashed line in Figure 3A) indicates a deep invasion of stratospheric air from 200 hPa to almost 400 hPa on 10 May. Accompanied by the clear PV invasion, the ozone-rich air in the stratosphere was transported downward into the upper troposphere, resulting in a substantial ozone enhancement therein (Figure 3B). A similar phenomenon was observed in other locations, such as Hong Kong, where the ozone concentrations reached more than 80 ppbv on 24 March 2010 over an altitude slightly above the planetary boundary layer height (Zhao et al., 2021).
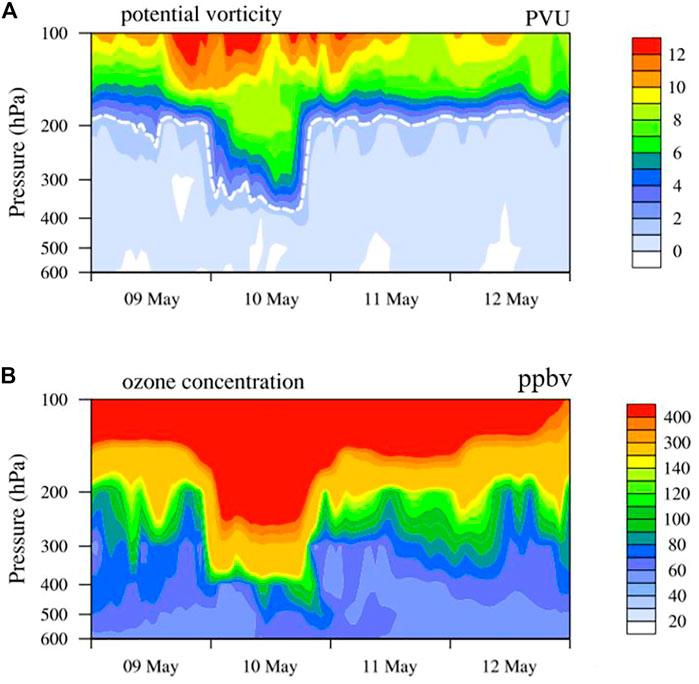
FIGURE 3. Time evolution of vertical distributions of (A) potential vorticity and (B) ozone concentration on 9–12 May 2015 UTC at WLG. The PV and ozone concentrations are from ERA5. The thick white dashed line in (A) indicates the dynamical tropopause (2 PVU).
3.2 Quantification of Stratosphere to Troposphere Transport on Ozone Concentration in Qinghai–Tibetan Plateau, China
WRF-CMAQ simulations were conducted with an ozone tracer added by including diffusion, advection, and dry and wet deposition without chemical reactions to quantify the contribution of stratospheric ozone intrusion to the surface ozone. We first evaluate how well WRF-CMAQ may reproduce the meteorological conditions and ozone concentrations. The spatial distributions of potential vorticity and specific humidity from WRF are displayed in Figure 4. Compared to the spatial patterns from ERA5 (shadings in Figures 1, 2), the simulated results from WRF well reproduced the spatial propagation and movement of PV and specific humidity, indicative of the capability of the model in capturing the process of STT.
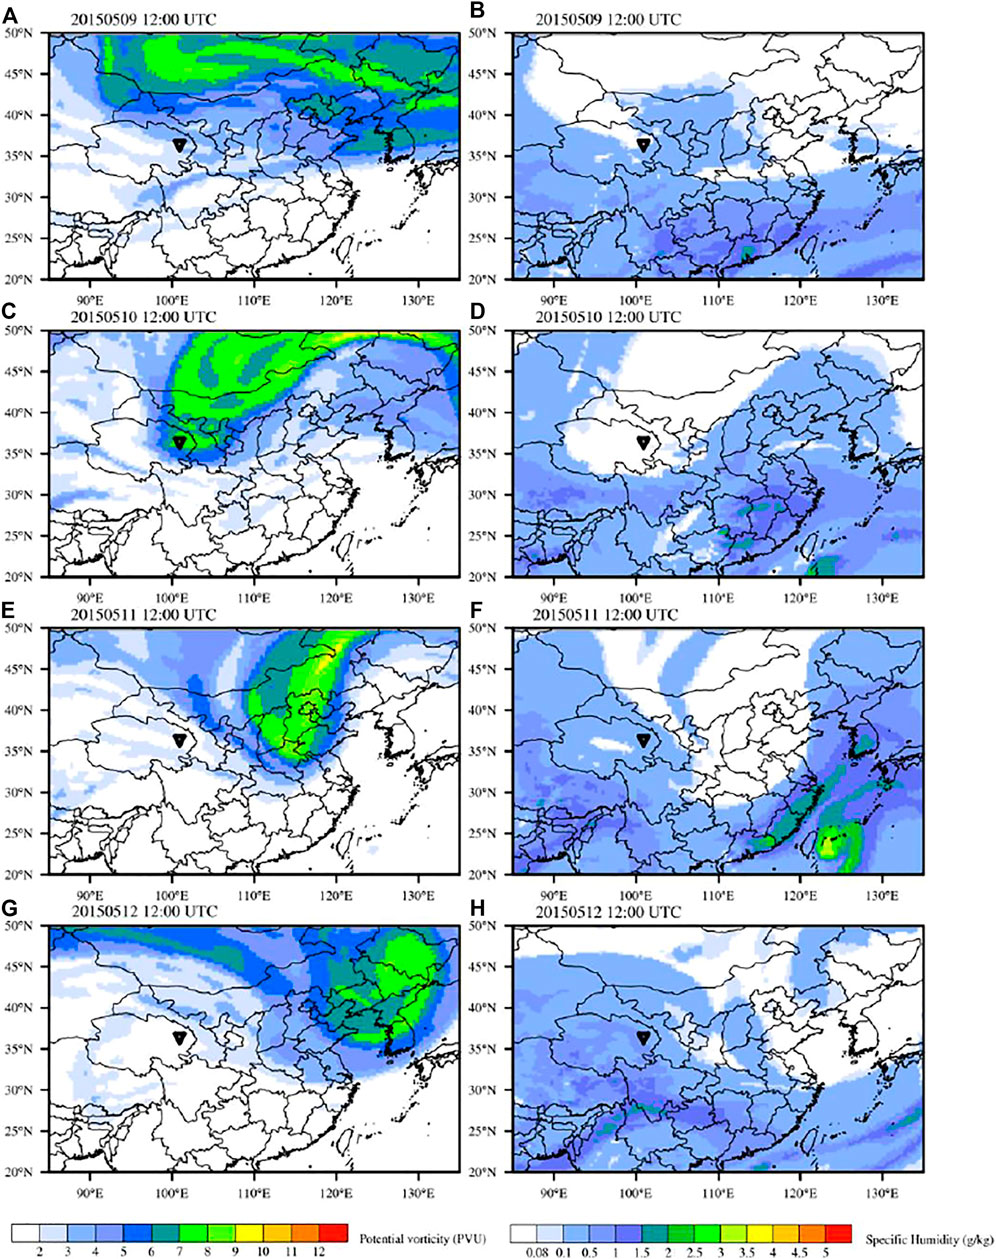
FIGURE 4. Spatial distribution of potential vorticity at 340 K (left) and specific humidity at 320 K (right) from WRF at 12:00 UTC on 9–12 May 2015. The black triangle in each panel indicates the location of WLG.
To further evaluate how well CMAQ reproduces the evolution of ozone, the cross-section, over the same latitude of WLG, of simulated ozone tracer was used to compare with that from ERA5 (Figure 5), and the comparable spatial and temporal propagations of ozone warranted the confidence in interpreting the stratospheric ozone intrusion. In the early stage of STT, the high ozone concentration was concentrated at the height of 200–400 hPa (Figures 5A,B). When STT occurred on 10 May, the high value of ozone invaded significantly toward the location of Waliguan at a longitude of 100°54′E (Figures 5C,D). With the development of trough of PV and invasion of ozone-rich air (Figure 1), the high ozone concentrations display consistent eastward movement (Figures 5E–H).
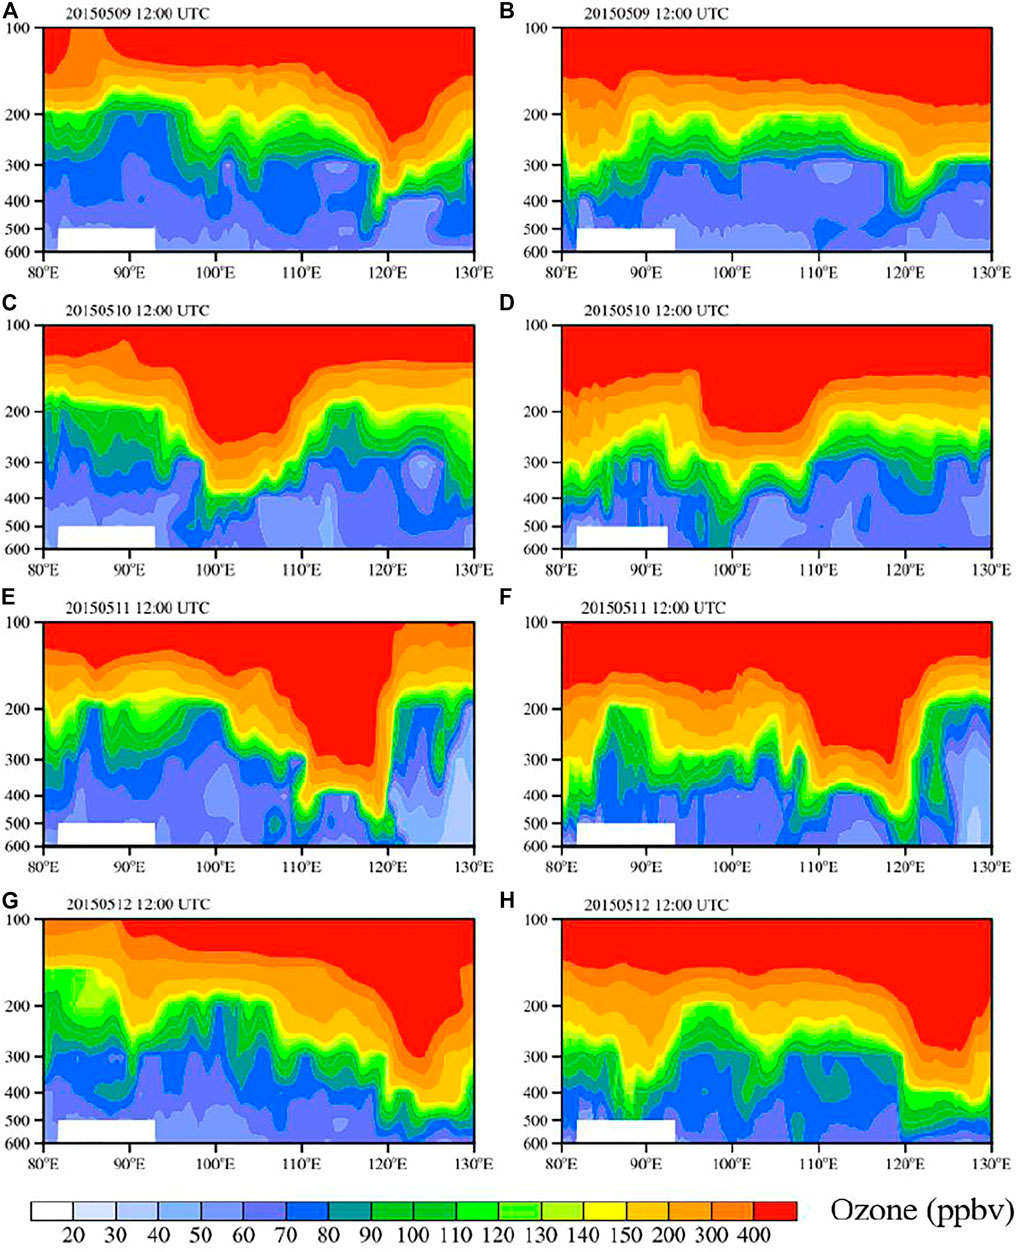
FIGURE 5. Longitude-height cross-sections of ozone concentration from ERA5 (left) and CMAQ (right) at 36.28°N (the latitude of WLG) at 12:00 UTC on 9–12 May 2015. The white square indicates the area without data due to the high topography.
It is important to understand the extent to which the STT event may affect the ozone concentration near the surface. To this end, Figure 6 shows the spatial distribution of surface ozone, based on the ozone tracer method, every 2 hours in northwestern China on 10 May 2015, overlaid by the observed data from the China National Environmental Monitoring Centre in dots. The simulated results are generally consistent with the observations, despite the existence of biases such as overestimation in the southern flank of Qinghai, likely attributable to the biases from the boundary conditions inherited from the global chemistry model MOZART [Figure 2F in Yan et al. (2021)]. At 0:00 UTC (Figure 6A), ozone concentrations were high in the northern flank of Qinghai province and gradually shifted southeastward, covering almost half of the entire province. The STT event lasts for about 12 h, yielding the highest ozone concentrations of 89 ppbv.
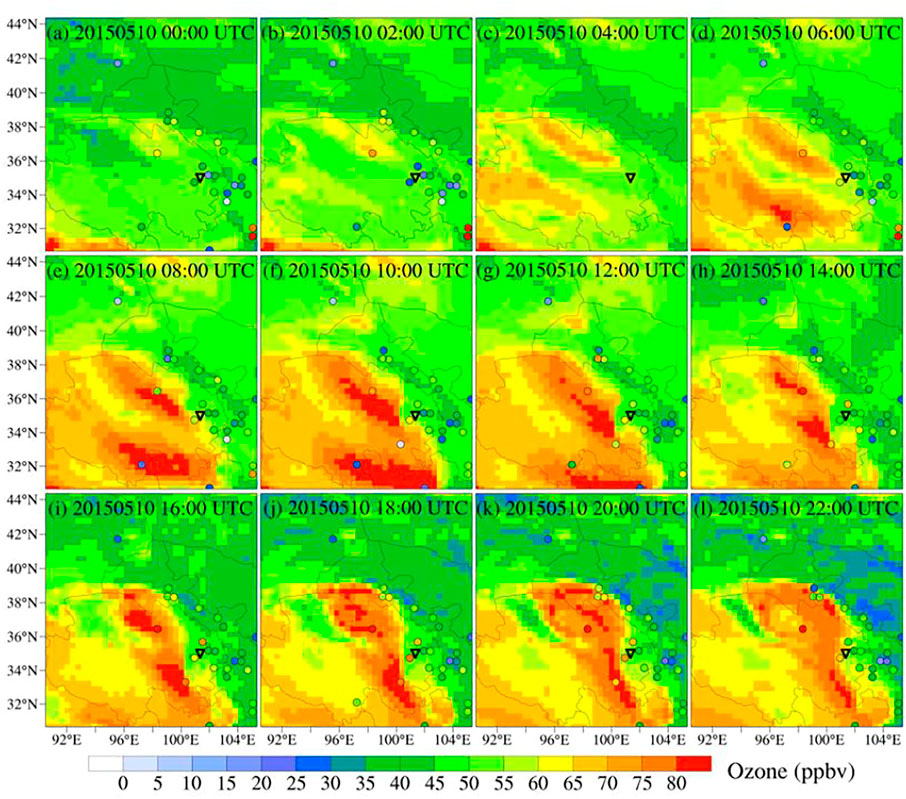
FIGURE 6. Spatial distribution of simulated hourly surface ozone concentrations on 10 May 2015 (2 h intervals). The observed surface ozone concentrations are plotted over the simulations. The triangle represents the WLG.
In order to determine the contribution of stratospheric ozone intrusion to ground-level ozone, hourly ozone anomalies were calculated relative to the mean value in May 2014–2018, and the results for every 2 hours are shown in Figure 7. It nicely delineates the spatial coverage expansion along with temporal evolution from the northwest flank of WLG (02:00 UTC, Figure 7B), propagating southeastward and invading close to half of the Qinghai province after 10:00 UTC (Figure 7F). The mean contributions based on ozone anomalies from STT are approximately 10–20 ppbv, with a maximal contribution of 32 ppbv during this event. Consistently, based on the chemical transport model GEOS-Chem, Lu et al. (2019) found an ozone enhancement of 10–20 ppbv in Qinghai due to STT during May and June in 2016 and 2017 [second panel in the third row of Figure 4 in Lu et al. (2019)]. In addition, the influence of STT may extend to even North China Plain. Although the overall scale is much smaller, the enhancement of 2–3 ppbv may deserve much attention in the future. It is necessary to further clarify and comprehensively study the regulatory effect of STT in ozone pollution-prone areas.
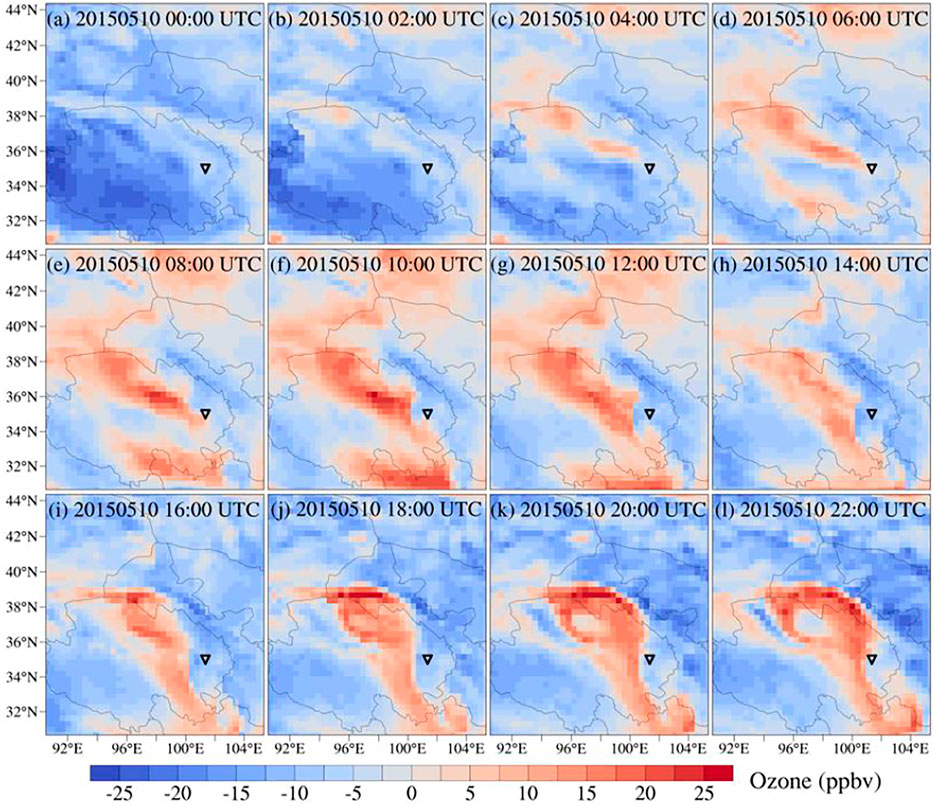
FIGURE 7. Spatial distribution of simulated surface hourly ozone anomalies on 10 May 2015, with the anomaly calculated relative to the mean simulated value in May 2014–2018, and only values every 2 hours are shown. The triangle represents the location of WLG.
Conclusion
This study shows a strong STT event occurring in Qinghai–Tibetan Plateau, China, on 9–12 May 2015, associated with a horizontal trough that brings ozone-rich air from the stratosphere to the ground and leads to ozone pollution. The observations and reanalysis data indicate that STT is accompanied by high potential vorticity and low specific humidity, and the dynamic tropopause defined by the 2 PVU deeply invaded from 200 hPa to the level close to 400 hPa on 10 May 2015. Further conducting numerical simulations of WRF-CMAQ, the contribution of STT to the surface ozone enhancement at northeastern Qinghai–Tibetan Plateau is 10–20 ppbv on average, indicative of substantial modulation of STT on steering the ozone concentrations at a high altitude. Moreover, further analysis to cover a wider area implies that the influence of STT may extend to even North China Plain, which deserves much future attention to further elucidate and fully examine the modulation of STT on ozone concentrations in ozone pollution prone regions.
The World Health Organization (WHO) has recently released new guidelines for long-term ozone exposure, defined as the six-month running mean of maximum daily 8 h ozone, with the air quality guideline of 60 μg m−3 (WHO, 2021). This stresses the substantial importance of considering STT when dealing with ozone pollution issues in regions of both high and low altitudes. Through the evaluation and comparison with observations, this study first constructs the confidence in warranting the capability of the regional climate and air quality model (WRF-CMAQ) in reproducing the evolution of PV intrusion and the associated stratospheric ozone intrusion. It is implicative of critical importance in further investigating and quantifying the STT contribution in a broader region and longer time in particular of targeting to meet the new WHO air quality guide in the future.
Data Availability Statement
The raw data supporting the conclusion of this article will be made available by the authors without undue reservation.
Author Contributions
YG conceived the idea and designed the project, CL and MM performed all the analysis, WK, XZ, WC, HW, JZ, WW, WL, HL, YZ, XY and HG involved in the discussion of the results. All authors contributed to the writing of the manuscript.
Funding
This research was supported by a grant from the National Natural Science Foundation of China (42122039).
Conflict of Interest
The authors declare that the research was conducted in the absence of any commercial or financial relationships that could be construed as a potential conflict of interest.
Publisher’s Note
All claims expressed in this article are solely those of the authors and do not necessarily represent those of their affiliated organizations or those of the publisher, the editors, and the reviewers. Any product that may be evaluated in this article, or claim that may be made by its manufacturer, is not guaranteed or endorsed by the publisher.
References
Appel, K. W., Bash, J. O., Fahey, K. M., Foley, K. M., Gilliam, R. C., Hogrefe, C., et al. (2021). The Community Multiscale Air Quality (CMAQ) Model Versions 5.3 and 5.3.1: System Updates and Evaluation. Geosci. Model Dev. 14, 2867–2897. doi:10.5194/gmd-14-2867-2021
Appenzeller, C., and Davies, H. C. (1992). Structure of Stratospheric Intrusions into the Troposphere. Nature 358, 570–572. doi:10.1038/358570a0
Brewer, A. W. (1949). Evidence for a World Circulation provided by the Measurements of Helium and Water Vapour Distribution in the Stratosphere. Q.J R. Met. Soc. 75, 351–363. doi:10.1002/qj.49707532603
Chen, X., Añel, J. A., Su, Z., de la Torre, L., Kelder, H., van Peet, J., et al. (2013). The Deep Atmospheric Boundary Layer and its Significance to the Stratosphere and Troposphere Exchange over the Tibetan Plateau. PLoS One 8, e56909. doi:10.1371/journal.pone.0056909
Cheng, L., Wang, S., Gong, Z., Yang, Q., and Wang, Y. (2017). Pollution Trends of Ozone and its Characteristics of Temporal and Spatial Distribution in Beijing-Tianjin-Hebei Region. Environ. Monit. China 33, 14–21. doi:10.19316/j.issn.1002-6002.2017.01.03
Cui, H., Zhao, C., Zheng, X., Zheng, Y., Qin, Y., Chan, C., et al. (2005). Analysis of an Extraordinary Tropospheric Ozone Enhancement Event at Lin-An in the Spring of 2001. Chin. J. Atmos. Sci. 29, 259–266. doi:10.3878/j.issn.1006-9895.2005.02.10
Ding, A., and Wang, T. (2006). Influence of Stratosphere-To-Troposphere Exchange on the Seasonal Cycle of Surface Ozone at Mount Waliguan in Western China. Geophys. Res. Lett. 33, L03803. doi:10.1029/2005GL024760
Dobson, G. M. B., and Massey, H. S. W. (1956). Origin and Distribution of the Polyatomic Molecules in the Atmosphere. Proc. R. Soc. Lond. A 236, 187–193. doi:10.1098/rspa.1956.0127
Emmons, L. K., Walters, S., Hess, P. G., Lamarque, J.-F., Pfister, G. G., Fillmore, D., et al. (2010). Description and Evaluation of the Model for Ozone and Related Chemical Tracers, Version 4 (MOZART-4). Geosci. Model Dev. 3, 43–67. doi:10.5194/gmd-3-43-2010
Gao, Y., Yan, F., Ma, M., Ding, A., Liao, H., Wang, S., et al. (2022). Unveiling the Dipole Synergic Effect of Biogenic and Anthropogenic Emissions on Ozone Concentrations. Sci. Total Environ. 818, 151722. doi:10.1016/j.scitotenv.2021.151722
Gauss, M., Myhre, G., Pitari, G., Prather, M. J., Isaksen, I. S. A., Berntsen, T. K., et al. (2003). Radiative Forcing in the 21st Century Due to Ozone Changes in the Troposphere and the Lower Stratosphere. J. Geophys. Res. 108, a–n. doi:10.1029/2002JD002624
Greenslade, J. W., Alexander, S. P., Schofield, R., Fisher, J. A., and Klekociuk, A. K. (2017). Stratospheric Ozone Intrusion Events and Their Impacts on Tropospheric Ozone in the Southern Hemisphere. Atmos. Chem. Phys. 17, 10269–10290. doi:10.5194/acp-17-10269-2017
Guenther, A. B., Jiang, X., Heald, C. L., Sakulyanontvittaya, T., Duhl, T., Emmons, L. K., et al. (2012). The Model of Emissions of Gases and Aerosols from Nature Version 2.1 (MEGAN2.1): an Extended and Updated Framework for Modeling Biogenic Emissions. Geosci. Model Dev. 5, 1471–1492. doi:10.5194/gmd-5-1471-2012
Hoerling, M. P., Schaack, T. K., and Lenzen, A. J. (1991). Global Objective Tropopause Analysis. Mon. Weather Rev. 119, 1816. doi:10.1175/1520-0493(1991)119<1816:gota>2.0.co;2
Holton, J. R., Haynes, P. H., McIntyre, M. E., Douglass, A. R., Rood, R. B., and Pfister, L. (1995). Stratosphere-troposphere Exchange. Rev. Geophys. 33, 403–439. doi:10.1029/95RG02097
Hongyue Wang, H., Wang, W., Huang, X., and Ding, A. (2020). Impacts of Stratosphere-To-Troposphere-Transport on Summertime Surface Ozone over Eastern China. Sci. Bull. 65, 276–279. doi:10.1016/j.scib.2019.11.017
Hu, N., Zhang, C., Zhong, J., and Li, Y. (2011). Advances in Stratosphere-Troposphere Exchange Research. Adv. Earth Sci. 26, 375–385. doi:10.11867/j.issn.1001-8166.2011.04.0375
Krupa, S. V., and Kickert, R. N. (1989). The Greenhouse Effect: Impacts of Ultraviolet-B (UV-B) Radiation, Carbon Dioxide (CO2), and Ozone (O3) on Vegetation. Environ. Pollut. 61, 263–393. doi:10.1016/0269-7491(89)90166-8
Landry, J.-S., Neilson, E. T., Kurz, W. A., and Percy, K. E. (2013). The Impact of Tropospheric Ozone on Landscape-Level Merchantable Biomass and Ecosystem Carbon in Canadian Forests. Eur. J. For. Res. 132, 71–81. doi:10.1007/s10342-012-0656-z
Lefohn, A. S., Wernli, H., Shadwick, D., Oltmans, S. J., and Shapiro, M. (2012). Quantifying the Importance of Stratospheric-Tropospheric Transport on Surface Ozone Concentrations at High- and Low-Elevation Monitoring Sites in the United States. Atmos. Environ. 62, 646–656. doi:10.1016/j.atmosenv.2012.09.004
Lefohn, A. S., Malley, C. S., Smith, L., Wells, B., Hazucha, M., Simon, H., et al. (2018). Tropospheric Ozone Assessment Report: Global Ozone Metrics for Climate Change, Human Health, and Crop/ecosystem Research. Sci. Anthropocene 6, 28. doi:10.1525/elementa.279
Lelieveld, J., and Dentener, F. J. (2000). What Controls Tropospheric Ozone? J. Geophys. Res. 105, 3531–3551. doi:10.1029/1999JD901011
Li, M., Zhang, Q., Kurokawa, J.-i., Woo, J.-H., He, K., Lu, Z., et al. (2017). MIX: a Mosaic Asian Anthropogenic Emission Inventory under the International Collaboration Framework of the MICS-Asia and HTAP. Atmos. Chem. Phys. 17, 935–963. doi:10.5194/acp-17-935-2017
Lu, X., Zhang, L., Chen, Y., Zhou, M., Zheng, B., Li, K., et al. (2019). Exploring 2016-2017 Surface Ozone Pollution over China: Source Contributions and Meteorological Influences. Atmos. Chem. Phys. 19, 8339–8361. doi:10.5194/acp-19-8339-2019
Luecken, D. J., Yarwood, G., and Hutzell, W. T. (2019). Multipollutant Modeling of Ozone, Reactive Nitrogen and HAPs across the Continental US with CMAQ-CB6. Atmos. Environ. 201, 62–72. doi:10.1016/j.atmosenv.2018.11.060
Ma, M., Gao, Y., Ding, A., Su, H., Liao, H., Wang, S., et al. (2022). Development and Assessment of a High-Resolution Biogenic Emission Inventory from Urban Green Spaces in China. Environ. Sci. Technol. 56, 175–184. doi:10.1021/acs.est.1c06170
Manisalidis, I., Stavropoulou, E., Stavropoulos, A., and Bezirtzoglou, E. (2020). Environmental and Health Impacts of Air Pollution: A Review. Front. Public Health 8, 14. doi:10.3389/fpubh.2020.00014
Mills, G., Sharps, K., Simpson, D., Pleijel, H., Frei, M., Burkey, K., et al. (2018). Closing the Global Ozone Yield Gap: Quantification and Cobenefits for Multistress Tolerance. Glob. Change Biol. 24, 4869–4893. doi:10.1111/gcb.14381
Monks, P. S. (2000). A Review of the Observations and Origins of the Spring Ozone Maximum. Atmos. Environ. 34, 3545–3561. doi:10.1016/s1352-2310(00)00129-1
Neu, J. L., Flury, T., Manney, G. L., Santee, M. L., Livesey, N. J., and Worden, J. (2014). Tropospheric Ozone Variations Governed by Changes in Stratospheric Circulation. Nat. Geosci. 7, 340–344. doi:10.1038/ngeo2138
Ramanathan, V., and Dickinson, R. E. (1979). The Role of Stratospheric Ozone in the Zonal and Seasonal Radiative Energy Balance of the Earth-Troposphere System. J. Atmos. Sci. 36, 1084–1104. doi:10.1175/1520-0469(1979)036<1084:TROSOI>2.0.CO;2
Saha, S., Moorthi, S., Wu, X., Wang, J., Nadiga, S., Tripp, P., et al. (2014). The NCEP Climate Forecast System Version 2. J. Clim. 27, 2185–2208. doi:10.1175/jcli-d-12-00823.1
Shou, Y., Lu, F., Shou, S., and Qin, D. (2014). A New Method for Tropopause Folding Detection and its Application in Middle Latitude Disastrous Weather Forecasting. Chin. J. Atmos. Sci. 38, 1109–1123. doi:10.3878/j.issn.1006-9895.1403.13258
Sillman, S. (1999). The Relation between Ozone, NOx and Hydrocarbons in Urban and Polluted Rural Environments. Atmos. Environ. 33, 1821–1845. doi:10.1016/S1352-2310(98)00345-8
Solomon, S. (1999). Stratospheric Ozone Depletion: A Review of Concepts and History. Rev. Geophys. 37, 275–316. doi:10.1029/1999RG900008
Sprenger, M., Croci Maspoli, M., and Wernli, H. (2003). Tropopause Folds and Cross-Tropopause Exchange: A Global Investigation Based upon ECMWF Analyses for the Time Period March 2000 to February 2001. J. Geophys. Res. 108, 8518. doi:10.1029/2002JD002587
Staehelin, J., Harris, N. R. P., Appenzeller, C., and Eberhard, J. (2001). Ozone Trends: A Review. Rev. Geophys. 39, 231–290. doi:10.1029/1999RG000059
Stohl, A., Wernli, H., James, P., Bourqui, M., Forster, C., Liniger, M. A., et al. (2003). A New Perspective of Stratosphere-Troposphere Exchange. Bull. Am. Meteorological Soc. 84, 1565–1574. doi:10.1175/BAMS-84-11-1565
Traub, M., and Lelieveld, J. (2003). Cross-tropopause Transport over the Eastern Mediterranean. J. Geophys. Res. 108, 4712. doi:10.1029/2003JD003754
Wang, W., Liang, J., Wang, H., and Fan, W. (2010). Comparative Study on Mass and Ozone Fluxes Cross Tropopause over Qinghai-Xizang Plateau and its Surrounding Areas. Plateau Meteorol. 29, 554–562. doi:10.3788/gzxb20103906.0998
WHO (2021). WHO Global Air Quality Guidelines: Particulate Matter (PM2.5 and PM10), Ozone, Nitrogen Dioxide, Sulfur Dioxide and Carbon Monoxide: Executive Summary. Geneva: World Health Organization.
Xu, X., Lin, W., Wang, T., Yan, P., Tang, J., Meng, Z., et al. (2008). Long-term Trend of Surface Ozone at a Regional Background Station in Eastern China 1991-2006: Enhanced Variability. Atmos. Chem. Phys. 8, 2595–2607. doi:10.5194/acp-8-2595-2008
Xu, P., Tian, W., Zhang, J., Luo, J., Huang, Q., and Zhang, J. (2015). A Simulation Study of the Transport of the Stratospheric Ozone to the Troposphere over the Northwest Side of the Tibetan Plateau in Spring. Acta Meteorol. Sin. 73, 529–545. doi:10.11676/qxxb2015.037
Yan, F., Gao, Y., Ma, M., Liu, C., Ji, X., Zhao, F., et al. (2021). Revealing the Modulation of Boundary Conditions and Governing Processes on Ozone Formation over Northern China in June 2017. Environ. Pollut. 272, 115999. doi:10.1016/j.envpol.2020.115999
Yang, J., and Lü, D. (2004). Diagnosed Seasonal Variation of Stratosphere-Troposphere Exchange in the Northern Hemisphere by 2000 Data. Chin. J. Atmos. Sci. 28, 294–300+328. doi:10.3878/j.issn.1006-9895.2004.02.12
Yiping Wang, Y., Wang, H., and Wang, W. (2020). A Stratospheric Intrusion-Influenced Ozone Pollution Episode Associated with an Intense Horizontal-Trough Event. Atmosphere 11, 164. doi:10.3390/atmos11020164
Zhang, J., Tian, W., Xie, F., Chipperfield, M. P., Feng, W., Son, S.-W., et al. (2018). Stratospheric Ozone Loss over the Eurasian Continent Induced by the Polar Vortex Shift. Nat. Commun. 9, 206. doi:10.1038/s41467-017-02565-2
Keywords: tropospheric ozone, Qinghai–Tibet Plateau of China, stratospheric ozone intrusion, potential vorticity, WRF-CMAQ
Citation: Li C, Ma M, Kou W, Zeng X, Cheng W, Wang H, Zhang J, Wang W, Lin W, Li H, Zhu Y, Yao X, Gao H and Gao Y (2022) Substantial Near-Surface Spring Ozone Enhancement due to Stratospheric Intrusion in the Northeastern Qinghai–Tibet Plateau, China. Front. Environ. Sci. 10:894937. doi: 10.3389/fenvs.2022.894937
Received: 12 March 2022; Accepted: 17 May 2022;
Published: 28 June 2022.
Edited by:
Ramachandran Srikanthan, Physical Research Laboratory, IndiaReviewed by:
Tuhin Kumar Mandal, National Physical Laboratory (CSIR), IndiaDan Chen, China Meteorological Administration, China
Copyright © 2022 Li, Ma, Kou, Zeng, Cheng, Wang, Zhang, Wang, Lin, Li, Zhu, Yao, Gao and Gao. This is an open-access article distributed under the terms of the Creative Commons Attribution License (CC BY). The use, distribution or reproduction in other forums is permitted, provided the original author(s) and the copyright owner(s) are credited and that the original publication in this journal is cited, in accordance with accepted academic practice. No use, distribution or reproduction is permitted which does not comply with these terms.
*Correspondence: Yang Gao, eWFuZ2dhb0BvdWMuZWR1LmNu
†These authors have contributed equally to this work