 Zhixia Guo
 Haitao Chang2,3
 Rentao Liu
- 1School of Ecology and Environment, Ningxia University, Yinchuan, China
- 2Breeding Base for State Key Laboratory of Land Degradation and Ecosystem Restoration, Ningxia University, Yinchuan, China
- 3Key Laboratory for Restoration and Reconstruction of Degraded Ecosystem in Northwestern China of Ministry of Education, Ningxia University, Yinchuan, China
The abiotic factors via moisture and temperature play the most important role in the growth and development of soil microarthropods. Here we examined the seasonal distribution of the soil microarthropod communities in the Reaumuria soongorica shrubland of the Urat desert steppe in northwestern China in spring, summer, and autumn of 2019 and their relations with environmental factors. Our results showed that the total abundance and group richness of soil microarthropods community was significantly greater in summer than in spring and autumn. There were two indicator taxon (i.e., Cryptopalmites and Isotomidae) observed in summer, and one indicator taxon (i.e., Stigmaeidae) observed in autumn, whereas no indicator taxon was observed in spring. The partial RDA results showed that soil moisture and soil temperature were the main environmental factors that affected the distribution of soil microarthropods. In conclusion, the warm and moist summer harbored greater abundance and richness distribution of soil microhabitats, whereas there was stable diversity distribution across seasons in Urat desert steppe, northern China.
Introduction
One of the largest terrestrial eco-regions on Earth, the Eurasian Steppe is characterized by its dry, grassy plains, which are found in climates with distinct seasonal changes including cold dry winters and warm summers (UNEP). In such steppe, the soil microarthropods are diverse and are one of the key components in grassland ecosystem (Roy et al., 2017). Previous study reported an essential role these microarthropods played in soil functioning (Uthappa and Devakumar, 2021), including the decomposition and mineralization of organic matter (Ashraf et al., 2021; Fujii et al., 2021), the formation of humus, nutrient cycling of carbon, nitrogen and sulfur (Batlle-Aguilar, et al., 2011), and also soil porosity, aeration and the infiltration and distribution of organic matter within soil horizons (Menta, 2012). The occurrence of highly variable seasonal climatic conditions in such grasslands of the Eurasian Steppe could induce the instinct patterns of soil microarthropods across plant growing season augment: (Birkhofer et al., 2011) (i.e., warm summer), resulting in the alteration of ecological functioning and ecosystem dynamics (Meehan, et al., 2020).
In general, seasonal changes in continent grassland ecosystems will induce the alteration of temperature and precipitation that can affect the habitats of soil microarthropods (Langlet et al., 2013). Due to an adaptability and selectivity of soil microarthropods to seasonal changes in their growth and reproduction process, seasonal fluctuations occurred in individual number, population type and community composition of soil microarthropods (Rainio, 2013). Venkataiah et al. (1990) reported that most mites and springtails have a single-peak abundance, and their number and diversity reach a peak from July to August in a tropical semi-arid savanna ecosystem. Menta (2012) reported the greater density of soil Acari in spring than in autumn in a permanent grassland site located in the Taro River Regional Park. However, Yin et al. (2019) reported a significantly higher density of microarthropods (including both Acari and Collembola) in autumn than in spring in grassland soils in Germany. Nevertheless, there were some relatively stable species that did not indicate peak values of abundance and/or richness along with seasonal changes (Nummelin, et al., 1998). Obviously, there were different season pattern of soil microarthropods in different region. However, the seasonal pattern of soil microarthropods in such eastern Eurasian Steppe remined unclear.
What’s more, different taxa of soil microarthropods indicated different responses to seasonal changes (Flórián, et al., 2019). For example, Flórián et al. (2019) reported maximum activity density of soil Collemobolan from June to August, while that of Prostigmata and Mesostigmata in April in an open sand steppe in Kiskunság National Park, central Hungary. Even the surface living Collembolan and soil living Collembolan could indicate a different peak (the former in July, but the latter in June) in the same sand grassland ecosystems (Flórián, et al., 2019). Also, there was different taxa indicator within soil microarthropod communities that could represent the seasonality in grassland ecosystems (Domonell, et al., 2013). These studies show that the ecological characteristics of soil microarthropods are closely related to the state of the above soil environmental elements. Therefore, soil microarthropods can be used as indicators to characterize soil environmental factors. Till now, there were few reports focusing on the seasonal indicators of soil microarthropods in eastern Eurasian Steppe.
The arid Urat desert steppe is located in eastern Eurasian Steppe, and experiences a strong change of temperature and precipitation along with seasonal changes. The objective of present study was to probe into the activity distribution of soil microarthropods and their diversity pattern along seasonal changes in this region.
Materials and Methods
Site Description
The study site is R. soongorica shrubland that is located 5 km apart from Urat Desert Grassland Research Station of Chinese Academy of Sciences (106°58′ E and 41°25′ N, 1650 m elevation) in western Inner Mongolia, China (Figure 1). This area has been exclosured since 2010, covering an area of about 333.34 hm2. The main plant species includes Stipa klemenzii, Allium polyrhizum, Salsola collina, and Peganum harmala, as well as afforested Caragana korshinskii (Zhang, et al., 2019). The main soil types are brown-calcium soil and gray-brown desert soil without litter layer (Shaokun et al., 2016; Zhang, et al., 2019).
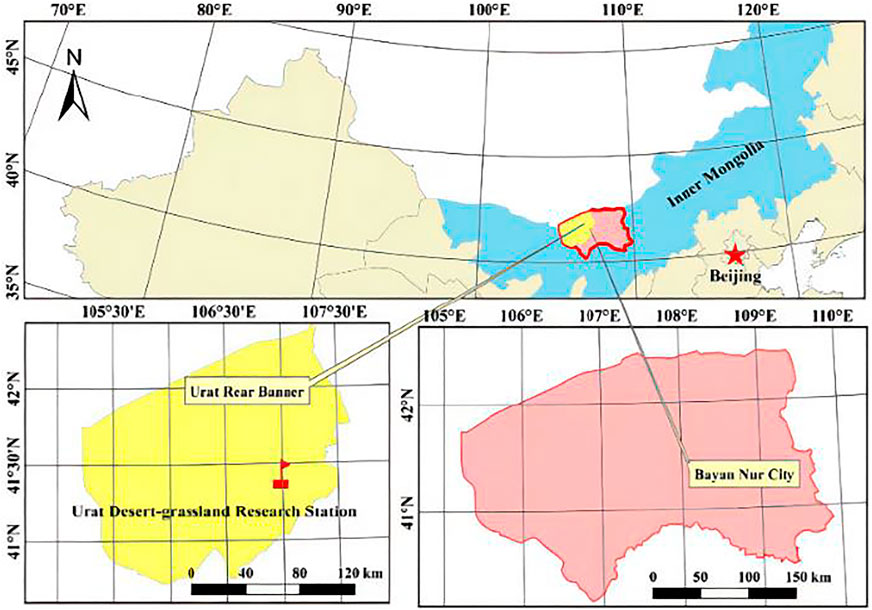
FIGURE 1. Location and sampling site in Urad desert steppe of Mongolia, northwestern China.
This area is a typical continental monsoon climate, and is affected by the continental air mass of Mongolian high pressure (Zhang et al., 2019). The mean annual temperature of 5.3°C, with the highest temperature of 37°C, and the lowest temperature of −34.4°C. The annual accumulated temperature at 10°C is 2,000–3,000°C. The mean annual precipitation is 180 mm, with a large annual variation rate. The precipitation is mainly concentrated in summer (July-August), accounting for 70% of the annual precipitation. Annual evaporation is ten times more than the annual precipitation. The frost-free period is about 130 days a year. The mean annual wind speed is 5 m s−1, and the number of days with wind speed greater than 10 m s−1 per year is as high as 52 days.
Experimental Design
In May 2019, five repeated plots were set up in the R. soongorica shrubland. The distance between the edge of each plot was 15–20 m, with the area of 50 × 50 m2 each. Within each plot, there were 12 sampling points set up with four sampling points beneath the shrub canopy of respect R. soongorica and C. konshinskii, and with four sampling points in the open areas between shrubs. The distance between each sampling points beneath the shrub canopy of R. soongorica and C. konshinskii and in the open areas was 5–10 m. Totally, 60 sampling points were obtained, with (4 R. soongorica + 4 C. konshinskii + 4 open areas) × 5 replicate plots.
Soil Sampling and Meteorological Data Collection
At each sampling point, four soil cores from four directions (east, south, west, and north) were collected with a 100-cm3 metal cylinders (soil depth: 0–15 cm), and then mixed. All the composite soil samples were put in plastic sealed bags, and brought back to the laboratory. The soil sampling was carried on in spring (May), summer (August), and autumn (October) in 2019, when the annual precipitation and average temperature of was 190.8 mm and 6.46°C, respectively. The monthly precipitation and temperature in 2019 see the Figure 2 (Data sources: http://data.cma.cn/).
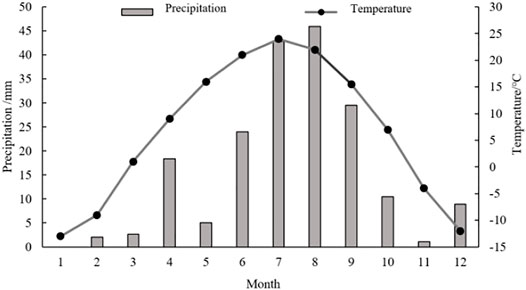
FIGURE 2. Mean monthly precipitation and temperature in 2019.
The soils were sampled with the exception of winter due to few soil microarthropods obtained since early November (the winter started with the temperature below 0°C).
Soil Microarthropod Extraction
One-third composite soil samples were used for soil microarthropod extraction by using Berlese-Tullgren funnels (Macdonald et al., 2009) in the laboratory at Ningxia University. The microarthropod extraction lasted for 48 h at room temperature using one 25-W bulb per funnel. Animals were collected and preserved individually in 75% ethanol (Macdonald et al., 2009). Extracted fauna were sorted and categorized into family level based on literatures including Pictorial Keys to Soil Animals of China (Yin et al., 2010), Acarology (Li, 1989), and Larvae Taxonomy (Ma, 1990). All arthropods were identified under the microscope (Nikon E200MV) and stereomicroscope (Olympus SZX 163).
Soil Property Analysis
The remaining 2/3 composite soil samples (i.e.,) were used for soil physical-chemical analysis. Some soil samples were used for the determination of soil moisture content (0–10 cm; SM, %) by oven drying (Institute of Soil Science, Chinese Academy of Sciences (ISSCAS, 1978). Other soil samples were passed through a 2 mm soil sieve to remove plant and others debris, and were then air-dried. Soil pH and electrical conductivity (EC, μS·cm−1) were measured in a 1: 5 (v/v) soil-water extract, which was measured by PHS-3C acidity meter and portable electrical conductivity meter (DDSJ-308F), respectively.
Composed soil particles was measured by a Mastersizer3000 laser diffraction particle size analyzer. According to USAD classification, it can be divided into coarse sand (CS, 250–1000 μM), fine sand (FS, 50–250 μM), silt (S, 2–50 μM) and clay (C, < 2 μM) (Su et al., 2004). At each sampling points, soil temperature (ST, °C) was measured for 2 weeks by a portable thermometer with conductive wires (Sato KeiryokiMfg Co., Ltd., Japan); the averaged values by the 12 sampling points and 2 weeks represented soil temperature of each sampling seasons. The soil properties at each sampling point see the Table 1.
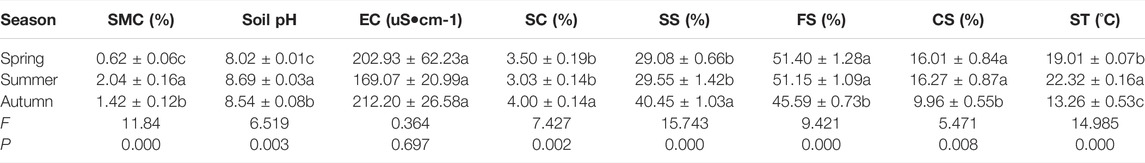
TABLE 1. Values of the environmental factors in three seasons in the Urad desert steppe. Values are means ± se. Different letters within a column represent significant differences at p < 0.05. SMC = soil moisture content, EC = electrical conductivity, SC = soil clay, SS = soil silt, FS = fine sand, CS = coarse sand, ST = soil temperature.
Data Analysis
The number of microarthropods for each taxon groups collected from 12 sampling points within each plot was combined, in order to ensure the representativeness of microarthropod samples covering R. soongorica shrubland. We determined the abundance of each taxonomic group (individuals•200g). According to the proportion of each taxa occupying the total number of individuals, the taxonomical groups can be classified into dominant groups (accounting for more than 10% of the total individual numbers), common groups (1%–10%), and rare groups (< 1%) (Macdonald et al., 2009).
Seasonal diversity variation was examined based on Hill numbers (q = 0, 1, 2) (Chang et al., 2019). Calculated Hill number unifies the reported biological diversity parameter such that the Hill numbers 0, near 1, and 2 provide the Chao2 estimated species richness, exponent of Shannon index, and inverse of Simpson index, respectively (Chao et al., 2014; Osbrink et al., 2018).
Where, i in the formula represents the ith species, and S is the total number of species. Pi is the percentage of the total number of individuals belonging to the group category i. When q = 0, 0D refers to group richness, which does not consider the relative abundance of species. When q = 1, Eq. 1 is meaningless, but when q approaches 1, the limit of this formula is the index of Shannon index (Eq. 2), which represents Shannon diversity. q = 2, indicating inverse of Simpson index, the role of other species except dominant species is underestimated, so it can be interpreted as the effective number of dominant species in the community (Chao et al., 2014; Osbrink et al., 2018).
All statistical analyses were carried out using SPSS 20.0 for Windows. Before applying parametric tests, we tested for normality and homogeneity of variances (Liu et al., 2019). One-way ANOVA and multiple comparison were used to compare the differences between different data groups. Figures were created by using Origin 2018 (Origin Lab, Northampton, United States). For all tests, statistically significant differences were assigned at p < 0.05.
We identified indicator taxon for each season using the labdsv package in R (R Development Core Team, 2009) using the duleg command (numitr = 1000, all season combinations considered). According to the results of the Indval () function, the taxa with the indicator value greater than 0.7 could be considered as the indicator taxon (Nakamura et al., 2007).
Redundancy analysis (RDA) by using Canoco Software 4.5 (Microcomputer Power, Ithaca, United States) was chosen to examine the environmental factors affecting the structure of the soil microarthropod community (Macdonald et al., 2009). The data firstly analyzed detrended correspondence analysis (DCA), which suggested RDA as an appropriate approach for further analysis (length of gradient <4 for soil microarthropod communities). RDA correlated each soil microarthropod group to the environmental factors by selecting linear combinations of environmental factors that gave the smallest residual sum of squares.
Results
A total of 118 individuals belonging to 14 taxonomic groups were captured in three seasons in the R. soongorica shrubland of Urat desert steppe (Table A1). The dominant groups were Pygmephoridae, Tydeidae, and Isotomidae, accounting for 22.88%, 12.71% and 16.95%, respectively. There were 9 common groups and 2 rare groups, accounting for 45.76% and 1.69%, respectively.
The Distribution of Dominant Groups and Indicator Taxon of Soil Microarthropods in Each Season
In spring, there were five dominant groups including Pygmephoridae, Bdellidae, Oppiidae, Onychiuriclae and Tomoceridae, according for 94.12% of total individuals. From spring toward summer, the number of dominant groups decreased to two groups: Pygmephoridae and Isotomidae, with the reduction of dominance to 60.56%. After summer, the composition of dominant groups shifted strongly alternative with the new groups including Stigmaeidae, Tydeidae and Oppiidae, according for 36.67%, 40.00% and 13.33% of total individuals, respectively.
We identified indicator taxon for each season (Table 2): there were two indicator taxon including Cryptopalmites (p = 0.0368) and Isotomidae (p = 0.0317) in summer; there was one indicator taxon including Stigmaeidae (p = 0.0350) in autumn. However, there was no indicator taxon observed in spring.

TABLE 2. Result of indicator species analysis of three seasons in the Urad desert steppe.
The Distribution of Abundance, Richness and Diversity of Soil Microarthropods in Each Season
The total abundance and Chao2 estimated species richness were found to be significantly (p < 0.05) greater in summer than in other two seasons (Figure 3). However, there were no significant differences in exponent of Shannon index and inverse of Simpson index of soil microarthropod between the three seasons.
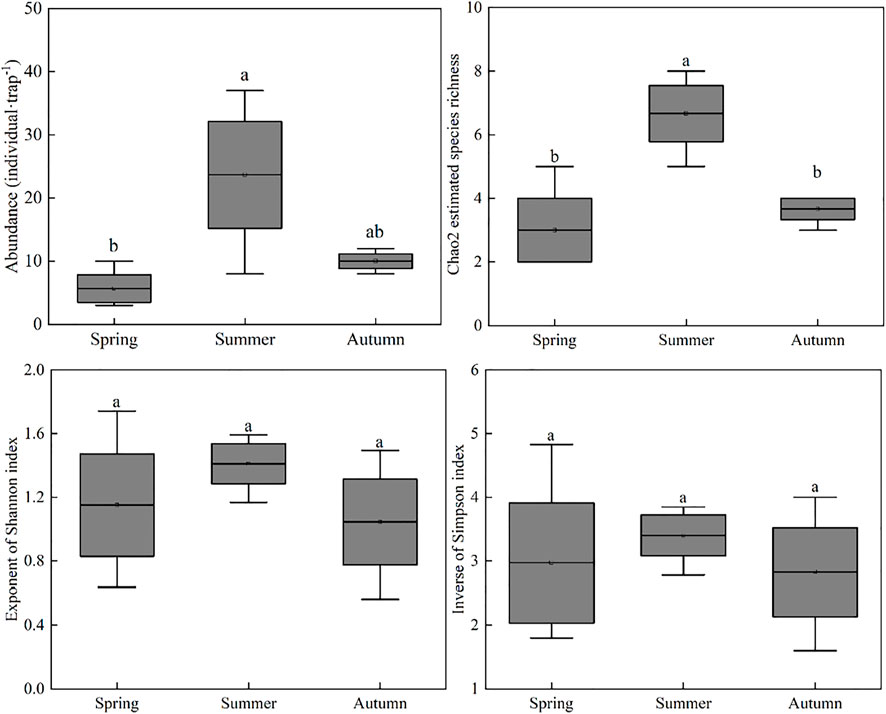
FIGURE 3. The boxplot represents the distribution of abundance, Chao2 estimated species richness, exponent of Shannon index and inverse of Simpson index of soil microarthropod between Spring, Summer, and Autumn in Urad desert steppe (Mean ± SE). Lowercase letters indicate significant differences between seasons (p < 0.05).
The Contribution of Seasonal Factors to the Distribution of Soil Microarthropods
From the results of redundancy analysis (RDA) (Table 3), the eight variables (soil moisture, pH, electrical conductivity, soil temperature, soil clay, silt, fine sand and coarse sand) together explained 57.4% of the total variation in the data, with axes 1 and 2 explained 43.1% and 14.3% of the total variation, respectively. The species-environment relationship for axes 1 and 2 accounted for 84% of the total variance, indicating these axes accounted for the bulk of the variance in the soil microarthropod group data that could be attributed to environmental factors. Species-environment correlations for these axes were > 0.94, indicating that the soil microarthropod group data were strongly correlated with the environment factors. Monte Carlo significance tests revealed that both the first axis (p = 0.02) and all axes (p = 0.012) combined together explained a significant amount of the variation within the data.
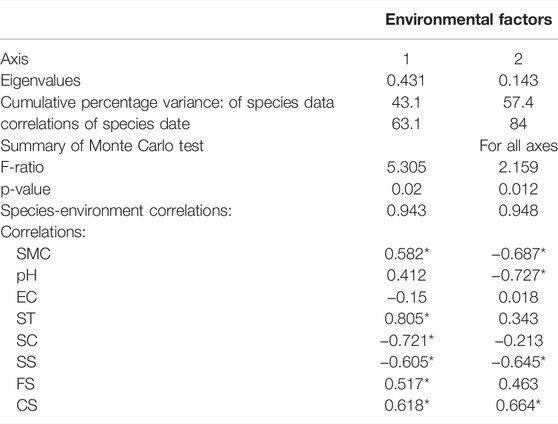
TABLE 3. Correlation coefficients of the environmental factors, eigenvalue, cumulative percentage variance of soil microarthropod species for the first two axes of RDA. Values are for Axis 1 and 2 plotted in the RDA diagram in Figure 4. The highest canonical coefficients and correlations are highlighted by Asterisk (*) that indicates a significant level. *p < 0.05. SMC = soil moisture content, EC = electrical conductivity, SC = soil clay, SS = soil silt, FS = fine sand, CS = coarse sand, ST = soil temperature.
From Figure 4, all the three seasons were sorted into two groups: (1) the summer season was on the right; (2) the spring and autumn seasons were on the left. The second groups could be sorted into two subgroups: (1) the spring was on the up; (2) the autumn was on the bottom.
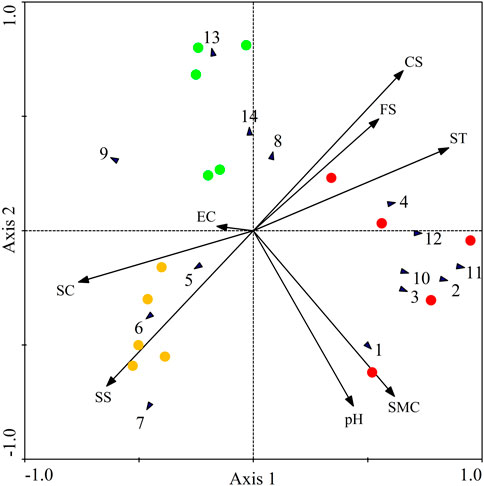
FIGURE 4. Redundancy analysis (RDA) ordination diagram of soil microarthropod taxa with seasonal changes. Green, red, and yellow circle represented the spring summer autumn seasons, respectively. Black arrows represented soil microarthropod taxa, and red arrows represented environmental factors. Soil microarthropod taxa: 1 = Teneriffiidae, 2 = Macrochelidae, 3 = Cryptopalmites, 4 = Pygmephoridae, 5 = Enocaligonellidae, 6 = Stigmaeidae, 7 = Tydeidae, 8 = Bdellidae, 9 = Oppiidae, 10 = Tetranychidae, 11 = Isotomidae, 12 = Onychiuriclae, 13 = Tomoceridae, 14 = Coleoptera Larvae. Environmental factors: SMC = soil moisture content, EC = electrical conductivity, SC = soil clay, SS = soil silt, FS = fine sand, CS = coarse sand, ST = soil temperature.
Figure 4 also demonstrates that different groups within the microarthropod community responded differently to the environmental factors (Table 4). The microarthropod groups whose arrows pointed in approximately the same direction in the ordination as the arrows for the environmental factors were strongly correlated with those factors. For example, the Teneriffiidae were positively correlated with soil moisture content (p < 0.05). The Macrochelidae and Isotomidae were positively correlated with soil moisture content whereas negatively correlated with soil clay (p < 0.05). The Tydeidae was negatively correlated with soil fine sand and soil coarse sand whereas negatively correlated with soil silt (p < 0.05). The Tomoceridae was negatively correlated with soil moisture content (p < 0.05).
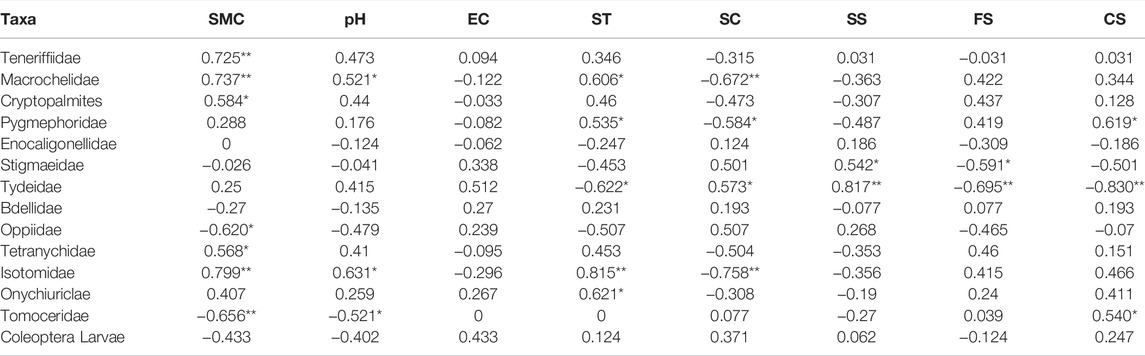
TABLE 4. Correlation coefficients (Spearman) between single microarthropod groups and environmental factors. *p < 0.05, **p < 0.01. SMC = soil moisture content, EC = electrical conductivity, SC = soil clay, SS = soil silt, FS = fine sand, CS = coarse sand, ST = soil temperature.
From the results of partial RDA (Table 5), soil temperature (F = 6.53, p = 0.002) and soil moisture content (F = 4.36, p = 0.002) were significant in the Monte Carlo permutation test, whereas those of the remaining variables were not significant under the same test (in all case p > 0.05). Soil temperature and soil moisture content appeared to be the most important environment factors driving the distribution of soil microhabitats across seasons.
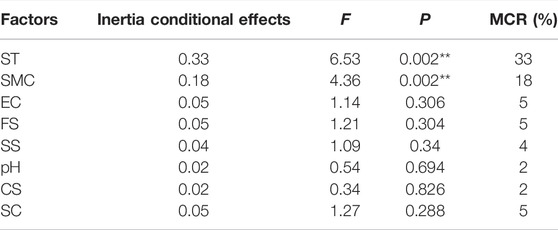
TABLE 5. Redundancy analysis (RDA) of the taxa abundance data for quantifying the conditional effects of the measured environmental factors on taxa composition using forward selection with Monte Carlo permutation test. The inertia from the condition effects is used to calculate the multivariate correlation ratio (MCR), which represents the proportion of variation explained by the individual environment factors. The sum of all eigenvalues = 1.000. *p < 0.05, **p < 0.01. SMC = soil moisture content, EC = electrical conductivity, SC = soil clay, SS = soil silt, FS = fine sand, CS = coarse sand, ST = soil temperature.
Discussion
There was a strong dynamic time (season)-related process for distribution of taxonomic groups and community structure of soil microarthropods due to their sensitivity to environmental changes (Kardol et al., 2011; Wu et al., 2014; Liu et al., 2017). In the Urat desert steppe, there was strong seasonal moisture and temperature driving the composition and abundance distribution of soil microhabitats (Table A1). This finding was found to be line with other studies (Sackmann and Flores, 2009), and could be elucidated by the markedly greater abundances of dominant groups in spring and autumn than in summer (Liu et al., 2012). Eisenhauer et al. (2012) argued that the dominant groups were more resilient to arid environments during the dry season and may therefore be less vulnerable. Therefore, there was relatively higher abundance of dominant groups observed in spring and autumn with the dry seasons of little precipitation and relatively low temperatures. With regard to a decrease in the abundance of the dominant group in summer, it is ascribed to wet season of more precipitation and high temperature due to their high adaptation to warm and humid environments (Vestergard et al., 2015; Yin et al., 2019).
Indicator taxon were a representative of significance of certain environmental characteristics (Siddig et al., 2016), and can be used to assess the effect of environmental change on soil biodiversity (Sheng et al., 2021). In the present study, there were two indicator taxon (Cryptopalmites and Isotomidae) in summer, and one indicator taxon (Stigmaeidae) in autumn, whereas there was no indicator taxon in spring (Table 2). It was suggested that the indicator taxon of different groups responded differently to seasonal changes (Sánchez-Reyes et al., 2019). Both indicator taxon including Cryptopalmites and Isotomidine observed in summer (Vikram Reddy and Venkataiah, 1990) were in line with the findings of Vestergard et al. (2015) and Yin et al. (2019). Vestergard et al. (2015), and Yin et al. (2019) reported that Cryptopalmites and Isotomidine were highly adaptable to warm and humid environments and sensitive to arid environments for example of summer seasons in Urat desert steppe. In relatively dry seasons, the Stigmaeidae was more drought-tolerant and may better survive under arid environments for example of autumn seasons here (Hiddink et al., 2005; Makkonen et al., 2011). However, in spring no indicator taxon was found, suggesting an insensitive of soil microarthropods spring soil variables (Šrut et al., 2019).
Total abundance and Chao2 estimated species richness of microarthropods were greater in summer than in other two seasons (Figure 3), similar to the finding by Bartz et al. (2014) and Alves et al. (2006). On the one hand, the rain-heat synchronization in summer could effectively promote the growth and development of vegetation communities and thus provide rich food resources for soil microarthropods (Lazzaro et al., 2018). On the other hand, soil microarthropods larvae began to reproduce with an increased numbers and taxon with warmer and moisture soil conditions from spring toward to summer (Wu et al., 2008). In spring and autumn, however, the number of some groups was significantly reduced, and even some died, due to small amount of precipitation and low soil temperature and related biological activity (Lin et al., 2005). These results were in accordance with previous studies by Moco et al. (2005) and Santos et al. (2020).
Noticeably, there were no significant differences in exponent of Shannon index and inverse of Simpson index between the three seasons. It was suggested that there was a relatively stable diversity distribution between seasons (Bucci et al., 2008). In addition, the lower diversity of soil microhabitats relative to typical steppe characterized the low production of grassland and simply food web structure in Urat desert steppe (Liu, 2015).
Seasonal changes in climatic factors may directly or indirectly lead to soil conditions that indicated strong effect on the growth and reproduction of soil microarthropods (Rainio, 2013; Liu et al., 2017; Meehan et al., 2020). In the present study, there was different response of taxon adapted to seasonal changes in environmental factors (Turnbull and Lindo, 2015). For example, Lindo et al. (2012) found that soil moisture (or lack thereof) was a strong environmental filter for soil microarthropod. Especially for Teneriffiidae, Macrochelidae, and Isotomidae, sufficient soil moisture will promote the increase of its abundance (Table A1). Studies have also shown that the abundance of soil microarthropods was positively correlated with soil pore volume (Nielsen et al., 2008). This is consistent with our finding that coarse soil reduces pore size or space will decrease Tydeidae’s abundance (Turnbull and Lindo, 2015). This fully characterized their comprehensive differences in life history, nutritional patterns, reproductive characteristics and biological attributes (Liu, 2015). From the community-lever, soil moisture and soil temperature were proximal environmental factors structing the seasonal distribution of soil microarthropods community. It was a reflective of bottom-up forces within food chains from soil moisture and temperature through plant growth and productivity to herbivores for example of soil microarthropods (Birkhofer et al., 2008; Bell et al., 2008). Therefore, the seasonal distribution of the abundance and diversity of soil microarthropods played implications on the understanding of soil biological diversity in response to global climate change in the Urat desert steppe.
Conclusion
The composition and abundance distribution of dominant taxa shifted across seasonal changes. The Cryptopalmites and Isotomidae families could be used as indicator taxon of summer, and the Stigmaeidae could be used as indicator of autumn. The summer harbored greater total abundance and group richness of soil microarthropods relative to spring and autumn seasons. However, there was little change of diversity distribution of soil microarthropods across seasons. The sensitive and selection of soil microarthropods to soil temperature and moisture acted by seasonal changes could play implications on the adaptability of soil microarthropods to climatic change (Birkhofer et al., 2011; Langlet et al., 2013).
Data Availability Statement
The original contributions presented in the study are included in the article/supplementary material, further inquiries can be directed to the corresponding author.
Author Contributions
Supervision: RL; Visualization: ZG and HC; Writing—original and draft: ZG and HC; Writing—review and editing: RL.
Funding
The work was supported by the Natural Science Foundation of Ningxia Province (2020AAC02014; 2021AAC03047), Ningxia Key Project of Research and Development (2021BEG03007), Ningxia project of Innovation Team for Arid Ecology and Hydrology (2021RXTDLX01), and National Natural Science Foundation of China (Grant numbers 41867005).
Conflict of Interest
The authors declare that the research was conducted in the absence of any commercial or financial relationships that could be construed as a potential conflict of interest.
Publisher’s Note
All claims expressed in this article are solely those of the authors and do not necessarily represent those of their affiliated organizations, or those of the publisher, the editors and the reviewers. Any product that may be evaluated in this article, or claim that may be made by its manufacturer, is not guaranteed or endorsed by the publisher.
Acknowledgments
We are grateful for the field help of the Urat Desert-grassland Research Station, Chinese Academy of Sciences.
References
Alves, M. V., Baretta, D., and Cardoso, E. J. B. N. (2006). Fauna edáfica em diferentes sistemas de cultivo no estado de São Paulo. Rev. Ciências Agroveterinárias 5 (1), 33–43.
Ashraf, M. N., Jusheng, G., Lei, W., Mustafa, A., Waqas, A., Aziz, T., et al. (2021). Soil Microbial Biomass and Extracellular Enzyme-Mediated Mineralization Potentials of Carbon and Nitrogen under Long-Term Fertilization (> 30 years) in a Rice-Rice Cropping System. J. Soils Sediments 21 (12), 3789–3800. doi:10.1007/s11368-021-03048-0
Bartz, M. L. C., Brown, G. G., Orso, R., Mafra, A. L., and Baretta, D. (2014). A influência Do sistema de manejo Do solo sobre a fauna edáfica e epígea na região oeste catarinense. Rev. Ciência Agronômica 45 (5SPE), 880–887. doi:10.1590/s1806-66902014000500003
Batlle-Aguilar, J., Brovelli, A., Porporato, A., and Barry, D. A. (2011). Modelling Soil Carbon and Nitrogen Cycles during Land Use Change. Sustain. Agric. 2, 499–527. doi:10.1007/978-94-007-0394-0_23
Bell, C., McIntyre, N., Cox, S., Tissue, D., and Zak, J. (2008). Soil Microbial Responses to Temporal Variations of Moisture and Temperature in a Chihuahuan Desert Grassland. Microb. Ecol. 56 (1), 153–167. doi:10.1007/s00248-007-9333-z
Birkhofer, K., Bezemer, T. M., Bloem, J., Bonkowski, M., Christensen, S., and Dubois, D. (2008). Long-Term Organic Farming Fosters Below and Aboveground Biota: Implications for Soil Quality, Biological Control and Productivity. Soil Biology and Biochemistry 40 (9), 2297–2308. doi:10.1016/j.soilbio.2008.05.007
Birkhofer, K., Diekötter, T., Boch, S., Fischer, M., Müller, J., Socher, S., et al. (2011). Soil Fauna Feeding Activity in Temperate Grassland Soils Increases with Legume and Grass Species Richness. Soil Biol. Biochem. 43 (10), 2200–2207. doi:10.1016/j.soilbio.2011.07.008
Bucci, S. J., Scholz, F. G., Goldstein, G., Hoffmann, W. A., Meinzer, F. C., Franco, A. C., et al. (2008). Controls on Stand Transpiration and Soil Water Utilization along a Tree Density Gradient in a Neotropical Savanna. Agric. For. meteorology 148 (6-7), 839–849. doi:10.1016/j.agrformet.2007.11.013
Chang, Y., Song, S., Li, A., Zhang, Y., Li, Z., Xiao, Y., et al. (2019). The Roles of Morphological Traits, Resource Variation and Resource Partitioning Associated with the Dietary Niche Expansion in the Fish-Eating Bat Myotis Pilosus. Mol. Ecol. 28 (11), 2944–2954. doi:10.1111/mec.15127
Chao, A., Gotelli, N. J., Hsieh, T. C., Sander, E. L., Ma, K. H., Colwell, R. K., et al. (2014). Rarefaction and Extrapolation with Hill Numbers: a Framework for Sampling and Estimation in Species Diversity Studies. Ecol. Monogr. 84 (1), 45–67. doi:10.1890/13-0133.1
Domonell, A., Brabender, M., Nitsche, F., Bonkowski, M., and Arndt, H. (2013). Community Structure of Cultivable Protists in Different Grassland and Forest Soils of Thuringia. Pedobiologia 56 (1), 1–7. doi:10.1016/j.pedobi.2012.07.001
Eisenhauer, N., Cesarz, S., Koller, R., Worm, K., and Reich, P. B. (2012). Global Change Belowground: Impacts of Elevated CO2, Nitrogen, and Summer Drought on Soil Food Webs and Biodiversity. Glob. Change Biol. 18 (2), 435–447. doi:10.1111/j.1365-2486.2011.02555.x
Flórián, N., Ladányi, M., Ittzés, A., Kröel-Dulay, G., Ónodi, G., Mucsi, M., et al. (2019). Effects of Single and Repeated Drought on Soil Microarthropods in a Semi-arid Ecosystem Depend More on Timing and Duration Than Drought Severity. PloS one 14 (7), e0219975. doi:10.1371/journal.pone.0219975
Fujii, K., Funakawa, S., Hayakawa, C., and Kosaki, T. (2021). Effects of Clearcutting and Girdling on Soil Respiration and Fluxes of Dissolved Organic Carbon and Nitrogen in a Japanese Cedar Plantation. For. Ecol. Manag. 498, 119520. doi:10.1016/j.foreco.2021.119520
Hiddink, G. A., van Bruggen, A. H. C., Termorshuizen, A. J., Raaijmakers, J. M., and Semenov, A. V. (2005). Effect of Organic Management of Soils on Suppressiveness to Gaeumannomyces Graminis Var. Tritici and its Antagonist, Pseudomonas Fluorescens. European Journal of Plant Pathology 113 (4), 417–435. doi:10.1007/s10658-005-5402-7
Institute of Soil Science, Chinese Academy of Sciences (ISSCAS) (1978). Physical and Chemical Analysis Methods of Soils. Shanghai: China Shanghai Science Technology Press.
Kardol, P., Reynolds, W. N., Norby, R. J., and Classen, A. T. (2011). Climate Change Effects on Soil Microarthropod Abundance and Community Structure. Appl. Soil Ecol. 47 (1), 37–44. doi:10.1016/j.apsoil.2010.11.001
Langlet, D., Baal, C., Geslin, E., Metzger, E., Zuschin, M., Riedel, B., et al. (2013). Foraminiferal Species Responses to In Situ, Experimentally Induced Anoxia in the Adriatic Sea. Biogeosciences Discuss. 10 (7), 12065–12114. doi:10.5194/bg-10-7463-2013
Lazzaro, L., Mazza, G., d'Errico, G., Fabiani, A., Giuliani, C., Inghilesi, A. F., et al. (2018). How Ecosystems Change Following Invasion by Robinia Pseudoacacia: Insights from Soil Chemical Properties and Soil Microbial, Nematode, Microarthropod and Plant Communities. Sci. Total Environ. 622-623, 1509–1518. doi:10.1016/j.scitotenv.2017.10.017
Lin, Y. H., Zhang, F. D., Zhang, J. Q., Ouyang, X. Y., Mo, S. D., Zhou, G. Y., et al. (2005). Preliminary Investigation on Temporal and Spatial Variation of Structure of Soil Fauna Community in Different Natural Vegetations of Dinghushan. Acta Ecol. Sin. 25 (10), 2616–2622. doi:10.3321/j.issn:1000-0933.2005.10.023
Lindo, Z., Whiteley, J., and Gonzalez, A. (2012). Traits Explain Community Disassembly and Trophic Contraction Following Experimental Environmental Change. Glob. Change Biol. 18 (8), 2448–2457. doi:10.1111/j.1365-2486.2012.02725.x
Liu, J.-L., Li, F.-R., Liu, C.-A., and Liu, Q.-J. (2012). Influences of Shrub Vegetation on Distribution and Diversity of a Ground Beetle Community in a Gobi Desert Ecosystem. Biodivers. Conserv. 21 (10), 2601–2619. doi:10.1007/s10531-012-0320-4
Liu, J. L., Li, F. R., Zhao, W. Z., and Sun, T. (2017). Short-term Responses of Mites and Springtails to Precipitation in an Arid Desert Ecosystem. J. Desert Res. 37 (3), 439. doi:10.7522/j.issn.1000-694X.2016.00039
Liu, R. T., Steinberger, Y., Hou, J. W., Zhao, J., Liu, J. N., Chang, H. T., et al. (2019). Conversion of Cropland into Agroforestry Land versus Naturally-Restored Grassland Alters Soil Macro-Faunal Diversity and Trophic Structure in the Semi-arid Agro-Pasture Zone of Northern China. J. Arid. Land 11 (2), 306–317. doi:10.1007/s40333-019-0008-7
Macdonald, C. A., Thomas, N., Robinson, L., Tate, K. R., Ross, D. J., Dando, J., et al. (2009). Physiological, Biochemical and Molecular Responses of the Soil Microbial Community after Afforestation of Pastures with Pinus Radiata. Soil Biol. Biochem. 41 (8), 1642–1651. doi:10.1016/j.soilbio.2009.05.003
Makkonen, M., Berg, M. P., Van Hal, J. R., Callaghan, T. V., Press, M. C., and Aerts, R. (2011). Traits Explain the Responses of a Sub-arctic Collembola Community to Climate Manipulation. Soil Biol. Biochem. 43 (2), 377–384. doi:10.1016/j.soilbio.2010.11.004
Meehan, M. L., Barreto, C., Turnbull, M. S., Bradley, R. L., Bellenger, J.-P., Darnajoux, R., et al. (2020). Response of Soil Fauna to Simulated Global Change Factors Depends on Ambient Climate Conditions. Pedobiologia 83, 150672. doi:10.1016/j.pedobi.2020.150672
Menta, C. (2012). “Soil Fauna Diversity-Function, Soil Degradation, Biological Indices, Soil Restoration,” in Biodiversity Conservation and Utilization in a Diverse World, 59–94. doi:10.5772/51091
Moço, M. K. S., Gama-Rodrigues, E. F., Gama-Rodrigues, A. C., and Correia, M. E. F. (2005). Caracterização da fauna edáfica em diferentes coberturas vegetais na região norte fluminense. Rev. Bras. ciência do solo 29 (4), 555–564. doi:10.1590/s0100-06832005000400008
Nakamura, A., Catterall, C. P., House, A. P. N., Kitching, R. L., and Burwell, C. J. (2007). The Use of Ants and Other Soil and Litter Arthropods as Bio-Indicators of the Impacts of Rainforest Clearing and Subsequent Land Use. J. Insect Conserv. 11 (2), 177–186. doi:10.1007/s10841-006-9034-9
Nielsen, U. N., Osler, G. H. R., van der Wal, R., Campbell, C. D., and Burslem, D. F. R. P. (2008). Soil Pore Volume and the Abundance of Soil Mites in Two Contrasting Habitats. Soil Biol. Biochem. 40 (6), 1538–1541. doi:10.1016/j.soilbio.2007.12.029
Nummelin, M. (1998). Log‐normal Distribution of Species Abundances is not a Universal Indicator of Rain Forest Disturbance[J]. Journal of Applied Ecology 35 (3), 454–457. doi:10.1046/j.1365-2664.1998.00309.x
Osbrink, W. L. A., Thomas, D. B., Goolsby, J. A., Showler, A. T., and Leal, B. (2018). Higher Beetle Diversity in Native Vegetation Than in Stands of the Invasive Arundo, Arundo donax L., along the Rio Grande Basin in Texas, USA. J. Insect Sci. 18 (3), 18. doi:10.1093/jisesa/iey053
Rainio, J. (2013). Seasonal Variation of Carabid Beetle (Coleoptera: Carabidae) Abundance and Diversity in Ranomafana National Park, Madagascar. J. Entomology Zoology Stud. 1 (5), 92–98.
Roy, S., Roy, M. M., Bano, R., and Saxena, P. (2017). “Soil Microarthropods: Biodiversity and Role in Grassland and Agroforestry Ecosystems,” in Agroforestry (Singapore: Springer), 669–689. doi:10.1007/978-981-10-7650-3_26
Sackmann, P., and Flores, G. E. (2009). Temporal and Spatial Patterns of Tenebrionid Beetle Diversity in NW Patagonia, Argentina. J. Arid Environ. 73 (12), 1095–1102. doi:10.1016/j.jaridenv.2009.05.007
Sánchez-Reyes, U. J., Niño-Maldonado, S., Clark, S. M., Barrientos-Lozano, L., and Almaguer-Sierra, P. (2019). Successional and Seasonal Changes of Leaf Beetles and Their Indicator Value in a Fragmented Low Thorn Forest of Northeastern Mexico (Coleoptera, Chrysomelidae). Zookeys 825, 71. doi:10.3897/zookeys.825.30455
Santos, D. P., Marchão, R. L., Barbosa, R. S., Silva Junior, J. P., Silva, E. M., Nóbrega, J. C. A., et al. (2020). Macrofauna edáfica associada a plantas de cobertura em um Latossolo Amarelo Do sudoeste Do estado Do Piauí, Brasil. Arq. do Inst. Biológico 87, e0822018. doi:10.1590/1808-1657000822018
Shaokun, W., Xueyong, Z., Kunfeng, J., Baolan, G., Hao, Q., Wei, M., et al. (2016). Soil Bacterial Diversity and its Vertical Distribution in Stipa Klemenzii Community of Urad Desert Steppe. J. Desert Res. 36 (6), 1564. doi:10.7522/j.issn.1000-694X.2016.00053
Sheng, X., Zhaohui, Z., and Zhihui, W. (2021). Effects of Heavy Metals on Moss Diversity and Analysis of Moss Indicator Species in Nancha Manganese Mining Area, Southwestern China. Glob. Ecol. Conservation 28, e01665. doi:10.1016/j.gecco.2021.e01665
Siddig, A. A. H., Ellison, A. M., Ochs, A., Villar-Leeman, C., and Lau, M. K. (2016). How Do Ecologists Select and Use Indicator Species to Monitor Ecological Change? Insights from 14 Years of Publication in Ecological Indicators. Ecol. Indic. 60, 223–230. doi:10.1016/j.ecolind.2015.06.036
Šrut, M., Menke, S., Höckner, M., and Sommer, S. (2019). Earthworms and Cadmium - Heavy Metal Resistant Gut Bacteria as Indicators for Heavy Metal Pollution in Soils? Ecotoxicol. Environ. Saf. 171, 843–853. doi:10.1016/j.ecoenv.2018.12.102
Su, Y. Z., Zhao, H. L., Zhao, W. Z., and Zhang, T. H. (2004). Fractal Features of Soil Particle Size Distribution and the Implication for Indicating Desertification. Geoderma 122 (1), 43–49. doi:10.1016/j.geoderma.2003.12.003
Turnbull, M. S., and Lindo, Z. (2015). Combined Effects of Abiotic Factors on Collembola Communities Reveal Precipitation May Act as a Disturbance. Soil Biol. Biochem. 82, 36–43. doi:10.1016/j.soilbio.2014.12.007
Uthappa, A. R., and Devakumar, A. S. (2021). Seasonal Diversity of Soil Fauna in Semi-arid Regions of Karnataka. J. Entomology Zoology Stud. 9, 461–468. doi:10.22271/j.ento
Venkataiah, M., Subrarathnam, G. V., and Rosaiah, B. (1990). Development of Resistance by Gram pod Borer to Fenvalerate[J]. Indian Journal of Plant Protection 18 (2), 285–286.
Vestergård, M., Dyrnum, K., Michelsen, A., Damgaard, C., and Holmstrupc, M. (2015). Long-term Multifactorial Climate Change Impacts on Mesofaunal Biomass and Nitrogen Content. Appl. Soil Ecol. 92, 54–63. doi:10.1016/j.apsoil.2015.03.002
Vikram Reddy, M., and Venkataiah, B. (1990). Seasonal Abundance of Soil-Surface Arthropods in Relation to Some Meteorological and Edaphic Variables of the Grassland and Tree-Planted Areas in a Tropical Semi-arid Savanna. Int. J. Biometeorol. 34 (1), 49–59. doi:10.1007/bf01045820
Wu, H. T., Lu, X. G., Jiang, M., and Bao, X. (2008). The Characteristics of Soil Fauna Community Structure and its Seasonal Variations of Typical Wetlands in the Sanjiang Plain, China. Wetl. Sci. 6 (4), 459–465. doi:10.13248/j.cnki.wetlandsci
Wu, T., Su, F., Han, H., Du, Y., Yu, C., and Wan, S. (2014). Responses of Soil Microarthropods to Warming and Increased Precipitation in a Semiarid Temperate Steppe. Appl. soil Ecol. 84, 200–207. doi:10.1016/j.apsoil.2014.07.003
Yin, X., Song, B., Dong, W., Xin, W., and Wang, Y. (2010). A Review on the Eco-Geography of Soil Fauna in China. J. Geogr. Sci. 20 (3), 333–346. doi:10.1007/s11442-010-0333-4
Yin, R., Eisenhauer, N., Schmidt, A., Gruss, I., Purahong, W., Siebert, J., et al. (2019). Climate Change Does Not Alter Land-Use Effects on Soil Fauna Communities. Appl. Soil Ecol. 140, 1–10. doi:10.1016/j.apsoil.2019.03.026
Zhang, R., Zhao, X., Zuo, X., Qu, H., Degen, A. A., Luo, Y., et al. (2019). Impacts of Precipitation on Ecosystem Carbon Fluxes in Desert-Grasslands in Inner Mongolia, China. J. Geophys. Res. Atmos. 124 (3), 1266–1276. doi:10.1029/2018jd028419
Appendix:
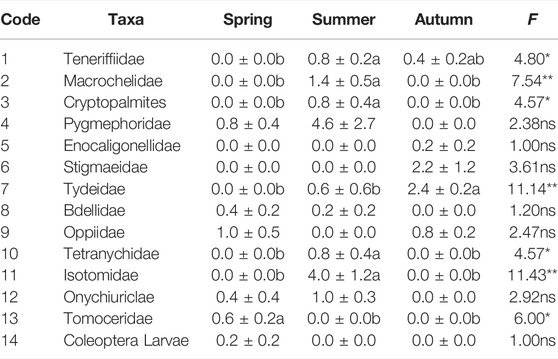
TABLE A1. The abundance distribution (individuals•m−2) of taxonomic groups of microarthropod in three seasons. Values are Mean ± SE. *P<0.05, ** P<0.01. ns means no significant difference.
Keywords: Urat desert steppe, soil microarthropod, seasonal changes, indicator taxon, biodiversity conservation
Citation: Guo Z, Chang H and Liu R (2022) Response of Soil Microarthropod Community to Seasonal Changes in Urat Desert Steppe, Inner Mongolia. Front. Environ. Sci. 10:893913. doi: 10.3389/fenvs.2022.893913
Received: 11 March 2022; Accepted: 31 May 2022;
Published: 28 June 2022.
Edited by:
Li Zuo, University of Maine at Presque Isle, United StatesReviewed by:
Shaokun Wang, Northwest Institute of Eco-Environment and Resources (CAS), ChinaTongchuan Li, Northwest A&F University, China
Copyright © 2022 Guo, Chang and Liu. This is an open-access article distributed under the terms of the Creative Commons Attribution License (CC BY). The use, distribution or reproduction in other forums is permitted, provided the original author(s) and the copyright owner(s) are credited and that the original publication in this journal is cited, in accordance with accepted academic practice. No use, distribution or reproduction is permitted which does not comply with these terms.
*Correspondence: Rentao Liu, bnh1bGl1MjAxMkAxMjYuY29t