
95% of researchers rate our articles as excellent or good
Learn more about the work of our research integrity team to safeguard the quality of each article we publish.
Find out more
ORIGINAL RESEARCH article
Front. Environ. Sci. , 25 August 2022
Sec. Atmosphere and Climate
Volume 10 - 2022 | https://doi.org/10.3389/fenvs.2022.893478
This article is part of the Research Topic Permafrost Environment Changes in a Warming Climate View all 12 articles
 Torben Windirsch1,2*
 Guido Grosse1,2
 Mathias Ulrich3,4
 Bruce C. Forbes5Mathias Göckede6
 Juliane Wolter1,7
 Marc Macias-Fauria8Johan Olofsson9Nikita Zimov10
 Jens Strauss1
The risk of carbon emissions from permafrost is linked to an increase in ground temperature and thus in particular to thermal insulation by vegetation, soil layers and snow cover. Ground insulation can be influenced by the presence of large herbivores browsing for food in both winter and summer. In this study, we examine the potential impact of large herbivore presence on the soil carbon storage in a thermokarst landscape in northeastern Siberia. Our aim in this pilot study is to conduct a first analysis on whether intensive large herbivore grazing may slow or even reverse permafrost thaw by affecting thermal insulation through modifying ground cover properties. As permafrost soil temperatures are important for organic matter decomposition, we hypothesize that herbivory disturbances lead to differences in ground-stored carbon. Therefore, we analyzed five sites with a total of three different herbivore grazing intensities on two landscape forms (drained thermokarst basin, Yedoma upland) in Pleistocene Park near Chersky. We measured maximum thaw depth, total organic carbon content, δ13C isotopes, carbon-nitrogen ratios, and sediment grain-size composition as well as ice and water content for each site. We found the thaw depth to be shallower and carbon storage to be higher in intensively grazed areas compared to extensively and non-grazed sites in the same thermokarst basin. First data show that intensive grazing leads to a more stable thermal ground regime and thus to increased carbon storage in the thermokarst deposits and active layer. However, the high carbon content found within the upper 20 cm on intensively grazed sites could also indicate higher carbon input rather than reduced decomposition, which requires further studies including investigations of the hydrology and general ground conditions existing prior to grazing introduction. We explain our findings by intensive animal trampling in winter and vegetation changes, which overcompensate summer ground warming. We conclude that grazing intensity—along with soil substrate and hydrologic conditions—might have a measurable influence on the carbon storage in permafrost soils. Hence the grazing effect should be further investigated for its potential as an actively manageable instrument to reduce net carbon emission from permafrost.
In the context of global climate warming, carbon emissions from Arctic permafrost regions have been identified as a key source of greenhouse gases (GHGs), further accelerating the permafrost carbon-climate feedback and increasing atmospheric warming (Schuur et al., 2015; Turetsky et al., 2019; Bowen et al., 2020). An estimated 1300 gigatons (Gt) of carbon are stored within the upper 3 m of ground in the permafrost region, of which approximately 1,000 Gt are perennially frozen (Hugelius et al., 2014; Mishra et al., 2021). These 1,300 Gt account for approximately 35% of global soil carbon, with 2,050–2,800 Gt globally present in the top 3 m of non-permafrost regions (Schuur et al., 2015; Jackson et al., 2017; Strauss et al., 2021). With further Arctic warming now and in the future, deposits of organic-rich material embedded in permafrost are expected to become widely available for microbial decomposition and increased GHG production with permafrost thaw (Schuur et al., 2008).
In general, there are processes leading to carbon accumulation in permafrost areas, such as deposition of organic-rich sediments (via aeolian or fluvial transport, Huh et al. (1998); Chlachula (2003)), increased in situ biomass accumulation (via increased plant growth, Schuur et al. (2008)), cryoturbation (Kaiser et al., 2007), and animal influence via feces. This last one is linked to increased plant growth by providing easily available nutrients (Grellmann 2002); moreover, the disturbance of the surface layer via trampling mixes fresh organic matter (OM) into the ground, providing additional OM input that adds to the previously permafrost-preserved OM.
Vegetation composition and snow conditions together play major roles in mediating Arctic surface, near-surface, and sub-surface temperature regimes by influencing the land surface energy budget, and thus the belowground carbon cycle. Both vegetation and snow can be heavily influenced by the presence of large herbivorous animals. Plant growth itself affects above and below ground carbon storage as plants take up carbon dioxide from the environment, temporarily fixing carbon in their biomass, while plant litter and roots become components of the active layer of soils (the seasonal thaw layer on top of permafrost). Dense vegetation cover may cause relative ground cooling by reducing summer energy exchange by creating wind protection and a stable air layer between the ground’s surface and the canopy (Zhang et al., 2013; Mod and Luoto 2016; te Beest et al., 2016). In winter, shrub vegetation effectively traps snow, leading to locally higher snow accumulation (Domine et al., 2016), hence insulation and therefore maintains relatively warm ground temperatures throughout winter (Sannel 2020). In contrast, graminoid vegetation facilitates ground cooling in winter, as it bends beneath accumulating snow, reducing the volume of air trapped beneath the snow (Blok et al., 2010). In summer, graminoid vegetation is also less insulating, leading to stronger ground warming underneath the canopy. However, this summer effect is offset by the vast difference between summer and winter seasonal length in the Arctic. In this way, graminoids contribute to a net cooling effect (Macias-Fauria et al., 2020). However, due to warming climate and an associated extension of the growing season, an increase in the establishment and growth of shrub vegetation has already been observed (Frost et al., 2013) and is projected to increase in the Arctic tundra regions (Zhang et al., 2013).
Previous studies have reported on the effect of herbivore—mainly reindeer—presence on carbon storage in tundra biomes (Olofsson 2006; Falk et al., 2015; Olofsson and Post 2018; Ylänne et al., 2018). Those investigations mainly focused on the above-ground biomass changes and concluded that the effects of grazing-associated vegetation changes from shrubs to graminoid vegetation enhance soil carbon sequestration and might help reduce soil carbon emissions. In contrast to these findings, Monteath et al. (2021) challenge the idea of a rewilding strategy—reintroducing and promoting (semi-) wild animals—against Arctic carbon emissions, stating that cause and consequence in herbivore extinction and Arctic shrubification are unclear. While their macrofossil analysis suggests that extinction was a consequence of habitat loss in a warming climate, leading to shrub expansion and vegetation shifts, a study using ancient DNA analysis found the opposite (Murchie et al., 2021). Modeling studies have tried to quantify the impact of large herbivores on permafrost soil carbon storage (Zimov et al., 2009; Beer et al., 2020). These modeling exercises and predictions have, however, not yet been tested in the field.
Some researchers have proposed to actively exploit these processes and properties in order to preserve permafrost and limit permafrost carbon emissions as a consequence of a warming climate. The establishment of sufficiently large numbers of herbivores as ecosystem engineers could intensify grazing and trampling pressure in today’s tundra and forest-tundra landscapes (Olofsson and Post 2018; Beer et al., 2020). During the late Pleistocene, the mammoth steppe was characterized by highly productive grasslands with high grazing pressure by large herbivores. Olofsson et al. (2004) and Zimov (2005) suggested that grazing and trampling in the Arctic reduces shrub abundance. This could help to shift shrubifying tundra ecosystems towards grass and forb dominated ecosystems similar to the mammoth steppe in terms of productivity and thermal insulation properties. Such a vegetation shift is also suggested to cause an albedo increase and hence lower latent and sensible heat fluxes due to overall reduced energy input (te Beest et al., 2016). In winter, dense populations of large herbivores may also affect the insulation effect of snow on the ground by trampling down or removing the dense snow cover in their search for forage, leading to enhanced refreezing of the ground (Figure 1) (Beer et al., 2020).

FIGURE 1. Graphical representation of the Pleistocene Park hypothesis (Zimov 2005); Left: during winter time (∼60% of the year), a greater number of large animals trample down and/or partly remove the snow cover, facilitating the full refreezing of the active layer; as the active layer refreezes in winter in the graminoid-dominated areas, thawing is reduced compared to non-grazed tundra and forest areas; Right: during summer time (∼30% of the year), a greater number of animals enhances a vegetation shift from shrubby towards graminoid-dominated, increasing vegetation productivity but also ground warming by disturbing the heat insulation layer; since the ground under intensive grazing impact is colder and is fully refrozen at the beginning of summer, overall thaw depth is smaller in these areas by the end of summer.
The Pleistocene Park project, near Chersky in northeastern Siberia, aims to re-establish a megaherbivore-driven system via rewilding of the forest-tundra with greater numbers of modern large and cold-adapted herbivores. These include, among others, musk oxen, Yakutian horses, Kalmyk cattle, bison, and reindeer. With this study focusing on sites in Pleistocene Park, we aim to identify the effects of dense and functionally diverse herbivory pressure on an ice-rich Arctic permafrost landscape. Therefore, we compare belowground carbon and sediment characteristics at five sites in two landscape units with different grazing intensities. We hypothesize that a high large herbivore density and hence intensive grazing and trampling reduces decomposition of preserved OM by reducing ground temperatures. Our work constitutes a pilot study that opens the path for further field-based multi-proxy and multi-disciplinary approaches.
Our study area, Pleistocene Park, is located in northeastern Siberia in the floodplains of the Kolyma River, approximately 100 km inland from the Arctic Ocean (Figure 2) (Fuchs et al. (2021)). The landscape is characterized by thermokarst lakes, drained thermokarst basins with different depths, and uplands of late-Pleistocene ice- and organic-rich permafrost deposits (i.e., Yedoma; (Schirrmeister et al., 2011; Palmtag et al., 2015).
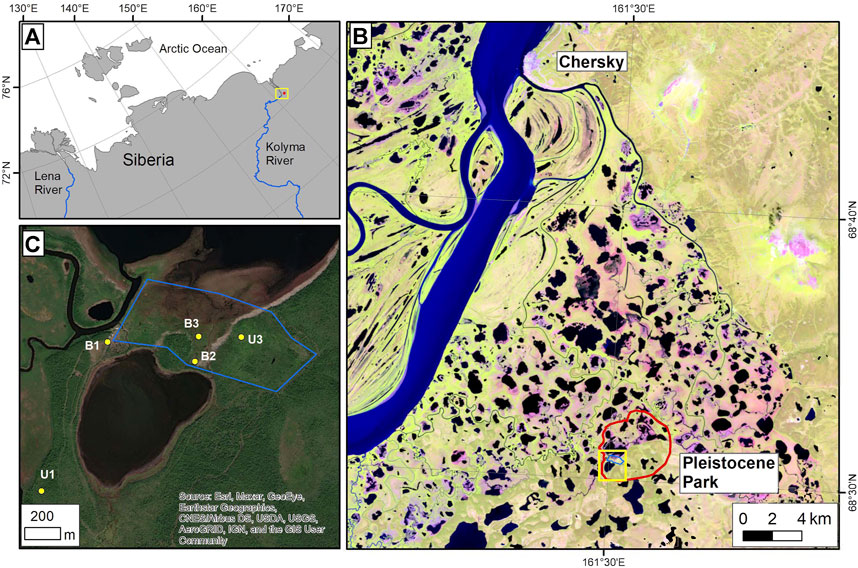
FIGURE 2. Location of the study area in northeastern Siberia marked with a yellow frame (A). In the Landsat-8 satellite image (band combination of shortwave infrared 1 - near infrared - red, 2019-07-04) of panel (B) the red line marks the area of Pleistocene Park south of Chersky; the yellow frame indicates the location of the field study sites shown in (C). Panel (C) shows a high resolution GeoEye satellite image (2018-07-21; ArcGIS Online base map provided by the Environmental Systems Research Institute, ESRI) with Pleistocene Park fences (blue) and sampling sites labeled as B, indicating drained basin sites, and U, indicating Yedoma upland sites; numbers indicate the grazing intensity of each site, from 1 (no grazing) to 3 (intensive grazing).
Climate in this region is characterized by large temperature amplitudes (average of −33°C in January; average of 12°C in July) with a mean annual temperature of -11°C (Göckede et al., 2017). Annual precipitation is 197 mm; March is the driest month (7 mm) and August receives the most precipitation (30 mm). The main seasons for precipitation are summer and autumn (Göckede et al., 2017).
The prevailing deposit types are Yedoma and thermokarst deposits (Veremeeva et al., 2021) with the latter covering approximately 58% of the land area in regions with high Yedoma coverage, and up to 96.4% in regions with low Yedoma deposit occurrence. These deposits are interspersed with marshes, river valleys, and deltas (Veremeeva et al., 2021).
Vegetation within the thermokarst basins generally varies with the local wetness gradient and to some extent with grazing intensity. Carex appendiculata tussocks dominate in shallow water around lake margins. In frequently flooded areas, tall grasses (e.g., Calamagrostis langsdorfii) grow up to 70 cm high, which is a little higher than in surrounding areas (Corradi et al., 2005). Seasonal flooding typically occurs after snow melt during the spring freshet, temporarily refilling the drained thermokarst basins and covering sampling site B3 (Figure 2). Here, graminoids (mainly Poaceae) make up the main vegetation type and show signs of animal grazing (Figure 3, B3). A driftwood belt was present towards the outer basin margins (between B3 and B2 in our study area). The sampling site B2 is located on the elevated reaches of a basin and is characterized by extensively grazed lower-growing graminoid-dominated (Poaceae) vegetation with occasional forbs (Figure 3, B2). Towards the edge of the basin, drier ground is covered with dense trees and shrubs (Larix spp., Salix spp.) up to 2.5 m height, which grow into forests in some places (Figure 2, west of B3 and B2). Sampling site B1 is located on the edge between the basin and the upland and represents a non-grazed surface. It is characterized by grasses (e.g., Beckmannia syzigachne, Hordeum jubatum), forbs (e.g., Saxifraga spp.), Equisetum spp., and low-growing shrubs (e.g., Salix spp.) (Figure 3, B1). This site was covered in Larix forest until deforestation in 2015. A mix of dwarf and taller shrubs (e.g., Salix spp.), forbs, and grasses is found on the Yedoma uplands, where sites U3 and U1 are located (Figure 3, U3). Shrubs reach a height of up to 2.5 m. The lower vegetation features diverse forbs, grasses, and Equisetum spp. reaching 10–20 cm in height.
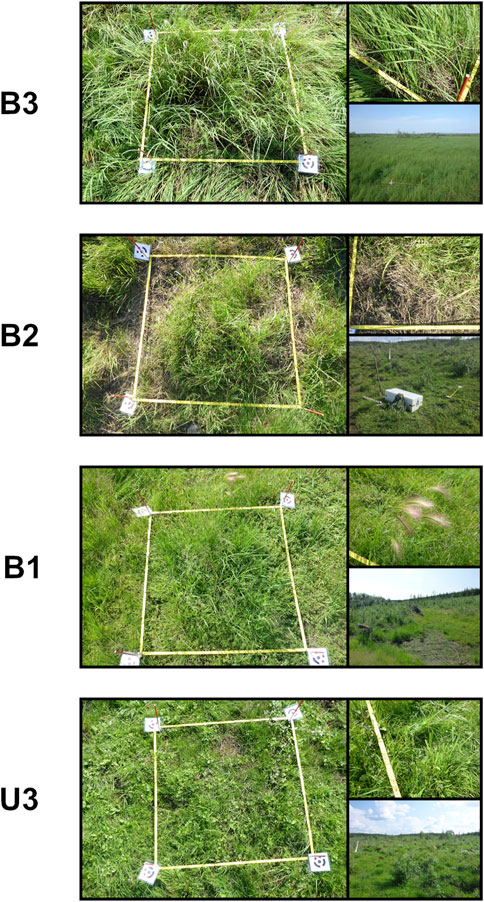
FIGURE 3. Vegetation photos of the study sites sampled in July 2019; each site comprises a 1 by 1 m plot photo (left), a vegetation detail photo (top right) and a landscape photo (bottom right).
The Pleistocene Park project was started in 1996 as a large-scale and long-term ecosystem change experiment (Zimov 2020). For this experiment, a large number of Yakutian horses, Kalmykian cattle, reindeer, bison, and musk oxen as well as moose, sheep, yaks, and European bison—all large and cold-adapted herbivores—were gradually introduced into a 40-ha fenced area, which stretches across tundra and forest-tundra vegetation over a landscape characterized by Yedoma uplands and partially drained thermokarst basins. Today, this 40-ha area is the heartland of a 160 km2 fenced park that constitutes a unique experimental site for examining rewilding impacts on Arctic ecosystems (Macias-Fauria et al., 2020). The presence of these animals—and some man-made interventions such as removal of trees to build fences on the periphery of the park—has already transformed most of the previous tundra vegetation into grassland, while forest areas are developing towards more open vegetation. However, responses in soil property changes from surface effects, especially below the active layer, are slow, so these deep deposits are most likely not yet influenced by animal activity after a 23-year time period. Long-term studies on GHG emissions have been conducted in nearby areas of Pleistocene Park. For instance, Göckede et al. (2017); Göckede et al. (2019) investigated the carbon and energy budgets of tundra wetlands and regime shifts related to drainage disturbance on a nearby floodplain of the Kolyma River. They found that an undisturbed wetland, similar to the non-grazed wetlands in the Pleistocene Park area, acted as a moderate annual sink for CO2, and as a moderate source for CH4. Both carbon and energy cycles were shown to be highly sensitive to shifts in hydrology. Our sites and therefore results are very similar to their study sites as vegetation, sediment, and climate are the same, based on the close distance of the locations. A recent study by Fischer et al. (2022) found similar results as close as 10 m from our B3 site.
The sampling sites were chosen based on their grazing intensity, which was identified by long-term monitoring of animal preferences for grazing sites and additional observations over several days at the start of the field campaign in July 2019. We applied a space-for-time approach to compare apparently similar sites selected within the same landscape units that ideally only differed by grazing intensity, instead of long-term monitoring of non-grazed sites along with gradual herbivore introduction. For this pilot study with limited field time, we decided to prioritize the number of herbivore treatments and landscape positions investigated over the number of replicates within a given treatment and site in order to allow a preliminary analysis of a larger range of site conditions. We implemented a nomenclature scheme for our study sites that provides information on the landscape type (B for thermokarst basin or U for Yedoma upland) and the grazing intensity (3: intensive grazing; 2: occasional grazing; 1: no grazing). Five sites were selected to cover these different site characteristics. We sampled one soil core per site during our field campaign (Figure 2): B3 was an intensively grazed site in a wet area of a thermokarst basin; B2 was an extensively grazed site within the thermokarst basin, close to the fence of Pleistocene Park; B1 was a non-grazed site within the thermokarst basin, just outside the park’s fence; U3 was an intensively grazed site on a Yedoma upland; and U1 was a non-grazed site on a Yedoma upland. “Intensive grazing” and “occasional grazing” are relative terms in this context, with “intensive” referring to a daily presence of feeding animals over several hours throughout each day and “occasional” describing an occasional animal presence with feeding occurring along animal tracks. Location details are provided in Table 1.
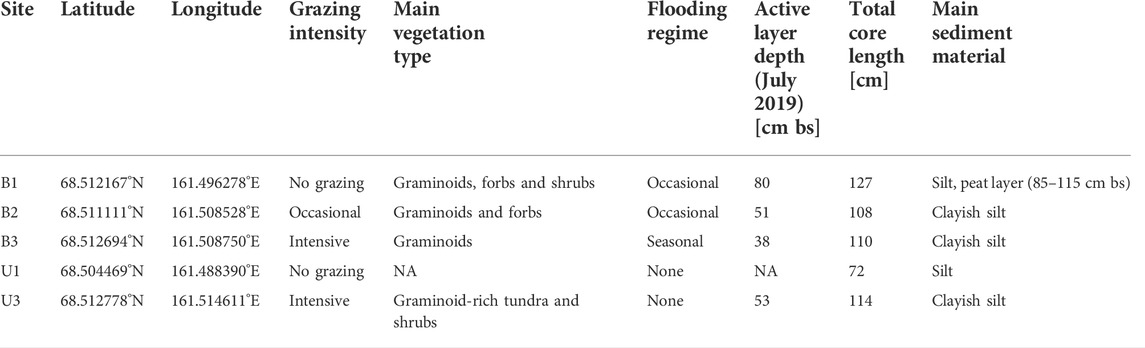
TABLE 1. Sampling site locations and characteristics.
In this setup, the area outside the fence was defined as an exclosure with no access for the park’s animals. We chose our sampling sites so that the three B sites were located in the same drained thermokarst basin, and the two U sites were located on the same Yedoma upland complex. The goal was to choose sites with similar properties so the animal influence was the main variable and differences between all other characteristics were minimized. Unfortunately, site B1 was experimentally deforested in 2015, prior to our study, which resulted in an unavoidable environmental difference that may have impacted soil composition at this site. The main impact is most likely soil compaction of the active layer due to the use of heavy machines. Also, flooding regime (seasonal or occasional) is different between our sites and might have some effect on the soils. Since animal trampling as well as defecation and browsing always occur where animals graze, in the following we will use the term “grazing” to indicate all animal activity including trampling, defecation, and foraging. Each site is exposed to the same grazing pressure year-round, as there are no separate summer and winter ranges, enabling us to study the net effect of the animals’ winter and summer impacts.
Firstly, we prepared a visual description of the surroundings at each sampling site, including the main vegetation type. We identified and sampled the most abundant vegetation species and estimated their coverage based on one by 1 m plots (Figure 3).
Secondly, we removed the active layer using a spade, until we hit permafrost. We measured the thaw depth and sampled the soil profile by using fixed-volume steel cylinders with a volume of 250 cm³. Due to very wet ground conditions, we were not able to collect cylinder samples at the intensively grazed site B3, where the ground was saturated from the surface to the frozen ground (38 cm). Instead, we cut blocks 8–10 cm high (see also Windirsch et al. (2021) for exact sample dimensions) out of the soil profile using a knife. The organic top layer was sampled separately at all sites.
Thirdly, we used a Snow Ice and Permafrost Research Establishment (SIPRE) permafrost auger with an inner diameter of 7.6 cm in order to sample both the still-frozen parts of the active layer and the underlying permafrost. We reached maximum sampling depths of 110 cm below surface (bs) at B3, 108 cm bs at B2, 127 cm bs at B1, and 114 cm bs at U3 (Supplementary Figures S2, S3). After drilling, soil samples and cores were individually wrapped in sterile plastic bags. All samples were brought in a frozen state to our laboratories for further analysis.
Due to high and dense shrub vegetation and therefore inaccessibility, we were not able to sample the U1 location during our summer field campaign. The Yedoma upland site outside the fence of Pleistocene Park was therefore sampled in the following winter with the SIPRE auger to a depth of 72 cm bs and was completely frozen at the time of extraction.
In the laboratory the frozen cores were cut into approximately 5 cm samples according to stratigraphy using a band saw. Afterwards, all samples were freeze-dried (Zirbus Sublimator 15) and weighed pre- and post-drying for ice and water content determination (Mettler Toledo KERN FCB 8K0.1, accuracy ±0.1 g). The dry samples were split into subsamples for biogeochemical and sedimentological analysis. In the following, the mean sample depth will be used to describe the position of each sample within the soil column.
The subsamples for biogeochemical analysis were homogenized using a planetary mill (Fritsch Pulverisette 5) and weighed into tin capsules and steel crucibles for measurement. We determined total carbon (TC), total nitrogen (TN), and total organic carbon (TOC) by combustion analysis using a vario EL III and a soliTOC cube (both Elemantar Analysensysteme). Afterwards, the carbon-nitrogen ratio (TOC/TN) was calculated from TOC and TN, giving information about the state of degradation and the source of the OM. TOC/TN ratios could not be calculated for samples with TN or TOC below the detection limit of 0.1 wt%.
OM for radiocarbon dating was taken from the dried original samples. For dating, the Mini Carbon Dating System (MICADAS) at the Alfred Wegener Institute Bremerhaven was used. We calculated the results in calibrated years before present (cal yr BP) using the calibration software Calib 8.2 and applying the IntCal20 calibration curve (Reimer et al., 2020; Stuiver et al., 2021).
We analyzed the ratio of stable carbon isotopes and used it as a proxy for the degree of decomposition of the OM following Diochon and Kellman (2008). Soil δ13C values differ between material sources and can distinguish between vegetation communities (Malone et al., 2018). Samples for δ13C analysis were homogenized using a planetary mill, and subsequently treated with hydrochloric acid at 50°C to remove carbonates. Measurements were done using a Delta V Advantage Isotope Ratio mass spectrometer (MS) supplement equipped with a Flash 2000 Organic Elemental Analyzer. Results are given in ‰ compared to the Vienna Pee Dee Belemnite (VPDB) standard (Coplen et al., 2006).
Finally, we determined grain size distribution within samples to check sediment substrate similarity. Therefore, OM was removed from the samples using hydrogen peroxide. Grain size distributions were subsequently measured using a MasterSizer 3000 (Malvern Panalytical).
We determined the annual average number of freezing days (daily mean air temperature below 0°C) over a period of 9 years. For this we used data from 2009 to 2017 measured at the Chersky meteorological station (station RSM00025123). Data were obtained from the National Oceanic and Atmospheric Administration’s National Climatic Data Center (NOAA NCDC) database.
In order to check for differences between intensively grazed and non-grazed sites, we combined our TOC data for intensive (B3 and U3) and non-grazed (B1 and U1) sites. We did this for the minimum active layer depth (38 cm at B3) to ensure similar conditions for all sites used. This left us with n = 11 samples for intensively grazed, n = 5 samples for occasionally grazed, and n = 10 samples for non-grazed sites. Since grazing intensities were artificially altered during the last few decades, we expect the most pronounced differences in the seasonally thawed layer, which corresponds to more recent periods. We visualized the distribution of TOC contents in the active layer in boxplots for intensive, occasional, and non-grazed sites of our study to explore possible differences in TOC content in relation to grazing intensity.
To identify correlations between TOC content, water or ice content, and sediment type (via mean grain size), we used principal component analysis (PCA). Data were initially normalized to values between 0 and 1. The PCA was conducted in the R environment using the “stats” package (RCoreTeam 2021).
At site B3 we found Calamagrostis langsdorfii as the only species in our one by 1 m plot with a coverage of more than 95%. No other species was found underneath. C. langsdorfii reached a height of approximately 30 cm. At B2 Poaceae were dominant but could not be identified on a species level due to a lack of blossoms as well as herbivory damages (Figure 3). Therefore, height could also not be recorded accurately. Poaceae covered approximately 70% of our plot with small amounts of Salix ssp. in between (less than 10% coverage). Close to our plot, Salix ssp. and Larix ssp. shrubs were present with a height of up to 2.5 m. Contrary to the grazed sites, the predominant species at B1 was Beckmannia syzigachne with an approximate coverage of 65% and an approximate height of 25 cm (Figure 3). Underneath, low extents of Saxifraga ssp., Equisetum ssp. and low-growing Salix ssp. were found. After deforestation in 2015, no Larix ssp. were present. U3 featured a much lower-growing vegetation (up to 15 cm height), holding approximately 50% of unidentified graminoids which could not be identified due to herbivory damages (Figure 3). In between we found Rubus ssp. (15–20%), Saxifraga ssp. (less than 5%), Salix ssp. (less than 5%), and some individuals of Vaccinium ssp. and Arnica ssp., which all lacked flowers and could therefore not be identified on species level. Towards the less intensively grazed upland areas, Salix ssp. shrubs up to 2.5 m in height grew with increasing density.
We found that the seasonal thaw depth (July 2019) decreased with grazing intensity, giving a thaw depth of 38 cm below surface (bs) in B3, 59 cm bs in B2, and 85 cm bs in B1 with a semi-frozen zone between 80 and 85 cm bs. In U3, we measured a thaw depth of 53 cm bs. Since U1 was sampled in winter, we were not able to measure thaw depth at this site.
At B3, TOC generally decreased from top to bottom with the highest value of 25.66 wt% at 20.25 cm bs and the lowest value of 1.18 wt% at 92.5 cm bs (Figure 4). In contrast to this, TOC values for B2 peaked around the frozen-unfrozen interface with values between 4.89 wt% (21.25 cm bs) and 30.10 wt% (64 cm bs); the frozen part contained generally more TOC. The highest TOC values among all sites were found in a peat layer at B1 in the frozen core part, with a peak value of 52.80 wt% (92.5 cm bs). The unfrozen core part contained much less OC with values between 0.79 wt% (35.25 cm bs) and 9.65 wt% (3.75 cm bs).
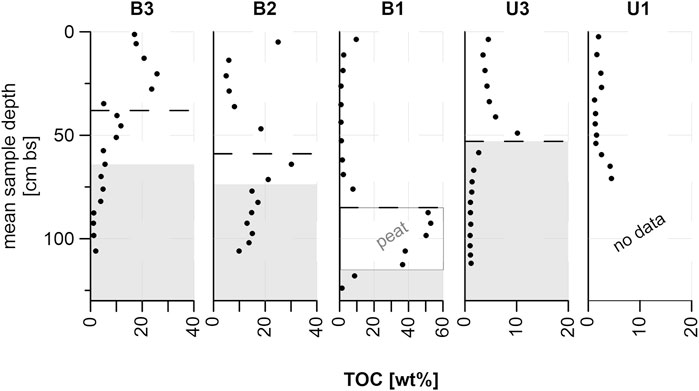
FIGURE 4. Total organic carbon (TOC) values of all study sites; dashed lines mark the seasonal thaw depth measured in July 2019; gray areas are assumed to be permafrost based on cryostratigraphic characteristics; please note the different scales on the x-axes.
At the U3 upland site, TOC was higher in the unfrozen core part with values between 3.52 wt% (11.25 cm bs) and 10.73 wt% (49 cm bs). In the frozen core part below, TOC values were rather homogeneous, varying between 1.01 wt% (103.5 cm bs) and 2.65 wt% (58.5 cm bs). In contrast to the previous sites, TOC at U1 was homogeneous throughout the core at values between 1.24 wt% (33 cm bs) and 2.54 wt% (27 cm bs) with a slight increase at the bottom to 4.50 wt% (71 cm bs).
While TOC/TN ratios for B3 (range 12.68–25.96) and B2 (range 14.83–18.48) were similar (Figure 5), values for B1 were higher, in the range of 16.94–24.90. In the upland sites, there was a strong contrast between U3 (11.40–29.19, mean of 17.75) and U1 (28.63 and 29.27) in TOC/TN ratios.
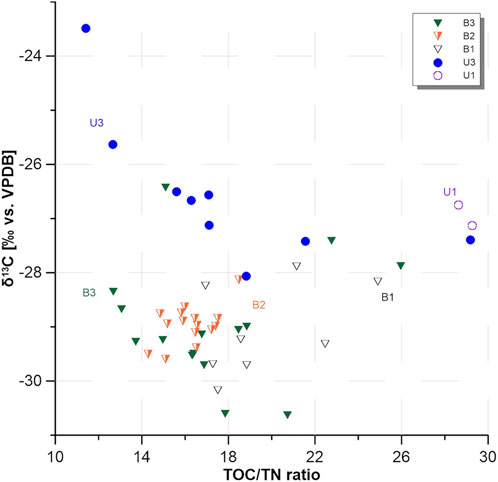
FIGURE 5. Total organic carbon to total nitrogen (TOC/TN) ratios plotted against the stable carbon isotope (δ13C) ratios of all sampling sites.
δ13C values were also similar between the basin sites (B3: −30.63‰ vs. VPDB (uppermost sample) to −26.43‰; B2: −29.60‰ to −28.13‰; B1: −30.17‰ to −27.89‰) (Figure 4). Upland sites showed higher δ13C values in the range of −28.06‰ to −23.49‰. For full δ13C values, please see Supplementary Figure S4 or the published data set (Windirsch et al., 2021).
Radiocarbon dates were measured from samples at greater depth than the expected grazing influence. These data are provided in the Supplementary Table S1.
The soil cores were silty overall and had relatively homogeneous grain size distribution (Figure 6) across sites (Supplementary Figures S2, S3). In B3, clay content decreased slowly with depth from 16.69 vol% at 76 cm bs to 7.50 vol% at 106 cm bs, while at the same time sand content increased from 3.46 vol% to 10.68 vol%. Clay content varied throughout B2 with a minimum of 14.16 vol% at 28.75 cm bs and a localized maximum of 22.17 vol% at 13.75 cm bs (Figure 6). Sand content decreased with depth, starting at 12.73 vol% (5 cm bs) and reaching 2.43 vol% at the bottom (106 cm bs). In B1, clay content showed a peak value of 21.96 vol% at 76 cm bs, followed by a peat layer down to 106 cm bs with no grain size data available. Mean clay content for this core was 10.84 vol%. Sand content varied between 5.37 vol% (35.25 cm bs) and 11.31 vol% (43.75 cm bs) with two low values, 2.54 vol% at 52.75 cm bs and 2.22 vol% at 124 cm bs.
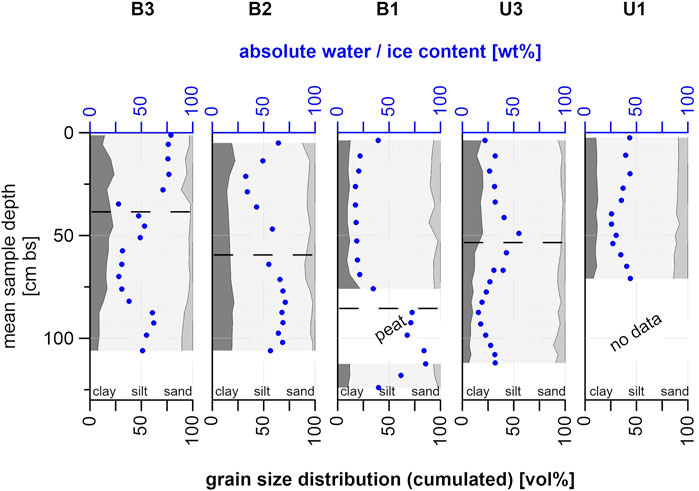
FIGURE 6. Grain size distribution for all sampling sites plotted against depth; absolute water and/or ice content added in blue; dashed lines mark the seasonal thaw depth measured in July 2019.
U3 showed similar characteristics as B3 with clay content decreasing with depth (highest value 19.76 vol% at 49 cm bs, lowest value 6.34 vol% at 112 cm bs), while simultaneously the sand content increased to a peak value of 11.52 vol% at 103.5 cm bs (Figure 6). Grain size composition for U1 showed no peaks, with clay contents between 8.03 vol% (71 cm bs) and 12.60 vol% (33 cm bs) and sand contents between 8.20 vol% (44.5 cm bs) and 14.01 vol% (71 cm bs).
The absolute water and/or ice content showed generally drier conditions in the frozen core of B3, with values fluctuating between 27.67 wt% (34.75 cm bs) and 78.59 wt% (1.25 cm bs). Similar characteristics were present in B2 (34.26 wt% at 28.75 cm bs to 71.10 wt% at 82.5 cm bs). In contrast, B1 showed large differences between the unfrozen upper part (17.19 wt% at 35.25 cm bs, 39.36 wt% at 3.75 cm bs) and the frozen lower part (39.59 wt% at 124 cm bs, 85.74 wt% at 112.5 cm bs).
U3 showed similar water content values at the top (32.00 wt% at 11.25 cm bs) and bottom (31.93 wt% at 112 cm bs) with higher values around the freezing interface (55.01 wt% at 49 cm bs) and lower values above and below that (22.11 wt% at 3.75 cm bs and 15.59 wt% at 87.5 cm bs). Water content in U1 was more stable, ranging between 25.63 wt% (39.5 cm bs) and 43.88 wt% (71 cm bs) with a similar value at the top (43.24 wt% at 2.5 cm bs).
The stable isotope characteristics of the pore water are shown in Supplementary Figure S5.
The PCA revealed a positive correlation between water/ice content and TOC content (Figure 7). While B3, B2, U3, and U1 tended to form clusters, B1 values were spread across parameters. For full PCA scores, see Supplementary Table S2 as well as Supplementary Figure S1.
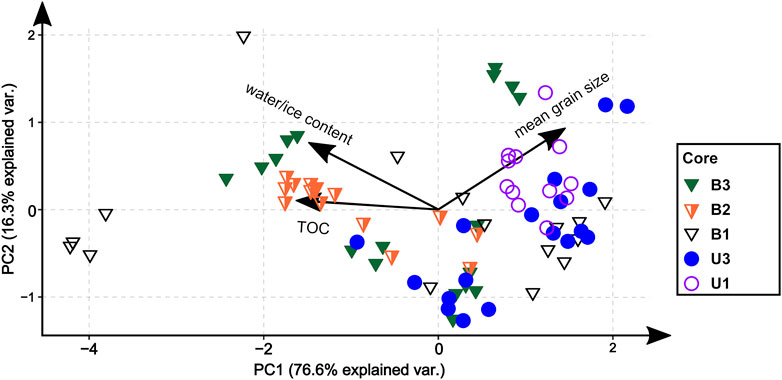
FIGURE 7. Results of the principal component analysis (PCA) for variables total organic carbon (TOC), water/ice content, and mean grain size.
In Figure 8 we visualized the range of the TOC values in the minimum active layer (depth 38 cm), grouped by grazing intensity (Figure 8). TOC is clearly higher under intensive grazing compared to non-grazed sites, with no overlap except for outliers. Due to potential dependency of TOC values within the unfrozen part of a core, and due to the small sample sizes, we did not test for statistical significance.
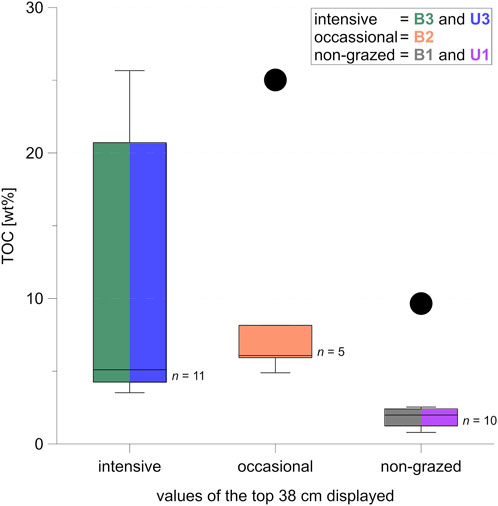
FIGURE 8. Boxplots for total organic carbon (TOC) data of all samples from the uppermost 38 cm of all intensive, occasional, and non-grazed sampling sites; sites B3 and U3 are combined into the “intensive” boxplot, B2 is shown in the “occasional” boxplot, and B1 and U1 are combined into the “non-grazed” boxplot; the median is shown by the horizontal line within each box; box margins show the upper and lower quartile; whiskers mark minimum and maximum values; outliers (indicated by dots) are more than 1.5 box lengths away from box margins; colors indicate which sites are represented in which box.
For our studied cores we found that intensively grazed sites (B3, U3) were covered by generally shorter and sparser vegetation (Figure 3, B3: grassland; Figure 3, U3: shrubby grassland tundra), with taller grazing-resistant individuals in between, compared to occasionally or non-grazed sites (Figure 3, B2: grasses and herbs, and B1: grasses, herbs and low shrubs). This could likely be a result of the reduction in shrub expansion through large herbivore action (Suominen and Olofsson 2000), while the differences in the flooding regime between the sites promoting different vegetation types might also have an impact on this. The grazed sites located in the thermokarst basin (B3 and B2) were still flooded seasonally. The upland sites were generally better drained than the sites within the basin. We aimed to select representative sampling locations, based on overall vegetation and observed animal routes. However, we had limited information on representativeness in terms of soil type and wetness across this landscape. Still, we ensured that our study sites are comparable in terms of soil properties by measuring grain size composition of the soil material (Figure 6). This revealed similar characteristics across sites with slight variations in clay and sand content, and silt contents ranging between 68 and 87 vol%, which shows that our sites are comparable in terms of physical soil properties.
Our results showed that the changes in vegetation height and structure correlated with large herbivore activity. This is in agreement with former studies in similar Arctic settings (Sundqvist et al., 2019; Skarin et al., 2020; Verma et al., 2020). However, the effects of seasonal flooding on vegetation composition and structure (sites B3 and B2) cannot be neglected. These differences in flooding regime marked a disparity between our sampling sites, since flooding at the basin sites B3 and B2 occurred seasonally or infrequently, while there are no records of any flooding for the other sites.
In our study area, shrubs were established on the upland before the introduction of large numbers of animals, and are now retreating, probably due to grazing pressure. While there are now higher shrubs at U3, there is a gradient in density of Salix ssp. shrubs towards less intensively grazed areas from individual shrubs to dense, forest-like coverage. At the edges of the drained thermokarst basin, shrubification took place on spots that could only be grazed occasionally (Olofsson et al., 2009) after the water level had retreated; the water retreated as the lake drained, allowing for incremental vegetation establishment. This leaves us with high soil wetness as another explanation for the absence of shrub vegetation (Martin et al., 2017). The clearing of the larch forest at the non-grazed site B1 4 years prior to our study is also a plausible explanation for the limited shrub extent there.
The restricted grazing space within the fenced Pleistocene Park area led to a higher revisitation rate of animals to sites within the fence. This artificially increased grazing pressure led to the different vegetation structures observed inside and outside of the fence. Such shorter graminoid vegetation types are linked to grazing intensity (Forbes 2006). Monteath et al. (2021) found that the extinction of the Pleistocene megafauna was not responsible for causing an increase in shrubification, but rather that shrubification as a consequence of climate change during the early Holocene could have led to the extinction of megafauna as a result of habitat loss. However, modern rewilding approaches are planned and realized with recent herbivores capable of living in today’s climate, though species composition might have to be adjusted continuously with warming conditions. Also, the cause and consequence in this setup are still unclear, with opposite findings across studies, depending on the methods applied (Murchie et al., 2021). Numerous studies have found that contemporary herbivores were indeed capable of reducing shrub extent in Arctic environments on a local scale (Olofsson et al., 2009; Köster et al., 2015; Ylänne et al., 2018; Verma et al., 2020; Mekonnen et al., 2021). We found shallow thaw depths at intensively grazed sites and a much thicker active layer at the non-grazed B1 site. Generally, the increase in active layer thickness is associated with warming of the ground, influenced by summer temperatures, flooding, insulation from snow, and vegetation density and composition (Walker et al., 2003; Skarin et al., 2020; Magnússon et al., 2022). Therefore, as was stated by Zimov et al. (2012), the direct influence on these insulating factors could affect the active layer dynamics due to a stronger cooling of the ground in winter (Figure 1). However, to determine any clear trends, repeated annual measurements of the thaw depth are needed.
Data from our basin sites showed that the more intensively grazed area featured smaller seasonal thaw depths in July 2019, compared to the occasionally or non-grazed sites (Figures 4, 9A). Keeping in mind the seasonal flooding at B3 and B2, one would expect greater thaw depths at these sites, since higher soil moisture promotes heat flow, and the relatively warm flood water adds heat to the soil as well (Magnússon et al., 2022). Examining the assumed permafrost table depth based on cryostratigraphic characteristics in the cores, we observed a contrary effect with an active layer depth of 61 cm bs under intensive grazing at B3, 74 cm bs under occasional grazing at B2, and 115 cm bs for the non-grazed B1 site. This supports our original hypothesis of grazing impacts being the main driver behind thaw depth differences, likely via vegetation changes.
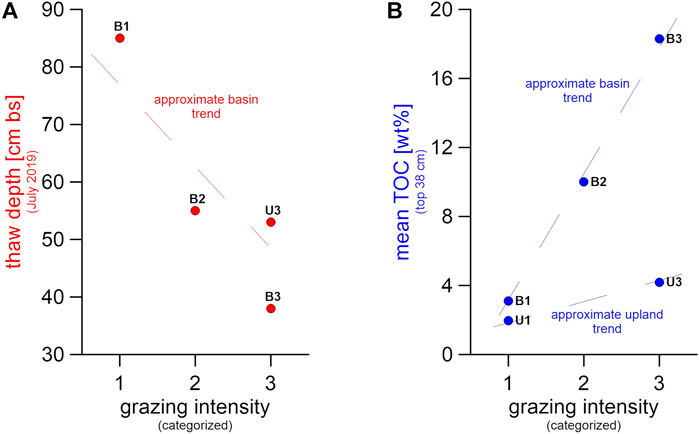
FIGURE 9. Visualization of (A) thaw depth and (B) mean total organic carbon (TOC) of the uppermost 38 cm for all sampling sites, plotted versus grazing intensities 1 (no grazing) to 3 (intensive grazing); as site U1 was only sampled in winter, we do not have a summer thaw depth measurement for this site.
At B3, the graminoid vegetation lay flat beneath the snow cover, offering little or no insulation. The snow itself was compacted by animal trampling, which further reduced the insulation properties of the snow cover. On the other hand, the forb undergrowth of the grassland at B2 provided slightly more resistance against the weight of the snow cover. Combined with less intensive trampling and, thus, a less compacted snow cover, the B2 sampling site was characterized by better winter insulation properties compared to B3. The Salix shrubs at B1 promoted localized snow trapping and a loose snowpack, both of which have been shown to provide effective insulation against cold winter air temperatures (Myers-Smith et al., 2011). Trampling was also missing in this non-grazed area. In addition to those surface conditions, the composition of the sediment itself could have contributed to a deeper active layer at site B1. From the grain size distribution data (Figure 6) we saw that material among all studied sites was quite homogeneous (Table 1). Exceptions were the sampling sites B1 and U1, which had a lower proportion of clay and were therefore generally dominated by coarser-grained material. High ice contents in the frozen part of the B1 core support the idea of an insulating effect of the peat layer that prevented the ground from thawing any deeper, but also helped to maintain the thick active layer found here. This assumption implies that the peat layer worked as a heat flux barrier for the permafrost below, stopping summer thaw from the top, but also preventing bottom-up refreezing in winter. This could lead to present or future talik formation above the peat layer.
We were not able to compare thaw depths for the upland sites: the cryostratigraphically determined permafrost table depth of approximately 50 cm bs at U3 was, however, smaller than the active layer depths measured by Abramov et al. (2019) and Shmelev et al. (2021) for the close-by Mt. Rodinka site, located on a Yedoma upland with a mean active layer depth of 80 cm. Also evident in this study (Abramov et al., 2019) were smaller thaw depths, around 40 cm, for thermokarst basin sites featuring shorter vegetation in the Kolyma region, which is similar to our B3 site.
In our study, the reduced active layer thickness observed at the intensively grazed sites could also have originated from active layer compression by animal trampling, which would mean that even with shallower thaw depth the same amount of soil thawed. However, this last point cannot be tested with our data, since we were not able to measure bulk densities due to wet ground conditions and root structures. While such ground compaction is very common in peatlands (Batey 2009), the sandy silt soils that we found are only moderately compressible (Akayuli et al., 2013; Halcomb and Sjostedt 2019), especially as they were frozen throughout a major time of the year, making soil compaction a weak argument for the shallow active layer at intensively grazed sites. The regular flooding of the intensively grazed basin site, which usually leads to an increase in thaw depth (Magnússon et al., 2022), combined with the in fact shallower active layer found in our study when comparing to the non-grazed B1 site, suggests that the cooling effects induced by animal activity could be much larger than previously expected.
We identified several variables that may be responsible for explaining differences in TOC between sites, including herbivory. Besides shorter graminoid vegetation types, other effects were also aligned with cooler temperature and/or less carbon degradation, such as soil moisture, as visualized by our PCA (Figure 7). This coexisting influence of grazing and soil moisture should be tested in other locations. However, the contrast in TOC/TN ratios and δ13C ratios (Figure 5) of the studied deposits between intensive and non-grazed locations suggested that animal presence is affecting OM decomposition (if we assume a comparable OM source). But based on the differences in vegetation cover, we found that this contrast might also originate from different OM input as well as from different nitrogen input via the presence or absence of animal droppings. Since grazing alters the vegetation cover—assuming that in the absence of large herbivores the vegetation would be more homogeneous throughout the study area—the observed strong differences in TOC/TN and δ13C ratios have likely resulted from the differences in animal impact on the landscape. Grazing is, therefore, a reasonable explanation for the strong differences between sites, including TOC content.
Mean TOC was six times higher in the top 38 cm of B3 (minimum active layer depth) compared to B1, with intermediate values in B2 (Figures 4, 8). For the upland sites, mean TOC was twice as high under intensive grazing in those core sections lying within minimum active layer depth (38 cm, B3) compared to non-grazed cores. The effect was not visible in lower core parts, perhaps because of the relatively short time span of 23 years since intensified animal introduction into the area (Figure 4). Instead, the TOC pattern in the frozen core parts was opposite to the higher TOC found in the active layer under intensive grazing influence. This suggests different pre-existing site conditions prior to herbivore introduction. The contrasting TOC pattern in the active layer suggests that animal grazing can help increase carbon storage in a relatively short time span (Figure 9B) but grazing needs more time to affect deeper permafrost carbon storage apart from thermal stability, hence reduced thaw depth. Therefore, the TOC differences between sites were not significant when comparing the entire depth of the sampled cores. We explain this as a result of i) the TOC-rich peat layer found in B1 that shifts the TOC median value for non-grazed sites upwards, combined with ii) low TOC values in the frozen part of the intensively grazed sites which offset the high active layer TOC. Since the peat layer was found at 85 cm bs and dated to 4,327 cal yr BP, we expect no connection to herbivory influence in a 23-year timespan, which is why we tested for significance in the active layer.
The significant differences in upper soil TOC between sites of intensive large herbivore presence (B3 and U3) and non-grazed sites (B1 and U1) agreed with the expected effects of grazing (Figure 9B).
All organic carbon found in the upland areas showed higher δ13C values (Figure 5), which we interpreted as a result of colder, drier, and more compact ground conditions in the Yedoma deposits and therefore less OM decomposition, as well as differences in plant species, resulting in different δ13C signals compared to the seasonally flooded and less compact ground of the drained thermokarst basin. Higher TOC/TN ratios in non-grazed sites indicated a different source material, originating from shrubby tundra, in comparison to grassland vegetation in occasionally and intensively grazed sites. However, these vegetation differences might originate from animal grazing impacts.
Above-ground carbon storage is also an important aspect of ecosystem carbon storage. Although we were unable to address above-ground carbon storage in this study, grazing activities of large herbivores have likely had an impact on above-ground biomass storage in vegetation by providing nitrogen fertilization via droppings. Mekonnen et al. (2021) stated that under intensified shrubification, shrubs take up large amounts of nutrients from the soil into the vegetation biomass. It is possible that CO2 emissions from the soil might also be partially captured by this boosted plant growth and incorporated into plant biomass. However, nutrient availability is much more important for plant growth and hence carbon accumulation. Such nutrients become available when OM is decomposed, but the increased carbon accumulation by plant growth can to some extent offset the carbon losses associated with permafrost-stored OM decomposition (Keuper et al., 2012; Turetsky et al., 2020). While shrub growth increases above-ground biomass, it generally leads to net ecosystem carbon losses via heterotrophic respiration (Phillips and Wurzburger 2019). The formation of grasslands, on the other hand, increases above-ground carbon cycling as well, showing high productivity (Gao et al., 2016). While showing the highest respiration rates, soil carbon accumulation in wet Arctic grasslands is greatest when compared to other Arctic vegetation types (Bradley-Cook and Virginia 2018). This might be linked to the relative ease of grassland litter transfer into the soil, e.g. via animal trampling, as well as deeper root penetration of graminoids, compared to shrubby and sturdier vegetation (Wang et al., 2016). Based on this, we expect an increase in above-ground short-term carbon fixation in the more productive graminoid vegetation at intensively-grazed sites compared to non-grazed tundra sites, but cannot make any quantitative statements on this for our sites due to a lack of data regarding this matter.
We summarize two points from our carbon data:
(1) In the upper part of the soil cores, TOC contents were higher in more intensively grazed sites, with a decrease with less grazing for both thermokarst-affected and Yedoma sites (Figure 9B). As the soil and sediment characteristics of the non-grazed U1 Yedoma site matched findings from other Yedoma studies (Strauss et al., 2012; Jongejans et al., 2018; Windirsch et al., 2020), we consider this as the pre-grazing Holocene state (i.e., not heavily grazed state). This suggests that intensive grazing for 23 years has already increased TOC amounts stored in the active layer by a factor of two (Figure 4). At thermokarst sites, hydrology has an impact on TOC storage as well, which is seen in the strong correlation between TOC content and water content in the PCA (Figure 7). However, a direct comparison to a pre-grazing state for our sites is not possible.
(2) Intensively grazed areas displayed a shallower thaw depth (Figure 9A). This was in line with the hypothesis that connected ground cooling effects with snow removal or snow compaction. These changes in snow properties can result from vegetation shifts towards graminoid communities, which trap less snow, as well as snow compaction by animal trampling. Also, here an active layer depth reduction could have happened in a rather short period of time. While TOC was significantly higher in the active layer in intensively grazed sites, the shallower thaw depths associated with these intensively grazed sites might contribute to stabilizing the underlying permafrost, hence preventing fossil permafrost-stored OM from degradation. However, our study cannot rule out influencing factors other than grazing adding to the trends illustrated in Figure 9.
Even if we cannot quantify the landscape and its carbon storage with no artificially introduced herbivores, we can make some assumptions based on other studies’ findings. These assumptions are hypothetical for our study area, but based on previously published studies. In a partially drained thermokarst basin within a Yedoma landscape, relatively warm soil conditions and hence a deep active layer would most likely be found in the drained basin (Windirsch et al., 2020). Normally, the active layer would first become shallower after lake drainage, with less water content leading to reduced heat flux into the soil and making room for cold winter air, and stabilize once tundra vegetation, shrubs, or even small trees re-establish, working as ground insulators in summer (Blok et al., 2010) in the absence of grazing. Over time, peat formation is likely to take place if wetness is still high, increasing carbon concentration and insulation effects on the underlying ground (Jones et al., 2012). In regularly flooded thermokarst basin areas, a graminoid vegetation holding vast extents of Eriophorum spp. will likely develop, while dry basin areas will normally feature Salix spp. shrubs (Regmi et al., 2012). On the surrounding uplands we expect a generally homogeneous appearance of soil carbon and vegetation, where differences are controlled by local parameters. These controls include differences in cryostratigraphy, substrate, and water availability, among others. On uplands we expect to find tundra vegetation, most likely with increasing shrubification throughout the last decades. Moreover we expect forested areas on those uplands with differing thaw depth between vegetation types and a thick but stable active layer beneath forests (Stuenzi et al., 2021). A deepening active layer is likely to occur underneath tundra as a result of global climate warming, which also increases shrubification (Wilcox et al., 2019) and therefore snow trapping. While shrubification may shield the ground from further summer thawing, the contrasting seasonal lengths of summer and winter may come into effect, reducing summer thaw but preventing winter refreezing at the same time. These literature-based qualitative scenarios suggest that the grazing impacts observed in our study, especially as regards alterations in vegetation and thaw depth, might represent a major system change; this may also be true for the increase in carbon storage at the intensively grazed U3 upland site. Hence, larger scale grazing could potentially help to keep carbon in the ground and reduce natural carbon emissions from permafrost, although in no case would this be a substitute for decarbonizing the current industrialized society. Due to technical constraints, the efficacy of this landscape management tool should not be overestimated.
Due to the spatial and temporal limitations in the data we collected, we cannot unambiguously distinguish between previous conditions at our sites, and the overall herbivory impact on soil TOC. Soil carbon distribution as well as local environmental differences influencing thaw depth might have existed before herbivore introduction; this cannot be accounted for in our study. However, the presence of rather fresh material present in the seasonal thaw layer at sites B3 and U3 (Supplementary Table S1) suggested a link to modern disturbances (Supplementary Table S1), for which animal trampling, bioturbation, or cryoturbation all provide a valid explanation.
Despite results being consistent with the expected effects of grazing on ground temperature proposed by Zimov et al. (2012), the missing core replication of the present study combined with the expected spatial heterogeneity of active layer depths indicated that this interpretation needs further data for validation. Further, more replicated studies, potentially combined with spatially comprehensive modeling exercises, are advised along with monitoring of exclosure sites with gradual herbivore introduction. Also a 23-year time period of herbivore activity is likely too short to affect deeper and permanently frozen deposits but mainly affects the active layer both in terms of chemical properties and thaw depth.
The larch forest clear cut at B1 marked a clear difference between our sampling sites, as stable boreal forest is known to protect permafrost against summer heat (Stuenzi et al., 2021), maintaining a deep but stable active layer. However, we still encountered the greatest seasonal thaw depth here. This greater thaw depth here agreed with the findings of relatively warmer but stable permafrost temperatures below forests in the Arctic and boreal region (Kropp et al., 2020) and was likely a relic of the previous forest-covered state. We found no sign of active layer refreezing. The thaw depth extended down to the peat layer, which started at 85 cm bs; the peat layer might have been functioning as a heat flux insulator both for summer thawing (from the top) and winter refreezing (from the bottom). Also, a detailed assessment of effects of different vegetation compositions typical for pastures in the Arctic on heat fluxes is needed.
Ultimately, more studies and monitoring setups on the impact of large herbivore grazing on permafrost soil carbon storage are needed across the Arctic. Hence, we hesitate to draw universal conclusions on herbivory effects from our data, including the extension of these results to much larger regions.
We found evidence from our permafrost study sites that intensive grazing by large herbivorous animals might have contributed to keeping the soil cool and maintaining—or even slightly increasing—carbon storage in our studied permafrost sites over a 23-year time period. At the same time, annual thaw depth was found to be lower at intensively grazed sites. These changes of ground characteristics are likely a combined result of vegetation changes and snow insulation reduction, probably amplified by additional carbon input due to intense herbivore impacts. Vegetation appears to have changed from shrubby tundra to grasslands under herbivory impact in our study area. Differences in soil moisture seem to play a role at our sites as well, and further research on the hydrological conditions and connections at our sites is needed. To further investigate herbivory effects, it is necessary to sample grazing intensity transects at higher spatial and temporal resolution and replication and to repeat this approach in other permafrost areas as well. Also, more detailed monitoring approaches are needed, such as the setup of exclosure sites that allow for direct comparison of a range of sampled parameters with sites under the influence of different grazing intensities.
We conclude that intensified animal husbandry could locally contribute to stabilizing carbon storage in the active layer at non-forest permafrost sites, and might further preserve carbon stored in permafrost ground by maintaining a frozen state. This management practice may fit into a broader set of tools that could be used to mitigate the consequences of local permafrost thaw in order to buffer climate change impacts. Answering the interesting question of whether such an approach could be scalable to larger regions was not part of our study.
The datasets presented in this study can be found in online repositories. The datasets presented are deposited with the PANGAEA data repository, accessible using https://doi.org/10.1594/PANGAEA.933446.
TW, GG, MU, and JS designed the study. TW conducted field and laboratory work, prepared the graphics, and led the writing of this manuscript. TW, GG, MU, and JS analyzed and interpreted the laboratory results. GG designed the maps used in this study. BF, MM-F, and JO provided expertise on herbivory and herbivore-environment interactions. JW contributed expertise in vegetation classification and statistics. NZ and MG provided expertise on the area and local environment processes and characteristics as well as on the Pleistocene Park experiment. All authors contributed to compiling and editing the manuscript.
The field campaign was carried out in the framework of the CACOON (Changing Arctic Carbon Cycle in the Coastal Ocean Near-Shore) project (#03F0806A (German Federal Ministry of Education and Research)) and as part of the PeCHEc (Permafrost Carbon Stabilization by Recreating a Herbivore-Driven Ecosystem) project funded by the Potsdam Graduate School. The authors received additional support from the Geo.X research network (SO_087_GeoX). Additional funding was provided by the CHARTER (Drivers and Feedbacks of Changes in Arctic Terrestrial Biodiversity) project (grant agreement ID 869471). We further acknowledge base funding provided by the Alfred Wegener Institute expedition funds, as well as support by the Open Access Publication Funds of Alfred-Wegener-Institut Helmholtz-Zentrum für Polar- und Meeresforschung.
We thank the Field Experiments & Instrumentation team at the Max Planck Institute for Biogeochemistry in Jena as well as Juri Palmtag for helping with the drilling campaign. We further acknowledge Dyke Scheidemann, Jonas Sernau, and Angelique Opitz (Carbon and Nitrogen Lab [CarLa]) as well as Mikaela Weiner and Hanno Meyer (Stable Isotope Lab) from AWI for assistance in the laboratory. We thank Christian Knoblauch (Universität Hamburg) for helping with TOC measurements. We further thank J. Otto Habeck (Universität Hamburg) for his help in designing this study. This study was supported by the Northeast Science Station team in Chersky, Sakha
The authors declare that the research was conducted in the absence of any commercial or financial relationships that could be construed as a potential conflict of interest.
All claims expressed in this article are solely those of the authors and do not necessarily represent those of their affiliated organizations, or those of the publisher, the editors and the reviewers. Any product that may be evaluated in this article, or claim that may be made by its manufacturer, is not guaranteed or endorsed by the publisher.
The Supplementary Material for this article can be found online at: https://www.frontiersin.org/articles/10.3389/fenvs.2022.893478/full#supplementary-material
Abramov, A., Davydov, S., Ivashchenko, A., Karelin, D., Kholodov, A., Kraev, G., et al. (2019). Two decades of active layer thickness monitoring in northeastern Asia. Polar Geogr. 44, 186–202. doi:10.1080/1088937X.2019.1648581
Akayuli, C., Ofosu, B., Nyako, S. O., and Opuni, K. O. (2013). The influence of observed clay content on shear strength and compressibility of residual sandy soils. Int. J. Eng. Res. Appl. 3 (4), 2538–2542.
Batey, T. (2009). Soil compaction and soil management – A review. Soil Use Manag. 25 (4), 335–345. doi:10.1111/j.1475-2743.2009.00236.x
Beer, C., Zimov, N., Olofsson, J., Porada, P., and Zimov, S. (2020). Protection of permafrost soils from thawing by increasing herbivore density. Sci. Rep. 10 (1), 4170. doi:10.1038/s41598-020-60938-y
Blok, D., Heijmans, M. M. P. D., Schaepman-Strub, G., Kononov, A. V., Maximov, T. C., and Berendse, F. (2010). Shrub expansion may reduce summer permafrost thaw in Siberian tundra. Glob. Chang. Biol. 16 (4), 1296–1305. doi:10.1111/j.1365-2486.2009.02110.x
Bowen, J. C., Ward, C. P., Kling, G. W., and Cory, R. M. (2020). Arctic amplification of global warming strengthened by sunlight oxidation of permafrost carbon to CO2. Geophys. Res. Lett. 47 (12), e2020GL087085. doi:10.1029/2020GL087085
Bradley-Cook, J. I., and Virginia, R. A. (2018). Landscape variation in soil carbon stocks and respiration in an Arctic tundra ecosystem, west Greenland. Arct. Antarct. Alp. Res. 50 (1), S100024. doi:10.1080/15230430.2017.1420283
Chlachula, J. (2003). The Siberian loess record and its significance for reconstruction of Pleistocene climate change in north-central Asia. Quat. Sci. Rev. 22 (18), 1879–1906. doi:10.1016/S0277-3791(03)00182-3
Coplen, T. B., Brand, W. A., Gehre, M., Gröning, M., Meijer, H. A. J., Toman, B., et al. (2006). New guidelines for δ13C measurements. Anal. Chem. 78 (7), 2439–2441. doi:10.1021/ac052027c
Corradi, C., Kolle, O., Walter, K., Zimov, S. A., and Schulze, E.-D. (2005). Carbon dioxide and methane exchange of a north-east Siberian tussock tundra. Glob. Chang. Biol. 11 (11), 1910–1925. doi:10.1111/j.1365-2486.2005.01023.x
Diochon, A., and Kellman, L. (2008). Natural abundance measurements of 13C indicate increased deep soil carbon mineralization after forest disturbance. Geophys. Res. Lett. 35, L14402. doi:10.1029/2008GL034795
Domine, F., Barrere, M., and Morin, S. (2016). The growth of shrubs on high arctic tundra at bylot island: Impact on snow physical properties and permafrost thermal regime. Biogeosciences 13 (23), 6471–6486. doi:10.5194/bg-13-6471-2016
Falk, J. M., Schmidt, N. M., Christensen, T. R., and Ström, L. (2015). Large herbivore grazing affects the vegetation structure and greenhouse gas balance in a high arctic mire. Environ. Res. Lett. 10, 045001. doi:10.1088/1748-9326/10/4/045001
Fischer, W., Thomas, C. K., Zimov, N., and Göckede, M. (2022). Grazing enhances carbon cycling but reduces methane emission during peak growing season in the Siberian Pleistocene Park tundra site. Biogeosciences 19 (6), 1611–1633. doi:10.5194/bg-19-1611-2022
Forbes, B. C. (2006). The challenges of modernity for reindeer management in northermost Europe, 184. Berlin, Heidelberg: Springer, 11–25.
Frost, G. V., Epstein, H. E., Walker, D. A., Matyshak, G., and Ermokhina, K. (2013). Patterned-ground facilitates shrub expansion in Low Arctic tundra. Environ. Res. Lett. 8 (1), 015035. doi:10.1088/1748-9326/8/1/015035
Fuchs, M., Bolshiyanov, D., Grigoriev, M. N., Morgenstern, A., Pestryakova, L., Tsibizov, L., et al. (2021). Russian-German cooperation: Expeditions to Siberia in 2019. Bremerhaven: Alfred Wegener Institute for Polar and Marine Research, 749.
Gao, Q., Schwartz, M. W., Zhu, W., Wan, Y., Qin, X., Ma, X., et al. (2016). Changes in global grassland productivity during 1982 to 2011 attributable to climatic factors. Remote Sens. 8, 384. doi:10.3390/rs8050384
Göckede, M., Kittler, F., Kwon, M. J., Burjack, I., Heimann, M., Kolle, O., et al. (2017). Shifted energy fluxes, increased Bowen ratios, and reduced thaw depths linked with drainage-induced changes in permafrost ecosystem structure. Cryosphere 11 (6), 2975–2996. doi:10.5194/tc-11-2975-2017
Göckede, M., Kwon, M. J., Kittler, F., Heimann, M., Zimov, N., and Zimov, S. (2019). Negative feedback processes following drainage slow down permafrost degradation. Glob. Change Biol. 25 (10), 3254–3266. doi:10.1111/gcb.14744
Grellmann, D. (2002). Plant responses to fertilization and exclusion of grazers on an arctic tundra heath. Oikos 98 (2), 190–204. doi:10.1034/j.1600-0706.2002.980202.x
Halcomb, S., and Sjostedt, S. (2019). “Surcharge embankment on marine clayey silt case study and lessons learned,” in Eighth International Conference on Case Histories in Geotechnical Engineering, Philadelphia, Pennsylvania, March 24–27, 2019, 119–130. Geo-Congress 2019.
Hugelius, G., Strauss, J., Zubrzycki, S., Harden, J. W., Schuur, E. a. G., Ping, C. L., et al. (2014). Estimated stocks of circumpolar permafrost carbon with quantified uncertainty ranges and identified data gaps. Biogeosciences 11, 6573–6593. doi:10.5194/bg-11-6573-2014
Huh, Y., Tsoi, M.-Y., Zaitsev, A., and Edmond, J. M. (1998). The fluvial geochemistry of the rivers of eastern Siberia: I. Tributaries of the lena river draining the sedimentary platform of the siberian craton. Geochimica Cosmochimica Acta 62 (10), 1657–1676. doi:10.1016/S0016-7037(98)00107-0
Jackson, R. B., Lajtha, K., Crow, S. E., Hugelius, G., Kramer, M. G., and Piñeiro, G. (2017). The ecology of soil carbon: Pools, vulnerabilities, and biotic and abiotic controls. Annu. Rev. Ecol. Evol. Syst. 48 (1), 419–445. doi:10.1146/annurev-ecolsys-112414-054234
Jones, M. C., Grosse, G., Jones, B. M., and Walter Anthony, K. (2012). Peat accumulation in drained thermokarst lake basins in continuous, ice-rich permafrost, northern Seward Peninsula, Alaska. J. Geophys. Res. 117, G2. doi:10.1029/2011JG001766
Jongejans, L. L., Strauss, J., Lenz, J., Peterse, F., Mangelsdorf, K., Fuchs, M., et al. (2018). Organic matter characteristics in yedoma and thermokarst deposits on Baldwin Peninsula, west Alaska. Biogeosciences 15 (20), 6033–6048. doi:10.5194/bg-15-6033-2018
Kaiser, C., Meyer, H., Biasi, C., Rusalimova, O., Barsukov, P., and Richter, A. (2007). Conservation of soil organic matter through cryoturbation in arctic soils in Siberia. J. Geophys. Res. 112, G02017. doi:10.1029/2006JG000258
Keuper, F., van Bodegom, P. M., Dorrepaal, E., Weedon, J. T., van Hal, J., van Logtestijn, R. S. P., et al. (2012). A frozen feast: Thawing permafrost increases plant-available nitrogen in subarctic peatlands. Glob. Chang. Biol. 18 (6), 1998–2007. doi:10.1111/j.1365-2486.2012.02663.x
Köster, K., Berninger, F., Köster, E., and Pumpanen, J. (2015). Influences of reindeer grazing on above- and belowground biomass and soil carbon dynamics. Arct. Antarct. Alp. Res. 47 (3), 495–503. doi:10.1657/AAAR0014-062
Kropp, H., Loranty, M. M., Natali, S. M., Kholodov, A. L., Rocha, A. V., Myers-Smith, I., et al. (2020). Shallow soils are warmer under trees and tall shrubs across Arctic and Boreal ecosystems. Environ. Res. Lett. 16 (1), 015001. doi:10.1088/1748-9326/abc994
Macias-Fauria, M., Jepson, P., Zimov, N., and Malhi, Y. (2020). Pleistocene Arctic megafaunal ecological engineering as a natural climate solution? Phil. Trans. R. Soc. B 375, 20190122. doi:10.1098/rstb.2019.0122
Magnússon, R. Í., Hamm, A., Karsanaev, S. V., Limpens, J., Kleijn, D., Frampton, A., et al. (2022). Extremely wet summer events enhance permafrost thaw for multiple years in Siberian tundra. Nat. Commun. 13 (1), 1556. doi:10.1038/s41467-022-29248-x
Malone, E. T., Abbott, B. W., Klaar, M. J., Kidd, C., Sebilo, M., Milner, A. M., et al. (2018). Decline in ecosystem δ13C and mid-successional nitrogen loss in a two-century postglacial chronosequence. Ecosystems 21 (8), 1659–1675. doi:10.1007/s10021-018-0245-1
Martin, A. C., Jeffers, E. S., Petrokofsky, G., Myers-Smith, I., and Macias-Fauria, M. (2017). Shrub growth and expansion in the arctic tundra: An assessment of controlling factors using an evidence-based approach. Environ. Res. Lett. 12 (8), 085007. doi:10.1088/1748-9326/aa7989
Mekonnen, Z. A., Riley, W. J., Berner, L. T., Bouskill, N. J., Torn, M. S., Iwahana, G., et al. (2021). Arctic tundra shrubification: A review of mechanisms and impacts on ecosystem carbon balance. Environ. Res. Lett. 16 (5), 053001. doi:10.1088/1748-9326/abf28b
Mishra, U., Hugelius, G., Shelef, E., Yang, Y., Strauss, J., Lupachev, A., et al. (2021). Spatial heterogeneity and environmental predictors of permafrost region soil organic carbon stocks. Sci. Adv. 7, eaaz5236. doi:10.1126/sciadv.aaz5236
Mod, H. K., and Luoto, M. (2016). Arctic shrubification mediates the impacts of warming climate on changes to tundra vegetation. Environ. Res. Lett. 11 (12), 124028. doi:10.1088/1748-9326/11/12/124028
Monteath, A. J., Gaglioti, B. V., Edwards, M. E., and Froese, D. (2021). Late Pleistocene shrub expansion preceded megafauna turnover and extinctions in eastern Beringia. Proc. Natl. Acad. Sci. U. S. A. 118 (52), e2107977118. doi:10.1073/pnas.2107977118
Murchie, T. J., Monteath, A. J., Mahony, M. E., Long, G. S., Cocker, S., Sadoway, T., et al. (2021). Collapse of the mammoth-steppe in central Yukon as revealed by ancient environmental DNA. Nat. Commun. 12 (1), 7120. doi:10.1038/s41467-021-27439-6
Myers-Smith, I. H., Forbes, B. C., Wilmking, M., Hallinger, M., Lantz, T., Blok, D., et al. (2011). Shrub expansion in tundra ecosystems: Dynamics, impacts and research priorities. Environ. Res. Lett. 6 (4), 045509. doi:10.1088/1748-9326/6/4/045509
Olofsson, J., Oksanen, L., Callaghan, T., Hulme, P. E., Oksanen, T., and Suominen, O. (2009). Herbivores inhibit climate-driven shrub expansion on the tundra. Glob. Chang. Biol. 15 (11), 2681–2693. doi:10.1111/j.1365-2486.2009.01935.x
Olofsson, J., and Post, E. (2018). Effects of large herbivores on tundra vegetation in a changing climate, and implications for rewilding. Phil. Trans. R. Soc. B 373, 20170437. doi:10.1098/rstb.2017.0437
Olofsson, J. (2006). Short- and long-term effects of changes in reindeer grazing pressure on tundra heath vegetation. J. Ecol. 94 (2), 431–440. doi:10.1111/j.1365-2745.2006.01100.x
Olofsson, J., Stark, S., and Oksanen, L. (2004). Reindeer influence on ecosystem processes in the tundra. Oikos 105 (2), 386–396. doi:10.1111/j.0030-1299.2004.13048.x
Palmtag, J., Hugelius, G., Lashchinskiy, N., Tamstorf, M. P., Richter, A., Elberling, B., et al. (2015). Storage, landscape distribution, and burial history of soil organic matter in contrasting areas of continuous permafrost. Arct. Antarct. Alp. Res. 47 (1), 71–88. doi:10.1657/AAAR0014-027
Phillips, C. A., and Wurzburger, N. (2019). Elevated rates of heterotrophic respiration in shrub-conditioned arctic tundra soils. Pedobiologia 72, 8–15. doi:10.1016/j.pedobi.2018.11.002
RCoreTeam (2021). R: A language and environment for statistical computing. Vienna, Austria: R Foundation for Statistical Computing.
Regmi, P., Grosse, G., Jones, M. C., Jones, B. M., and Anthony, K. W. (2012). Characterizing post-drainage succession in thermokarst lake basins on the seward peninsula, Alaska with TerraSAR-X backscatter and landsat-based NDVI data. Remote Sens. 4 (12), 3741–3765. doi:10.3390/rs4123741
Reimer, P. J., Austin, W. E. N., Bard, E., Bayliss, A., Blackwell, P. G., Bronk Ramsey, C., et al. (2020). The IntCal20 northern hemisphere radiocarbon age calibration curve (0–55 cal kBP). Radiocarbon 62 (4), 725–757. doi:10.1017/RDC.2020.41
Sannel, A. B. K. (2020). Ground temperature and snow depth variability within a subarctic peat plateau landscape. Permafr. Periglac. Process. 31 (2), 255–263. doi:10.1002/ppp.2045
Schirrmeister, L., Grosse, G., Wetterich, S., Overduin, P. P., Strauss, J., Schuur, E. A. G., et al. (2011). Fossil organic matter characteristics in permafrost deposits of the northeast Siberian Arctic. J. Geophys. Res. 116, G00M02. doi:10.1029/2011JG001647
Schuur, E. A. G., Bockheim, J., Canadell, J. G., Euskirchen, E., Field, C. B., Goryachkin, S. V., et al. (2008). Vulnerability of permafrost carbon to climate change: Implications for the global carbon cycle. BioScience 58 (8), 701–714. doi:10.1641/B580807
Schuur, E. A. G., McGuire, A. D., Schädel, C., Grosse, G., Harden, J. W., Hayes, D. J., et al. (2015). Climate change and the permafrost carbon feedback. Nature 520, 171–179. doi:10.1038/nature14338
Shmelev, D., Cherbunina, M., Rogov, V., Opfergelt, S., Monhonval, A., and Strauss, J. (2021). Reconstructing permafrost sedimentological characteristics and post-depositional processes of the yedoma stratotype duvanny yar, Siberia. Front. Earth Sci. (Lausanne). 9, 961. doi:10.3389/feart.2021.727315
Skarin, A., Verdonen, M., Kumpula, T., Macias-Fauria, M., Alam, M., Kerby, J. T., et al. (2020). Reindeer use of low Arctic tundra correlates with landscape structure. Environ. Res. Lett. 15, 115012. doi:10.1088/1748-9326/abbf15
Strauss, J., Abbott, B. W., Hugelius, G., Schuur, E., Treat, C., Fuchs, M., et al. (2021). 9. Permafrost. Recarbonizing global soils–A technical manual of recommended management practices: Volume 2–Hot spots and bright spots of soil organic carbon Rome: FAO, 130.
Strauss, J., Schirrmeister, L., Wetterich, S., Borchers, A., and Davydov, S. P. (2012). Grain-size properties and organic-carbon stock of Yedoma Ice Complex permafrost from the Kolyma lowland, northeastern Siberia. Glob. Biogeochem. Cycles 26, 2011GB004104. doi:10.1029/2011GB004104
Stuenzi, S. M., Boike, J., Gädeke, A., Herzschuh, U., Kruse, S., Pestryakova, L. A., et al. (2021). Sensitivity of ecosystem-protected permafrost under changing boreal forest structures. Environ. Res. Lett. 16 (8), 084045. doi:10.1088/1748-9326/ac153d
Stuiver, M., Reimer, P. J., and Reimer, R. W. (2021). CALIB 8.2 [WWW program]. Available at: http://calib.org/calib/calib.html (Accessed April 9, 2021).
Sundqvist, M. K., Moen, J., Björk, R. G., Vowles, T., Kytöviita, M.-M., Parsons, M. A., et al. (2019). Experimental evidence of the long-term effects of reindeer on Arctic vegetation greenness and species richness at a larger landscape scale. J. Ecol. 107 (6), 2724–2736. doi:10.1111/1365-2745.13201
Suominen, O., and Olofsson, J. (2000). Impacts of semi-domesticated reindeer on structure of tundra and forest communities in fennoscandia: A review. Ann. Zool. Fenn. 37 (4), 233–249.
te Beest, M., Sitters, J., Ménard, C. B., and Olofsson, J. (2016). Reindeer grazing increases summer albedo by reducing shrub abundance in Arctic tundra. Environ. Res. Lett. 11 (12), 125013. doi:10.1088/1748-9326/aa5128
Turetsky, M. R., Abbott, B. W., Jones, M. C., Anthony, K. W., Olefeldt, D., Schuur, E. A. G., et al. (2020). Carbon release through abrupt permafrost thaw. Nat. Geosci. 13 (2), 138–143. doi:10.1038/s41561-019-0526-0
Turetsky, M. R., Abbott, B. W., Jones, M. C., Walter Anthony, K., Olefeldt, D., Schuur, E. A. G., et al. (2019). Permafrost collapse is accelerating carbon release. Nature 569, 32–34. doi:10.1038/d41586-019-01313-4
Veremeeva, A., Nitze, I., Günther, F., Grosse, G., and Rivkina, E. (2021). Geomorphological and climatic drivers of thermokarst lake area increase trend (1999–2018) in the Kolyma lowland yedoma region, north-eastern Siberia. Remote Sens. 13 (2), 178. doi:10.3390/rs13020178
Verma, M., Schulte to Bühne, H., Lopes, M., Ehrich, D., Sokovnina, S., Hofhuis, S. P., et al. (2020). Can reindeer husbandry management slow down the shrubification of the Arctic? J. Environ. Manag. 267, 110636. doi:10.1016/j.jenvman.2020.110636
Walker, D. A., Jia, G. J., Epstein, H. E., Raynolds, M. K., Chapin, F. S., Copass, C., et al. (2003). Vegetation-soil-thaw-depth relationships along a low-arctic bioclimate gradient, Alaska: Synthesis of information from the ATLAS studies. Permafr. Periglac. Process. 14 (2), 103–123. doi:10.1002/ppp.452
Wang, P., Mommer, L., van Ruijven, J., Berendse, F., Maximov, T. C., and Heijmans, M. M. P. D. (2016). Seasonal changes and vertical distribution of root standing biomass of graminoids and shrubs at a Siberian tundra site. Plant Soil 407 (1), 55–65. doi:10.1007/s11104-016-2858-5
Wilcox, E. J., Keim, D., Jong, T., Walker, B., Sonnentag, O., Sniderhan, A. E., et al. (2019). Tundra shrub expansion may amplify permafrost thaw by advancing snowmelt timing. Arct. Sci. 5 (4), 202–217. doi:10.1139/as-2018-0028
Windirsch, T., Grosse, G., Ulrich, M., Forbes, B. C., Göckede, M., Zimov, N., et al. (2021). Large herbivores affecting terrestrial permafrost in northeastern Siberia: Biogeochemical and sediment characteristics under different grazing intensities. Bremen, Germany: PANGAEA.
Windirsch, T., Grosse, G., Ulrich, M., Schirrmeister, L., Fedorov, A. N., Konstantinov, P. Y., et al. (2020). Organic carbon characteristics in ice-rich permafrost in alas and Yedoma deposits, central Yakutia, Siberia. Biogeosciences 17 (14), 3797–3814. doi:10.5194/bg-17-3797-2020
Ylänne, H., Olofsson, J., Oksanen, L., and Stark, S. (2018). Consequences of grazer-induced vegetation transitions on ecosystem carbon storage in the tundra. Funct. Ecol. 32 (4), 1091–1102. doi:10.1111/1365-2435.13029
Zhang, W., Miller, P. A., Smith, B., Wania, R., Koenigk, T., and Döscher, R. (2013). Tundra shrubification and tree-line advance amplify arctic climate warming: Results from an individual-based dynamic vegetation model. Environ. Res. Lett. 8 (3), 034023. doi:10.1088/1748-9326/8/3/034023
Zimov, N. (2020). Pleistocene park. Available at: https://pleistocenepark.ru/ (Accessed March 30, 2021).
Zimov, N. S., Zimov, S. A., Zimova, A. E., Zimova, G. M., Chuprynin, V. I., and Chapin, F. S. (2009). Carbon storage in permafrost and soils of the mammoth tundra-steppe biome: Role in the global carbon budget. Geophys. Res. Lett. 36 (2). doi:10.1029/2008GL036332
Zimov, S. A. (2005). Pleistocene park: Return of the mammoth's ecosystem. Science 308 (5723), 796–798. doi:10.1126/science.1113442
Keywords: organic material inventory, animal husbandry, bio-geo interactions, rewilding, climate change
Citation: Windirsch T, Grosse G, Ulrich M, Forbes BC, Göckede M, Wolter J, Macias-Fauria M, Olofsson J, Zimov N and Strauss J (2022) Large herbivores on permafrost— a pilot study of grazing impacts on permafrost soil carbon storage in northeastern Siberia. Front. Environ. Sci. 10:893478. doi: 10.3389/fenvs.2022.893478
Received: 10 March 2022; Accepted: 02 August 2022;
Published: 25 August 2022.
Edited by:
Wenxin Zhang, Faculty of Science, Lund University, SwedenCopyright © 2022 Windirsch, Grosse, Ulrich, Forbes, Göckede, Wolter, Macias-Fauria, Olofsson, Zimov and Strauss. This is an open-access article distributed under the terms of the Creative Commons Attribution License (CC BY). The use, distribution or reproduction in other forums is permitted, provided the original author(s) and the copyright owner(s) are credited and that the original publication in this journal is cited, in accordance with accepted academic practice. No use, distribution or reproduction is permitted which does not comply with these terms.
*Correspondence: Torben Windirsch, dG9yYmVuLndpbmRpcnNjaEBhd2kuZGU=
Disclaimer: All claims expressed in this article are solely those of the authors and do not necessarily represent those of their affiliated organizations, or those of the publisher, the editors and the reviewers. Any product that may be evaluated in this article or claim that may be made by its manufacturer is not guaranteed or endorsed by the publisher.
Research integrity at Frontiers
Learn more about the work of our research integrity team to safeguard the quality of each article we publish.