 Shunlin Jin
 Weidong Wang1*
 Sikandar Ali Qalati
- 1School of Economics and Finance, Jiangsu University, Zhenjiang, China
- 2School of Public Administration, Nanjing Agricultural University, Nanjing, China
- 3Institute of Blue and Green Development, Shandong University, Weihai, China
- 4Faculty of Business Administration, University of Macau, Zhuhai, Macau SAR, China
Exploring the co-benefits of low-carbon tech-innovation in response to climate change on haze pollution is an important foundation for China’s ecological construction, and also a key path to the common goal of carbon and haze reduction. Based on the STIRPAT model and EKC hypothesis, the dynamic spatial Durbin model (SDM) is constructed to empirically analyze the co-benefits and the mechanism of low-carbon tech-innovation on haze pollution in 30 Chinese provinces from 2006 to 2018. The results show that 1) haze pollution in different regions of China shows significant temporal and spatial correlation. 2) China’s low-carbon tech-innovation brings the co-benefits of haze pollution suppression and long-term positive externalities between regions. 3) Environmental policy and industrial structure play a moderating and mediating role, respectively, the former produces the “innovation offset” effect. 4) Both types of low-carbon tech-innovation can suppress haze pollution, but gray tech-innovation shows better haze control ability and cross-regional diffusion ability. Therefore, a long-term mechanism for haze control and joint prevention and control should be established to prevent the rebound and agglomeration of haze, and balance the development of different types of low-carbon technologies to achieve coordinated control of carbon emissions and haze.
1 Introduction
Since China’s reform and opening up, the rapid industrialization process and the rise of the manufacturing industry have promoted the rapid development of China’s economy, which has attracted global attention. However, becoming the world’s second-largest economy has come at the cost of severe haze pollution and a sharp decline in air quality across the country. Haze is generally an aerosol system composed of PM2.5, NO2, and other pollutants (Peng et al., 2013). According to the 2020 China Ecological Environment Bulletin released by the Ministry of Ecology and Environment of China1, 135 out of 337 prefecture-level cities in China exceeded ambient air quality standards, accounting for 40.1%. In total, 337 cities suffered from severe pollution for 345 days, with PM2.5, O3, PM10, NO2, and SO2 as the primary pollutant, and PM2.5 (fine particulate matter with an aerodynamic diameter less than or equal to 2.5 μm) being the largest. The number of days exceeding the standard with it as the primary pollutant accounted for 51% of the total number of days, exceeding the standard. According to World Health Organization data2, around the world, seven million people die from air pollution every year. A large amount of haze pollution will cause serious damage to the ecological environment, climate change, air pollution, and human health (Cai et al., 2018; Yang et al., 2021; Usman et al., 2022a; Wang et al., 2022). At present, severe haze pollution has brought a series of impacts on China’s ecological environment and economic development (Gan et al., 2021; Yan and Cao, 2021). Moreover, these adverse effects are not only limited to one region but also affect all regions of the world as the atmosphere flows (Usman et al., 2022b). Therefore, how to effectively suppress haze pollution and reduce regional PM2.5 concentration to improve air quality has been paid close attention by various countries around the world. The Chinese government has also issued relevant policies aimed at severe air quality, including the Three-year Action Plan to Win the Battle Against Blue Sky in20183. However, the haze pollution problem in China is still severe. As far as the PM2.5 concentration of each province in 2018 is concerned (see Figure 1), more than half of the provinces still failed to meet the World Health Organization’s PM2.5 concentration standards for the first and second transitional phases (35 μg/m3 and 25 μg/m3). Overall, China still has a long way to go to reduce haze pollution.
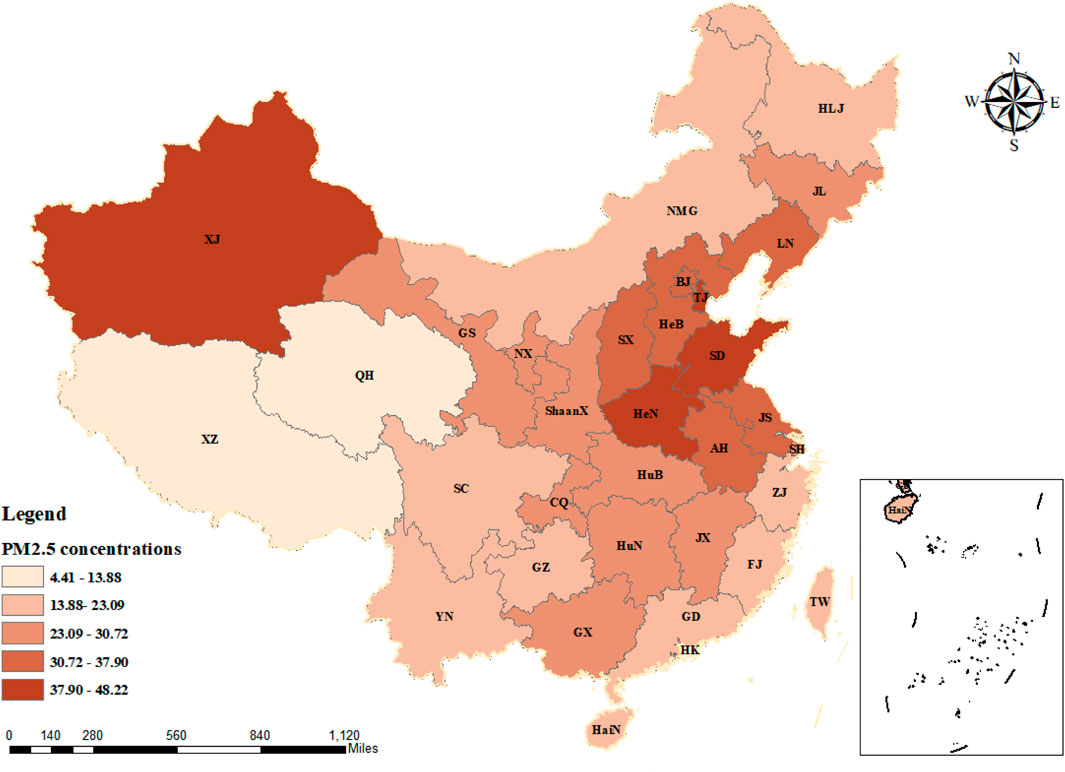
FIGURE 1. PM2.5 concentration in China in 2018.
Compared with haze pollution, carbon emissions, which exacerbate climate change, seem to be more important in China and the world. In the face of the threat of global climate change, the EU issued the EU Adaptation to Climate Change Strategy in 2021, mainly to achieve carbon neutrality through technological innovation and fiscal policies, and entered the fourth stage of the carbon emissions trading system in 2021 (Anke et al., 2020). The United States has reached the peak of carbon emissions in 2007 and actively develops and utilizes new carbon reduction technologies to achieve carbon neutrality (Sergey et al., 2021). In 2015, China signed a commitment under the Paris Agreement to reduce energy intensity by 60–65% by 2030 compared with 2005, and to peak CO2 emissions around 2030 or even earlier. In 2020, China announced new targets for its nationally determined contributions, including peak carbon emissions and carbon neutrality, which were included in the 14th Five-Year Plan (2021–2025), and a large number of relevant policies were introduced. This shows that carbon reduction has become a top priority for China at present and in the coming decades.
A major obstacle to carbon reduction is the difficulty of reconciling the global, long-term benefits of climate change with the short-term local costs. However, relevant studies have suggested that carbon emission reduction can also reduce other emissions of air pollution, such as SO2, NOx, and PM2.5, which can bring short-term and local health benefits and relieve the short-term cost pressure of emission reduction (Gehrsitz, 2017; Zhang et al., 2017; Cai et al., 2018; Wang T. et al., 2020a). Two air pollutant treatment methods, process management, and source control are closely related to the realization of emission reduction targets (Qian et al., 2021). Most of these studies focused on the assessment of air quality and health benefits of carbon mitigation policies such as carbon trading, carbon prices, and carbon tax (Shindell et al., 2018; Chang et al., 2020; Wang W. et al., 2020b), focus on assessing the benefits of individual technologies such as biofuels and carbon sequestration (CCS) for tackling climate change (Ou et al., 2018; Wang T. et al., 2020a), balance carbon reduction and haze reduction and the resulting high cost, and endogenous technological progress is often given high expectations (Acemoglu et al., 2012; Yi et al., 2020; João et al., 2022). From the perspective of enterprises, to cope with the government’s increasingly strict environmental policies, it will carry out technological innovation to relieve the cost pressure (Ouyang et al., 2020; Zhu et al., 2021; Cui et al., 2022; Ding and Shahzad, 2022), which is consistent with Porter’s hypothesis. According to the endogenous growth theory, knowledge accumulation or innovation is the result of enterprises’ “conscious” R&D investment (Romer, 1986). Such “consciousness” at this time is reflected in alleviating the pressure of environmental cost, which is also consistent with the R&D model. The formation of industrial clusters creates favorable conditions for knowledge flow, which helps to accelerate knowledge spillover among enterprises within clusters (Chyi et al., 2012) and stimulate the generation of “MAR externalities,” thus improving regional innovation capability, and such knowledge spillover itself plays an important role in improving energy efficiency (Sun et al., 2021). Since the 21st century, China’s crazy technological catch-up and even technological transcendence in some fields indicate that the China’s innovation level has been significantly improved (Mu and Lee. 2005; Lyu et al., 2019; Jin et al., 2022). In terms of low-carbon technologies, the number of patent applications increased by more than 10 times during the 12 years from 2006 to 2018 (see Figure 2), and the technological innovation level of all provinces has been significantly improved4 (see Figure 3). Such vigorous low-carbon tech-innovation activities will certainly have a positive effect on carbon reduction, which has been studied in detail (Lin and Ma, 2022a; Lin and Ma, 2022b), but whether the increasingly large low-carbon technological innovation is also conducive to reducing haze reduction, to play the dual role and co-benefits of carbon reduction and haze reduction has not been systematically discussed.
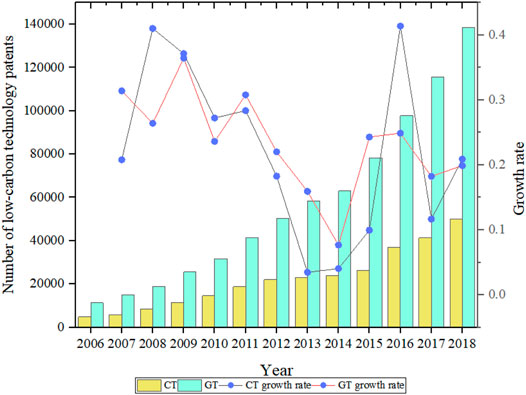
FIGURE 2. Patent applications and the growth rate of clean and gray technologies in China from 2006 to 2018.
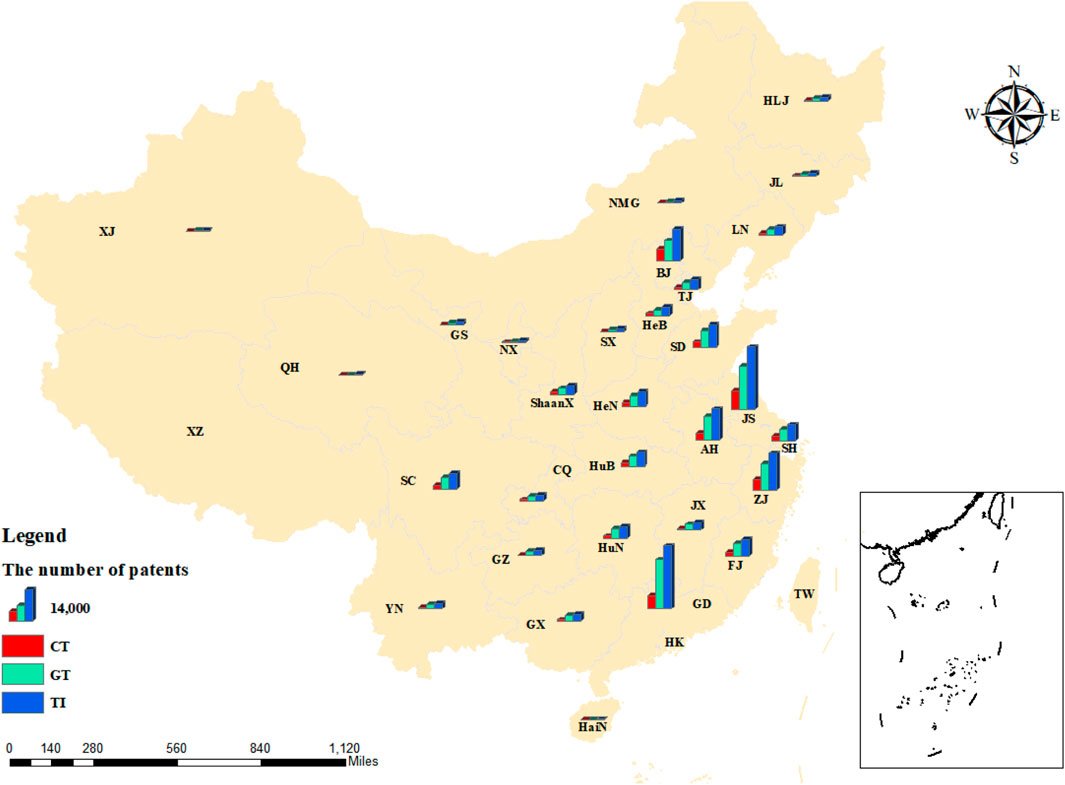
FIGURE 3. Number of patent applications for low-carbon technologies by provinces in China in 2018.
Accordingly, in the context of a growing body of research focusing on the co-benefits of mitigating global climate change and curbing air pollution, this article took China as an example and used an empirical model to analyze the effect of low-carbon tech-innovation committed to climate change on the suppression of haze pollution. In addition, low-carbon tech-innovation is divided into clean and gray technology to study the heterogeneity of haze pollution prevention effects of different technologies. On this basis, the mechanism of suppressing haze pollution by low-carbon technological innovation is further analyzed. To improve the rationality and reliability of the research, we integrated the STIRPAT model and classical EKC hypothesis to construct a spatial econometric model, including the spatial spillover effect and used Y02 low-carbon patent data to measure low-carbon technological innovation activities more objectively.
This study filled the gaps in the current research on the co-benefits and positive externalities of air quality brought about by low-carbon technological innovation and produced three research contributions 1) we systematically studied the co-benefits of haze reduction brought by endogenous low-carbon tech-innovation as a whole, and expanded the research on “externalities” of low-carbon tech-innovation; 2) heterogeneity analysis of low-carbon technology was conducted to distinguish the difference between clean and gray technology in the process of haze pollution suppression; 3) in the study of co-benefits, the spatial nature was included, and the mechanism analysis was carried out from two aspects of environmental policy and industrial structure. The findings of these efforts will help China achieve its dual goals of carbon neutrality and air quality improvement as soon as possible through the development of low-carbon tech-innovation. The remaining of this article is structured as follows: section 2 provides the literature review and mechanism analysis. Section 3 introduces the methods and data. The empirical results and discussions are presented in section 4. Finally, section 5 puts forward the conclusions, policy implications, and future research direction. To show the author’s research ideas, we drew the following flow chart (Figure 4).
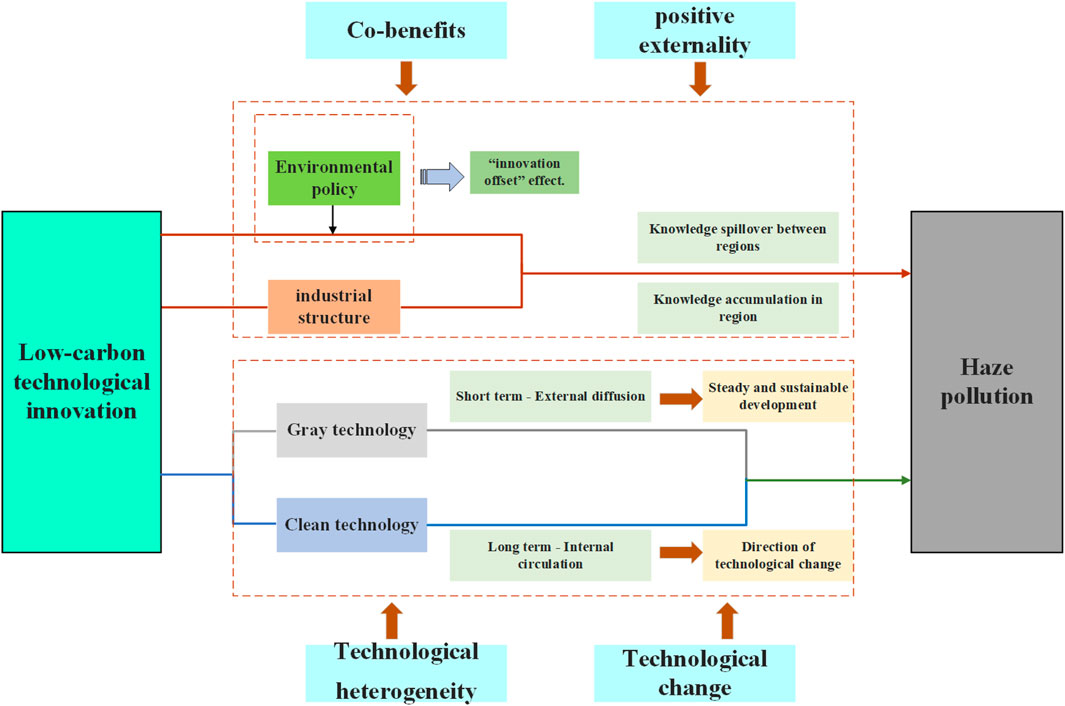
FIGURE 4. Author’s research ideas.
2 Literature Review and Mechanism Analysis
2.1 Co-benefits of Air Quality and Climate Change
Climate change and haze pollution have the same root and origin, creating great potential for joint control (Thambiran and Diab, 2011; Vandyck et al., 2018). Studies on the co-control or co-benefits of carbon reduction and haze reduction focus on the reduction of local air pollutant emissions through measures aimed at reducing greenhouse gas emissions, or the reduction of greenhouse gas emissions through measures aimed at reducing air pollutants in response to global climate change (Rypdal et al., 2007; Tollefsen et al., 2009; Yeora. 2010). For the former scenario, simulation is often used. For example, Li et al. (2019) combined the China-TIMES model with the GAINS-China model to simulate the synergistic effect of different carbon mitigation strategies on air quality improvement and found that different low-carbon development methods could further improve China’s air quality. In the long term, it can also reduce the cost of air pollutant control. Wei et al. (2017) used the WRF-Chem model to investigate the air quality benefits brought by carbon emission reduction strategies in four sectors in China, and found that such benefits were particularly evident in the industrial sector, emphasizing the importance of carbon mitigation in the industrial sector to achieve the dual goals of carbon reduction and haze reduction (Wei et al., 2017). In addition to air quality, the co-benefits generated by carbon mitigation are also reflected in the health. These benefits come from energy system transformation, fuel and tech-innovation in some industries, and carbon mitigation policies (Thompson et al., 2014; West et al., 2013; Driscoll et al., 2015; Garcia-Menendez et al., 2015; Brian et al., 2020; Peng et al., 2021). As an important externality of climate change, air pollution and human health will be improved in the implementation of climate policies, including the transformation and upgrading of industrial sectors, and these improvements are expected to cover the cost of policy implementation (Shindell et al., 2016; Li et al., 2018; Vandyck et al., 2018). Markandya et al. (2018) found that the health synergies greatly exceed the costs of achieving the Paris agreement targets (2°and 1.5°C) for coordinated control of greenhouse gases and air pollutants in all cases, and China is expected to gain a net benefit of using 0.27–2.31 trillion in the process of achieving this goal, becoming the biggest winner. Yang et al. (2013) calculated the co-benefits of energy-saving technologies in the China’s cement industry. Cai et al. (2018) estimated that 18–62% of the implementation cost of renewable power generation in the power generation industry can be covered by health benefits by 2030, and health benefits will increase significantly to 3–9 times the cost by 2050. However, based on the previously mentioned literature, we find that most of the studies on co-benefits focus on carbon emission trading, carbon tax, and other environmental policies, or focus on some industrial sectors (such as the power sector, transportation sector, automobile industry, and cement industry) and some specific renewable energy or negative emission technologies (such as CCUS, PV, and biomass energy) (Ou et al., 2018; Yang et al., 2018; Wang T. et al., 2020a), the co-benefits of low-carbon tech-innovation on air quality is neglected.
2.2 Haze Pollution and Technological Innovation
As a global problem, how to effectively alleviate air pollution has received urgent attention from almost all countries. Existing studies mostly discuss how to effectively suppress haze pollution from two aspects. The first is national environmental policies. Zhou et al. (2021) found that appropriate environmental regulations can help promote the upgrading of industrial structure and energy structure to suppress haze pollution, and there is a nonlinear relationship between the two. Zhang M. et al. (2019) also emphasized this point, arguing that environmental regulation changes the direction of influence of industrial structure on haze pollution. Liu et al. (2021) clarified that China’s emissions trading scheme (ETS) reduced PM2.5 in China, and analyzed the social, health, and economic benefits brought by this process. The second is the influence of economic structure change on suppressing haze pollution. Both positive and negative externalities may be caused by industrial agglomeration, which is highlighted by the “scale effect” and “crowding effect.” The latter will undoubtedly aggravate haze pollution, and there is still no conclusion on what effect industrial agglomeration plays (Li et al., 2021). From the perspective of urbanization, Feng and Wang, (2019) found the relationship between urban sprawl and haze pollution by using the dynamic spatial Durbin model (u-shaped curve in large cities and inverted U-shaped curve in small- and medium-sized cities). Similarly, Wang et al. (2022) also used the dynamic spatial Durbin model to analyze the impact of economic agglomeration in 74 cities in the Yellow River basin of China on haze pollution, and found an N-shaped relationship between economic agglomeration and haze pollution, emphasizing the improvement of economic agglomeration to improve the mechanism of haze prevention and control.
However, technological innovation plays an important role in both environmental regulation and economic structure change (Jahanger et al., 2022). On the one hand, according to the endogenous growth theory, the technology progress is endogenous, which is determined to maintain a sustained economic growth factor (Romer, 1986), Technological innovation can be consciously used by enterprise to improve their production efficiency, and promote the technological level between clusters or regions through uncontrollable knowledge spillover, thus promoting the upgradation of the industrial structure and energy structure, and realizing the goal of optimizing the national economic structure (Chyi et al., 2012; Shi and Lai, 2013). On the other hand, according to the Porter’s hypothesis, green technological innovation, as an effective response to government environmental regulations, can be used by enterprises to reduce production costs and thus obtain the power of sustainable development (Feng et al., 2021). Therefore, technological innovation or technological progress can be expected to achieve co-development of the economy and environment. Acemoglu et al. (2016) pointed out that increasing R&D investment is conducive to improving environmental quality and curbing haze pollution to achieve the goal of energy conservation and emission reduction. Meanwhile, the spatial spillover effect of technological innovation in this process has also been emphasized (Liu, 2018). Yet for all these advantages, there is still a lot of ambiguity. For example, Jaffe et al. (2002) found that the role of technological innovation in suppressing haze pollution is not clear, and the process of action will be largely influenced by the level of supervision, and environmental policies including the level of technological diffusion. At the same time, Popp et al. (2009) also believed that the existing technological development could not solve the environmental problem, and to solve this problem, a huge price must be paid, this is in line with Jaffe’s view, and is different from Porter and other “win–win” theorists. A large number of technological innovations will inevitably bring high-cost input, which may promote innovation and development and cause greater environmental pollution. However, low-carbon tech innovation has always been faced with “dual externality” constraints, leading to the embarrassing situation that innovation input is difficult to recover monopoly benefits and environmental benefits (Horbach et al., 2012). In addition, technological innovation is not only an independent variable but also influenced by energy price (Popp, 2002), environmental policy (Jaffe et al., 2002; Feng et al., 2021), income effect (Yi et al., 2020), energy rebound effect (Horace and Robin, 2006; Yi et al., 2020), etc. For example, Yi et al. (2020) found that due to the energy rebound effect, energy-saving technological progress cannot effectively reduce haze pollution, but at the same time, they also emphasize the importance of classifying technological innovations to explore their role in haze pollution, while technological innovations invested without considering emission reduction are considered to be ineffective in curbing haze pollution (Shao et al., 2016).
To sum up, the aforementioned literature has also faced the following problems: 1) these studies only involve environmental policies, changes in economic structure, or the role of specific technologies in suppressing haze pollution, and there are few articles on technological innovation. In particular, there are very few studies on the effect of low-carbon technologies on haze pollution from the overall perspective of technology. The overall changes and effects of endogenous low-carbon tech-innovation are ignored, and the double benefits of carbon reduction and haze reduction have not been paid attention to by the research on the “externalities” of low-carbon technologies. 2) There is insufficient research on the difference about common benefits of important categories of low-carbon technologies as a whole. Low-carbon technologies may vary in cost, reliability, and environmental impact (Shi et al., 2017). Therefore, it is very important to categorize low-carbon technologies as a whole. At present, the classification of clean and gray technology5 has been emphasized (West, 2004; Acemoglu et al., 2016; Aghion et al., 2016). Therefore, it is necessary to use this classification method to explore the heterogeneity of the impacts of low-carbon technologies on co-benefits. 3) The spatial effect has not been emphasized in the study of co-benefits. Although haze has the characteristics of local and short-term, as an air pollutant, it must have certain spatial spillover, especially in China, a geographically connected country, so it is more necessary to emphasize spatial spillover in the study of the mechanism of low-carbon technological innovation affecting haze.
2.3 Mechanism Analysis
Considering the complexity of low-carbon tech-innovation, the implementation of environmental policy and the change of economic structure are likely to influence its effect on inhibition of smog pollution of size. Therefore, it is extremely important to combine the two and explore the mechanism of low-carbon tech-innovation to suppress haze pollution. Unfortunately, there is no systematic research discussion at present. We include environmental regulation and industrial structure, two variables that scholars generally attach importance to, in the study to analyze the mechanism of low-carbon tech-innovation to suppress haze pollution. There are three main types of environmental regulation (“command–control environmental regulation,” “voluntary environmental regulation,” and “market–incentive environmental regulation”). On the one hand, the Porter’s hypothesis holds that environmental regulation can promote enterprise technological innovation to improve environmental quality and bring the innovation compensation effect, which has also been widely confirmed in China (Zhu et al., 2021), but on the other hand, in the eyes of the new classical economists, powerful environmental regulation may bring the highest processing costs to offset the benefits of technology innovation (Barbera and McConnell, 1990). In addition, heterogeneous environmental regulations themselves have internal uncertainties. Therefore, it is extremely important to explore the combination of environmental policies and low-carbon tech-innovation to suppress haze pollution. It remains to be considered whether environmental regulations magnify or inhibit the effect of low-carbon tech-innovation. Therefore, we focus on the role of “command–control environmental regulation” in this process because this kind of environmental regulation has the most obvious “compensation effect” or “offset effect” on technological innovation (Tang et al., 2020). Meanwhile, low-carbon tech-innovation will inevitably affect a country’s industrial structure, and the upgrading of industrial structure will help to the environmental quality of ascension (Shi and Lai, 2013). Therefore, it is necessary to discuss in detail whether China’s current low-carbon tech-innovation can promote the upgradation of industrial structures to cope with haze pollution.
Therefore, this article takes haze pollution as the explained variable, and the total number of low-carbon tech-innovation and its subcategories as the core explanatory variables, the STIRPAT model and the classical EKC hypothesis were combined to construct a dynamic spatial econometric model, which mainly analyzes three aspects spatial spillover effect of haze pollution; the effect and mechanism of low-carbon tech-innovation on haze pollution; and heterogeneity of impacts of clean and gray technologies. The innovation and improvement of the research include the following: first, it analyzed the role and mechanism of overall low-carbon tech-innovation and major categories of low-carbon technological innovation on haze pollution, expanded the research in the field of air quality benefits of current measures to cope with climate change, and expands the scope of “externalities” of low-carbon tech-innovation; second, the spatial spillover of haze is included to reveal the impact of low-carbon tech-innovation on haze pollution more accurately and completely; and third, empirical methods based on historical data are used to study the co-benefits of carbon mitigation measures, which is different from the previous simulation methods based on scenario settings.
3 Models and Data
3.1 Construction of the Spatial Econometric Model
3.1.1 Selection of the Spatial Weight Matrix
To improve the robustness of the spatial econometric model, scientific and reasonable spatial weight matrix design is indispensable. This article mainly constructs the following two common spatial weight matrices:
(1) The geographical distance spatial weight matrix (
where
(2) The economic distance spatial weight matrix (
where
3.1.2 The Spatial Correlation Model
For the analysis of flow factors, the spatial spillover effect is indispensable. Endogenous low-carbon tech-innovation will inevitably form a spillover effect, and according to new economic geography and new trade theory, regional proximity is highly correlated with the technology spillover level (Krugman, 1991), and more similar the regional innovation level and the economic development level is, the stronger the knowledge or technology spillover will be. This similarity can help reduce transaction costs or give play to “MAR externalities” (Sun et al., 2021). At the same time, haze also has trans-regional mobility, and its spatial spillover effect needs to be further discussed. Therefore, only analyzing the impact of innovation activities and environmental pollution in the same region will lead to the problem of model setting bias, and a more reasonable spatial econometric model is needed. Before building the model, global Moran’s I and local Moran’s I were first selected to test the spatial correlation between haze pollution (PM) and low-carbon tech-innovation (TI). Global Moran’s I used for the global space autocorrelation test is a common indicator, and the formula is as follows:
where
The local Moran’s I scatter plot is adopted for the local spatial correlation test, and its calculation formula is as follows9:
3.1.3 Model Specification
Considering that the basic research framework of influencing factors of environmental pollution is mainly carried out around the STIRPAT model and the EKC hypothesis10, this article discusses the role of low-carbon tech-innovation in reducing haze pollution by combining the two. The STIRPAT model based on panel data is in the form of
Considering that a major advantage of the STIRPAT model is that it can not only estimate the parameters of the model but also appropriately improve the influencing factors of the environment. This article will follow the classical EKC hypothesis to make appropriate improvements to the model11, and get Eq. 2:
In the process of building the spatial panel model, Elhorst, (2012) found that the spatial interrelationship between variables was not only reflected among regions in the current period but also influenced by the behaviors of regions in the previous period. In addition, the influence relationship of spatial dependence between regional variables is not only reflected in the region of the current period but also is affected by the key influence of the previous period due to the temporal inertia characteristics of the variables. Therefore, the modeling of the regional haze formation mechanism needs to further consider the dynamic spatial dependence in time. In addition, the spatial Durbin model (SDM) is a general form of spatial error (SEM) and the spatial lag model (SAR) and can be well used to study the dynamic spatial dependence relationship between regions. Therefore, this article will choose the dynamic spatial Durbin model (SDM) to study the effect of technological innovation in addressing climate change on haze reduction. Based on Eqs. 1, 2, the model is further improved in Eq. 3:
where
In order to further test the mechanism of low-carbon tech-innovation on haze pollution, two variables, environmental policy and industrial structure, are introduced to construct the moderating effect model and the mediating effect model, respectively. The first is the moderating effect model Eq. 4:
We multiply the core explanatory variable TI and the moderating variable EP, and analyze their spatial effects simultaneously and the mediating effect model is Eqs 5–7:
The Causal steps approach proposed by Baron and Kenny (1986) is generally adopted for the setting of the mediation effect model. Equation 5 is first regression and if
3.2 Data and Variables
3.2.1. Explained Variable
Haze pollution (PM): haze pollution is mainly caused by particulate matter (PM), which is often measured by its finer particles, PM2.5. The data used in this study were raster data from the Atmospheric Composition Analysis Group of Washington University14 based on the annual mean global PM2.5 concentration monitored by satellites. ArcGIS software was used to analyze the annual average PM2.5 concentration of Chinese provinces from 2006 to 201815.
3.2.2 Core Explanatory Variable
Low-carbon tech-innovation (TI) A is measured by Y02 category patents in the Cooperative Patent Classification System (CPC) jointly promulgated by the European Patent Office (EPO) and the United States Patent Office (USPTO) in 2013, using the number of patent applications filed by Chinese in China. CPC combines the strengths of the USPC, ECLA, and IPC to provide information on technology, functionality, and product applications. To subdivide low-carbon technologies into clean technologies and gray technologies, each subclass is identified based on the concepts of clean and gray low-carbon technologies in the existing literature, based on the class Y02 of the cooperative patent classification (Wang W. et al., 2020b). In this study, the whole Y02 category represents low-carbon technologies. The patents with the CPC code in Supplementary Appendix S1 belong to clean technologies, while the rest Y02 patents belong to gray technologies.
3.2.3 Control Variable
Control variable (X): based on the existing studies, four variables, population density, economic growth, openness, and energy structure, were selected as control variables 1) population density (POP): in this article, the ratio of population to the area of administrative division is used as a proxy index of the population size. Based on relevant studies (Fan and Xu, 2020), it is found that the agglomeration effect of the population usually leads to environmental deterioration and further aggravates haze pollution, so the coefficient of this variable is expected to be positive. 2) The level of economic development (PGDP): in this paper, per capita GDP is used to measure the regional economic development level. Referring to existing studies, there are two main views on the relationship between economic development and environmental quality16. We include the primary and secondary terms of economic growth into the model respectively to test the aforementioned two views. 3) Openness (FDI): in this article, the actual utilization of foreign direct investment in each administrative division is used to measure openness and convert into RMB according to the current USD to the RMB exchange rate. Openness to the outside world plays an important role in China’s environmental research and is an important factor that cannot be ignored. However, relevant research conclusions are not uniform, mainly manifested in two hypotheses the “Pollution Heaven” hypothesis and the “Pollution Halo” hypothesis17. 4) Energy structure (ES): in this article, the proportion of coal consumption in total energy consumption is used to measure the energy structure. China is a big coal consumer, and the massive coal-burning caused by industrialization has become an important source of haze emission in China. Therefore, the expected coefficient is positive.
3.2.4 Moderating and Mediating Variables
Environmental Policy (EP): we choose “command–control environmental regulation” to represent environmental policy. Since the environmental policy is generally considered to have a “compensation effect” or “offset effect” on technological innovation, therefore, incorporating it into the model to analyze the moderating effect is helpful to reveal what effect China’s environmental policy plays in the process of low-carbon tech innovation affecting haze pollution—compensation or offset? According to existing studies, the composite index of the emission of various pollutants is used to measure the intensity of environmental regulations. the higher the intensity of pollution discharge, the stricter the command-and-control regulation. Detailed calculation procedures are given in Supplementary Appendix S2.
Industrial structure (IS): we measure the industrial structure by the ratio of the output of the secondary industry in each province to the GDP of the year. The secondary industry is a typical high pollution industry, which has the greatest impact on environmental pollution among the three industries. Therefore, the smaller the proportion of the output value of the secondary industry in GDP is, the more reasonable and advanced the local industrial structure is; otherwise, the local industrial structure is not reasonable, and the local haze pollution should be more serious.
3.3 Data Source
In this article, the data of 30 provinces from 2006 to 2018 are selected for research, excluding Tibet, Hong Kong, Macao, and Taiwan, where the data is seriously missing. The original data of all variables are from China Statistical Yearbook and China Energy Statistical Yearbook, and the patent data measuring low-carbon technological innovation are from the incoPat database18. In this article, the natural logarithm of some variables is taken to eliminate the impact of heteroscedasticity. The descriptive statistics of variables are shown in Table 1.
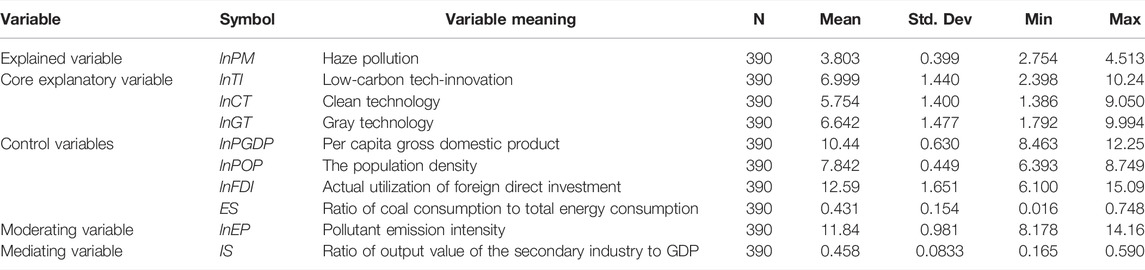
TABLE 1. Descriptive statistics of variables.
4 Empirical Analysis and Discussion
4.1 Spatial Correlation Test
In this study, Stata 16.0 software was used to test the regional spatial correlation between haze pollution and low-carbon technological innovation in China from 2006 to 2018. The calculation results of Moran’s I are shown in Tables 2, 3.
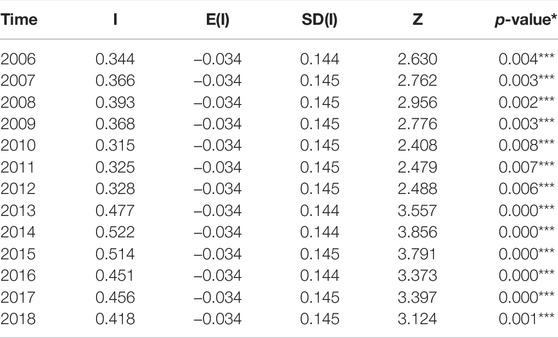
TABLE 2. Moran’s I for haze pollution.
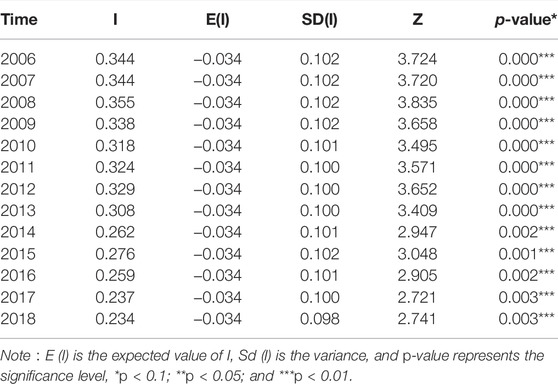
TABLE 3. Moran’s I for low-carbon tech-innovation.
We found that haze pollution in all provinces in China has a significant positive spatial correlation, that is, high pollution provinces are adjacent to high pollution provinces, and low-pollution provinces are adjacent to low-pollution provinces. In addition, according to Figure 5A,B, the scatter plot of haze concentration distribution shows that haze pollution in most provinces is located in the first and third quadrants (positive spatial correlation area), indicating that haze pollution in China presents a significant positive spatial spillover effect and “high–high” and “low–low” agglomeration characteristics.
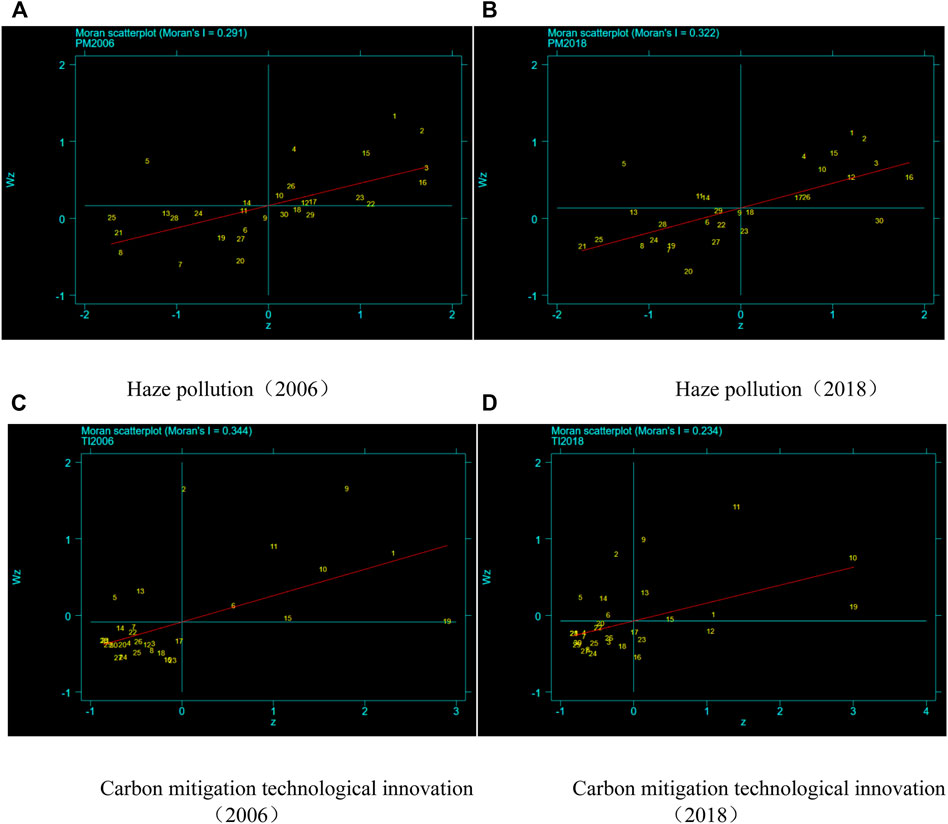
FIGURE 5. Haze pollution and low-carbon tech-innovation local Moran’s I scatter diagram. (A) Haze pollution (2006). (B) Haze pollution (2018). (C) Carbon mitigation technological innovation. (D) Carbon mitigation technological innovation.22
Meanwhile, according to Table 3, there is also a significant positive spatial correlation between low-carbon tech-innovation in China’s provinces, according to the scatter diagram of Figure 5C,D, the trend line of distribution of low-carbon tech-innovation is also located in the first and third quadrants, and the “high–high” agglomeration areas except Beijing and Shanghai are mostly concentrated in the eastern coastal areas19. It shows that China’s low-carbon tech-innovation has a strong spatial agglomeration.
4.2 Selection Test of a Spatial Econometric Model
According to the previous test, it can be confirmed that haze pollution and low-carbon tech-innovation have spatial agglomeration characteristics. Therefore, the dynamic spatial Durbin model (SDM) is constructed, and the maximum likelihood estimation method is adopted to calculate their coefficients. First, to reasonably select fixed effects and random effects, the Hausman test was used to calculate the model. The results of both spatial weight matrices showed that the null hypothesis was rejected at the significance level of 1%, indicating that the fixed effects model should be selected. Second, to further prove the rationality of choosing the spatial Durbin model, the LM test and LR test were carried out under fixed effects20, which further proves that it is reasonable to construct the spatial econometric model. To ensure the robustness of the model, the LR test is carried out, and the results show that LR values of SAR and SEM models are 62.15 and 56.61, respectively. Both of them passed the significance level test of 1%. Therefore, the SDM model cannot be degraded to SAR and SEM models.
Meanwhile, before testing, according to Eq. 3, we compared the adjusted R2 value and the log-likelihood function value of three types of a fixed effect in the spatial Durbin model (including temporal fixed effect, individual fixed effect, and spatial–temporal fixed effect), and the economic meaning of the estimated coefficient of the explanatory variable, it is found that the spatial–temporal fixed effect of the dynamic spatial Durbin model is the best. Therefore, the spatial Durbin model under the spatial–temporal fixed effect was selected for the next test.
4.3 Empirical Results of Dynamic SDM
In Table 4, we listed the ordinary least squares (OLS), fixed effects model (FE), the static spatial Durbin model, and the dynamic spatial Durbin model under two kinds of weighting matrices. We focus on analyzing the regression results of Models 4) and 5) because we choose a dynamic spatial Durbin model.
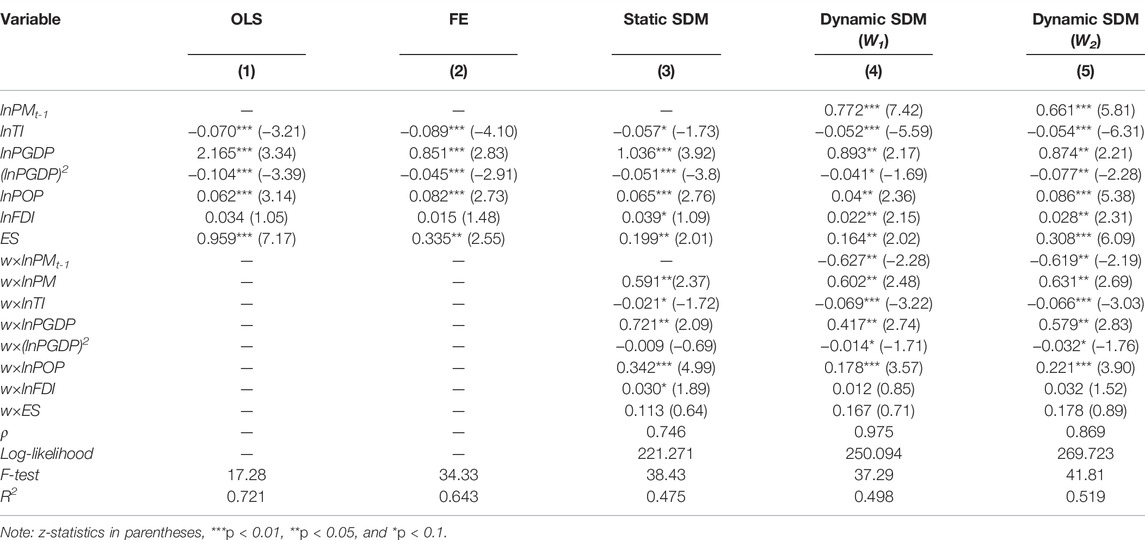
TABLE 4. Empirical results of low-carbon technology innovation and haze pollution.
4.3.1 Temporal and Spatial Effects of Haze Pollution
We find that the results of model regression under the two spatial weight matrices of the geographical distance matrix and the economic distance matrix are relatively consistent, including the positive and negative coefficients and the significance level. From the perspective of the time dimension, the first-stage lag term coefficient of haze pollution
4.3.2 Low-Carbon Tech-Innovation and Haze Pollution
According to Table 4, under the two spatial weight matrices, the coefficient of low-carbon tech-innovation is significantly negative at the significance level of 1%, indicating that low-carbon tech-innovation has significantly inhibited haze pollution. While the path of technological haze control is effectively supported, it also shows that while addressing climate change, low-carbon tech-innovation has also brought significant air quality benefits, indicating that it has become a key path to tackle haze pollution, and pointing out the policy direction for addressing air pollution. Meanwhile, the spatial lag of low-carbon tech-innovation passed the significance level test of 1% and was negative, that is, when the low-carbon innovation activity in the surrounding area increased by 1%, the haze pollution level in the region would decrease by about 0.069%. On the one hand, this shows that the environmental pollution caused by haze pollution has gradually been paid attention to, and it has become the consensus of all regions to invest in the treatment of environmental quality problems through low-carbon technological innovation activities, on the other hand, the neighboring region alleviates haze pollution through input in innovation activities and has a “demonstration effect” in the region under the effect of positive externalities.
4.3.3 Control Variables
(1) Population density (POP): according to Table 4, we find that the coefficient of population density is positive, and through the significance level of 1%, it indicates that under the fixed administrative area of each region, more the population, more the serious haze pollution. This is consistent with the study of Fan and Xu. (2020), indicating that population density mainly stimulates the generation of haze pollution through the agglomeration effect23. (2) Economic growth (PGDP): the result of the test shows that the per capita GDP of the primary and secondary items are negative, and with a significant coefficient under the 1% significance level, the inverted U-shaped relationship between regional economic growth and haze pollution has been verified, indicating that the regional haze pollution level increases first and then decreases with the continuous improvement of regional economic development level, which is consistent with the findings of Gan et al. (2020). (3) Openness (FDI): the results of Table 4 show that the coefficient of openness is positive at the significance level of 5%, indicating that the amount of foreign capital directly utilized in a region will aggravate haze pollution. “Pollution Heaven,” which aims at the relationship between foreign direct investment and environmental quality, is established. This proves the findings of Kamal et al. (2021), but its spatial effect is not obvious. (4) Energy structure (ES): coal consumption is still the source of haze pollution, and there is still a long way to go in China’s energy structure transformation. Whether the energy structure improvement in one region has not affected the improvement of haze pollution in the surrounding areas, also shows that the energy structure of China’s provinces is still very unreasonable and has not reached the height of joint governance.
4.3.4 Decomposition Effects of Low-Carbon Tech-Innovation on Haze Pollution
When there is a spatial spillover effect, the change of an explanatory variable will not only affect the explained variable in the local area but also the explained variable in the surrounding area, and in turn affects the local area through the feedback effect (Lichtenberg and Potterie, 1998; Elhorst, 2014). Therefore, the estimated coefficient mentioned earlier is not rigorous enough to directly reflect the marginal effect of independent variables on dependent variables and is only effective in the direction of action and the significance level. Therefore, this article further decomposed the influence of various influencing factors on haze pollution into direct and indirect effects24. As the dynamic spatial Durbin model is adopted in this article, in terms of the time dimension, the direct and indirect effects can be divided into short-term effect and long-term effect, respectively, reflecting the short-term immediate impact of various factors on haze emission and the long-term impact considering time lag. Under the two spatial weight matrices, the effect decomposition results of each factor are shown in Tables 5, 6.
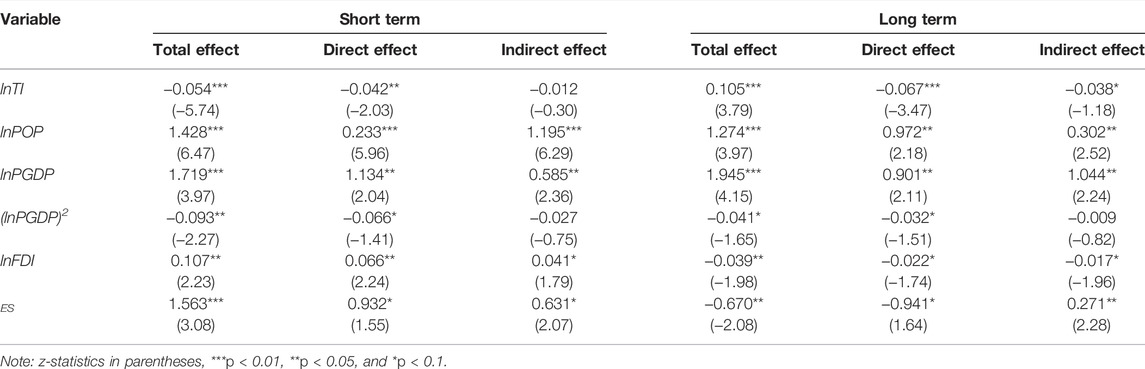
TABLE 5. Decomposition effects of low-carbon tech-innovation on haze pollution (W1).

TABLE 6. Decomposition effects of low-carbon tech-innovation on haze pollution (W2).
According to Tables 5, 6, it is found that there is no significant difference in model regression results under the two spatial weight matrices, and the absolute value of the influence coefficient of most long-term effects is greater than that of short-term effects, whether direct or indirect, which indicates that each factor has a more profound long-term impact on haze pollution. The low-carbon tech-innovation coefficient is negative both in the short term and the long term, indicating that low-carbon tech-innovation has successfully restrained haze pollution, that is, the haze reduction effect of low-carbon technology can continue to play a role, which is conducive to China’s use of it to achieve the dual goal of reducing carbon and haze. The direct effect of low-carbon tech-innovation shows that it can significantly inhibit haze pollution in the region both in the short term and the long term. The reason may be that high-intensity low-carbon tech-innovation can bring local industrial structure optimization and reduce the use of high carbon and high pollution fuels to achieve the dual goals of reducing carbon and haze. However, the indirect effect is different. In the short term, the coefficient of low-carbon tech-innovation is negative but not significant. In the long term, the coefficient of low-carbon tech-innovation is negative and significant, indicating that in the short term, the regional low-carbon tech-innovation activities are not enough to have an impact on haze pollution in the surrounding area, and it takes a certain time for this effect to occur. The reason may be that a certain amount of technical innovation in the short term can be adopted by enterprises, thus helping to suppress the fog haze pollution in the region, but this technological innovation is not easily spread in the short term, that is, the knowledge is monopolized, therefore the innovation of air quality benefit is confined to the area, there is no pull function form of radiation. But in the long run, the diffusion of technology or spillover of knowledge leads to technological innovation by enterprises in surrounding areas, which helps improve local air quality.
4.4 Heterogeneity Analysis
Considering the importance of diversity and classification of low-carbon technologies internal (Acemoglu et al., 2016; Aghion et al., 2016), we divide low-carbon tech-innovation into two categories — clean tech-innovation and gray tech-innovation, and test the effectiveness of the two low-carbon technologies in haze pollution control. See Table 7 for the results. According to the test results, the estimate coefficients of clean and gray tech-innovation are negative, and through a 1% significance level inspection, it shows that both clean and gray technologies play an important role in the prevention and control of local haze pollution, but the role of gray tech-innovation in the suppression of haze pollution is stronger than that of clean tech-innovation, and there may be three reasons. First, the number of gray technology patents in China is much larger than that of clean technology, indicating that the maturity of gray technology may be stronger than that of clean technology. Second, gray technology is not carbon-free but can reduce carbon emissions, with lower R&D costs and easy market promotion, especially adopted by high pollution enterprises to cope with the government’s strict environmental policies. Third, China’s current energy structure is still not perfect, the coal consumption is huge, the space in the use of clean energy development also hindered the development of clean technology at the same time, one can imagine that China’s current low-carbon technologies are still biased toward gray technology, and with the improvement of the economic structure, the future of bias technology will change direction to clean technology.
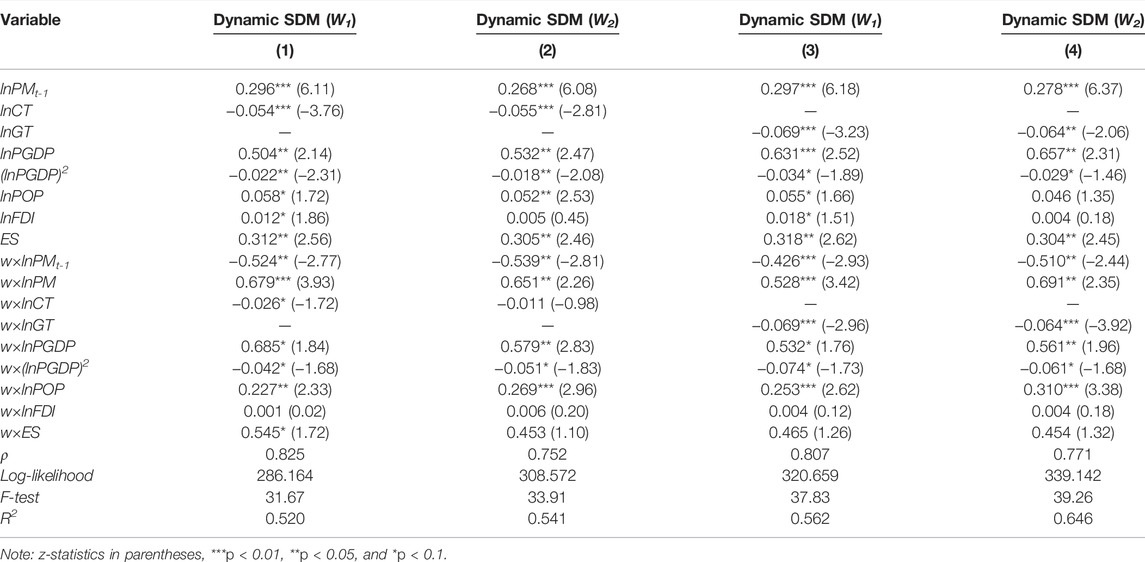
TABLE 7. Different types of low-carbon tech-innovation on haze pollution.
In addition, the estimation results of the spatial lag coefficient of innovation of the two low-carbon technologies show significant differences. Gray technology is significantly negative at a 1% level, while clean technology, though negative, does not pass the significance test. This difference shows that compared with clean technology, gray technology could better cross geographical barriers, realize interregional diffusion, and greatly reduce the haze pollution of the surrounding areas through the spatial spillover effect, the reason may be that the R&D cost of gray tech-innovation is relatively low, and the monopoly benefit is less, and lead to its high degree of diffusion, However, clean technology, as a carbon-free or negative emission technology, has a high cost of research and development. Although it has good positive externalities, its overflow channels are blocked and its diffusion effect is poor, showing a little effect on reducing haze.
4.5 Mechanism Analysis
To test the two possible mechanisms proposed in Section 2.3, we conducted model regression according to Eqs 4–7, respectively25.
According to the regression results of Model (1) in Table 8, although we found that the interaction coefficient between environmental policy and low-carbon tech-innovation is negative at the significance level of 5%, the coefficient decreases significantly, indicating that under the implementation of strict environmental policy, the effect of technological innovation is partially offset. This is consistent with Jaffe et al. (2002) and Popp et al. (2009), environmental policies bring about “innovation offsetting” effects, the reason may be that the current tech-innovation itself needs a lot of costs, and it takes a long time to develop, in the short term it cannot meet the requirements of environmental monitoring, so some companies may be given up technology to reduce emissions path for industrial migration or temporarily shut down high emissions department, this has weakened the low-carbon tech-innovation curb haze pollution effect. Meanwhile, according to Model (2) and Model (3), classifying the low-carbon tech-innovation and testing the regulating effect of environmental policy, we found that the “innovation offsetting” effect particularly on clean tech-innovation, shows that after strict environmental policies are implemented, enterprises will be more inclined to gray tech-innovation rather than clean technology. There are two main reasons. First, the cost of gray tech-innovation is low, and the effect is fast, so it can be quickly used to deal with the government’s environmental regulation. Second, the enterprises most affected by the government’s environmental policies are generally highly polluting enterprises. It is impossible to achieve a clean transformation in a short time, so they can only seek gray tech-innovation to reduce pollution emissions.

TABLE 8. Moderating effect of environmental policy.
The spatial lag coefficients of each interaction item are all negative and significant at the significance innovation in a region that plays a joint role not only in the local area but also contributes to the alleviation of haze pollution in other surrounding regions. The possible reason is that the implementation of environmental policies in one region has a warning effect on enterprises in other regions, and local enterprises will immediately take countermeasures to avoid future changes in local environmental policies. But the spillover effect will decrease with the emergence of environmental policy, the possible reason is that the strengthening of local environmental policies increases the cost of tech-innovation of enterprises and the marginal benefit of technological monopoly, which will lead to technology spillover difficulties and blocked knowledge flow, thus affecting the innovation activity of other surrounding areas and weakening the effect of low-carbon tech-innovation in curbing haze pollution.
According to Table 9, we found that low-carbon tech-innovation can promote the upgrading of industrial structures to suppress haze pollution; in addition, CT and GT also help promote the development of the industrial structure upgrade, in the long run, will help control haze pollution. A large number of tech-innovations will drive the improvement of regional innovation levels. On the one hand, it will help to form an innovation cluster network, promote industrial integration, reduce the living space of high pollution enterprises, and promote the green transformation of regional industrial structure. On the other hand, the positive externalities of technological innovation contribute to the formation of knowledge spillover and technology diffusion, improve the level of technological innovation in the surrounding region, and form the trend of innovation spread. In the long term, it will contribute to the upgrading of the overall industrial structure inside and outside the region. Further analysis of the heterogeneity of low-carbon tech-innovation shows that gray tech-innovation helps reduce enterprise pollution emissions and is easy to spread, which will contribute to the positive externalities of technological innovation and help the whole industry gradually form the concept of green production, energy-saving production, and resource protection, and clean tech-innovation as no carbon or negative carbon technology, represents the future direction of low-carbon technology, a large number of clean technology innovations are conducive to the emergence and development of new sectors or industries, such as the new energy automobile industry. In the long run, this is bound to bring about the upgrading of the entire industry and fundamentally change the original traditional production forms or production technologies.
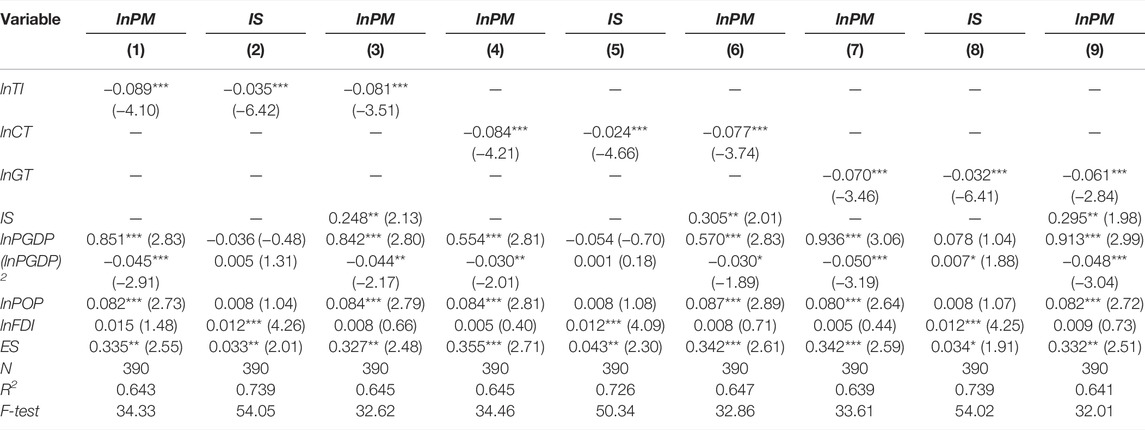
TABLE 9. Mediating effect of industrial structure.
4.6 Robustness Test
In Section 3.1, we construct two spatial weight matrices, namely the geographical distance matrix and the economic distance matrix. To comprehensively reflect the dual characteristics of spatial geographical distance and economic attributes, we construct the spatial economic distance matrix W3 by referring to Fingleton and Gallo (2008). The specific expression is Eq. 11:
where
5 Conclusion and Policy Implications
In this study, the STIRPAT model and the classical EKC hypothesis were combined to construct a dynamic spatial econometric model to study the spatial spillover effects of haze pollution and low-carbon technological innovation; the co-benefits and internal mechanism of low-carbon technological innovation to tackle climate change on haze pollution control; and the heterogeneity and synergy of clean technology and gray technology on haze pollution control, the following conclusions, and policy implications are obtained.
(1) Both haze pollution and low-carbon technological innovation in China show significant spatial agglomeration characteristics and spatial spillover effects. The polluted areas are mainly concentrated in the Beijing–Tianjin–Hebei region and energy-consuming provinces. From the perspective of time, haze pollution has “path dependence,” showing a “snowball effect;” from the perspective of space, haze pollution shows an obvious spatial spillover effect, showing the situation of “both prosperity and loss,” which is consistent with the conclusion of Wang et al. (2022). From the perspective of spatial–temporal dimensions, the haze pollution in one region in the previous period can effectively suppress the haze pollution in other surrounding areas, indicating that the good warning function of regions has been played, which supports the findings of Feng and Wang. (2019). Low-carbon tech-innovation is mainly concentrated in East China, including Beijing and Guangzhou. In addition, China’s current low-carbon tech-innovation has become an important path to alleviating haze pollution, and technology spillover plays an important role in curbing haze pollution.
(2) The positive externalities of low-carbon tech-innovation in haze treatment have been expanded, and the long-term co-benefits of haze reduction have been clarified. On the one hand, low-carbon tech-innovation to address climate change also brings co-benefits to local air quality, and the path of technology to cure haze has been clarified. On the other hand, regional long-term knowledge accumulation, knowledge spillover, and diffusion of low-carbon technologies will lead to such co-benefits not only locally but also help curb haze pollution in surrounding areas and give play to the positive externalities of technological innovation. In addition, industrial structure and environmental policy play a mediating and moderating role respectively in this process, but environmental policy shows an obvious “innovation offset” effect, which weakens the role of low-carbon tech-innovation, especially in clean technology innovation. Contrary to what supporters of the Porter hypothesis believe, our findings support the views of Jaffe et al. (2002) and Popp et al. (2009).
(3) There are obvious differences between clean tech-innovation and gray tech-innovation in suppressing haze pollution. Heterogeneity analysis shows that gray tech-innovation has a stronger effect on haze pollution suppression than clean tech-innovation, and gray tech-innovation can better overcome geographical barriers to achieve cross-regional diffusion, while clean tech-innovation is more vulnerable to environmental policies. However, both of them can promote the upgrading of China’s industrial structure and thus improve air quality.
(4) Both population density and coal-based energy consumption structure are the important ways of haze pollution, the research of Fan and Xu. (2020) has been verified. Economic development and environmental pollution show an inverted U-shaped trend, that is, the haze pollution level increases first and then decreases with the improvement of the economic development level, this is consistent with Kearsley and Riddel, (2010) and Gan et al. (2020). Foreign direct investment has brought obvious haze pollution, and the “Pollution Heaven” hypothesis has been verified and is consistent with the findings of Kamal et al. (2021).
According to the aforementioned conclusions, the following policy implications can be obtained:
(1) It is necessary for policymakers to strengthen the top-level policy design and establish a long-term mechanism for haze control and joint prevention and control mechanism. As a systematic and long-term project, haze control requires an overall concept and comprehensive strategic deployment. First of all, dealing with the spatial agglomeration of haze pollution needs to focus on key provinces with haze outbreaks, namely, high–high agglomeration areas such as the Beijing–Tianjin–Hebei region. Second, the higher level government should strengthen guidance, while focusing on regional rectification, quickly establish trans-regional departments and institutions, strengthen regional cooperation, establish coordination mechanisms such as information sharing and joint law enforcement to ensure the smooth progress of joint prevention and control and coordinated governance, and take into account all factors. Additionally, in this process, it is necessary to strengthen supervision and improve relevant laws and regulations to avoid the emergence of free-riding behavior in some regions and the rebound of haze pollution.
(2) The government should make comprehensive use of environmental policy means and market means to guide enterprises to develop low-carbon technologies and give full play to the co-benefits of low-carbon tech-innovation in reducing haze. High-profile low-carbon tech-innovation as a key means to respond to climate change caused by the air quality in co-benefits must be fully effective mining. First, local governments should actively guide low-carbon innovation activities into a consensus. In addition to the implementation of relatively strict environmental regulations, relevant preferential measures should be developed to encourage enterprises to carry out low-carbon tech-innovation, reverse the “innovation offset” effect caused by environmental policies on enterprises, reduce compliance costs of enterprises, and increase the marginal benefits of technological innovation. Second, the concentration regions of haze pollution and low-carbon tech-innovation are not consistent, which shows that each region should improve the market mechanism, speed up the implementation of talent introduction strategy and create a better innovation environment, guide the optimization and integration of industrial structure to promote the rational allocation of factors, and accelerate knowledge spillover and low-carbon technology diffusion between regions, to improve the efficiency of technology in haze treatment.
(3) Short-term encouragement of gray tech-innovation and long-term support for clean tech-innovation should be combined to promote biased low-carbon technical change and green upgrading of industrial structure step by step. First, the government should comprehensively consider the heterogeneity of low-carbon technology innovation, establish a low-carbon technology development plan, and handle the relationship between gray technology and clean technology. On the one hand, effective environmental policies and market means should be adhered to promote the sustainable and stable development of gray technology innovation. On the other hand, flexible environmental policy should be focused on minimizing its impact on clean technology innovation. Second, technical cooperation and exchanges between regions should be encouraged, especially for clean technologies such as renewable energy technologies and negative emission technologies. Governments in heavily polluted areas should not only strengthen the gray technology innovation capacity within the region but also actively encourage enterprises to introduce clean technology innovation outside the region to improve the local industrial structure and reverse the long-term path dependence. Enterprises in regions with strong innovation capacity should actively fulfill their corporate social responsibility to help neighboring regions develop clean technologies and form a win–win situation of interregional cooperation. Finally, decision-makers should correctly guide the direction of technology development, change the competitive relationship between clean and gray technologies into a complementary relationship, and create a good innovation environment to increase the intensity of talent introduction and R&D investment to bring breakthrough technology innovation output, and orderly guide technology transition to the clean technology track.
(4) It is essential for the government to properly control the entry of foreign investment and improve the entry threshold of industries producing high energy consumption by strengthening the “clean” screening of foreign investment, to change the “Pollution heaven” phenomenon of foreign direct investment in haze control. In addition, the local government should optimize the urban spatial structure, pay attention to urban green design, and improve urban transportation infrastructure (such as high-speed rail and subway) to prevent the excessive concentration of population from causing more serious haze pollution. On this basis, regional coordination should be strengthened to promote win–win cooperation and cooperation mechanism for haze pollution control, prevent a “race to the bottom” among governments, and gradually reduce the proportion of coal in energy consumption and optimize the energy structure to promote green economic growth.
According to the findings of this study, we believe that there are three directions for future research:
(1) The study of co-benefits between climate change and air pollution is one of the priorities in the field of environmental science and environmental economics. In the future, policy evaluation and technical methods for addressing climate change can be used to evaluate the co-benefits of air quality, or even to study carbon reduction and haze reduction simultaneously, that is, “shooting two hawks with one arrow.”
(2) Low-carbon tech-innovation is not only a key means to alleviate global climate change but also can produce many other benefits. Therefore, the research on actively broadening the externalities of low-carbon tech-innovation will become one of the hot spots in the future. Under the theory of endogenous growth, it is necessary to analyze the environmental, health, and economic benefits of endogenous technological innovation systematically, and it is not limited to low-carbon and green technologies.
(3) Low-carbon tech-innovation can be studied from dynamic and spatial perspectives, but it is not deep enough. In the future, the analysis of the environmental, economic, and health benefits of the diffusion of carbon reduction technologies should be more potential and detailed than innovation. Moreover, technology diffusion and knowledge spillover are not limited to one country, but often take most countries in the world as the research target, which is a global network. Meanwhile, it is essential to combine technology heterogeneity analysis with biased technology change. Exploring or changing the direction of carbon mitigation or other environment-friendly technology is of great significance for improving national industrial and energy structure and promoting green economic growth.
Data Availability Statement
The original contributions presented in the study are included in the article/Supplementary Material, further inquiries can be directed to the corresponding authors.
Author Contributions
SJ: writing—original draft, data curation, and methodology. WW: conceptualization, project administration, writing—review and editing and supervision. SAQ: data curation and investigation. CZ: conceptualization and data curation. NL: funding acquisition and formal analysis. GZ: investigation and software. JW: investigation and data curation.
Funding
This work was supported by the National Natural Science Foundation of China (Grant No. 72104091),Humanities and Social Science Research Youth Foundation of Ministry of Education in China (Grant No. 21YJCZH097),and Jiangsu Funds for Social Science (Grant No. 17GLB020).
Conflict of Interest
The authors declare that the research was conducted in the absence of any commercial or financial relationships that could be construed as a potential conflict of interest.
Publisher’s Note
All claims expressed in this article are solely those of the authors and do not necessarily represent those of their affiliated organizations, or those of the publisher, the editors, and the reviewers. Any product that may be evaluated in this article, or claim that may be made by its manufacturer, is not guaranteed or endorsed by the publisher.
Supplementary Material
The Supplementary Material, for this article can be found online at: https://www.frontiersin.org/articles/10.3389/fenvs.2022.893194/full#supplementary-material
Footnotes
1https://www.mee.gov.cn/hjzl/sthjzk/zghjzkgb/202105/P020210526572756184785.pdf.
2https://www.who.int/zh/health-topics/air-pollution#tab=tab_1.
3http://www.gov.cn/fuwu/2019-12/10/content_5459931.htm.
4Guangdong, Jiangsu, and Shandong have the highest number of low-carbon patent applications.
5Clean technology refers to low-carbon technologies related to zero-carbon production or consumption, while gray technology is not absolutely carbon-free, but has the potential to save energy or mitigate climate change.
6For example, in addition to the influence of Beijing on Tianjin and Hebei, which are geographically close to each other, we cannot ignore the influence of Beijing on other regions, which are geographically close to each other.
7In real economic life, in addition to being affected by geographical proximity, a higher level of economic development in a region will also bring a certain radiation pull effect on the relatively low level of economic development in the region.
8When Moran’s I > 0, it indicates that the overall existence space is positively autocorrelated. When Moran’s I < 0, it means that there is negative spatial autocorrelation. If Moran’s I is close to 0, it indicates that there is no spatial correlation between regions.
9When Moran’s I > 0, it indicates that there is positive spatial autocorrelation on the whole, that is, areas with high haze pollution gather together (High–High), and areas with low haze pollution gather together (Low–Low). When Moran’s I < 0, it indicates that there is negative spatial autocorrelation, that is, low-value regions usually gather around high-value regions (Low–High), or high-value regions usually gather around low-value regions (High–Low). If Moran’s I is close to 0, it indicates that there is no obvious aggregation between regions.
10According to EKC hypothesis, there is an inverted U-shaped relationship between economic development and environmental pollution. In the early stages of development, economic growth without regard to environmental protection will exacerbate environmental pollution. When a certain level is reached, the economic structure will be adjusted and environmental quality will become the focus again (Usman and Jahanger, 2021).
11On the basis of the general model, we add the quadratic term representing the economic level. (A) If the quadratic term coefficient is negative and the primary term coefficient is positive after regression, it indicates that the EKC hypothesis is established.
12Including per capita GDP, openness, population density, and energy structure.
13It reflects the impact of low-carbon tech-innovation in this region on haze emission in the neighboring region. If the estimation result of this coefficient is significantly positive, it indicates that the technological innovation in this region has significantly aggravated the haze pollution level in the neighboring region. If the estimation result is significantly negative, it indicates that the regional technological innovation has significantly suppressed the haze pollution level in the neighboring areas. If not significant, it indicates that the relationship between the two variables is not obvious.
14https://sites.wustl.edu/acag/datasets/surface-pm2-5/
15The reason is that although the actual monitoring data collected by ground observation stations with their own advantages can more truly reflect the haze pollution situation of the stations, the distribution of the PM2.5 concentration is not limited to a single station, and there are significant spatial differences in the same area. Therefore, if the data of ground monitoring stations are used for analysis, It will only provide a rough measurement of the haze pollution situation in the region, which will bring a large error to the actual estimation results. By contrast, satellite-based data on haze pollution concentrations (PM2.5) can be used to give a more accurate picture of a region’s PM2.5 concentration.
16Some scholars believe that the economic scale effect is still the dominant factor leading to environmental pollution problems in China at the present stage, so there is a linear relationship between the two (Kearsley and Riddel, 2010). On the other hand, the regional economic development level shows the Kuznets effect in the process of affecting environmental pollution, that is, with the improvement of the economic development level, environmental quality will first deteriorate and then gradually improve in an inverted “U-shaped” nonlinear relationship (Gan et al., 2020).
17The former generally believes that for economic development, regions will attract foreign investment through “competition to the bottom” and export resource-consuming products, which also aggravate environmental pollution (Kamal et al., 2021). The latter believes that FDI can bring significant environmental improvement, which is highlighted in three aspects: the improvement of economic level leads to the enhancement of local environmental awareness (Opoku et al., 2021); the stricter environmental standards of foreign-funded enterprises reduce local environmental pollution (Luo et al., 2021); and the emerging technologies brought by foreign-funded enterprises also help improve local environmental quality (Wang and Luo, 2020).
19Shandong, Jiangsu, Shanghai, Zhejiang and Fujian.
20The test results showed that the values of LM-lag, Robust LM-lag, LM-error, and Robust LM-error were 180.482, 18.791, 204.195, and 23.938, respectively, p values reject the null hypothesis at the significance level of 1%.
21On the one hand, the problem of environmental quality deterioration caused by haze pollution should be paid attention to immediately, and the layout and implementation of relevant control work should not be delayed. On the other hand, the treatment work should be carried out for a long time to avoid the “rebound” phenomenon of pollution after treatment.
22Note: 1-Beijing, 2-Tianjin, 3-Hebei, 4-Shanxi, 5-Neimenggu, 6-Liaoning, 7-Jilin, 8-Heilongjiang, 9-Shanghai, 10-Jiangsu, 11-Zhejiang, 12-Anhui, 13-Fujian, 14-Jiangxi, 15-Shandong, 16-Henan, 17- Hubei, 18-Hunan, 19-Guangdong, 20-Guangxi, 21-Hainan, 22-Chongqing, 23-Sichuan, 24-Guizhou, 25-Yunnan, 26-Shaanxi, 27-Gansu, 28-Qinghai, 29-Ningxia, and 30-Xinjiang
23Agglomeration effect refers to the haze pollution caused by the demand for housing, household appliances, and motor vehicles by people in areas with high population density, and the concentration of pollutants generated by motor vehicle fuel combustion due to the high residential density is not conducive to air circulation, thus causing haze pollution. The scale effect refers to the fact that population clustering alleviates haze pollution by improving the utilization rate of public transportation and sharing pollution control and emission reduction facilities.
24Direct effect refers to the influence of a factor change on haze pollution in the region, which includes the feedback effect, but its value is small and can generally be ignored. Indirect effect refers to the influence of the change of a local factor on haze pollution in other regions, namely, the spatial spillover effect of an influencing factor.
25The specific results are shown in Tables 8, 9. Due to space limitation, we will only show the regression results under economic distance matrix (W2).
References
Acemoglu, D., Aghion, P., Bursztyn, L., and Hemous, D. (2012). The Environment and Directed Technical Change. Am. Econ. Rev. 102 (1), 131–166. doi:10.1257/aer.102.1.131
Acemoglu, D., Akcigit, U., Hanley, D., and Kerr, W. (2016). Transition to Clean Technology. J. Polit. Economy 124 (1), 52–104. doi:10.1086/684511
Aghion, P., Dechezleprêtre, A., Hémous, D., Martin, R., and Van Reenen, J. (2016). Carbon Taxes, Path Dependency, and Directed Technical Change: Evidence from the Auto Industry, Path Dependency and Directed Technology Change: Evidence from the Auto Industry. J. Polit. Economy 124 (1), 1–51. doi:10.1086/684581
Anke, C.-P., Hobbie, H., Schreiber, S., and Möst, D. (2020). Coal Phase-Outs and Carbon Prices: Interactions between EU Emission Trading and National Carbon Mitigation Policies. Energy Policy 144, 111647. doi:10.1016/j.enpol.2020.111647
Barbera, A. J., and McConnell, V. D. (1990). The Impact of Environmental Regulations on Industry Productivity: Direct and Indirect Effects. J. Environ. Econ. Manage. 18 (1), 50–65. doi:10.1016/0095-0696(90)90051-y
Baron, R., and Kenny, D. (1986). The moderator-mediator variable distinction in social psychological research: conceptual, strategic, and statistical considerations. J. Pers. Soc. Psychol. 51 (1173), 1182–7523.
Brian, J., Peter, J., Nicholas, Z., Allen, L., Steven, J., Davis, J., et al. (2020). Optimizing Emissions Reductions from the U.S. Power Sector for Climate and Health Benefits. Environ. Sci. Technol. 54 (12), 7513–7523. doi:10.1021/acs.est.9b06936
Cai, W., Hui, J., Wang, C., Zheng, Y., Zhang, X., Zhang, Q., et al. (2018). The Lancet Countdown on PM2·5 Pollution-Related Health Impacts of China's Projected Carbon Dioxide Mitigation in the Electric Power Generation Sector under the Paris Agreement: a Modelling Study. Lancet Planet. Health 2, e151–161. doi:10.1016/S2542-5196(18)30050-0
Chang, S., Yang, X., Zheng, H., Wang, S., and Zhang, X. (2020). Air Quality and Health Co-benefits of China's National Emission Trading System. Appl. Energ. 261, 114226. doi:10.1016/j.apenergy.2019.114226
Chyi, Y.-L., Lai, Y.-M., and Liu, W.-H. (2012). Knowledge Spillovers and Firm Performance in the High-Technology Industrial Cluster. Res. Pol. 41, 556–564. doi:10.1016/j.respol.2011.12.010
Cui, J., Dai, J., Wang, Z., and Zhao, X. (2022). Does Environmental Regulation Induce green Innovation? a Panel Study of Chinese Listed Firms. Technol. Forecast. Soc. Change 176, 121492. doi:10.1016/j.techfore.2022.121492
Ding, X., and Shahzad, M. (2022). Environmental Administrative Penalty, Environmental Disclosures, and the Firm’s Cash Flow: Evidence from Manufacturing Firms in China. Environ. Sci. Pollut. Res. 14, 22–29. doi:10.1007/s11356-021-18145-3
Driscoll, C. T., Buonocore, J. J., Levy, J. I., Lambert, K. F., Burtraw, D., Reid, S. B., et al. (2015). US Power Plant Carbon Standards and Clean Air and Health Co-benefits. Nat. Clim Change 5 (6), 535–540. doi:10.1038/nclimate2598
Elhorst, J. P. (2012). Dynamic Spatial Panels: Models, Methods, and Inferences. J. Geogr. Syst. 14 (1), 5–28. doi:10.1007/s10109-011-0158-4
Elhorst, J. P. (2014). Spatial Econometrics: From Cross-Sectional Data to Spatial Panels. Heidelberg: Spring.
Fan, X., and Xu, Y. (2020). Convergence on the Haze Pollution: City-Level Evidence from China. Atmos. Pollut. Res. 11 (6), 141–152. doi:10.1016/j.apr.2020.03.004
Feng, Y., Wang, X., and Liang, Z. (2021). How Does Environmental Information Disclosure Affect Economic Development and Haze Pollution in Chinese Cities? the Mediating Role of green Technology Innovation. Sci. Total Environ. 775, 145811. doi:10.1016/j.scitotenv.2021.145811
Feng, Y., and Wang., X. (2019). Effects of Urban Sprawl on Haze Pollution in China Based on Dynamic Spatial Durbin Model during 2003-2016. J. Clean. Prod. 242, 118368. doi:10.1016/j.jclepro.2019.118368
Fingleton, B., and Le Gallo, J. (2008). Estimating Spatial Models with Endogenous Variables, a Spatial Lag and Spatially Dependent Disturbances: Finite Sample Properties*. Pap. Reg. Sci. 87 (3), 319–339. doi:10.1111/j.1435-5957.2008.00187.x
Gan, T., Liang, W., Yang, H., and Liao, X. (2020). The Effect of Economic Development on Haze Pollution (PM2.5) Based on a Spatial Perspective: Urbanization as a Mediating Variable. J. Clean. Prod. 266, 121880. doi:10.1016/j.jclepro.2020.121880
Gan, T., Yang, H., and Liang, W. (2021). How Do Urban Haze Pollution and Economic Development Affect Each Other? Empirical Evidence from 287 Chinese Cities during 2000-2016. Sustain. Cities Soc. 65, 102642. doi:10.1016/j.scs.2020.102642
Garcia-Menendez, F., Saari, R. K., Monier, E., and Selin, N. E. (2015). U.S. Air Quality and Health Benefits from Avoided Climate Change under Greenhouse Gas Mitigation. Environ. Sci. Technol. 49, 7580–7588. doi:10.1021/acs.est.5b01324
Gehrsitz, M. (2017). The Effect of Low Emission Zones on Air Pollution and Infant Health. J. Environ. Econ. Manage. 83, 121–144. doi:10.1016/j.jeem.2017.02.003
Horace, H., and Robin, R. (2006). Technological Innovation, Energy Efficient Design and Then Rebound Effect. Technovation 27 (4), 194–203. doi:10.1016/j.technovation.2006.11.004
Horbach, J., Rammer, C., and Rennings, K. (2012). Determinants of Eco-Innovations by Type of Environmental Impact - the Role of Regulatory Push/pull, Technology Push and Market Pull. Ecol. Econ. 78 (6), 112–122. doi:10.1016/j.ecolecon.2012.04.005
Jaffe, B., Newell, R. G., and Stavins, R. N. (2002). Environmental Policy and Technological Change. Environ. Res. Econ. 22 (1–2), 41–70. doi:10.1023/a:1015519401088
Jahanger, A., Usman, M., Murshed, M., Mahmood, H., and Balsalobre-Lorente, D. (2022). The Linkages between Natural Resources, Human Capital, Globalization, Economic Growth, Financial Development, and Ecological Footprint: The Moderating Role of Technological Innovations. Resour. Pol. 76, 102569. doi:10.1016/j.resourpol.2022.102569
Jin, C., Shahzad, M., Zafar, A. U., and Suki, N. M. (2022). Socio-economic and Environmental Drivers of green Innovation: Evidence from Nonlinear ARDL. Econ. Research-Ekonomska Istraživanja, 1–21. Ekonomska istraživanja. ahead-of-print(ahead-of-print). doi:10.1080/1331677x.2022.2026241
João, L., Joaquim, F., and Ernesto, S. (2022). New Insights into Decoupling Economic Growth, Technological Progress and Carbon Dioxide Emissions: Evidence from 40 Countries. Technol. Forecast. Soc. Change 174, 121250. doi:10.1016/j.techfore.2021.121250
Kamal, M., Usman, M., Jahanger, A., and Balsalobre-Lorente, D. (2021). Revisiting the Role of Fiscal Policy, Financial Development, and Foreign Direct Investment in Reducing Environmental Pollution during Globalization Mode: Evidence from Linear and Nonlinear Panel Data Approaches. Energies 14 (21), 6968. doi:10.3390/en14216968
Kearsley, A., and Riddel, M. (2010). A Further Inquiry into the Pollution Haven Hypothesis and the Environmental Kuznets Curve. Ecol. Econ. 69, 905–919. doi:10.1016/j.ecolecon.2009.11.014
Krugman, P. (1991). Increasing Returns and Economic Geography. J. Polit. Economy 99, 483–499. doi:10.1086/261763
Li, N., Chen, W., Rafaj, P., Kiesewetter, G., Schöpp, W., Wang, H., et al. (2019). Air Quality Improvement Co-benefits of Low-Carbon Pathways toward Well below the 2 °C Climate Target in China. Environ. Sci. Technol. 53 (10), 5576–5584. doi:10.1021/acs.est.8b06948
Li, X., Xu, Y., and Yao., X. (2021). Effects of Industrial Agglomeration on Haze Pollution: A Chinese City-Level Study. Energy Policy 148, 111928. doi:10.1016/j.enpol.2020.111928
Lichtenberg, F. R., and Potterie, B. v. P. D. L. (1998). International R&D Spillovers: a Comment. Eur. Econ. Rev. 42 (8), 1483–1491. doi:10.1016/s0014-2921(97)00089-5
Lin, B., and Ma, R. (2022a). Green Technology Innovations, Urban Innovation Environment and CO2 Emission Reduction in China: Fresh Evidence from a Partially Linear Functional-Coefficient Panel Model. Technol. Forecast. Soc. Change 176, 121434. doi:10.1016/j.techfore.2021.121434
Lin, B., and Ma, R. (2022b). Towards Carbon Neutrality: The Role of Different Paths of Technological Progress in Mitigating China’s CO2 Emissions. Sci. Total Environ. 813, 152588. doi:10.1016/j.scitotenv.2021.152588
Liu, J.-Y., Woodward, R. T., and Zhang, Y.-J. (2021). Has Carbon Emissions Trading Reduced PM2.5 in China? Environ. Sci. Technol. 55 (10), 6631–6643. doi:10.1021/acs.est.1c00248
Liu, X. (2018). Dynamic Evolution, Spatial Spillover Effect of Technological Innovation and Haze Pollution in China. Energ. Environ. 29 (6), 968–988. doi:10.1177/0958305x18765249
Luo, Y., Salman, M., and Lu, Z. (2021). Heterogeneous Impacts of Environmental Regulations and Foreign Direct Investment on green Innovation across Different Regions in China. Sci. Total Environ. 759, 143744. doi:10.1016/j.scitotenv.2020.143744
Lyu, P., Lin, H-L., Ho, C-C., and Yang, C-H. (2019). Assembly Trade and Technological Catch-Up: Evidence from Electronics Firms in China. J. Asian Econ. 62, 65–77. doi:10.1016/j.asieco.2019.04.002
Markandya, A., Sampedro, J., Smith, S. J., Van Dingenen, R., Pizarro-Irizar, C., Arto, I., et al. (2018). Health Co-benefits from Air Pollution and Mitigation Costs of the Paris Agreement: a Modelling Study. Lancet Planet. Health 2 (3), e126–133. doi:10.1016/S2542-5196(18)30029-9
Mu, Q., and Lee, K. (2005). Knowledge Diffusion, Market Segmentation and Technological Catch-Up: The Case of the Telecommunication Industry in China. Res. Pol. 34 (6), 759–783. doi:10.1016/j.respol.2005.02.007
Opoku, E. E. O., Adams, S., and Aluko, O. A. (2021). The Foreign Direct Investment-Environment Nexus: Does Emission Disaggregation Matter? Energ. Rep. 7, 778–787. doi:10.1016/j.egyr.2021.01.035
Ou, Y., Shi, W., Smith, S. J., Ledna, C. M., West, J. J., Nolte, C. G., et al. (2018). Estimating Environmental Co-benefits of U.S. Low-Carbon Pathways Using an Integrated Assessment Model with State-Level Resolution. Appl. Energ. 216, 482–493. doi:10.1016/j.apenergy.2018.02.122
Ouyang, X., Li, Q., and Du, K. (2020). How Does Environmental Regulation Promote Technological Innovations in the Industrial Sector? Evidence from Chinese Provincial Panel Data. Energy Policy 139, 111310. doi:10.1016/j.enpol.2020.111310
Peng, L., Liu, F., Zhou, M., Li, M., Zhang, Q., and Mauzerall, D. L. (2021). Alternative-energy-vehicles Deployment Delivers Climate, Air Quality, and Health Co-benefits when Coupled with Decarbonizing Power Generation in China. One Earth 4, 1127–1140. doi:10.1016/j.oneear.2021.07.007
Peng, X., Chen, Y., and Ye, X. (2013). Haze, Air Pollution, and Health in China. Lancet 382, 2067. doi:10.1016/s0140-6736(13)62693-8
Popp, D. (2002). Induced Innovation and Energy Prices. Am. Econ. Rev. 92 (1), 160–180. doi:10.1257/000282802760015658
Popp, D., Richard, G., and Adam, N. (2009). Energy, the Environment, and Technological Change. NBER Working Paper.
Qian, H., Xu, S., Cao, J., Ren, F., Wei, W., Meng, J., et al. (2021). Air Pollution Reduction and Climate Co-benefits in China's Industries. Nat. Sustain. 4, 417–425. doi:10.1038/s41893-020-00669-0
Romer, P. M. (1986). Increasing Returns and Long-Run Growth. J. Polit. Economy 94, 1002–1037. doi:10.1086/261420
Rypdal, K., Rive, N., Åström, S., Karvosenoja, N., Aunan, K., Bak, J. L., et al. (2007). Nordic Air Quality Co-benefits from European post-2012 Climate Policies. Energy Policy 35 (12), 6309–6322. doi:10.1016/j.enpol.2007.07.022
Sergey, P., Jennifer, M., Haroon, K., and Howard, H. (2021). Hard-to-Abate Sectors: The Role of Industrial Carbon Capture and Storage (CCS) in Emission Mitigation. Appl. Energ. 300, 117322. doi:10.1016/j.apenergy.2021.117322
Shao, S., Li, X., and Cao, J. H. (2016). China's Economic Policy Choices for Governing Haze Pollution Based on Spatial Spillover Effects. Econ. Res. J. 9, 73–88.
Shi, Q., and Lai, X. (2013). Identifying the Underpin of green and Low Carbon Technology Innovation Research: a Literature Review from 1994 to 2010. Technol. Forecast. Soc. Change 80, 839–864. doi:10.1016/j.techfore.2012.09.002
Shi, W., Ou, Y., Smith, S. J., Ledna, C. M., Nolte, C. G., and Loughlin, D. H. (2017). Projecting State-Level Air Pollutant Emissions Using an Integrated Assessment Model: GCAM-USA. Appl. Energ. 208, 511–521. doi:10.1016/j.apenergy.2017.09.122
Shindell, D., Faluvegi, G., Seltzer, K., and Shindell, C. (2018). Quantified, Localized Health Benefits of Accelerated Carbon Dioxide Emissions Reductions. Nat. Clim Change 8, 291–295. doi:10.1038/s41558-018-0108-y
Shindell, D. T., Lee, Y., and Faluvegi, G. (2016). Climate and Health Impacts of US Emissions Reductions Consistent with 2 °C. Nat. Clim Change 6 (5), 503–507. doi:10.1038/nclimate2935
Sun, H., Edziah, B. K., Kporsu, A. K., Sarkodie, S. A., and Taghizadeh-Hesary, F. (2021). Energy Efficiency: The Role of Technological Innovation and Knowledge Spillover. Technol. Forecast. Soc. Change 167, 120659. doi:10.1016/j.techfore.2021.120659
Tang, K., Qiu, Y., and Zhou, D. (2020). Does Command-And-Control Regulation Promote green Innovation Performance? Evidence from China's Industrial Enterprises. Sci. Total Environ. 712, 136362. doi:10.1016/j.scitotenv.2019.136362
Thambiran, T., and Diab, R. D. (2011). The Case for Integrated Air Quality and Climate Change Policies. Environ. Sci. Pol. 14 (8), 1008–1017. doi:10.1016/j.envsci.2011.08.002
Thompson, T. M., Rausch, S., Saari, R. K., and Selin, N. E. (2014). A Systems Approach to Evaluating the Air Quality Co-benefits of US Carbon Policies. Nat. Clim Change 4 (10), 917–923. doi:10.1038/nclimate2342
Tollefsen, P., Rypdal, K., Torvanger, A., and Rive, N. (2009). Air Pollution Policies in Europe: Efficiency Gains from Integrating Climate Effects with Damage Costs to Health and Crops. Environ. Sci. Pol. 12 (7), 870–881. doi:10.1016/j.envsci.2009.08.006
Usman, M., Balsalobre-Lorente, D., Jahanger, A., and Ahmad, P. (2022b). Pollution Concern during Globalization Mode in Financially Resource-Rich Countries: Do Financial Development, Natural Resources, and Renewable Energy Consumption Matter? Renew. Energ. 183, 90–102. doi:10.1016/j.renene.2021.10.067
Usman, M., and Jahanger, A. (2021). Heterogeneous Effects of Remittances and Institutional Quality in Reducing Environmental Deficit in the Presence of EKC Hypothesis: A Global Study with the Application of Panel Quantile Regression. Environ. Sci. Pollut. Res. 28, 37292–37310. doi:10.1007/s11356-021-13216-x
Usman, M., Jahanger, A., Makhdum, M. S. A., Balsalobre-Lorente, D., and Bashir, A. (2022a). How Do Financial Development, Energy Consumption, Natural Resources, and Globalization Affect Arctic Countries' Economic Growth and Environmental Quality? an Advanced Panel Data Simulation. Energy 241, 122515. doi:10.1016/j.energy.2021.122515
Vandyck, T., Keramidas, K., Kitous, A., Spadaro, J. V., Van Dingenen, R., Holland, M., et al. (2018). Air Quality Co-benefits for Human Health and Agriculture Counterbalance Costs to Meet Paris Agreement Pledges. Nat. Commun. 9 (1), 4939. doi:10.1038/s41467-018-06885-9
Wang, T., Jiang, Z., Zhao, B., Gu, Y., Liou, K.-N., Kalandiyur, N., et al. (2020a). Health Co-benefits of Achieving Sustainable Net-Zero Greenhouse Gas Emissions in California. Nat. Sustain. 3, 597–605. doi:10.1038/s41893-020-0520-y
Wang, W., Wang, D., Ni, W., and Zhang, C. (2020b). The Impact of Carbon Emissions Trading on the Directed Technical Change in China. J. Clean. Prod. 272, 122891. doi:10.1016/j.jclepro.2020.122891
Wang, X., and Luo, Y. (2020). Has Technological Innovation Capability Addressed Environmental Pollution from the Dual Perspective of FDI Quantity and Quality? Evidence from China. J. Clean. Prod. 258, 120941. doi:10.1016/j.jclepro.2020.120941
Wang, X., Zhang, Q., and Chang, W.-Y. (2022). Does Economic Agglomeration Affect Haze Pollution? Evidence from China's Yellow River basin. J. Clean. Prod. 335, 130271. doi:10.1016/j.jclepro.2021.130271
Wang, Z., Shahid, M. S., Binh An, N., Shahzad, M., and Abdul-Samad, Z. (2022). Does green Finance Facilitate Firms in Achieving Corporate Social Responsibility Goals? Econ. Research-Ekonomska Istraživanja, 1–20. ahead-of-print(ahead-of-print). doi:10.1080/1331677x.2022.2027259
Wei, P., Junnan, Y., Fabian, W., and Denise, L. M. (2017). Substantial Air Quality and Climate Co-benefits Achievable Now with Sectoral Mitigation Strategies in China. Sci. Total Environ. 59811 (15), 1076–1084. doi:10.1016/j.scitotenv.2017.03.287
West, J. J., Smith, S. J., Silva, R. A., Naik, V., Zhang, Y., Adelman, Z., et al. (2013). Co-benefits of Mitigating Global Greenhouse Gas Emissions for Future Air Quality and Human Health. Nat. Clim Change 3 (10), 885–889. doi:10.1038/nclimate2009
West, S. (2004). Distributional Effects of Alternative Vehicle Pollution Control Policies. J. Public Econ. 88 (3-4), 735–757. doi:10.1016/s0047-2727(02)00186-x
Yan, H., and Cao, J. (2021). Impacts of Haze Pollution on China's Tourism Industry: A System of Economic Loss Analysis. J. Environ. Manage. 295, 113051. doi:10.1016/j.jenvman.2021.113051
Yang, B., Jahanger, A., Usman, M., and Khan, M. A. (2021). The Dynamic Linkage between Globalization, Financial Development, Energy Utilization, and Environmental Sustainability in GCC Countries. Environ. Sci. Pollut. Res. 28, 16568–16588. doi:10.1007/s11356-020-11576-4
Yang, J., Li, X., Peng, W., and Mauzera, D. L. (2018). Climate, Air Quality and Human Health Benefits of Various Solar Photovoltaic Deployment Scenarios in China in 2030. Environ. Res. Lett. 13 (6), 64002. doi:10.1088/1748-9326/aabe99
Yang, X., Teng, F., and Wang, G. (2013). Incorporating Environmental Co-benefits into Climate Policies: A Regional Study of the Cement Industry in China. Appl. Energ. 112, 1446–1453. doi:10.1016/j.apenergy.2013.03.040
Yi, M., Wang, Y., Sheng, M., Sharp, B., and Zhang, Y. (2020). Effects of Heterogeneous Technological Progress on Haze Pollution: Evidence from China. Ecol. Econ. 169, 106533. doi:10.1016/j.ecolecon.2019.106533
Zhang, M. (2019). How Does Environmental Regulation Affect Haze Pollution Governance?--An Empirical Test Based on Chinese Provincial Panel Data. Sci. Total Environ. 695 (12), 133905.
Zhang, Y., Smith, S. J., Bowden, J. H., Adelman, Z., and West, J. J. (2017). Co-benefits of Global, Domestic, and Sectoral Greenhouse Gas Mitigation for US Air Quality and Human Health in 2050. Environ. Res. Lett. 12 (11), 114033. doi:10.1088/1748-9326/aa8f76
Zhou, Q., Zhong, S., Shi, T., and Zhang, X. (2021). Environmental Regulation and Haze Pollution: Neighbor-Companion or Neighbor-Beggar? Energy Policy 151, 112183. doi:10.1016/j.enpol.2021.112183
Keywords: low-carbon tech-innovation, haze pollution, technological heterogeneity, spatial spillover effect, dynamic spatial Durbin model
Citation: Jin S, Wang W, Qalati SA, Zhang C, Lu N, Zhu G and Wu J (2022) Can Low-Carbon Technological Innovation Reduce Haze Pollution?—Based on Spatial Econometric Analysis. Front. Environ. Sci. 10:893194. doi: 10.3389/fenvs.2022.893194
Received: 10 March 2022; Accepted: 04 April 2022;
Published: 20 May 2022.
Edited by:
Asif Razzaq, Dalian University of Technology, ChinaReviewed by:
Atif Jahanger, Hainan University, ChinaYuanchun Zhou, Nanjing University of Finance and Economics, China
Mohsin Shahzad, Dalian University of Technology, China
Copyright © 2022 Jin, Wang, Qalati, Zhang, Lu, Zhu and Wu. This is an open-access article distributed under the terms of the Creative Commons Attribution License (CC BY). The use, distribution or reproduction in other forums is permitted, provided the original author(s) and the copyright owner(s) are credited and that the original publication in this journal is cited, in accordance with accepted academic practice. No use, distribution or reproduction is permitted which does not comply with these terms.
*Correspondence: Shunlin Jin, c2h1bmxpbmppbjIwMDBAMTYzLmNvbQ==; Weidong Wang, d2FuZ3dkQHVqcy5lZHUuY24=; Sikandar Ali Qalati, cWFsYXRpQHVqcy5lZHUuY25tYWlsdG8=