 Cun Zhan1
 Lu Zhao
- 1State Key Laboratory of Hydraulics and Mountain River Engineering & College of Water Resource and Hydropower, Sichuan University, Chengdu, China
- 2Provincial Key Laboratory of Water-Saving Agriculture in Hill Areas of Southern China, Chengdu, China
- 3China State Key Laboratory of Hydrology-Water Resources and Hydraulic Engineering & Science, Nanjing Hydraulic Research Institute, Nanjing, China
- 4Power China Northwest Engineering Corporation Limited, Xi’an, China
As an important ecological corridor, the Yellow River basin (YRB) is crucial for the eco-environmental security and sustainable socio-economic development of China. Systematic studies on the spatiotemporal evolution of vegetation cover and the response of vegetation dynamics to climate change in the YRB at different timescales are lacking. Utilizing a long-term remotely sensed Normalized Difference Vegetation Index (NDVI) and gridded climate dataset, we examined the spatiotemporal variability of vegetation cover and its response to climate variables in the Yellow River Basin (YRB) at multiple timescales by using the Mann-Kendall test, rescaled range analysis, and partial correlation analysis. Results indicated that the annual NDVI in the YRB decreased spatially from southeast to northwest, and peaked in August. From 1982 to 2015, the YRB experienced greening during the annual, growing season and spring, with statistically significant NDVI increases (p < 0.05) recorded in over 55% of the vegetated areas. NDVI trends should be expected to persist in the future, as evidenced by the Hurst index exceeding 0.5 in over 85% areas of the YRB. Temperature and precipitation determined the spatiotemporal pattern of vegetation cover in the YRB, and vegetation dynamics response to climatic variations varied among seasons and climatic zones. In contrast to other seasons, spring NDVI was significantly correlated with temperature, whereas winter vegetation was more vulnerable to suppression by increased precipitation. Vegetation growth was more susceptible to precipitation than to temperature in the arid and semiarid zones, while temperature dominated vegetation dynamics in the semi-humid zone, and the sunshine duration was essential for vegetation growth in high-altitude regions. The study contributes to a deeper understanding of the interrelationship between vegetation dynamics and climate change in the YRB and provides useful suggestions for the regional ecological conservation in the context of global warming.
1 Introduction
Vegetation is crucial for terrestrial ecosystems, with its dynamics having implications for local hydrological cycle and climate conditions (Jia et al., 2020; Liu et al., 2020; Duan et al., 2021). Studies have shown that climate change is an important driver of vegetation dynamics (Shen et al., 2018; Xie et al., 2019; Zhang et al., 2020), with vegetation functioning as a feedback system, regulating terrestrial and atmospheric water, carbon, and energy balances (Hua et al., 2017; Zhao et al., 2018; Yao et al., 2019; Meng et al., 2020). Systematic analyses of long-term changes in spatiotemporal vegetation dynamics and the role of climate change in these changes are essential for formulating appropriate land-use plans and ecological conservation strategies.
Given spatial and temporal heterogeneity in changes in regional vegetation cover, establishing a large-scale and real-time monitoring system for vegetation dynamics using traditional measurement methods is challenging. The use of remote sensing techniques for monitoring vegetation dynamics at a large scale has increased in recent years, with remote sensing providing continuous, high-resolution images of spatial-temporal changes in vegetation growth (De Jong et al., 2011; Tao et al., 2018; Hu and Xia, 2019). Satellite-derived vegetation indices, such as the Normalized Difference Vegetation Index (NDVI), Enhanced Vegetation Index (EVI), and Leaf Area Index (LAI), are commonly used to detect vegetation dynamics (Piao et al., 2014; Cao et al., 2015; Liu et al., 2018; Pan et al., 2018). Among these indexes, the NDVI exhibits a good correlation with vegetation net primary productivity, canopy surface area, and biomass (Gamon et al., 1995; Sweet et al., 2015). Thus, it is considered an effective monitoring indicator of vegetation cover at large scales (Myneni et al., 1995; Lucht et al., 2002; Wang et al., 2008; Zhang et al., 2016). Currently, NDVI datasets are available from Advanced Very High-Resolution Radiometer (AVHRR), Moderate Resolution Imaging Spectroradiometer (MODIS), and Système Probatoire d’Observation de la Terre VEGETATION (SPOT-VGT), of which SPOT-VGT and MODIS data have higher spatial resolution than AVHRR. However, the monitored period of SPOT-VGT and MODIS is too short for identifying long-term trends in vegetation cover (Fensholt et al., 2009; Mao et al., 2012; An et al., 2015; Bai et al., 2019). AVHRR NDVI datasets have been successfully applied in studies of vegetation dynamics over the long term at global and regional scales due to the availability of continuous imaging data for more than 30 years (Liu et al., 2019; Wang et al., 2020b; Hou and Hou, 2020; Li et al., 2021; Ye et al., 2021).
Vegetation dynamics are susceptible to climate change due to its effects on plant respiration, photosynthesis, and evapotranspiration (Piao et al., 2012; Qu et al., 2015; Pei et al., 2018). Indirectly or directly, climate affects water, light, heat, and other conditions essential for vegetation growth (Fang et al., 2019; Yang et al., 2019; Zhang et al., 2019; Zhang et al., 2020). In turn, vegetation can influence the local climate (Guo et al., 2021). The spatial heterogeneity of vegetation dynamics and changes in vegetation response to climate change are driven by the regional diversity of vegetation types and climatic conditions. In recent decades, prolongation of phenological periods caused by climate warming has provided strong evidence of vegetation greening at global and regional levels (Zhu et al., 2016; Chen et al., 2019; Tian et al., 2021). An increase in precipitation has markedly accelerated the observed trend of vegetation greening in arid zone (Piao et al., 2015; Chen et al., 2020b; Zhang et al., 2021). In addition to the aforementioned factors, solar radiation has been identified as a significant driver of heterogeneity in vegetation greening in high-altitude zone (Wang et al., 2015; Liu et al., 2018; Jiang et al., 2022).
As an ecological corridor connecting the Tibet Plateau, Loess Plateau, and North China Plain, the Yellow River Basin (YRB) plays a vital role in the economic and social development and ecological security of China. The YRB is an environmentally vulnerable area due to its complex topography and climate (Xin et al., 2008). Following large-scale soil and water conservation, cropland conversion to forest, ecological forest construction, and other engineering management activities in recent years, the vegetation cover of the YRB has changed significantly (Tian et al., 2021). Previous studies have drawn meaningful conclusions on vegetation cover change in the YRB at various timescales. For example, Miao et al. (2012) discovered the increase in vegetation cover in the YRB from 1982 to 2006 can be attributed to changes in temperature and precipitation; A study based on SPOT-VEG data for the period 1998–2008 concluded that annual vegetation cover in the YRB showed a significant positive trend (Nie et al., 2012); Based on MODIS NDVI and climate data collected for the Yellow River source area from 2000 to 2011, Liu et al. (2014) concluded that the regional NDVI has increased in the past 12 years and that climate change and ecological protection projects were the main factors driving this increase; In their study of vegetation changes in the YRB based on MODIS data from 2000 to 2010, Jiang et al. (2015) reported that vegetation cover was continuously increasing in the basin; Researchers have identified that the positive influence of increasing spring temperature on the NDVI was substantially greater than that of summer and fall temperatures (Xu et al., 2018); Zhang et al. (2020) revealed that the YRB has experienced significant warming and greening during 1982–2015, and NDVI was significantly positively correlated with temperature in most areas of the YRB; Wang et al. (2020a) reported that more than 71.4% areas in the source region of the YRB showed an increasing trend in the NDVI from 1998 to 2016, with the NDVI being more sensitive to temperature than precipitation; Based on annual and seasonal data on the NDVI, Tian et al. (2021) suggested that vegetation in the YRB has experienced significant greening, and which can be attributed mainly to afforestation, population increases, and climate warming.
However, systematic studies on the long-term spatiotemporal evolution of vegetation dynamics and the response of vegetation to climate change in the YRB at different timescales are lacking. The objective of this study was to conduct a systematic analysis of vegetation cover changes and climate-driven mechanisms underlying these changes in the YRB at different time periods (annual, growing season and seasonal) and spatial scales (whole basin, climate zone and pixel). With this aim in mind, the present study 1) evaluated changes in spatial and temporal patterns of vegetation cover over the past 34 years in the YRB, 2) quantified trends in long-term vegetation dynamics in the YRB and determined whether these trends can be expected to continue in the future, and 3) identified the primary climatic variables (e.g., precipitation, temperature and sunshine duration) governing temporal changes in vegetation cover in the YRB. The results can provide a valuable reference for formulating ecological conservation strategies of the YRB in the context of climate change.
2 Materials and Methods
2.1 Study Area
Originating in the eastern Qinghai-Tibet Plateau, the YRB covers an area of 79.5 km2 × 104 km2 (Ji et al., 2018), and its topography and landforms differ significantly from West to East. The Qinghai-Tibet Plateau in the Western YRB is over 4,000 m in elevation and contains a series of high mountains. Located in the middle of the basin, the Loess Plateau, with an elevation of 1,000–2,000 m, is predominantly a loess landform. The Yellow River alluvial plain comprises the eastern basin, with an elevation of less than 100 m. As a transition zone between semiarid and semi-humid climates, the YRB experiences strong solar radiation, concentrated and uneven precipitation, and high evapotranspiration. The YRB can be divided into arid, semiarid, and semi-humid zones (Zones I, II and III, respectively) according to dry and wet climatic characteristics (Figure 1A). Vegetation in the YRB is aligned with precipitation patterns, with high vegetation coverage in the southeast and low coverage in the northwest. Among the various ecosystems present in the basin, grassland is widely distributed in the arid and semiarid zones, farmland is concentrated primarily in the Loop Plains, Guanzhong Plains, and Fenwei Plains, and forests are located primarily in the semiarid and semi-humid zones in the basin (Figure 1B). The geographic locations and climate zones in the YRB, together with land use in the basin, were depicted in Figure 1.
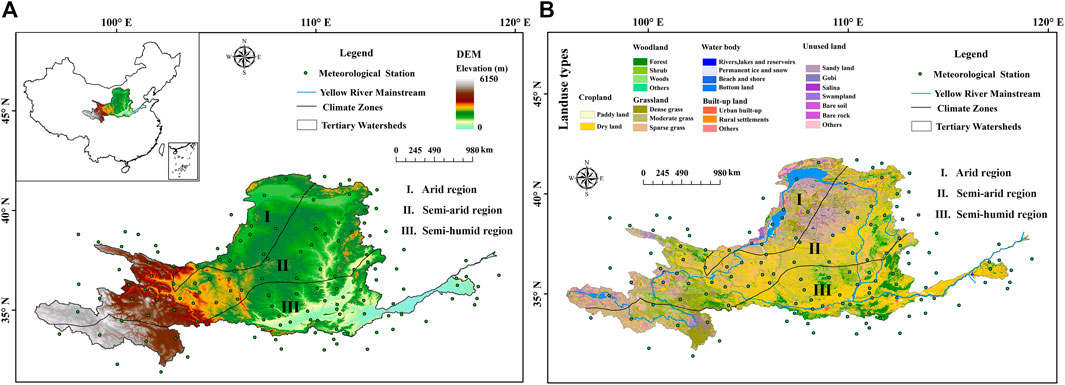
FIGURE 1. Geographic location and land use of the Yellow River Basin. (A) the geographical location, elevation, climatic zones and spatial distribution of meteorological stations in the Yellow River Basin; (B) the land use of the Yellow River Basin in 2015.
2.2 Data Sources
2.2.1 Normalized Difference Vegetation Index Dataset
The GIMMS NDVI 3g.v1 dataset Developed by NASA Global Inventory Modeling and Mapping Studies group was used in this study. Although the spatial resolution of this dataset is relatively low (1/12°), it has the longest time series (semimonthly frequency from July 1981 to December 2015) among various image monitoring datasets. Thus, it reflects long-term changes in vegetation cover trends more comprehensively than other NDVI datasets (Zhu et al., 2013). To eliminate interference due to cloud, atmosphere, and the solar zenith angle, the maximum value composite approach was adopted to synthesize the monthly NDVI (Holben, 1986; Chu et al., 2019). Average NDVI values for the following periods were then calculated: annual, growing season (April to October), spring (March to May), summer (June to August), fall (September to November), and winter (December to February of the following year).
2.2.2 Meteorological Dataset
Climate datasets, including daily precipitation (P, mm), temperature (T, °C), and sunshine duration (SD, hours), were obtained for 130 meteorological stations during 1982–2015 in the YRB from the China Meteorological Administration (http://cdc.cma.gov.cn/). The monthly average climate elements were then calculated for the following analysis. Missing data, which accounted for less than 1% of the total data, were interpolated using values from neighboring stations. The Kriging interpolation method was used to obtain annual, growing season, and seasonal precipitation, temperature, and SD data in the whole study area, with a spatial resolution of 1/12° to match that in the NDVI datasets.
2.2.3 Landuse Dataset
The land use dataset during the year 2015 was obtained from the Chinese Academy of Sciences Resource and Environmental Science Data Center (RESDC, http://www.resdc.cn/) (Chinese Academy of Sciences and Environmental Science Data, 2019). The land use types include six first-class types of cropland, woodland, grassland, water body, built-up land and unused land, and 25 second-class types (Figure 1). The boundaries of the climate zones were also acquired from the RESDC.
2.3 Methods
2.3.1 Trend Analysis
Linear regression was applied to quantify interannual trends in NDVI, precipitation, temperature, and SD in the YRB. The following formula (NDVI for example) was used:
where n is the length of the annual time series,
The Mann-Kendall (MK) test was applied to measure the trend in the NDVI and climate variables in the YRB and subregions at the pixel scale (Kendall, 1938; Mann, 1945). MK’s trend test value Zs was calculated by the following steps:
1) compute the indicator function
2) compute the variance
where: p is the total number of tie groups in the dataset, and
3) compute the Mann-Kendall test statistic using the following transformation:
At a given significance level α, when
2.3.2 Rescaled Range Analysis
Rescaled range analysis (R/S) is a statistical approach developed to detect and evaluate the amount of persistence for time series (Hurst, 1951), and the primary calculation procedures are as follows:
1) The NDVI time series was defined as
2) The Hurst index is then calculated as follows:
The Hurst index (H) is determined by fitting the least-squares method to both sides of Eq. 10 by taking the logarithm. H < 0.5 indicates that future trends in vegetation cover are inconsistent with past trends. H = 0.5 represents a random series, making it difficult to predict future trends based on the law of vegetation cover change. H > 0.5 means that the trend of vegetation cover is consistent with the previous trend, and the higher the probability of the time series maintaining its original trend as the value of H is closer to 1 (Mandelbrot and Wallis, 1969).
2.3.3 Partial Correlation Analysis
Partial correlation analysis is a widely used statistical tool for separating the relationship between two variables from the confounding effects of many correlated variables (Peng et al., 2013). We applied the second-order partial correlation method in present study to obtain the correlation between the NDVI and single climate variable, and the other climate variables were used as control variables. The partial correlation coefficient were calculated as follows (Sun et al., 2021):
Where:
The schematic diagram of this study was illustrated in Figure 2.
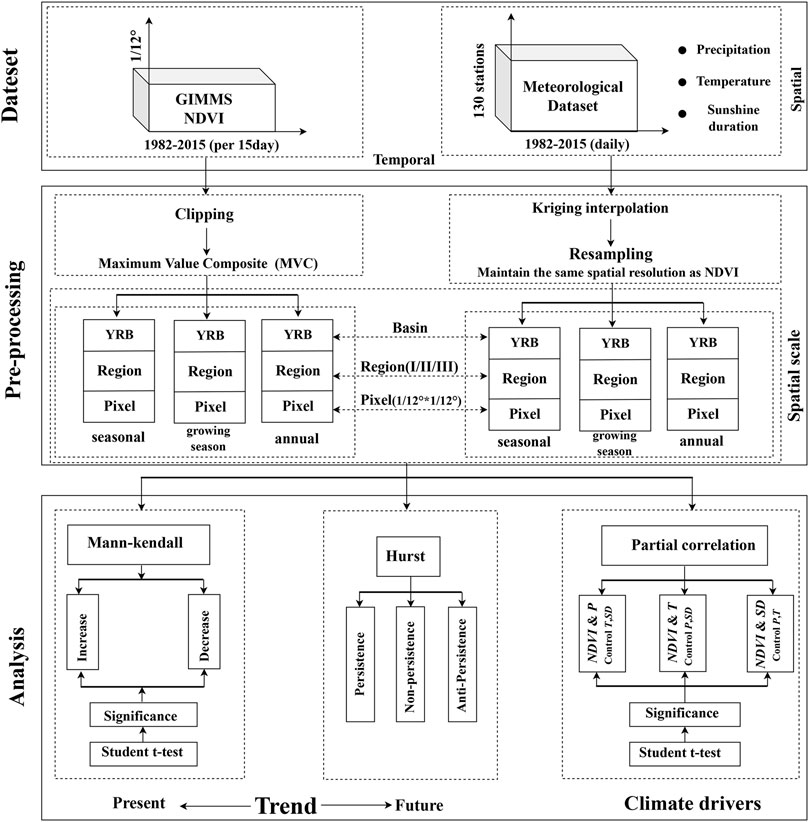
FIGURE 2. The schematic diagram of the study.
3 Results
3.1 Spatial Patterns of Annual Normalized Difference Vegetation Index and Climate Variables
To reveal the spatial differences in vegetation cover and the climatic conditions in the YRB, the mean values of the annual NDVI and major climatic variables in the three climate zones during 1982–2015 were calculated, as shown in Table 1 and Figure 3. The annual average NDVI value in the YRB was 0.321 ± 0.013 (mean ± standard deviation), and the NDVI values in Zones I, II and III were 0.171 ± 0.007, 0.282 ± 0.014 and 0.442 ± 0.013, respectively. Figure 3A illustrates that the NDVI decreased from the southeast to the northwest, with the highest value found in the southwest of the semi-humid zone (Zone III), followed by the Qinghai-Tibetan Plateau region in the West of the semiarid zone (Zone II) and an arid region with poor vegetation cover (Zone I).
TABLE 1. Statistics of annual NDVI and important climate variables during 1982–2015 in the Yellow River Basin.
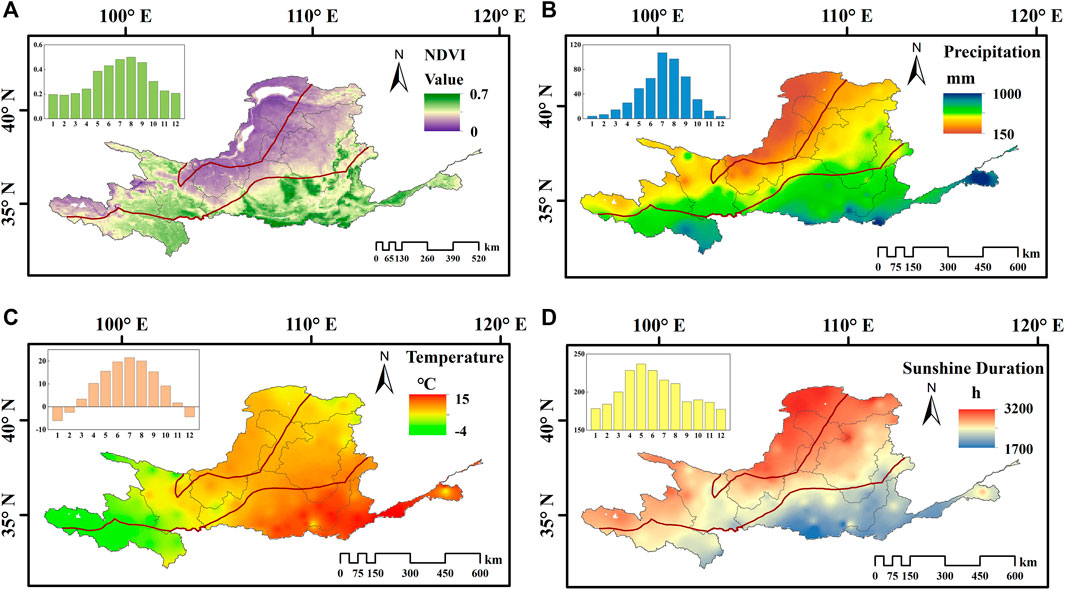
FIGURE 3. Spatial patterns of annual average (A) NDVI, (B) precipitation, (C) temperature, and (D) sunshine duration during 1982–2015 in the Yellow River Basin.
Spatially, the distribution of precipitation was generally consistent with the NDVI coverage. Annual precipitation was less than 300 mm in Zone I (231.0 ± 42.3 mm), close to 500 mm in Zone II (440.0 ± 50.9 mm), and more than 600 mm in Zone III (606.2 ± 79.4 mm). Generally, temperatures in the YRB decreased from East to West, with the Qinghai-Tibet Plateau representing a low-temperature area, and the southeast of the semi-humid area corresponding to a high-temperature area. The average annual temperatures in the semi-humid and arid regions were relatively high (7.75 ± 0.54 and 7.31 ± 0.71°C, respectively), whereas the temperature in the semiarid zone was relatively low (4.55 ± 0.62°C). The spatial distribution of SD in the YRB differed from that of precipitation, with the SD decreasing from North to South. The arid zone was characterized by the longest SD (2,886 ± 75 h), followed by the semiarid zone (2,602 ± 71 h) and semi-humid zone (2,225 ± 96 h).
Regarding intra-annual variation, the lowest NDVI value occurred in February (0.24), and the average monthly value increased gradually from March, with the highest value in August (0.47). It then gradually decreased, with the most abundant vegetation cover found during the growing season. The intra-annual variation in NDVI, precipitation, and temperature was generally consistent and had a unimodal distribution. There was a high concentration of precipitation in the YRB between April and October, which accounted for 80% of annual precipitation, with the highest amount occurring in July. Temperatures greater than 5°C typically occurred in April through October, with the highest temperature occurring in July. SD was longer in April-August than in other months of the year, with the peak occurring in May.
3.2 Normalized Difference Vegetation Index Trends
3.2.1 Interannual Trends of Normalized Difference Vegetation Index and Climate Variables
Annually (Figure 4A), both the NDVI and temperature increased significantly in the YRB, with a change slope of 0.0012 and 0.0455°C, respectively (p < 0.001). Annual precipitation showed a nonsignificant increasing trend, whereas the annual SD was slight decreased, with a slope of 0.8702 mm yr−1 and −1.6340 h yr−1, respectively. The observed trends in the NDVI and climate variables during the growing season were in accordance with the annual trends (Figure 4B), with the NDVI and temperature increasing significantly (p < 0.001), with a slope of 0.0015 years−1 and 0.0407°C yr−1, respectively.
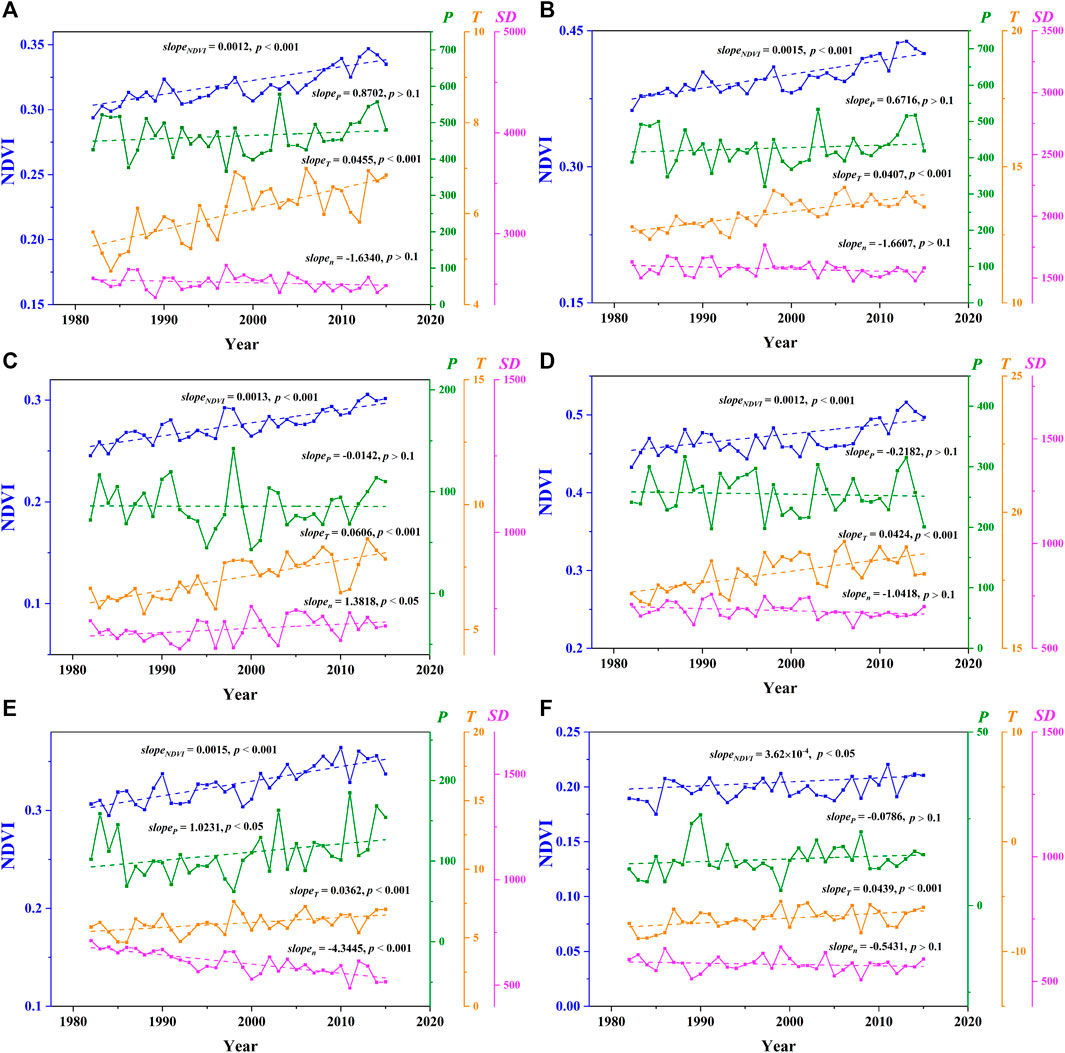
FIGURE 4. Trends of NDVI and primary climate variables in (A) annual; (B) growing season; (C) spring; (D) summer; (E) autumn; (F) winter in the Yellow River Basin during 1982–2015.
In contrast, precipitation and SD exhibited a nonsignificant increasing and decreasing trend, respectively, with a slope of 0.6716 mm yr−1 and −1.6607 h yr−1, respectively. Seasonally, the NDVI showed a highly significant increasing trend in the first three seasons, with slopes of 0.0013, 0.0012, and 0.0015 years−1, respectively, and a slight increasing trend in winter (Figures 4C–F). In all the other seasons, precipitation showed a nonsignificant decreasing trend, except for a significant increasing trend in the fall (slope = 1.0231 mm yr−1, p < 0.05). A highly significant warming trend was observed in all seasons (p < 0.001), with slopes of 0.0606, 0.0424, 0.0362, and 0.0439°C yr−1, respectively. The SD increased significantly in the spring (slope = 1.3818 h yr−1, p < 0.05) and decreased in the other three seasons, with a highly significant decrease in the fall (slope = −4.3445 h yr−1, p < 0.001).
3.2.2 Spatial Patterns of Normalized Difference Vegetation Index Trends
The annual NDVI for the YRB showed an increasing trend, with an increase detected in 90.9% of the region as demonstrated by the statistical value Zs of MK test greater than zero. Furthermore, a significant increase of annual NDVI was observed in 60% of the YRB (p < 0.05), pointing to a marked improvement in the vegetation condition in most areas of the YRB (Figure 5A). The annual NDVI increased significantly in 65.0%, 55.6%, and 64.1% of the arid, semiarid, and semi-humid zones, respectively. Regionally, the annual NDVI significantly decreased in the Qinghai-Tibet Plateau and urban areas (e.g., cities of Xi’an and Yinchuan), and less than 2.5% of the total areas in each climate zones were observed the remarkable decreased in annual NDVI. During growing season, 90.6% areas of the YRB showed a greening trend, with 56.6% areas of the YRB exhibited significant greening (Figure 5B).
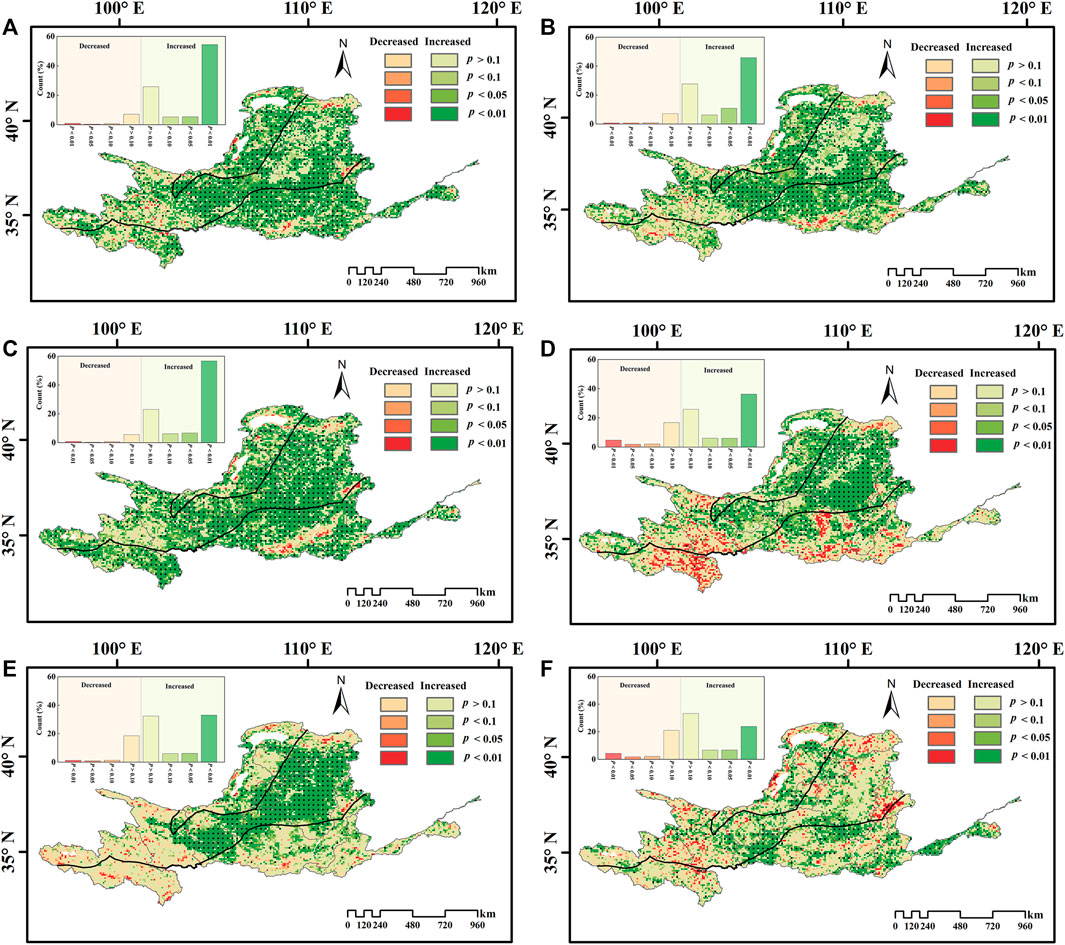
FIGURE 5. Spatial distribution of NDVI trends in the Yellow River Basin in (A) annual, (B) growing season, (C) spring, (D) summer, (E) autumn, and (F) winter. The histogram at the top left of the figure counted the area proportion for each significance level (%).
In relation to the seasonal NDVI, there was an increased trend in spring, when the trend was significantly higher than that in other three seasons. The NDVI significantly increased in 63.3% of areas in the YRB in spring (Figure 5C). Among the three climatic zones, the increase in spring NDVI was greatest in the semiarid (65.3%) zone, followed by the semi-humid (65.1%) and arid (53.4%) zones. In summer, The NDVI increased in 74.4% of areas in the YRB, and the regions that experienced significant increasing were mainly located in the central and eastern parts of the arid and semiarid areas of the YRB (Table 2). The summer NDVI significantly decreased in the southeastern semi-humid zone and the Qinghai-Tibet Plateau, where more than half the Qinghai-Tibet Plateau experienced a significant decrease in summer NDVI (Figure 5D). In total, the NDVI increased in 77.8% of the YRB in the fall (Figure 5E), with a significantly increasing trend in the northwestern semiarid zone covering 39.3% of the basin (p < 0.05). In winter, 70.5% areas of the YRB were detected an increasing trend in winter NDVI, with winter NDVI values significantly increased in only 30.6% of the entire basin (Figure 5F).
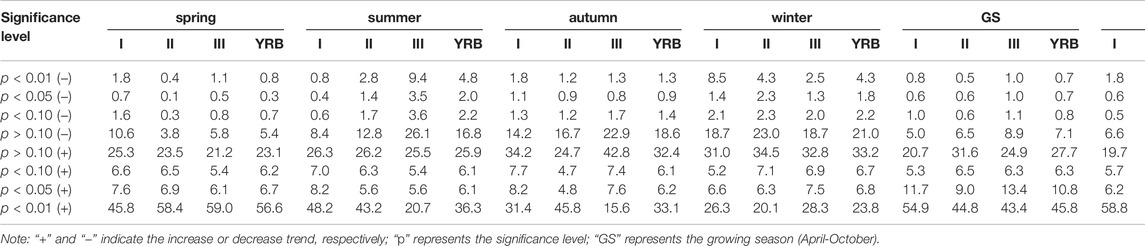
TABLE 2. Area percentage of NDVI trends in the Yellow River Basin at different significance levels (%).
Regionally, the NDVI in the arid zone exhibited an increasing trend at all timescales, except in winter. Other than in the winter, the annual, growing season, and seasonal NDVI in the semiarid region showed a significant and persistent increasing trend (p < 0.01, H > 0.5), which was stronger than that in the arid zone. In the semi-humid zone, the NDVI showed a significant increasing trend in the winter (p < 0.05, H > 0.5) and a significant increasing trend in all other seasons (p < 0.01, H > 0.5). In the future, the increasing trend of NDVI in the YRB in spring and growing season can be expected to be stronger than that in the other seasons, and which to be stronger in the semiarid and semi-humid zones than in the arid zones.
3.2.3 Future Trends of Normalized Difference Vegetation Index
More than 85% areas of the YRB were observed the persistent for NDVI trends at all timescales, as Hurst index (H) is greater than 0.5 in these regions (Figure 6; Table 3). The areas with H exceeding of 0.5 in various timescales were ranking as following: spring > autumn > year > growing season > summer > winter, and the area proportions corresponding to the ranking were 97.4%, 97.0%, 95.7%, 93.8%, 91.7%, and 86.5%, respectively. Thus, the vegetation cover in the region will continue to increase in the future (p < 0.05, H > 0.5).
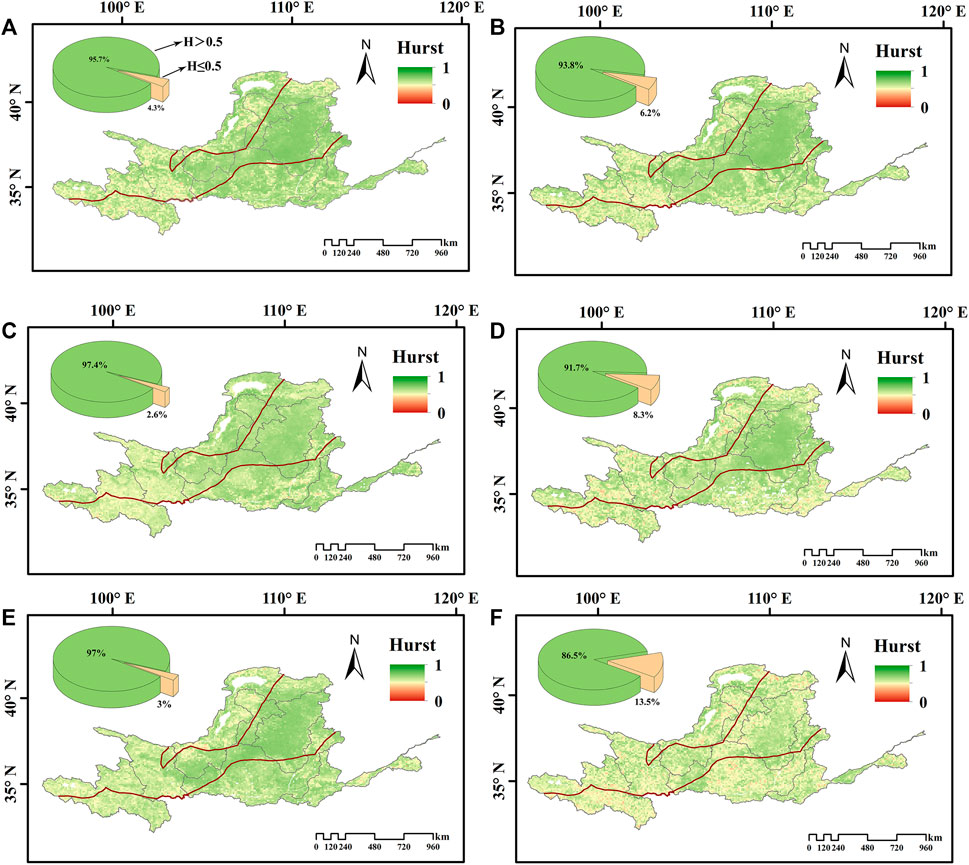
FIGURE 6. Spatial distribution of Hurst index of NDVI in the Yellow River basin in (A) annual, (B) growing season, (C) spring, (D) summer, (E) autumn, and (F) winter.
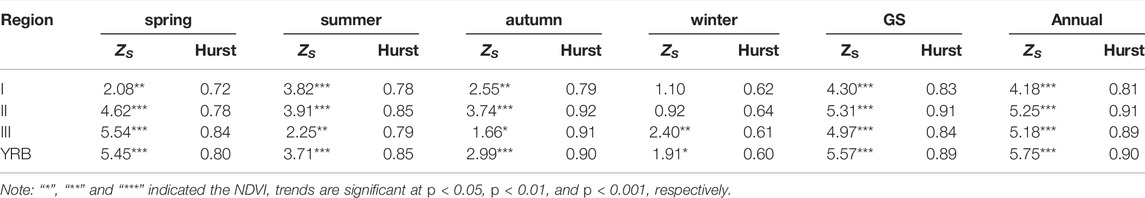
TABLE 3. Trends and Hurst index of NDVI in the Yellow River basin and three sub-regions.
3.3 Normalized Difference Vegetation Index Response to Climate Change
The effects of the climate variables (precipitation, temperature and SD) on vegetation cover at annual, growing season, and seasonal scales in the YRB were illustrated in Figure 7 and Table 4. At the annual scale, vegetation dynamics in most areas of the YRB were primarily driven by precipitation and temperature, with positive correlations recorded in most areas of the YRB between the NDVI and these climate variables. In contrast, the annual NDVI and SD exhibited negative correlations in half areas of the YRB. We found a positive correlation between the annual NDVI and precipitation in 75.0% of the central-eastern part of the arid and semiarid regions, whereas there was a negative correlation between the annual NDVI and precipitation in 23.7% of the study area, with these areas mainly located in the semi-humid and plateau zones of the semiarid zone. A positive correlation between the annual NDVI and temperature was recorded in 91.9% of the YRB (88.0%, 93.1% and 93.3% observed in Zones I, II, and III, respectively), whereas a negative correlation was observed mainly in large urban built-up areas, such as Xi’an, Xining, and Yinchuan. In nearly half the areas (45.4%) in the YRB, there was a negative correlation between annual NDVI and SD. There was a positive correlation between annual NDVI and SD in 47.2%, 40.1%, and 54.9% of areas in Zones I, II and III, respectively.
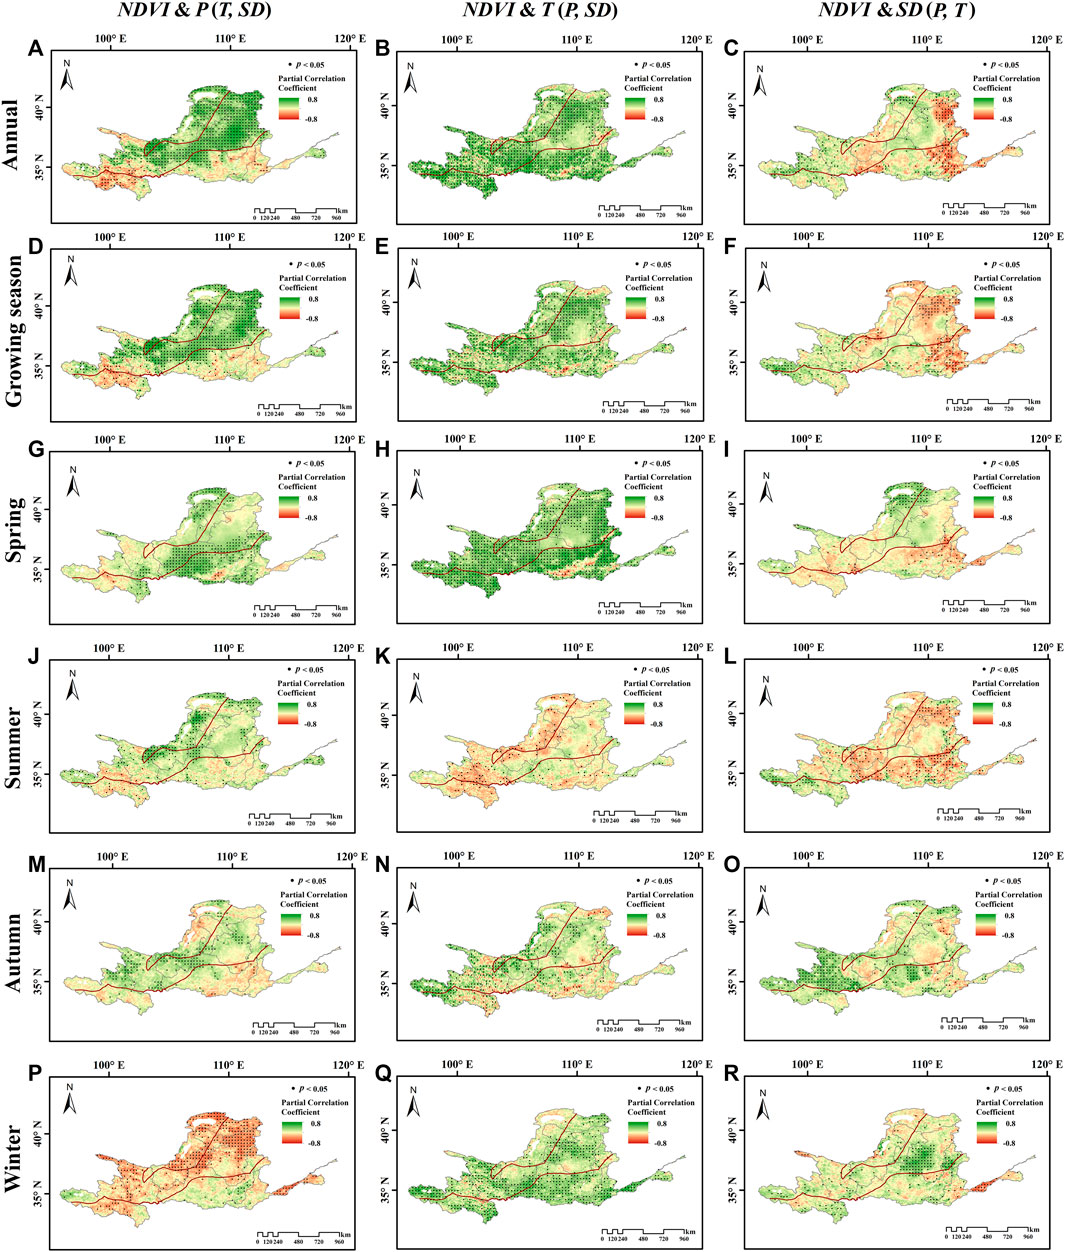
FIGURE 7. Spatial distribution of partial correlation coefficients between NDVI and precipitation, temperature, and sunshine duration in the Yellow River basin in (A–C) annual; (D–F) growing season; (G–I) spring; (J–L) summer; (M–O) autumn; (P–R) winter, respectively. The black dots represent partial correlation coefficients at the significance level of p < 0.05.
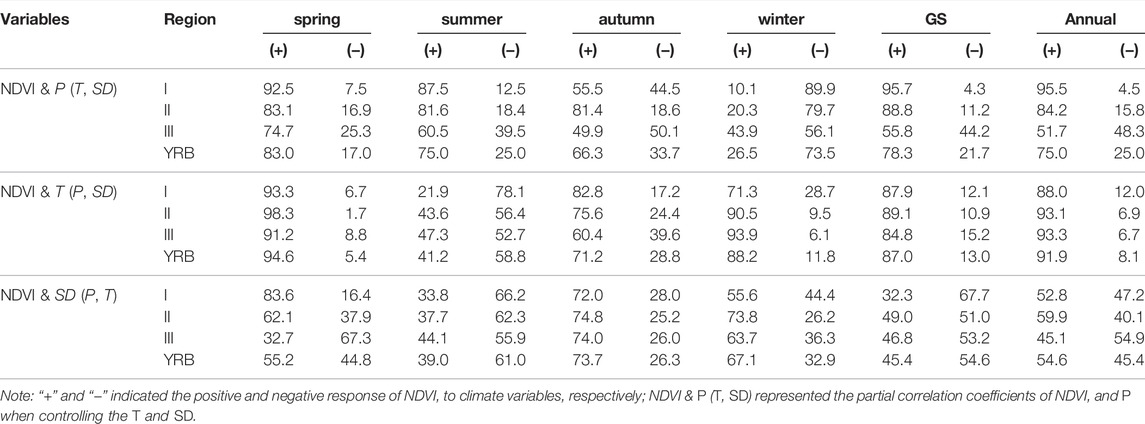
TABLE 4. Area percentage of NDVI response to climate variables in the Yellow River basin at different timescales (%).
During the growing season, the spatial pattern of the partial correlation between the NDVI and climate variables in the YRB matched the spatial pattern of annual NDVI, with the variation in the growing season NDVI driven primarily by precipitation and temperature. A positive correlation was found between NDVI and precipitation during the growing season in 78.3% of the study area, with a correlation in 95.7%, 88.8% and 55.8% of areas in Zones I, II and III, respectively. In 87.0% of the YRB, there was a positive correlation between the growing season NDVI and temperature (87.9%, 89.1% and 84.8% of areas in Zones I, II and III, respectively). Furthermore, 45.4% of the regional growing season NDVI was positively correlated with SD (32.3%, 49.0% and 46.8% of areas in Zone I, II and III, respectively).
In the YRB, the response of the NDVI to climate change was spatially heterogeneous between seasons. As shown in Figures 7G,J,M,P and Table 4, the areas with positive correlations between the NDVI and precipitation in the YRB according to season were as follows: spring (83.0%), summer (75.0%), fall (66.3%), and winter (26.5%). The areas with a positive correlation between the NDVI and precipitation in the arid, semiarid, and semi-humid zone according to season were respectively as follows: 92.5%, 83.1% and 74.7% in spring; 87.5%, 81.6% and 60.5% in summer; 55.5%, 84.1%, and 49.9% in the fall; 10.1%, 20.3%, and 43.9% in winter.
It can be seen from Figures 7H,K,N,Q that the NDVI was positively correlated with temperature in most areas in the YRB in the spring, fall, and winter, and the effect of climate warming on the NDVI in the spring and winter was greater than that in the fall. In the spring, warming promoted vegetation greening in the semiarid (98.3%), arid (93.3%), and semi-humid zones (91.2%), which may be associated with the advancement of vegetation phenology. Warming in the fall may have prolonged the phenological period for crops, leading to an increase of vegetation cover in areas in the arid zone (82.8%), semiarid zone (75.6%), and semi-humid zone (60.4%). In the winter, warming may have promoted the growth of overwintering vegetation (crops) in the semi-humid and semiarid zones. In winter, there was a positive correlation between the NDVI and temperature in 93.9%, 90.5%, and 71.3% of areas in the semi-humid, semiarid, and arid zone, respectively.
As shown in Figures 7I,L,O,R, the NDVI was positively correlated with SD in more than 65% of the YRB in the fall and winter, 55% of the YRB in spring, and less than 40% of the YRB in summer. In spring, SD was greater in the northern arid, central semiarid, and northwestern semi-humid zones, and the NDVI increased accordingly in 83.6%, 62.1%, and 32.7% of these zones, respectively. An increase in SD and solar insolation in the summer suppressed vegetation growth in 39% of areas in the YRB. In the fall, there was a positive correlation between SD and the NDVI in 72.0%, 74.8% and 74.0% of areas in arid, semiarid, and semi-humid, respectively. In winter, SD promoted the growth of overwintering crops, especially for winter wheat, with a positive correlation between the NDVI and SD in 73.8%, 63.7% and 55.6% of semiarid, semi-humid, and arid zones, respectively.
4 Discussions
4.1 Intra-Annual Variation of Normalized Difference Vegetation Index
In this paper, GIMMS NDVI and meteorological data were used to systematically analyze spatiotemporal variation in vegetation cover and associated climate-driven mechanisms in the YRB from 1982 to 2015 at different timescales. The results revealed spatial heterogeneity of annual NDVI in the YRB over the last 34 years, with a decreasing trend from the southeast to the northwest, which was consistent with the findings of previous studies (Lu et al., 2021b; Tian et al., 2021). In the YRB, annual NDVI showed a unimodal distribution, with the highest and the lowest NDVI respectively recorded in the summer months (August) and the winter months (February). Intra-annual variability in annual NDVI values varied considerably throughout the YRB, especially in the semi-humid zone, which showed a marked seasonal pattern due to vegetation changes driven by agricultural activities. The NDVI values for the semi-humid zone peaked in May, followed by a slight decrease in June and another peak in August (Figure 8), which may be related to agricultural activities (Duo et al., 2017). In the YRB, the semi-humid zone was a primary grain-producing region, predominantly producing winter wheat and summer maize. Harvesting of winter wheat in June caused a period of bare land in cultivated areas, which results in a short-term reduction of vegetation cover, followed by an increase in the NDVI in July with the growth of maize and other crops. The results of the present study provided evidence that agricultural activities may have a significant impact on surface vegetation cover in the YRB in particular time periods and areas.
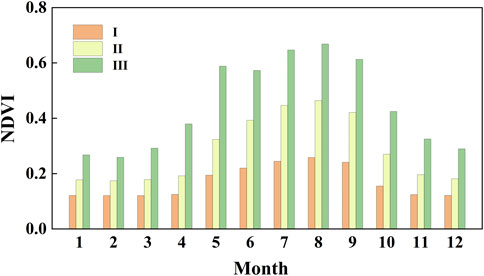
FIGURE 8. Intra-annual variation of NDVI in different climatic zones of the Yellow River Basin.
4.2 Trends and Persistence of Normalized Difference Vegetation Index
The NDVI values showed a significant increasing trend during 1982–2015, indicating that the YRB has experienced significant greening over the past 34 years, which was consistent with the findings of previous research (Zhang et al., 2020; Lu et al., 2021a; Tian et al., 2021). In the present study, the slope of the annual mean NDVI trend in the YRB was 0.0012 years−1 (p < 0.001), which was slightly larger than the annual NDVI trend during 2000–2010 (0.0011 years−1) reported by Jiang et al. (2015). The NDVI products used and the study period may have contributed to this slight difference.
Similar to the observed spatial heterogeneity in the annual NDVI in the different zones in the YRB over the past 34 years, NDVI values varied according to season in these zones. Based on the results on seasonal differences in vegetation greening in the YRB, there was an increasing NDVI trend in the spring, with this trend significantly greater than that in the other seasons, especially in agricultural areas. A significant reduction of NDVI was observed in the areas with high levels of urbanization (e.g., Xi’an, Xining, and Yinchuan), which was primarily the result of urban expansion inhibiting vegetation growth (Miao et al., 2012).
In approximately 85% of the YRB, the Hurst index (H) was greater than 0.05, suggesting that the future trend in vegetation cover change in the YRB is likely to be similar to the historical pattern, that is vegetation cover in the YRB is continuous to increase in the future. Previous studies reached a similar conclusion. For example, Jiang et al. (2015) identified a significant increase in vegetation cover in 53.7% of the YRB over during 2000–2010, with the greatest increase observed in the central basin (corresponding to Zones II and III in this study). Wang et al. (2019) also reported that vegetation cover in most areas of the YRB (73.1%) can be expected to continue to increase. Zhou et al. (2020) found vegetation in China under the future scenarios will have a greening trend in the future. However, vegetation degradation is likely to continue in urban areas, reminding the government to reconcile the urbanization and the ecological conservation.
4.3 Response of Normalized Difference Vegetation Index to Climate Change
Climate change is certainly a critical driver for vegetation dynamics in China (Ge et al., 2021; Yang et al., 2015). Previous studies have indicated that precipitation, temperature and solar radiation were the foremost climatic variables affecting vegetation growth (Luo et al., 2018a; Teng et al., 2020; Wu et al., 2015). The coupling of precipitation, temperature, and solar radiation had promoted to the vegetation greening process in the Yellow River basin over the last 34 years. Overall, precipitation and temperature were the dominant climatic drivers for vegetation dynamics in the YRB, and solar radiation was an important climatic factor influencing changes in vegetation cover (Figure 7) (Li et al., 2019).
Nevertheless, vegetation dynamics were spatially heterogeneous in response to variations of different climatic variables. As illustrated in Figures 7A,D, the increased precipitation significantly contributed to the increase in annual and growing season NDVI in the arid and semiarid zones except for the Qinghai-Tibetan Plateau, while inhibiting the increase of NDVI in the Qinghai-Tibetan Plateau and the semi-humid zones (Jiang et al., 2020; Luo et al., 2018b; Mo et al., 2019). Furthermore, climate warming significantly increased vegetation cover in the YRB at both annual and growing season scales (Figures 7B,E). However, in annual and growing seasonal, vegetation cover was negatively correlated with solar radiation over nearly half of the YRB, while the vegetation cover in the Qinghai-Tibetan Plateau increased with enhanced solar radiation (Figures 7C,F). Due to reduced precipitation and long-term soil water deficits in arid and semiarid zones in the YRB (Supplementary Figure S1), these areas were more sensitive than humid areas were to water availability compared with temperature and SD (Jiang et al., 2020; Mo et al., 2019), as indicated by a positive correlation found between NDVI and precipitation in these regions. Although the semi-humid zone of the YRB experienced slight variations in annual and growing season precipitation (Supplementary Figure S1; Supplementary Table S4), it maintained suitable moisture conditions for vegetation growth through irrigation and a humid climate (Zhang et al., 2020). The reduction in solar radiation due to cloudy and rainy weather can also partially explain the negative response of NDVI to precipitation in the semi-humid zone (Jin et al., 2021). Qinghai-Tibetan Plateau was characterized by cold climatic conditions, vegetation growth was positive influenced by temperature or SD, and the cooling effect of precipitation had a negative impact on vegetation growth (Huang et al., 2016; Chen J. et al., 2020).
Meanwhile, a temporal heterogeneity in the response of vegetation cover to climate change were found in the YRB, as confirmed by the seasonal variations in the correlation between NDVI and climate variables (Figures 7G–R). In spring, vegetation was in the early stages of growth, and it is strongly dependent on water availability as its growth accelerates. Cumulative precipitation during summer and autumn accounts for 85% of annual precipitation (Figures 3B,C), which may have partially relieved the dependence of vegetation on water availability, despite stronger evaporation due to high temperatures and strong solar radiation. We found a negative correlation between the NDVI and precipitation in some parts of the YRB, where winter precipitation caused freezing injury. A new finding of this paper was that winter precipitation positively affected the growth of overwintering crops, such as winter wheat in the southeastern region in Zone III (Xin et al., 2008; Zhao et al., 2018a).
Temperature affected vegetation dynamics by altering phenological (Garonna et al., 2016; Yuan et al., 2020). In spring and autumn, warming extended the vegetation growing season by accelerating the biochemical activity of the vegetation, thus increasing the vegetation cover (Damberg and AghaKouchak, 2014; Liu et al., 2016). An increase in winter temperatures positively affected the growth of overwintering vegetation, especially for winter wheat. As higher summer temperatures result in greater plant respiration and evapotranspiration, there was a negative correlation between summer NDVI and temperature (Zhao et al., 2020). Since sufficient sunlight is required for photosynthesis when vegetation enters the fruiting stage, the NDVI was positively correlated with the SD in the fall. In particular, winter SD provided the light and heat resources needed for winter wheat, thus a positive correlation was recorded in winter wheat growing areas in the semi-humid zone (Tao et al., 2014). However, prolonged SD in summer will increase the depletion of crop and soil moisture, thus restricting crop growth (Wang et al., 2015).
Based on our results, a slight change for precipitation was recorded in the YRB in all timescale during 1982–2015, except the fall (Supplementary Figures S1, S4; Supplementary Tables S1, S4), suggesting that precipitation in the YRB can be expected to slight change in the future. As seen in Supplementary Figures S2, S5; Supplementary Tables S2, S5, most areas of the YRB showed a persistent warming trend (p < 0.05, Hurst index [H] of >0.5), which can be expected to result in continual vegetation greening by extending the vegetation phenological period. Other than in the spring, the SD tended to decrease in all seasons in the YRB, especially in the eastern basin, where a significant decrease in the SD may reduce the inhibiting effect of SD on vegetation growth (Supplementary Figures S3, S6; Supplementary Tables S3, S6). Increased vegetation cover and continued warming will increase evaporation in the YRB with no significant change in basin precipitation, which may exacerbate the drought and water shortage in the YRB, so balancing ecological restoration and water availability may be a key focus for future ecological conservation planning.
In addition to climate change, human activities have a significant impact on vegetation cover. To improve the ecological condition, the Chinese government had proposed several ecological conservation policies and carried out several ecological conservation programs, of which the Grain for Green Program (GGP, 1999) was the largest program (Li G. et al., 2019). For example, the predominant land use conversion in the YRB prior to the implementation of the GGP was from grassland to cropland. The net increase in cropland in the YRB during 1980–2000 was 3,028 km2, 85% of which was converted from grassland (Supplementary Table S7), resulting in a slight increase in annual NDVI (Figure 9). The YRB experienced a significant increase in annual NDVI following the GGP implemented (Figure 9), with a large amount of cropland and grassland converted to woodland (Supplementary Table S7). In the YRB, another prominent land use change has been the rapid addition of construction land, with the net increase in construction land between 2000 and 2015 being 3.4 times greater than that between 1980 and 2000 (Supplementary Table S7). The increase in construction land has encroached on cropland, woodland and grassland, resulting in the degradation of vegetation around cities (Guan et al., 2019), such as Yinchuan, Huhehaote, Taiyuan, and Xi’an (Supplementary Figure S8). Additionally, the vegetation degradation at high altitudes in the western YRB may be related to overgrazing (Hao et al., 2018).
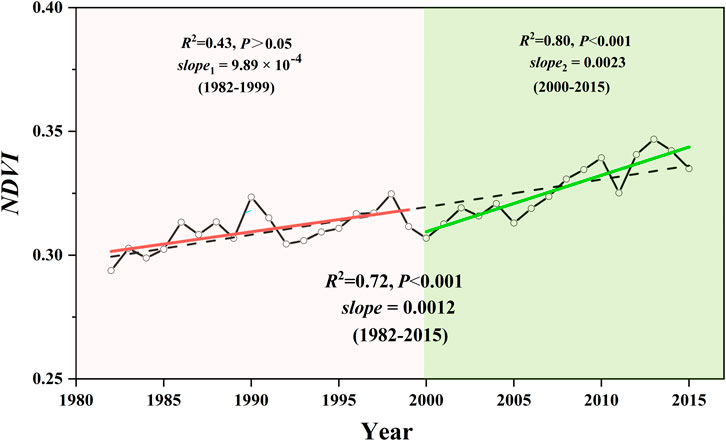
FIGURE 9. Trends of annual NDVI before and after the implementation of the Grain for Green Program launched in 1999.
4.4 Limitations and Suggestions for Future Work
Although the results of this study enhance understanding of spatial and temporal changes in vegetation cover in the YRB and the response of vegetation in the area to climate change, some limitations need to be noted. 1) Although long-term time series data have a number of advantages, the spatial resolution of GIMMS NDVI data is lower than that of MODIS/SPOT NDVI data. Multi-source data fusion could be an option to improve the spatiotemporal resolution of NDVI datasets. 2) Human activities are another important driver of vegetation dynamics in addition to climate change. Therefore, it is essential to accurately distinguish and quantify the contributions of climatic and anthropogenic factors to vegetation dynamics in the Yellow River basin in further studies. 3) Future studies would also consider the impacts of nonanthropogenic factors, such as soil type, hydrology, pests, and nitrogen deposition, on vegetation in the YRB.
5 Conclusion
In this study, based on GIMMS NDVI and observational climate data, we used linear regression, Mann-Kendall, R/S, and partial correlation methods to analyze the spatiotemporal NDVI variations and their response to climatic factors (e.g., precipitation, temperature and sunshine duration) in the YRB at different time periods (annual, growing season and seasonal) and spatial scales (whole basin, climate zone and pixel). The intra-annual NDVI in the YRB showed a unimodal pattern, peaking in August; Annual NDVI spatially decreased from the southeast to northwest, with the semi-humid zone recording the largest NDVI value (0.442 ± 0.013). The YRB had experienced significant warming and greening during 1982–2015, especially in the spring; Whereas precipitation increased slightly in most areas, and there was a significant increase of SD in the spring and a marked decrease in the fall. The NDVI trend can be expected to persistent in the YRB, as the Hurst index of NDVI exceeded 0.5 in More than 85% of the YRB. The response of vegetation dynamics to climate change in the YRB was spatiotemporal heterogeneous, with NDVI responding positively to precipitation and temperature in most areas of the YRB in all timescales expect respectively winter and summer, and a negative correlation between the NDVI and SD was found in nearly half the areas in the YRB. Spatially, vegetation in the arid and semiarid zones were more sensitive to precipitation than to temperature, whereas vegetation in the semi-humid zone was more dependent on temperature; In the high-altitude region, SD was essential for vegetation growth in the spring and autumn.
Data Availability Statement
Publicly available datasets were analyzed in this study. This data can be found here: http://poles.tpdc.ac.cn/en/data/9775f2b4-7370-4e5e-a537-3482c9a83d88/. The GIMMS NDVI 3g.v1 dataset used in our study was originally obtained from ECOCAST (https://ecocast.arc.nasa.gov/data/pub/gimms/3g.v1/), unfortunately ECOCAST is currently not reachable. GIMMS NDVI 3g.v1 is now can also openly available from the Big Earth Data Platform for Three Poles operated by The National Center for Atmospheric Research (http://poles.tpdc.ac.cn/en/data/9775f2b4-7370-4e5e-a537-3482c9a83d88/) (Tucker et al., 2005; Pinzon and Tucker, 2014; The National Center for Atmospheric, 2018).
Author Contributions
CZ performed the data analysis and drafted the manuscript. CL contributed significantly to design the study. LZ conceived the idea of the study and performed the manuscript revision. SJ helped perform the analysis with constructive discussions. KN helped perform the analysis with constructive discussions. YZ was involved in data analysis. LC contributed to the revision of article format. All authors read and approved the final manuscript.
Funding
This study has been supported by the National Natural Science Foundation of China (No. 5210090533).
Conflict of Interest
LC was employed by Power China Northwest Engineering Corporation Limited.
The remaining authors declare that the research was conducted in the absence of any commercial or financial relationships that could be construed as a potential conflict of interest.
Publisher’s Note
All claims expressed in this article are solely those of the authors and do not necessarily represent those of their affiliated organizations, or those of the publisher, the editors and the reviewers. Any product that may be evaluated in this article, or claim that may be made by its manufacturer, is not guaranteed or endorsed by the publisher.
Acknowledgments
We gratefully acknowledge the China Meteorological Administration for providing the available daily meteorological dataset of Yellow River Basin and thank the GIMMS group for providing the GIMMS NDVI 3g dataset. Additionally, we are also grateful to the Institute of Geographic Sciences and Natural Resources Research, Chinese Academy of Sciences (CAS) for providing the land cover and climate zone data.
Supplementary Material
The Supplementary Material for this article can be found online at: https://www.frontiersin.org/articles/10.3389/fenvs.2022.892747/full#supplementary-material
References
An, Y., Gao, W., Gao, Z., Liu, C., and Shi, R. (2015). Trend Analysis for Evaluating the Consistency of Terra MODIS and SPOT VGT NDVI Time Series Products in China. Front. Earth Sci. 9, 125–136. doi:10.1007/s11707-014-0428-9
Bai, Y., Yang, Y., and Jiang, H. (2019). Intercomparison of AVHRR GIMMS3g, Terra MODIS, and SPOT-VGT NDVI Products over the Mongolian Plateau. Remote Sensing 11, 2030. doi:10.3390/rs11172030
Cao, R., Chen, J., Shen, M., and Tang, Y. (2015). An Improved Logistic Method for Detecting spring Vegetation Phenology in Grasslands from MODIS EVI Time-Series Data. Agric. For. Meteorology 200, 9–20. doi:10.1016/j.agrformet.2014.09.009
Chen, C., Park, T., Wang, X., Piao, S., Xu, B., Chaturvedi, R. K., et al. (2019). China and India lead in Greening of the World through Land-Use Management. Nat. Sustain. 2, 122–129. doi:10.1038/s41893-019-0220-7
Chen, J., Yan, F., and Lu, Q. (2020). Spatiotemporal Variation of Vegetation on the Qinghai-Tibet Plateau and the Influence of Climatic Factors and Human Activities on Vegetation Trend (2000-2019). Remote Sensing 12, 3150. doi:10.3390/rs12193150
Chen, Z., Wang, W., and Fu, J. (2020). Vegetation Response to Precipitation Anomalies under Different Climatic and Biogeographical Conditions in China. Sci. Rep. 10, 830. doi:10.1038/s41598-020-57910-1
Chinese Academy of Sciences and Environmental Science Data (2019). “Landuse Dataset in China (1980-2015),” in National Tibetan Plateau Data. National Tibetan Plateau Data Center
Chu, H., Venevsky, S., Wu, C., and Wang, M. (2019). NDVI-based Vegetation Dynamics and its Response to Climate Changes at Amur-Heilongjiang River Basin from 1982 to 2015. Sci. Total Environ. 650, 2051–2062. doi:10.1016/j.scitotenv.2018.09.115
Damberg, L., and AghaKouchak, A. (2014). Global Trends and Patterns of Drought from Space. Theor. Appl. Climatol 117, 441–448. doi:10.1007/s00704-013-1019-5
De Jong, R., de Bruin, S., de Wit, A., Schaepman, M. E., and Dent, D. L. (2011). Analysis of Monotonic Greening and browning Trends from Global NDVI Time-Series. Remote Sensing Environ. 115, 692–702. doi:10.1016/j.rse.2010.10.011
Duan, H., Xue, X., Wang, T., Kang, W., Liao, J., and Liu, S. (2021). Spatial and Temporal Differences in Alpine Meadow, Alpine Steppe and All Vegetation of the Qinghai-Tibetan Plateau and Their Responses to Climate Change. Remote Sensing 13, 669. doi:10.3390/rs13040669
Duo, A., Zhao, W., Gong, Z., Zhang, M., and Fan, Y. (2017). Temporal Analysis of Climate Change and its Relationship with Vegetation Cover on the north china plain from 1981 to 2013. Acta Ecologica Sinica 2, 576–592. (in Chinese). doi:10.5846/stxb201507301600
Fang, W., Huang, S., Huang, Q., Huang, G., Wang, H., Leng, G., et al. (2019). Probabilistic Assessment of Remote Sensing-Based Terrestrial Vegetation Vulnerability to Drought Stress of the Loess Plateau in China. Remote Sensing Environ. 232, 111290. doi:10.1016/j.rse.2019.111290
Fensholt, R., Rasmussen, K., Nielsen, T. T., and Mbow, C. (2009). Evaluation of Earth Observation Based Long Term Vegetation Trends - Intercomparing NDVI Time Series Trend Analysis Consistency of Sahel from AVHRR GIMMS, Terra MODIS and SPOT VGT Data. Remote Sensing Environ. 113, 1886–1898. doi:10.1016/j.rse.2009.04.004
Gamon, J. A., Field, C. B., Goulden, M. L., Griffin, K. L., Hartley, A. E., Joel, G., et al. (1995). Relationships between NDVI, Canopy Structure, and Photosynthesis in Three Californian Vegetation Types. Ecol. Appl. 5, 28–41. doi:10.2307/1942049
Garonna, I., de Jong, R., and Schaepman, M. E. (2016). Variability and Evolution of Global Land Surface Phenology over the Past Three Decades (1982-2012). Glob. Change Biol. 22, 1456–1468. doi:10.1111/gcb.13168
Ge, W., Deng, L., Wang, F., and Han, J. (2021). Quantifying the Contributions of Human Activities and Climate Change to Vegetation Net Primary Productivity Dynamics in China from 2001 to 2016. Sci. Total Environ. 773, 145648. doi:10.1016/j.scitotenv.2021.145648
Guan, X., Shen, H., Li, X., Gan, W., and Zhang, L. (2019). A Long-Term and Comprehensive Assessment of the Urbanization-Induced Impacts on Vegetation Net Primary Productivity. Sci. Total Environ. 669, 342–352. doi:10.1016/j.scitotenv.2019.02.361
Guo, B., Niu, Y., subrahmanyam Mantravadi, V., Zhang, L., and Liu, G. (2021). The Variation of Rainfall Runoff after Vegetation Restoration in Upper Reaches of the Yellow River by the Remote Sensing Technology. Environ. Sci. Pollut. R. 28 (36), 50707–50717. doi:10.1007/s11356-021-14279-6
Hao, L., Pan, C., Fang, D., Zhang, X., Zhou, D., Liu, P., et al. (2018). Quantifying the Effects of Overgrazing on Mountainous Watershed Vegetation Dynamics under a Changing Climate. Sci. Total Environ. 639, 1408–1420. doi:10.1016/j.scitotenv.2018.05.224
Holben, B. N. (1986). Characteristics of Maximum-Value Composite Images from Temporal AVHRR Data. Int. J. remote sensing 7, 1417–1434. doi:10.1080/01431168608948945
Hou, W., and Hou, X. (2020). Spatial-temporal Changes in Vegetation Coverage in the Global Coastal Zone Based on GIMMS NDVI3g Data. Int. J. Remote Sensing 41, 1118–1138. doi:10.1080/01431161.2019.1657603
Hu, M., and Xia, B. (2019). A Significant Increase in the Normalized Difference Vegetation index during the Rapid Economic Development in the Pearl River Delta of China. Land Degrad. Dev. 30, 359–370. doi:10.1002/ldr.3280
Hua, W., Chen, H., Zhou, L., Xie, Z., Qin, M., Li, X., et al. (2017). Observational Quantification of Climatic and Human Influences on Vegetation Greening in China. Remote Sensing 9, 425. doi:10.3390/rs9050425
Huang, K., Zhang, Y., Zhu, J., Liu, Y., Zu, J., and Zhang, J. (2016). The Influences of Climate Change and Human Activities on Vegetation Dynamics in the Qinghai-Tibet Plateau. Remote Sensing 8, 876. doi:10.3390/rs8100876
Hurst, H. (1951). Long-term Storage Capacity of Reservoirs. Trans. Am. Soc. Civ. 116 (1), 770–799. doi:10.1061/taceat.0006518
Ji, H., Chen, S., Pan, S., Xu, C., Jiang, C., and Fan, Y. (2018). Morphological Variability of the Active Yellow River Mouth under the New Regime of Riverine Delivery. J. Hydrol. 564, 329–341. doi:10.1016/j.jhydrol.2018.07.014
Jia, L., Li, Z. B., Xu, G. C., Ren, Z. P., Li, P., Cheng, Y. T., et al. (2020). Dynamic Change of Vegetation and its Response to Climate and Topographic Factors in the Xijiang River basin, China. Environ. Sci. Pollut. Res. Int. 27, 11637–11648. doi:10.1007/s11356-020-07692-w
Jiang, H., Xu, X., Guan, M., Wang, L., Huang, Y., and Jiang, Y. (2020). Determining the Contributions of Climate Change and Human Activities to Vegetation Dynamics in Agro-Pastural Transitional Zone of Northern China from 2000 to 2015. Sci. Total Environ. 718, 134871. doi:10.1016/j.scitotenv.2019.134871
Jiang, P., Ding, W., Yuan, Y., Ye, W., and Mu, Y. (2022). Interannual Variability of Vegetation Sensitivity to Climate in China. J. Environ. Manage. 301, 113768. doi:10.1016/j.jenvman.2021.113768
Jiang, W., Yuan, L., Wang, W., Cao, R., Zhang, Y., and Shen, W. (2015). Spatio-temporal Analysis of Vegetation Variation in the Yellow River Basin. Ecol. Indicators 51, 117–126. doi:10.1016/j.ecolind.2014.07.031
Jin, K., Jin, Y., Wang, F., Wang, S., Liu, C., and Wang, S. (2021). Impacts of Anthropogenic Activities on Vegetation Cover Changes in the Circum-Bohai-Sea Region, China. Geocarto Int., 1–16. doi:10.1080/10106049.2021.2017016
Kendall, M. G. (1938). A New Measure of Rank Correlation. Biometrika 30, 81–93. doi:10.1093/biomet/30.1-2.81
Li, G., Sun, S., Han, J., Yan, J., Liu, W., Wei, Y., et al. (2019). Impacts of Chinese Grain for Green Program and Climate Change on Vegetation in the Loess Plateau during 1982-2015. Sci. Total Environ. 660, 177–187. doi:10.1016/j.scitotenv.2019.01.028
Li, P., Wang, J., Liu, M., Xue, Z., Bagherzadeh, A., and Liu, M. (2021). Spatio-temporal Variation Characteristics of NDVI and its Response to Climate on the Loess Plateau from 1985 to 2015. Catena 203, 105331. doi:10.1016/j.catena.2021.105331
Li, Y., Xie, Z., Qin, Y., and Zheng, Z. (2019). Responses of the Yellow River basin Vegetation: Climate Change. Int. J. Clim. Change Strateg. Manage. 11 (4), 483–498. doi:10.1108/ijccsm-08-2018-0064
Liu, C., Melack, J., Tian, Y., Huang, H., Jiang, J., Fu, X., et al. (2019). Detecting Land Degradation in Eastern China Grasslands with Time Series Segmentation and Residual Trend Analysis (TSS-RESTREND) and GIMMS NDVI3g Data. Remote Sensing 11, 1014. doi:10.3390/rs11091014
Liu, H., Jiao, F., Yin, J., Li, T., Gong, H., Wang, Z., et al. (2020). Nonlinear Relationship of Vegetation Greening with Nature and Human Factors and its Forecast - A Case Study of Southwest China. Ecol. Indicators 111, 106009. doi:10.1016/j.ecolind.2019.106009
Liu, L., Yang, X., Zhou, H., Liu, S., Zhou, L., Li, X., et al. (2018). Evaluating the Utility of Solar-Induced Chlorophyll Fluorescence for Drought Monitoring by Comparison with NDVI Derived from Wheat Canopy. Sci. Total Environ. 625, 1208–1217. doi:10.1016/j.scitotenv.2017.12.268
Liu, Q., Fu, Y. H., Zeng, Z., Huang, M., Li, X., and Piao, S. (2016). Temperature, Precipitation, and Insolation Effects on Autumn Vegetation Phenology in Temperate China. Glob. Change Biol. 22, 644–655. doi:10.1111/gcb.13081
Liu, X., Zhang, J., Zhu, X., Pan, Y., Liu, Y., Zhang, D., et al. (2014). Spatiotemporal Changes in Vegetation Coverage and its Driving Factors in the Three-River Headwaters Region during 2000-2011. J. Geogr. Sci. 24, 288–302. doi:10.1007/s11442-014-1088-0
Liu, Z., Liu, Y., and Li, Y. (2018). Anthropogenic Contributions Dominate Trends of Vegetation Cover Change over the Farming-Pastoral Ecotone of Northern China. Ecol. Indicators 95, 370–378. doi:10.1016/j.ecolind.2018.07.063
Lu, C., Hou, M., Liu, Z., Li, H., and Lu, C. (2021a). Variation Characteristic of NDVI and its Response to Climate Change in the Middle and Upper Reaches of Yellow River Basin, China. IEEE J. Sel. Top. Appl. Earth Observations Remote Sensing 14, 8484–8496. doi:10.1109/jstars.2021.3105897
Lu, C., Hou, M., Liu, Z., Li, H., and Lu, C. (2021b). Variation Characteristic of NDVI and its Response to Climate Change in the Yellow River Basin, China. Ieee J-Stars 14, 8484–8496. doi:10.1109/jstars.2021.3105897
Lucht, W., Prentice, I. C., Myneni, R. B., Sitch, S., Friedlingstein, P., Cramer, W., et al. (2002). Climatic Control of the High-Latitude Vegetation Greening Trend and Pinatubo Effect. Science 296, 1687–1689. doi:10.1126/science.1071828
Luo, L., Ma, W., Zhuang, Y., Zhang, Y., Yi, S., Xu, J., et al. (2018). The Impacts of Climate Change and Human Activities on alpine Vegetation and Permafrost in the Qinghai-Tibet Engineering Corridor. Ecol. Indicators 93, 24–35. doi:10.1016/j.ecolind.2018.04.067
Luo, Z., Wu, W., Yu, X., Song, Q., Yang, J., Wu, J., et al. (2018). Variation of Net Primary Production and its Correlation with Climate Change and Anthropogenic Activities over the Tibetan Plateau. Remote Sensing 10, 1352. doi:10.3390/rs10091352
Mandelbrot, B. B., and Wallis, J. R. (1969). Robustness of the Rescaled Range R/S in the Measurement of Noncyclic Long Run Statistical Dependence. Water Resour. Res. 5, 967–988. doi:10.1029/wr005i005p00967
Mann, H. B. (1945). Nonparametric Tests against Trend. Econometrica 13, 245–259. doi:10.2307/1907187
Mao, D., Wang, Z., Luo, L., and Ren, C. (2012). Integrating AVHRR and MODIS Data to Monitor NDVI Changes and Their Relationships with Climatic Parameters in Northeast China. Int. J. Appl. Earth Observation Geoinformation 18, 528–536. doi:10.1016/j.jag.2011.10.007
Meng, Z., Liu, M., Gao, C., Zhang, Y., She, Q., Long, L., et al. (2020). Greening and browning of the Coastal Areas in mainland China: Spatial Heterogeneity, Seasonal Variation and its Influential Factors. Ecol. Indicators 110, 105888. doi:10.1016/j.ecolind.2019.105888
Miao, C. Y., Yang, L., Chen, X. H., and Gao, Y. (2012). The Vegetation Cover Dynamics (1982-2006) in Different Erosion Regions of the Yellow River Basin, China. Land Degrad. Dev. 23, 62–71. doi:10.1002/ldr.1050
Mo, K., Chen, Q., Chen, C., Zhang, J., Wang, L., and Bao, Z. (2019). Spatiotemporal Variation of Correlation between Vegetation Cover and Precipitation in an Arid Mountain-Oasis River basin in Northwest China. J. Hydrol. 574, 138–147. doi:10.1016/j.jhydrol.2019.04.044
Myneni, R. B., Hall, F. G., Sellers, P. J., and Marshak, A. L. (1995). The Interpretation of Spectral Vegetation Indexes. IEEE Trans. Geosci. Remote Sensing 33, 481–486. doi:10.1109/36.377948
Nie, Q., Xu, J., Li, Z., and Hong, Y. (2012). Spatial-temporal Variations of Vegetation Cover in Yellow River Basin of China during 1998–2008. Sci. Cold Arid Reg. 4, 211. doi:10.3724/sp.j.1226.2012.00211
Pan, N., Feng, X., Fu, B., Wang, S., Ji, F., and Pan, S. (2018). Increasing Global Vegetation browning Hidden in Overall Vegetation Greening: Insights from Time-Varying Trends. Remote Sensing Environ. 214, 59–72. doi:10.1016/j.rse.2018.05.018
Pei, F., Wu, C., Liu, X., Li, X., Yang, K., Zhou, Y., et al. (2018). Monitoring the Vegetation Activity in China Using Vegetation Health Indices. Agric. For. Meteorology 248, 215–227. doi:10.1016/j.agrformet.2017.10.001
Peng, S., Piao, S., Ciais, P., Myneni, R. B., Chen, A., Chevallier, F., et al. (2013). Asymmetric Effects of Daytime and Night-Time Warming on Northern Hemisphere Vegetation. Nature 501, 88–92. doi:10.1038/nature12434
Piao, S., Nan, H., Huntingford, C., Ciais, P., Friedlingstein, P., Sitch, S., et al. (2014). Evidence for a Weakening Relationship between Interannual Temperature Variability and Northern Vegetation Activity. Nat. Commun. 5, 5018. doi:10.1038/ncomms6018
Piao, S., Tan, K., Nan, H., Ciais, P., Fang, J., Wang, T., et al. (2012). Impacts of Climate and CO2 Changes on the Vegetation Growth and Carbon Balance of Qinghai-Tibetan Grasslands over the Past Five Decades. Glob. Planet. Change 98-99, 73–80. doi:10.1016/j.gloplacha.2012.08.009
Piao, S., Yin, G., Tan, J., Cheng, L., Huang, M., Li, Y., et al. (2015). Detection and Attribution of Vegetation Greening Trend in China over the Last 30 Years. Glob. Change Biol. 21, 1601–1609. doi:10.1111/gcb.12795
Pinzon, J.E., and Tucker, C.J (2014). A Non-Stationary 1981–2012 AVHRR NDVI3g Time Series. Remote Sens. 6, 6929–6960. doi:10.1111/gcb.12795
Qu, B., Zhu, W., Jia, S., and Lv, A. (2015). Spatio-temporal Changes in Vegetation Activity and its Driving Factors during the Growing Season in China from 1982 to 2011. Remote Sensing 7, 13729–13752. doi:10.3390/rs71013729
Shen, Q., Gao, G., Han, F., Xiao, F., Ma, Y., Wang, S., et al. (2018). Quantifying the Effects of Human Activities and Climate Variability on Vegetation Cover Change in a Hyper‐arid Endorheic basin. Land Degrad. Develop. 29, 3294–3304. doi:10.1002/ldr.3085
Sun, R., Chen, S., and Su, H. (2021). Climate Dynamics of the Spatiotemporal Changes of Vegetation NDVI in Northern China from 1982 to 2015. Remote Sensing 13, 187. doi:10.3390/rs13020187
Sweet, S. K., Asmus, A., Rich, M. E., Wingfield, J., Gough, L., and Boelman, N. T. (2015). NDVI as a Predictor of Canopy Arthropod Biomass in the Alaskan Arctic Tundra. Ecol. Appl. 25, 779–790. doi:10.1890/14-0632.1
Tao, F., Zhang, Z., Xiao, D., Zhang, S., Rötter, R. P., Shi, W., et al. (2014). Responses of Wheat Growth and Yield to Climate Change in Different Climate Zones of China, 1981-2009. Agric. For. Meteorology 189-190, 91–104. doi:10.1016/j.agrformet.2014.01.013
Tao, J., Xu, T., Dong, J., Yu, X., Jiang, Y., Zhang, Y., et al. (2018). Elevation-dependent Effects of Climate Change on Vegetation Greenness in the High Mountains of Southwest China during 1982-2013. Int. J. Climatol 38, 2029–2038. doi:10.1002/joc.5314
Teng, M., Zeng, L., Hu, W., Wang, P., Yan, Z., He, W., et al. (2020). The Impacts of Climate Changes and Human Activities on Net Primary Productivity Vary across an Ecotone Zone in Northwest China. Sci. Total Environ. 714, 136691. doi:10.1016/j.scitotenv.2020.136691
The National Center for Atmospheric Research (2018). Global GIMMS NDVI3g v1 Dataset (1981–2015). A Big Earth Data Platform for Three Poles.
Tian, F., Liu, L.-Z., Yang, J.-H., and Wu, J.-J. (2021). Vegetation Greening in More Than 94% of the Yellow River Basin (YRB) Region in China during the 21st century Caused Jointly by Warming and Anthropogenic Activities. Ecol. Indic. 125, 107479. doi:10.1016/j.ecolind.2021.107479
Tucker, C.J, Pinzon, J.E., Brown, M.E., Slayback, D.A., Pak, E.W., et al. (2005). An Extended AVHRR 8-km NDVI Dataset Compatible With MODIS and SPOT Vegetation NDVI Data. Int. J. Remote Sens. 26, 4485–4498. doi:10.1016/j.ecolind.2021.107479
Wang, H., Liu, D., Lin, H., Montenegro, A., and Zhu, X. (2015). NDVI and Vegetation Phenology Dynamics under the Influence of sunshine Duration on the Tibetan Plateau. Int. J. Climatol 35, 687–698. doi:10.1002/joc.4013
Wang, J., Meng, J. J., and Cai, Y. L. (2008). Assessing Vegetation Dynamics Impacted by Climate Change in the Southwestern Karst Region of China with AVHRR NDVI and AVHRR NPP Time-Series. Environ. Geol. 54, 1185–1195. doi:10.1007/s00254-007-0901-9
Wang, M., Fu, J. e., Wu, Z., and Pang, Z. (2020). Spatiotemporal Variation of NDVI in the Vegetation Growing Season in the Source Region of the Yellow River, China. Ijgi 9, 282. doi:10.3390/ijgi9040282
Wang, T., Yang, M., Yan, S., Geng, G., Li, Q., and Wang, F. (2020). Temporal and Spatial Vegetation Index Variability and Response to Temperature and Precipitation in the Qinghai-Tibet Plateau Using GIMMS NDVI. Pol. J. Environ. Stud. 29, 4385–4395. doi:10.15244/pjoes/120768
Wang, W., Sun, L., and Luo, Y. (2019). Changes in Vegetation Greenness in the Upper and Middle Reaches of the Yellow River Basin over 2000-2015. Sustainability 11, 2176. doi:10.3390/su11072176
Wu, D., Zhao, X., Liang, S., Zhou, T., Huang, K., Tang, B., et al. (2015). Time-lag Effects of Global Vegetation Responses to Climate Change. Glob. Change Biol. 21, 3520–3531. doi:10.1111/gcb.12945
Xie, X., He, B., Guo, L., Miao, C., and Zhang, Y. (2019). Detecting Hotspots of Interactions between Vegetation Greenness and Terrestrial Water Storage Using Satellite Observations. Remote Sensing Environ. 231, 111259. doi:10.1016/j.rse.2019.111259
Xin, Z., Xu, J., and Zheng, W. (2008). Spatiotemporal Variations of Vegetation Cover on the Chinese Loess Plateau (1981-2006): Impacts of Climate Changes and Human Activities. Sci. China Ser. D-earth Sci. 51, 67–78. doi:10.1007/s11430-007-0137-2
Xu, S., Yu, Z., Yang, C., Ji, X., and Zhang, K. (2018). Trends in Evapotranspiration and Their Responses to Climate Change and Vegetation Greening over the Upper Reaches of the Yellow River Basin. Agric. For. Meteorology 263, 118–129. doi:10.1016/j.agrformet.2018.08.010
Yang, Q., Zhang, H., Peng, W., Lan, Y., Luo, S., Shao, J., et al. (2019). Assessing Climate Impact on forest Cover in Areas Undergoing Substantial Land Cover Change Using Landsat Imagery. Sci. Total Environ. 659, 732–745. doi:10.1016/j.scitotenv.2018.12.290
Yang, Y., Guan, H., Shen, M., Liang, W., and Jiang, L. (2015). Changes in Autumn Vegetation Dormancy Onset Date and the Climate Controls across Temperate Ecosystems in China from 1982 to 2010. Glob. Change Biol. 21, 652–665. doi:10.1111/gcb.12778
Yao, R., Cao, J., Wang, L., Zhang, W., and Wu, X. (2019). Urbanization Effects on Vegetation Cover in Major African Cities during 2001-2017. Int. J. Appl. Earth Observation Geoinformation 75, 44–53. doi:10.1016/j.jag.2018.10.011
Ye, W., van Dijk, A. I. J. M., Huete, A., and Yebra, M. (2021). Global Trends in Vegetation Seasonality in the GIMMS NDVI3g and Their Robustness. Int. J. Appl. Earth Observation Geoinformation 94, 102238. doi:10.1016/j.jag.2020.102238
Yuan, M., Zhao, L., Lin, A., Li, Q., She, D., and Qu, S. (2020). How Do Climatic and Non-climatic Factors Contribute to the Dynamics of Vegetation Autumn Phenology in the Yellow River Basin, China? Ecol. Indicators 112, 106112. doi:10.1016/j.ecolind.2020.106112
Zhang, B., Tian, L., Zhao, X., and Wu, P. (2021). Feedbacks between Vegetation Restoration and Local Precipitation over the Loess Plateau in China. Sci. China Earth Sci. 64, 920–931. doi:10.1007/s11430-020-9751-8
Zhang, W., Wang, L., Xiang, F., Qin, W., and Jiang, W. (2020). Vegetation Dynamics and the Relations with Climate Change at Multiple Time Scales in the Yangtze River and Yellow River Basin, China. Ecol. Indicators 110, 105892. doi:10.1016/j.ecolind.2019.105892
Zhang, Y., Liang, W., Liao, Z., Han, Z., Xu, X., Jiao, R., et al. (2019). Effects of Climate Change on lake Area and Vegetation Cover over the Past 55 Years in Northeast Inner Mongolia Grassland, China. Theor. Appl. Climatol 138, 13–25. doi:10.1007/s00704-019-02802-2
Zhang, Y., Zhu, Z., Liu, Z., Zeng, Z., Ciais, P., Huang, M., et al. (2016). Seasonal and Interannual Changes in Vegetation Activity of Tropical Forests in Southeast Asia. Agric. For. Meteorology 224, 1–10. doi:10.1016/j.agrformet.2016.04.009
Zhao, A., Zhang, A., Cao, S., Liu, X., Liu, J., and Cheng, D. (2018). Responses of Vegetation Productivity to Multi-Scale Drought in Loess Plateau, China. Catena 163, 165–171. doi:10.1016/j.catena.2017.12.016
Zhao, J., Huang, S., Huang, Q., Wang, H., Leng, G., and Fang, W. (2020). Time-lagged Response of Vegetation Dynamics to Climatic and Teleconnection Factors. Catena 189, 104474. doi:10.1016/j.catena.2020.104474
Zhao, L., Dai, A., and Dong, B. (2018). Changes in Global Vegetation Activity and its Driving Factors during 1982-2013. Agric. For. Meteorology 249, 198–209. doi:10.1016/j.agrformet.2017.11.013
Zhou, Z., Ding, Y., Shi, H., Cai, H., Fu, Q., Liu, S., et al. (2020). Analysis and Prediction of Vegetation Dynamic Changes in China: Past, Present and Future. Ecol. Indicators 117, 106642. doi:10.1016/j.ecolind.2020.106642
Zhu, Z., Bi, J., Pan, Y., Ganguly, S., Anav, A., Xu, L., et al. (2013). Global Data Sets of Vegetation Leaf Area Index (LAI)3g and Fraction of Photosynthetically Active Radiation (FPAR)3g Derived from Global Inventory Modeling and Mapping Studies (GIMMS) Normalized Difference Vegetation Index (NDVI3g) for the Period 1981 to 2011. Remote Sensing 5, 927–948. doi:10.3390/rs5020927
Keywords: vegetation dynamics, NDVI, Yellow River Basin, spatiotemporal variations, climate drivers
Citation: Zhan C, Liang C, Zhao L, Jiang S, Niu K, Zhang Y and Cheng L (2022) Vegetation Dynamics and its Response to Climate Change in the Yellow River Basin, China. Front. Environ. Sci. 10:892747. doi: 10.3389/fenvs.2022.892747
Received: 09 March 2022; Accepted: 31 March 2022;
Published: 25 April 2022.
Edited by:
Juergen Pilz, University of Klagenfurt, AustriaCopyright © 2022 Zhan, Liang, Zhao, Jiang, Niu, Zhang and Cheng. This is an open-access article distributed under the terms of the Creative Commons Attribution License (CC BY). The use, distribution or reproduction in other forums is permitted, provided the original author(s) and the copyright owner(s) are credited and that the original publication in this journal is cited, in accordance with accepted academic practice. No use, distribution or reproduction is permitted which does not comply with these terms.
*Correspondence: Lu Zhao, emhhb2x1c2N1MTEyMUAxMjYuY29t