 Chuanhui Wang
- 1School of Economics, Qufu Normal University, Rizhao, China
- 2Lianyun District Economic Development Bureau, Lianyungang, China
In recent years, China’s green development has entered a new stage with profound changes in development conditions. Progress in development has put forward higher requirements for the safe and stable operation of the financial and economic environment. This paper predicts the default probability of the scale of green bond debt that should be repaid by municipal governments in Shandong Province from 2020 to 2022 and combines the KMV-Logistics mixed model to provide new ideas for the existing local government debt early warning indicator system. This paper draws the following main conclusions: On the whole, it is predicted that the debt situations faced by local governments in Shandong Province in issuing green bonds from 2020 to 2022 are as follows: the municipalities with high debt risks in 2020 include Dezhou, Liaocheng, and Zaozhuang; the cities with high debt risk in Shandong Province in 2021 include Linyi, Heze, Dezhou, and Weihai; the cities in Shandong Province with high debt risk in 2022 include Dezhou, Heze, Rizhao, and Zaozhuang, among which, Zaozhuang and Dezhou have been in high-risk states for three consecutive years. Therefore, in order to reasonably control the debt risks faced by local governments in Shandong Province issuing green bonds, it is necessary to take multiple measures to strengthen the supervision of local government debt borrowing methods, dynamically monitor and prevent local government debt risks, and effectively strengthen the management of local government debt funds.
1 Introduction
At present, carbon peaking and carbon neutralization are one of the key tasks of the Chinese government’s economic work. China has made remarkable achievements in green development over the years. Supported by the upgrading of traditional industries and guided by the development of green emerging industries, China has promoted technological innovation, created jobs and reduced the negative impact of economic and social development on resource and energy consumption and the environment, while maintaining steady economic growth, which is inseparable from the vigorous construction of local governments at all levels, while in the process of continuous development, the issuance of green bonds by local governments in China also contains debt risks.
Economic development and social construction cannot be separated from local government debt, which means borrowing future funds to provide financial support for the construction of local infrastructure. In order to meet the needs of development, the central government and Shandong Province have issued a series of management measures to scientifically manage government debt. In 2017, the Shandong Provincial Government issued relevant documents by the General Office of the People’s Government from the perspective of risk prevention and debt resolution, which clearly point out the relevant policies and targeted measures related to the prevention and control of debt risk, including controlling the scale of new local government debt and coordinating the cooperation between the government and social capital within a reasonable range. As of December 2019, the total debt of governments at all levels in Shandong Province was 1.31 trillion yuan, and the debt ratio was seventy-seven percent. For green bonds in Shandong Province, in 2016, the Bank of Qingdao was approved as the first urban commercial bank in China to issue green financial bonds. At present, the bank has 8 billion yuan of green finance bonds on deposit, and all the funds raised are invested in the green sector. In 2017, Qingdao Rural Commercial Bank and Yantai Bank were approved as green financial bonds, with 3 billion yuan and 1 billion yuan remaining, respectively. In 2018, Weihai Commercial Bank and Qilu Bank were also qualified to issue, with deposits of 2 billion yuan and 3 billion yuan, respectively. As for the proportion of green bonds issued in Shandong Province, according to the research report on China’s green bond market 2019, the number of green bonds issued and the size of green bonds issued in 2019 accounted for 1.32% and 1.65% of the total number of green bonds issued and the size of green bonds issued in 2019, respectively, which was higher than the level of the same period in 2018 (the number of green bonds issued accounted for 0.9% and the issuance scale accounted for 0.78%), indicating the rapid development of the green bond market, but there is still a large space for future development. Although the government’s debt is controlled within the scope of the government’s affordability, the government is still facing a high comprehensive debt ratio and is under great pressure to repay external debts in the short term. The Outline of the 14th Five-Year Plan points out that in the next step of implementing the financial security strategy, the government should continue to improve mechanisms for identifying, assessing, and effectively preventing and controlling debt risks, improve mechanisms for dealing with defaults in the bond market, prudently defuse hidden local government debt, severely punish evasion of debts and waste, and improve mechanisms for identifying and warning major risks.
Therefore, these problems are the key issues to be solved urgently in China during the transition period. This paper takes this as the starting point for in-depth discussion. By observing the fiscal and debt data of 16 prefectures and cities in Shandong Province from 2015 to 2019 and conducting empirical analysis in combination with the KMV-Logistics mixed model, the paper aims to evaluate and warn of the debt risks faced by local governments issuing green bonds in Shandong Province and put forward targeted suggestions.
2 Literature Review
Research on the risks, causes, and characteristics of government debt. Local government’s financial system, large scale debt financing channels, and investment expenditure lead to the risk of government debt default. Academics first paid attention to the risk of government debt. Buiter (1985) put forward that if the government defaults on the debt it should bear, then the fiscal stability of this policy will inevitably be affected. Hildreth and Miller (2002) and other experts hold the following view on local government debt: under the premise of sufficient financial funds, the government does not need to raise funds from outside; if its own fiscal revenue is not enough to meet the needs of local economic construction, it can obtain enough funds to invest in local economic construction through debt to maintain the sustainable development of the local economy. Fenn and Liang (1997) estimated the cross-sectional relationship between open market repurchases and accounting data for a large sample of dividend-paying and non-dividend-paying firms over a 12-year period. It found that repurchases are positively related to proxies for free cash flow and negatively related to proxies for marginal financing costs. Fu et al. (2013) pointed out that there are many reasons for the expansion of government debt scale, but the fundamental reason for the high risk of government debt at all levels is the separation of powers and responsibilities. Mao et al. (2018) constructed a DSGE model and found that the scale of local government debt would show a cyclical change, which was mainly affected by the impulse of government investment. Sun et al. (2021) indicated that institutional quality matters in energy efficiency improvement and that being close to China with a good institutional framework has a positive effect on China’s energy efficiency. He and Jia (2020) discussed the fiscal relationship between the central and local governments within the framework of modern monetary theory, and pointed out that the competition for the promotion of local officials and China’s fiscal system leads to the risk of the growth of local government debt scale. Khan et al. (2021) analyzed the impact of financial innovation and sustainable economic growth on the credit risk of ASEAN banks by applying the panel corrected standard error (PCSE) method and found that both variables are important factors of credit risk. The study not only benefits the management of ASEAN national banks but also helps the entire financial industry and their respective regulators understand the credit risk behavior of ASEAN banks in relation to financial innovation and economic growth.
Research on the traditional early warning model. Leigland (2010) used the KMV model to study and analyze the government debt problems of emerging countries. Hana (1998) first proposed an important concept to analyze government debt, “the fiscal risk matrix.” Han et al. (2003) introduced the KMV model into the field of government debt analysis in China and used this model to measure government debt risk by optimizing some parameters of the model. Bohn (2007) constructed a dynamic fiscal response function model to assess the risk of government debt based on the sustainability of government revenue. Jiang (2011) used the revised KMV model based on the debt data of Jiangsu Province from 2000 to 2008 and put forward the debt scale that Jiangsu Province can bear under the premise of controllable risk and financial stability. Xie and Chen (2012) combined the BP neural network method with grey correlation theory, and found that the amount of local government debt showed a significant increase trend during the 3 years from 2007 to 2009, which led to debt risk spiraling out of control. Li et al. (2013), basing on the theoretical assumption that the debt undertaken by the government can be transferred, believe that default risk will not occur in local governments in China. On the basis of existing research, Ismailescu and Phillips (2015) analyze the determinants and implications of the initiation of sovereign bond credit default swap (CDS) transactions. For countries with high default risk, CDS initiation offers significant price efficiency advantages in the underlying market. Li et al. (2016) constructed a nonlinear model with limited constraints to improve the current local government debt risk warning mechanism. Fang and Chai (2017) used the KMV model to select provinces with typical significance in the four regions of the east, central, west, and northeast, respectively, to measure the debt default rates of local governments with different maturities and sizes, and based on the calculated data, determine a reasonable amount of government bonds to issue. Wu and Zhang (2018) used the KMV model to calculate the probability of debt default in each province in China in the future, and the result is that, with the passage of time, the risk of local government debt has gradually emerged, and there are different differentiation trends between the west and east. By using the two-dimensional framework of flow and stock, Hong and Hu (2018) concluded that the debt risk of the government in the western region is significantly higher than that of the eastern region. Xu and Liu (2018) used the revised KMV model to assess the debt risk of 31 provincial local governments in China and pointed out that if we want to develop the current local government debt sustainably, the scale of funds needed has exceeded the scope of fiscal revenue.
Research on the early warning index system. Pei and Ouyang (2006) integrated some indicators on the balance sheet and income statement into a complete early-warning indicator system by using quantitative analysis, based on which the risk of government debt in many places can be assessed. By building an empirical recursive model, Pang and Li (2015) studied in detail the influence of the following indicators on the debt burden ratio, namely the real growth rate of GDP, inflation rate, real interest rate, and unemployment rate. The sustainability model of local government debt constructed by Diao (2016) points out that the risk of local government debt in sustainable development is affected by fiscal expenditure, debt stock, and macroeconomic invisibility. Sun et al. (2020) used the Interpretive Structural Modeling methods to establish a hierarchical structure of the risks involved. The results showed a strong correlation among the risk factors. The risk databases of the BRI need to be established in order to ensure efficient green investments. Zhang et al. (2021) used the entropy method to study and analyze the structural debt risk of local governments in 30 provinces and cities in China. They comprehensively evaluated the default and expectation of local government debt and pointed out those 13 cities were in a medium-early warning state. Li et al. (2016) transformed debt risk into a model with nonlinear programming but limited constraints, hoping to improve the current early warning mechanism. Jin et al. (2020) designed a set of debt risk early-warning index systems based on the debt operation process.
With the unremitting persistence of experts and scholars from all walks of life, two methods were finally formed: one is the structured model method; the other is the statistical law method. In practical applications, structured models are mainly used to collect data, build analysis models, test relevant indicators, and evaluate risk levels, while the statistical law method is more often used to explain the probability of debt default when issuing green bonds based on relevant knowledge of statistics. The above methods were originally used at the enterprise level and have been applied to the study of government debt. The application of evaluation indicators has gradually developed from qualitative to quantitative, and the measurement of tolerance has also developed from only vague measurement indicators to more accurate measurement. Combing through the existing studies, it can be found that local government debt is a real and common problem for all countries, which has attracted the attention of many experts and scholars at home and abroad. Although government borrowing is a necessary means to carry out financial investment and develop the local economy, there are also many risks in finance and the economy that may intensify the contradiction between fiscal revenue and expenditure to a certain extent and undermine the existing financial stability. After sorting out the relevant literature, this paper also provides references and ideas for the empirical analysis methods and index selection of the debt risks faced by local governments in Shandong Province when issuing green bonds.
3 Materials and Methods
In this paper, the three principal component factors extracted from the KMV model and the principal component analysis are brought into the binary logistics model for regression. By constructing the binary logistics model for regression analysis, the results of the objective early warning model and the subjective evaluation model are combined. The comprehensive early warning model was obtained to further predict the debt risk of green bonds issued by municipal governments in Shandong province from 2020 to 2022.
3.1 Construct the Model
Logistic regression analysis is a simple and practical example of a generalized multiple regression model, which is widely used in statistical early warning. Model early warning is widely used in western developed countries and was used in the field of company management in its early stages. With the development of computer science, it is gradually being used in economic forecasting and financial risk prediction. The model is divided into univariate early warning models and multivariate early warning models. The most important part of model early warning is to establish a mathematical model to predict the research object. The logistic model used in financial early-warning research usually takes the number of financial indicators as independent variables, the credit status of the research object as the dependent variable, and establishes the regression equation of the two financial forecasting models, so as to apply to the enterprise’s future credit prediction. Compared with the early linear regression model, the logistic model has the following advantages and characteristics: the model assumes that the cumulative probability distribution of events follows the Logit distribution, so the default rate can be limited between (0 and 1) through the transformation form, and the model has no strict restrictions on the distribution and continuity of explanatory variables. The explanatory variable may be a continuous variable or a categorical variable and may follow a normal distribution or any other distribution. Dependent variables can be set as binary or multi-classification variables according to the purpose of the study, which is conducive to the fine classification of enterprise credit. In view of the advantages of the logistic model, the model has a wide range of applications in solving practical problems.
In this paper, the binary logistics model is used, and the regression principle of the model is as follows:
Among them, if
3.2 Sample Selection and Data Sources
This paper takes the 16 prefecture-level cities in Shandong Province as a whole, selects the fiscal revenue data of those 16 prefecture-level cities in Shandong Province, and processes and analyzes the data so as to estimate the risk of debt default faced by the Shandong provincial government in issuing green bonds in the future. Firstly, according to the KMV model, the expected local government debt default rates of 16 cities in Shandong Province from 2020 to 2022 are obtained, and the evaluation and prediction are made from the perspective of objective evaluation methods. In this paper, the default rate of output is assigned by the binary classification method as the explained variable input model and the explained variable input mixed model as the comprehensive warning model. According to the principal component analysis method, three principal component factors are extracted from the selected eight original index variables. From the perspective of subjective evaluation methods, these principal components can better describe the level of local government debt risk and facilitate evaluation and prediction. The three principal components are input into the mixed model as the explanatory variables of the comprehensive early warning model. By constructing a binary logistic model for regression analysis and combining the results of the objective debt ratio prediction model and the subjective risk measurement model, a comprehensive early warning model can be obtained to predict the risk status of debts faced by local governments in Shandong Province when issuing green bonds. The data source comes from the government debt report of the Shandong Provincial Finance Department.
4 Empirical Analysis
4.1 Descriptive Statistics on the Current Situation of Local Government Debt in Shandong Province
As shown in Table 1, Qingdao has the highest average debt scale and Rizhao has the lowest. The most stable debt scale is in Binzhou city, while the largest fluctuation is in Qingdao city. The largest debt volume is in Qingdao, while the smallest debt volume is in Zaozhuang city. The main data source for the empirical analysis part of this paper is mainly the debt data of local governments in Shandong Province. By the end of 2019, the debt scale of the Shandong provincial government will have exceeded 1.3 trillion yuan, which has increased by 8 percentage points compared with 2018, and the amount has increased by more than 160 billion yuan. Among the liabilities of the Shandong provincial government, the scale of the general debt is more than 600 billion yuan. The amount of special debt has also reached more than 600 billion yuan, and the ratio of general debt to special debt is about 1:1. The debt scale of the Shandong provincial government is second only to Jiangsu Province among all provinces in China. Shandong Province’s debt rate is more than 75 percent, ranking fourteenth in China. China’s debt warning line is 100 percent, and the debt scale of Shandong Province is below the warning line. However, attention should be paid to avoid the continued expansion of the debt scale and a further deterioration of the debt situation. Among the country-level cities in Shandong Province, the first-level government debt accounts for more than 90 percent of the total debt in the province, and the debt proportions at the provincial, municipal, and county levels are 8.54%, 39.81%, and 51.65%, respectively. Compared with the debt situation of Shandong Province in 2018, the debt situation in 2019 has not changed significantly, but from the perspective of the maturity structure of government debt, the distribution is more reasonable. From 2020 to 2023, the proportion of debt due to be repaid in Shandong Province was 7.9%, 17.0%, 12.5%, and 18.1%, respectively. Since then, the amount of government debt to be repaid in Shandong Province is still more than 40%. In 2019, the balance of local government debt in the province accounted for more than 2% of the general budget revenue. In other cities, including Dezhou, Weihai, and other eight cities, the government debt is more than 2%, among which the debt of Dezhou is more than 3%. Compared with the scale of its debt, the local fiscal revenue and expenditure in Shandong Province are seriously unbalanced. Shandong Province is facing a serious fiscal deficit. The proportions of Binzhou and Liaocheng are relatively low, with a proportion of 1. The general public budget revenue of these two cities can offset the amount of government debt. By comparing the other six cities, including Qingdao and Jinan, it is found that Jinan and Qingdao enjoy a high level of economic development, the debt repayment situation of local governments in these two cities is good, and the debt structure is reasonable. Among the debts of the Shandong provincial government, local government debt is the most important part. In this study, there is no data collection on the public replacement of government debt in Shandong Province, so in the results of this study, there will be a situation where the risk assessment and prediction values are higher than the actual values. The relationship between debt levels and economic growth can be analyzed by observing the debt level of various cities in Shandong province and combining them with the debt levels of local governments and different local economic development conditions. Figure 1 is obtained by sorting out the debt balance data of 16 cities in Shandong Province from 2015 to 2019.
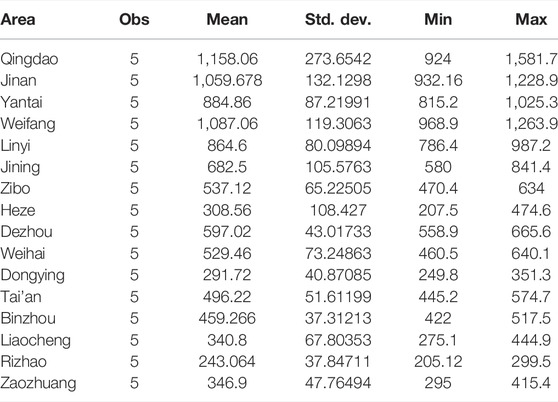
TABLE 1. Descriptive statistics of regional debts in Shandong Province
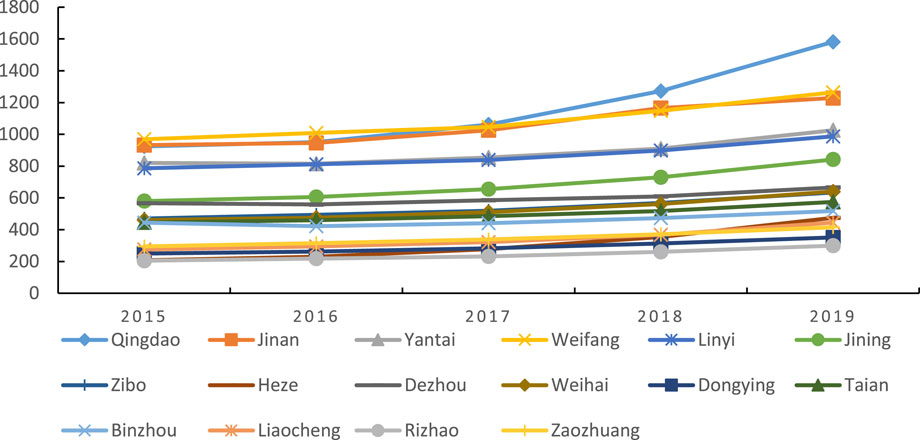
FIGURE 1. Broken line chart of the debt balances of cities in Shandong Province from 2015 to 2019 (unit: 100 million yuan).
As shown in Figure 1, the changes in debt levels of various cities in Shandong province from 2015 to 2019 were analyzed. Horizontally, the debt level of prefecture-level cities has increased continuously as a whole. Longitudinally, the debt of Heze City in 2015 was only 20.7 billion yuan, and by 2019, the debt of Heze had the fastest growth in the province, more than twice that of 2015. In 2019, the cities with debts exceeding 100 billion yuan in the whole province are Qingdao, Jinan, Yantai, and Weifang. Most of the other cities have debts of more than 30 billion yuan. At the end of 2019, compared with 2015, the debt levels of all prefecture-level cities had increased significantly.
From the perspective of economic development and debt situations in Shandong Province, some cities in Shandong Province are developing rapidly, with high GDP and total economic output, and also have relatively good debt structures and solvency, while other cities have poor economic development, low GDP, unreasonable debt structures, and poor solvency. Therefore, the risk of debt default on issuing green bonds in the future is also higher.
4.2 Calculation of Local Government Debt Default Rate and Extraction of Principal Component Factors
4.2.1 Measurement of the Default Rate of Local Government Debt
In this paper, the KMV model is used to predict the growth rate and volatility of fiscal revenue available for debt repayment from 2020 to 2022 in 16 cities in Shandong Province, as well as the sum of principal and interest on debt to be repaid every year and the predicted value of
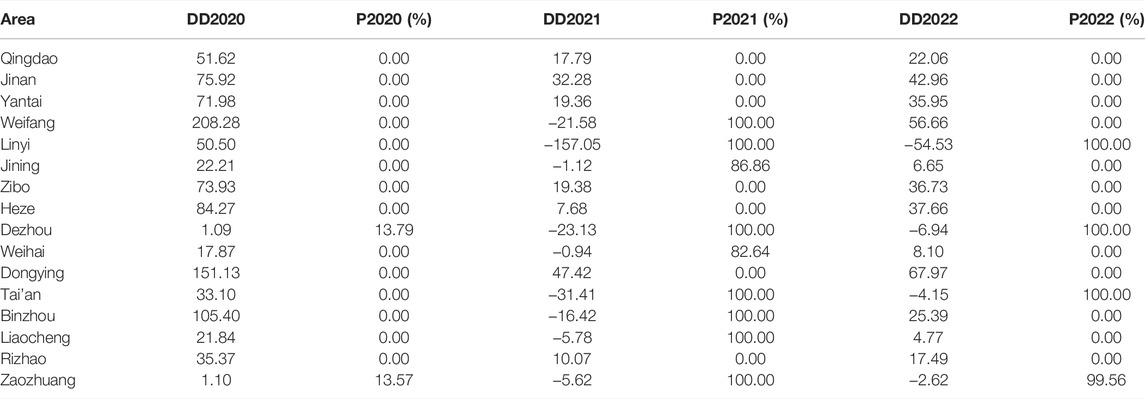
TABLE 2. Forecast of default distance and expected default rate of debt of 16 cities in Shandong Province from 2020 to 2022
4.2.2 Extraction of Principal Component Factors
By observing the fiscal and debt data of 16 cities in Shandong Province from 2015 to 2019, it is found that the original data of the indicators used as follow-up research have obvious trends, and the grey Verhulst model is used to estimate the data from 2020 to 2022. The commonly used indicators to measure debt risk selected in this paper are as follows: X1 (GDP Growth Rate), X2 (Deficit Dependence), X3 (Deficit Rate), X4 (Debt Dependence), X5 (Change Rate of Fiscal Revenue and Expenditure), X6 (Growth Rate of Fiscal Revenue) X7 (Proportion of Tax Revenue to Fiscal Revenue), and X8 (Debt Growth Rate). After further calculation, the eigenvalue matrix of the principal component coefficient is shown in Table 3.
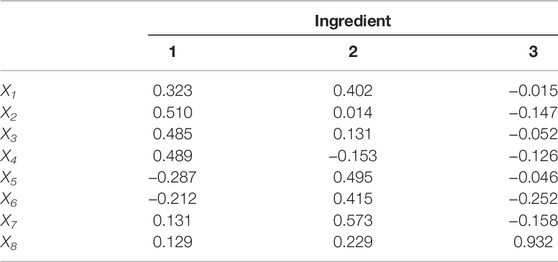
TABLE 3. Eigenvalue matrix of component coefficient.
As can be seen from the data in Table 3, the meanings expressed by the three principal component factors screened and determined are given by observing their original variable coefficients:
In the first principal component
In the second principal component
In the second principal component
4.3 Regression Analysis of the KMV-Logistics Model
By using the binary logistics model, the three principal component factors are extracted and the debt default rates predicted by the KMV model for the issuance of green bonds by local governments in 16 prefectures and cities in Shandong Province in 2020 are used to establish a regression model, Eq. 4. The regression results of the mixed model are shown in Table 4.
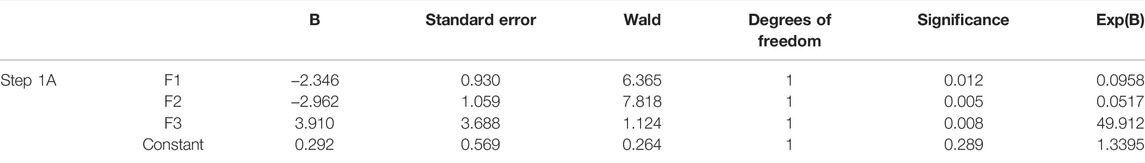
TABLE 4. KMV-logistics regression results
The test results retain
In order to test the fitting status of the regression results, the Hosmer-Lameshaw test is required, and the test results are shown in Table 5.
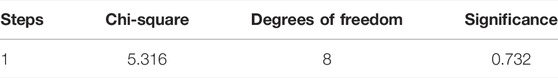
TABLE 5. Hosmer-Lameshaw test
According to the Hosmer-Lemeshaw1 test in Table 5, it shows a p-value of 0.732 at the 95% confidence level, much greater than 0.05, indicating a very good goodness-of-fit for the model.
The default rate predicted for 2020–2022 is brought into the binary logistics for regression, and the default rate output by the KMV model is taken as the binary explained variable. A default rate equal to 0.4% is set as the critical value, a default rate greater than 0.4% is assigned a value of 1, and a default rate less than 0.4% is assigned a value of 0. In the calculation of the mixed logistics prediction function, referring to the research on local government debt risk early warning by Li (2015), the critical value of probability is selected as 0.5 as a cut-off point. Here, the low risk (safe and controllable) of local government debt is judged as high risk, which is called the first discriminant error. The judgment of high local government debt risk as low debt risk (safe and controllable) is called the second discriminant error. Since the accuracy of model discrimination is closely related to p-value, that is, a large p-value tends to increase the possibility of type I errors, while a small p-value may increase the possibility of type II errors. Therefore, p = 0.5 is selected as the cut-off point to minimize the probability of the two types of errors. p < 0.5 means that the debt risk is low (safe and controllable), and p > 0.5 means that the debt risk is high. The classification results of the constructed KMV-Logistic mixed model for the overall sample cities are shown in Table 6:
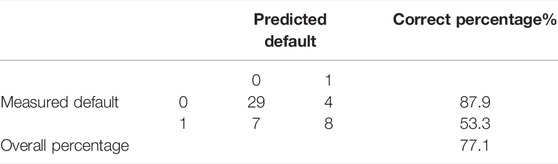
TABLE 6. Classification of regression results from 2020 to 2022
As can be seen from Table 6, the overall accuracy rate of the logistics model back judgment by introducing the KMV model to the output default rate is 77.1%. In this paper, a total of 48 samples from 16 groups of cities in Shandong province were substituted into the model (5.1) for testing. According to the test results, the regression results of the KMV-Logistics mixed model from 2020 to 2022 show that there are 36 samples of local government debt risk with low debt risk for municipal governments issuing green bonds in Shandong Province, among which the prediction results of 29 samples are consistent with the output results of the KMV mode, and 7 samples show the second type of discriminant error. According to the KMV model, there are 33 samples of local government debt risk, which means the local governments of Shandong province face less debt risk when issuing green bonds, so the discriminant accuracy is 87.9%. There are a total of 12 local government debt risk samples with high debt risk faced by municipal governments issuing green bonds in Shandong Province, among which the prediction results of 8 samples are consistent with the output results of the KMV model, and 4 samples show the first type of discriminant error. According to the KMV model, there are altogether 15 samples of local government debt risk, which means the local governments of Shandong province are faced with less debt risk when issuing green bonds, so the discriminant accuracy is 53.3%. The overall judgment accuracy of the mixed binary logistic early-warning model reached 77.1%,2 , it can be seen that it is reasonable to divide risk states with 0.5 as the “critical value” of a high-risk state and a safety state. The comprehensive early warning model has a more accurate measure of risk.
The empirical results of each year from 2020 to 2022 are analyzed, respectively. There are 16 samples each year. The results are shown in Tables 7–9 respectively.
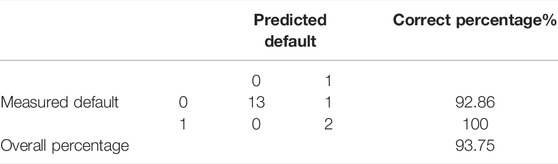
TABLE 7. Classification of regression results in 2020
As shown in Table 7, the overall accuracy rate of the KMV-Logistics mixed model is 93.75% for the debt risks faced by local governments issuing green bonds in Shandong Province in 2020. Among the predicted 3-year results, the default rate results are the most consistent with those output by the KMV model. The prediction results show that there are 13 samples in safe cities, 3 samples in high-risk cities, 1 wrong sample in the first category, and 0 in the second category. The accuracy of security state prediction was 92.86%, the prediction accuracy of high-risk states was 100%, and the overall accuracy was 93.75%.
It can be seen from Table 8 that the debt risk faced by local governments in Shandong Province in issuing green bonds in 2021 is 62.5% accurate in the KMV-Logistics mixed model. The rate results are the least consistent with the KMV model output. The prediction results show that there are 11 samples in safe cities, 5 samples in high-risk cities, 1 wrong sample in first category, and 5 in the second category. The prediction accuracy of the safe state is 85.71%, the prediction accuracy of the high-risk state is 44.44%, and the overall accuracy is 62.5%, which is prone to the first type of discrimination error.
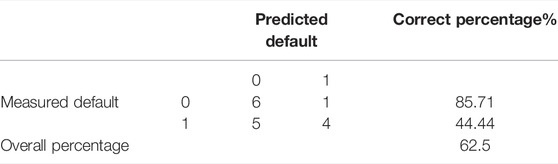
TABLE 8. Classification of regression results in 2021
It can be seen from Table 9 that the overall accuracy of the KMV-Logistics mixed model for the debt risks faced by local governments in Shandong Province in issuing green bonds in 2022 is 75%. Among the predicted 3-year results, the default rate results are highly consistent with the KMV model output. The prediction results show that there are 12 samples in safe cities, 4 samples in high-risk cities, 2 samples of the first type of discrimination error, and 2 samples of the second type of discrimination error. The safety state prediction accuracy is 83.33%, the high-risk state prediction accuracy is 50% lower, and the overall accuracy is 75%.
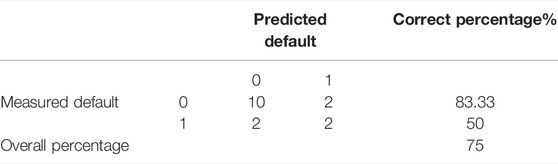
TABLE 9. Classification of regression results in 2022
The output result of the local government debt risk probability p value in the regression result is taken as the critical value. p < 0.5 means low debt risk (safe and controllable), and p > 0.5 means high debt risk, so as to divide the annual risk status of 16 cities in Shandong Province from 2020 to 2022. The debt risk warning results of local governments issuing green bonds in Shandong province from 2020 to 2022 are obtained, as shown in Table 10.
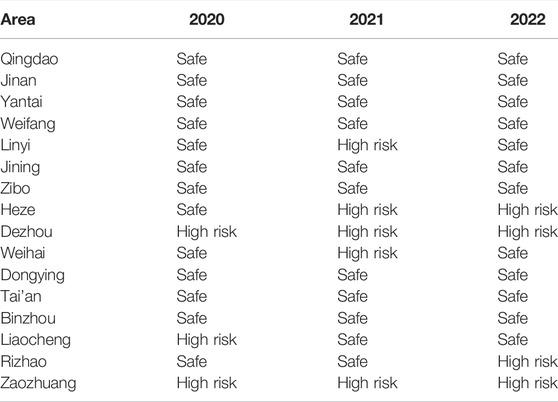
TABLE 10. Prediction of risk status of 16 cities in Shandong Province from 2020 to 2022
In 2020, Dezhou, Liaocheng, and Zaozhuang are predicted to issue green bonds in Shandong Province in a state of high debt risk. In 2021, Linyi, Heze, Dezhou, and Weihai are predicted to issue green bonds in Shandong Province in a state of high debt risk. In 2022, Dezhou, Heze, Rizhao, and Zaozhuang are predicted to issue green bonds in Shandong Province in a state of high debt risk, among which Zaozhuang and Dezhou have been in a high-risk state for three consecutive years. On the whole, cities at high risk are mostly concentrated in the central and western regions of Shandong Province.
As shown in Figure 2, the trend of default probability of cities in Shandong province was predicted from 2020 to 2022. Based on the regression results in Table 10, the default probability p = 0.5 is used as the critical value to observe the trend of debt risk status faced by green bonds issued by them. As shown in Figure 2, Dezhou, Liaocheng, and Zaozhuang are predicted to face high debt risk status when issuing green bonds in Shandong Province in 2020. In 2021, Linyi, Heze, Dezhou, and Weihai will face high debt risk when issuing green bonds in Shandong Province. In 2022, it is predicted that Dezhou, Heze, Rizhao, and Zaozhuang will face high debt risk when issuing green bonds in Shandong Province, among which Zaozhuang and Dezhou have been in a high-risk state for three consecutive years. The debt risk of local governments issuing green bonds in Qingdao, Jinan, Yantai, Weifang, Jining, Zibo, Dongying, and Binzhou is in a safe state from 2020 to 2022. Although Taian is in a safe state, the risk of fluctuation is obvious and shows an upward trend. The government should pay close attention to prevent the risk state from changing.
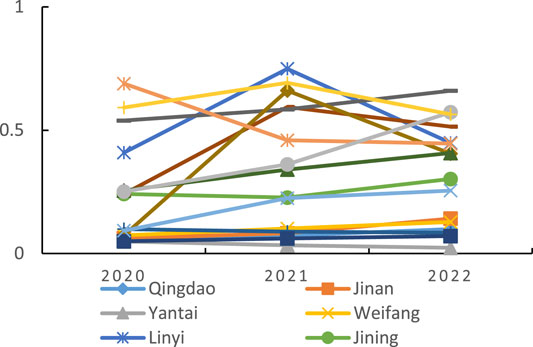
FIGURE 2. Trend of default probability of each city in Shandong Province from 2020 to 2022.
5 Conclusion and Policy Recommendations
5.1 Conclusion
Early warning of the debt risks faced by local governments in Shandong Province in issuing green bonds from 2020 to 2022 should be given. The regression results show that the debt risks faced by local governments in issuing green bonds are inversely related to the quality of government fiscal revenue and the structure of fiscal revenue and expenditure. Improving the quality of fiscal revenue and the upward development of fiscal revenue and expenditure structures can reduce the possibility of issuing green bonds to increase debt risk; the faster the debt growth rate, the higher the debt risk level of local governments issuing green bonds. Comparing the prediction results of the KMV-Logistic hybrid model with the default rate results output by the KMV model, it is found that from 2020 to 2022, the debt risk early warning model for the issuance of green bonds in various cities in Shandong Province has an accuracy rate of 87.9% for small local governments, the accuracy of issuing green bonds is 53.3% for local governments with higher debt risks, and the overall judgment accuracy of the mixed binary Logistic early warning model reaches 77.1%. The risk measurement of the model is relatively accurate, and the mismatching cases mainly focus on the second type of discrimination error, that is, the high debt risk faced by local governments issuing green bonds is judged to be low debt risk (safe and controllable). Among the predicted 3-year results, the default rate results of the KMV model output have the highest consistency in 2020, the lowest consistency in 2021, and the highest consistency in 2022.
Based on the above empirical analysis and results, it can be found that the default rate obtained according to the KMV model can distinguish between the safe state and the high-risk state of debt risk faced by local governments in Shandong Province when issuing green bonds in most cases, but in some special cases, if the scale of debt repayment expands more, or the quality of finance declines, or the structure of fiscal revenue and expenditure changes, the default rate cannot accurately reflect the default situation of the judging subject. And the default rate corresponding to the default distance calculated by the KMV model does not obey the standard normal distribution, which proves that deriving the expected default rate based on the assumption of normal distribution has defects in actual operation. Using a single KMV model to predict and evaluate the debt risks faced by local governments issuing green bonds cannot give full play to the effect of risk warning.
5.2 Policy Recommendations
5.2.1 Ascertain the Debt Base and Supervise the Way of Borrowing
According to the promulgated “Guarantee Law,” “Budget Law” and other relevant laws and regulations, it is clearly stipulated that the necessary funds in the local government budget for economic development and local construction investment need to rely on raising funds and borrowing debts. Financing is obtained by issuing local government bonds within a set government debt limit. In addition, local governments and their subordinate departments should not borrow money directly or indirectly in any other way, and resolutely put an end to all forms of government irregularities, such as illegal guarantees and promises. After figuring out how much debt to borrow, the government should start destocking. In the face of implicit debt, it is suggested that one bravely convert implicit debt into explicit debt by issuing bonds. Although it will increase the debt rate in the short term, it can promote the long-term development of the local economy. In addition, when resolving explicit debts, the government can actively check and activate government resources, clean up the financial stock funds, and seek help from the central government when necessary. Governments at all levels should strengthen internal management and conduct regular self-examination and self-correction. Problems found should be reported to the Provincial Finance Department in time and rectified in accordance with the approval and regulations. Governments should firmly adhere to the bottom line, strictly abide by laws and regulations, and resolutely put an end to all forms of violations of laws and regulations.
5.2.2 Dynamic Monitoring and Prevention of Local Government Debt Risk
The risk characteristics of green bonds include low project rates of return, strong public welfare, and weak, stable cash flow. Insufficient information disclosure, there is a risk of “greenwashing.” Environmental risks have a greater impact. Focus on the project income stability, the ability to refinance, stability, availability of support policies and subsidies, transfer asset cash ability, raise funds use and management, information disclosure, the project schedule, green goal situation, the issuer’s environmental risk control ability, the change of environmental policies and relevant environmental risk, etc. Shandong Province should take the lead in organizing and developing a multi-level local government debt monitoring and early warning mechanism; establishing and improving the debt risk index system at the provincial, municipal, and county levels; carrying out scientific and normative calculations; dynamically monitoring the sources, scale, structure, type, duration, use, and overdue debts of local governments at all levels; strengthening the daily monitoring, prevention, and response to debt risks so that we can fully understand the situation of debt risks at all levels, predict future risk trends, and ensure the sustainability of local government debt. In the aspect of government debt risk prevention, governments at all levels should incorporate local government debt rates and other indicators into the assessment scope of comprehensive indicators for the development of each city, and investigate the risk points of local government debt. Also, the government should formulate a work plan for preventing debt risks and emergency response plans for local government debt as soon as possible according to the characteristics of local development, improve the mechanism of measures to resolve debt risks, strengthen the performance appraisal of debt work during the term of office, and establish an accountability mechanism for outgoing audit according to the principle that the principal responsible persons of governments at all levels are the first responsible subjects for the management of government debt at the same level.
5.2.3 Optimize the Management System of Local Government Debt Funds
Local government debt management is of great significance and is related to the prevention of systemic and regional risks. In order to improve the efficiency of local government debt management, we should adopt a classified and comprehensive management method for local government debt in Shandong Province. According to the characteristics of the interest rate of local government debt, such as different maturity structures and repayment modes, the debt can be divided into different risk categories and sizes so as to carry out targeted management. In order to improve the efficiency of the use of local government debt, local governments at all levels should ensure that all government debt funds are used to increase public welfare expenditure on improving people’s livelihoods, while considering their own debt risk and solvency, and conscientiously implementing the regulations on the use and management of funds. At the same time, the support of local economic restructuring should be the focus of work, focusing on stable fiscal revenue such as their own tax revenue and avoiding blind borrowing.
Data Availability Statement
Publicly available datasets were analyzed in this study. This data can be found here: http://czt.shandong.gov.cn/col/col123898/index.html.
Author Contributions
Conceptualization, CW; data curation, WG; formal analysis, YZ; funding acquisition, WG and CW; investigation, FY; methodology, YZ and FY; project administration, CW; resources, CW; software, FY; validation, WG; visualization, YZ; writing–original draft, CW and FY; writing–review and editing, WG and CW. All authors have read and agreed to the published version of the manuscript.
Funding
The research was supported by the Humanities and Social Sciences Youth Foundation of the Ministry of Education of China under grant number 19YJC790128.
Conflict of Interest
The authors declare that the research was conducted in the absence of any commercial or financial relationships that could be construed as a potential conflict of interest.
Publisher’s Note
All claims expressed in this article are solely those of the authors and do not necessarily represent those of their affiliated organizations, or those of the publisher, the editors, and the reviewers. Any product that may be evaluated in this article, or claim that may be made by its manufacturer, is not guaranteed or endorsed by the publisher.
Acknowledgments
This paper benefited from years of thinking about these issues and the discussion with many colleagues related to energy economics at that time.
Footnotes
1Hosmer-lemshaw test is used for logistics model fitting tests, and its original assumption is that the model can fit the observed data well, otherwise it does not fit well.
2Classification and discrimination accuracy = number of correct samples predicted in classification/number of actual measured samples in sample input * 100%. Overall discrimination accuracy = number of correct samples predicted in classification /number of actual measured samples in sample input * 100%.
References
Bohn, H. (2007). Are Stationarity and Cointegration Restrictions Really Necessary for the Intertemporal Budget Constraint? J. Monetary Econ. 54 (07), 1837–1847. doi:10.1016/j.jmoneco.2006.12.012
Buiter, W. H. (1985). A Guide to Public Sector Debt and Deficits. Econ. Pol. 1 (01), 13–79. doi:10.2307/1344612
Diao, W. (2016). Risk Assessment of Local Government Debt in China during the 13th Five-Year Plan Period: Total Debt and Maturity Structure. J. Cent. Univ. Finance Econ. 36 (03), 12–21. CNKI:SUN:ZYCY.0.2016-03-003.
Fang, L., and Chai, J. (2017). The Optimal Scale and Risk Control of Local Government's Independent Bond Issuance: An Empirical Analysis Based on Four Provinces. J. Cent. Univ. Finance Econ. 37 (10), 12–20. CNKI:SUN:ZYCY.0.2017-10-003.
Fenn, G. W., and Liang, N. (1997). Good News and Bad News About Share Repurchases. Washington, DC: Board of Governors of the Federal Reserve. Working Paper. doi:10.2139/ssrn.113268
Fu, R., Miao, X., Wang, M., and Yang, Y. (2013). The Construction of China's Public Finance Security Monitoring and Early Warning Mechanism — A Theoretical Research Framework. Finance Trade Economy 34 (08), 18–26+17. doi:10.19795/j.cnki.cn11-1166/f.2013.08.002
Han, L., Zheng, C., Luo, W., and Yang, Z. (2003). Research on Credit Risk and Bond Issuance Scale of China's Municipal Bonds. Financial Res. 46 (02), 85–94. doi:10.3969/j.issn.1673-0992.2017.z2.526
Hana, P. (1998). Contingent Government Liabilities: A Hidden Risk for Fiscal Stability. Policy Res. Work. Pap., 163–187. doi:10.1596/1813-9450-1989
He, Z., and Jia, G. (2020). Rethinking China’s Local Government Debts in the Frame of Modern Money Theory. J. Post Keynesian Econ. 43 (02), 210–230. doi:10.1080/01603477.2020.1734468
Hildreth, W. B., and Miller, G. J. (2002). Debt and the Local Economy Problems in Debt Afford Ability. Public Budgetin 22 (04), 99–113. doi:10.1111/1540-5850.00091
Hong, Y., and Hu, Z. (2018). Solvency and Default Risk of Local Government Debt: An Empirical Study Based on Modified KMV Model. Finance Trade Economy 39 (05), 21–37. doi:10.19795/j.cnki.cn11-1166/f.2018.05.002
Ismailescu, I., and Phillips, B. (2015). Credit Default Swaps and the Market for Sovereign Debt. J. Bank. Financ. 52, 43–61. doi:10.1016/j.jbankfin.2014.10.015
Jiang, Z. (2011). Research on Credit Risk Measurement and Bond Issuance Scale in the Process of Local Government Bond Issuance — Analysis of Jiangsu Local Government Bonds Based on KMV Model. Econ. Res. Guide 7 (19), 61–62. doi:10.3969/j.issn.1673-291X.2011.19.026
Jin, W., Zhang, H., Sun, Y., and Di, M. (2020). Study on Evaluation and Early Warning Mechanism of Local Government Debt Risk — Based on the Sample Analysis of Liaoning Province. Stat. Decis. 36 (19), 155–158. doi:10.13546/j.cnki.tjyjc.2020.19.034
Khan, A. B., Fareed, M., Salameh, A. A., and Hussain, H. (2021). Financial Innovation, Sustainable Economic Growth, and Credit Risk: A Case of the ASEAN Banking Sector. Front. Environ. Sci. 9 (01), 1–10. doi:10.3389/fenvs.2021.729922
Leigland, J. (2010). Accelerating Municipal Bond Market Development in Emerging Economies: An Assessment of Strategies and Progress. Public Budg. Finance 17 (02), 57–79. doi:10.1111/1540-5850.01100
Li, B., Guo, J., and He, W. (2016). Design and Application of a New Early Warning System for Local Government Debt Risk. Quantitative Econ. Tech. Econ. Res. 33 (12), 96–112. doi:10.13653/j.cnki.jqte.2016.12.006
Li, L., Geng, X., and Zheng, J. (2013). Evaluation of Local Government Debt Risk in China. Stat. Res. 30 (10), 30–39. doi:10.19343/j.cnki.11-1302/c.2013.10.005
Li, S., and Ma, D. (2015). Research on Early Warning of Local Government Debt Risk in China—Based on Logistic Model. Financ. Econ. 12, 82–90.
Mao, R., Liu, N., and Liu, R. (2018). Trigger Mechanism of Local Government Debt Expansion and Systemic Financial Risk. China Ind. Economy 35 (04), 19–38. doi:10.19581/j.cnki.ciejournal.2018.04.002
Pang, X., and Li, D. (2015). China's Economic Boom and Government Debt Risk. Econ. Res. 50 (10), 18–33. CNKI:SUN:JJYJ.0.2015-10-003.
Pei, Y., and Ouyang, H. (2006). Construction of Local Debt Risk Early Warning Procedure and index System. Contemp. Finance Econ. 27 (03), 36–39. doi:10.3969/j.issn.1005-0892.2006.03.007
Sun, H., Edziah, B. K., Sun, C., and Kporsu, A. K. (2021). Institutional Quality and its Spatial Spillover Effects on Energy Efficiency. Socio-Econ. Plan. Sci., 101023. doi:10.1016/j.seps.2021.101023
Sun, Y., Chen, L., Sun, H., and Farhad, T. (2020). Low-Carbon Financial Risk Factor Correlation in the Belt and Road PPP Project. Finance Res. Lett. 35, 101491. doi:10.1016/j.frl.2020.101491
Wu, T., and Zhang, L. (2018). Research on Credit Default Risk Assessment of Chinese Local Government Bonds. J. Beijing Technol. Business Univ. (Social Sci. Edition) 33 (05), 81–91. doi:10.12085/j.issn.1009-6116.2018.05.009
Xie, Z., and Chen, G. (2012). Construction of China's Local Debt Risk Index Early Warning Model. Mod. Finance Econ. 32 (07), 96–104. doi:10.19559/j.cnki.12-1387.2012.07.012
Xu, L., and Liu, X. (2018). Default Risk Measurement of Local Government Debt. Shanghai Econ. Res. 35 (01), 84–93. doi:10.19626/j.cnki.cn31-1163/f.2018.01.009
Keywords: green bond debt risk warning, KMV model, principal component analysis, logistics model, risk handling
Citation: Wang C, Zhu Y, Gong W and Yu F (2022) Debt Risk of Green Bonds Issued by Local Governments in Shandong Province Based on KMV-Logistics Mixed Early Warning Model. Front. Environ. Sci. 10:892544. doi: 10.3389/fenvs.2022.892544
Received: 09 March 2022; Accepted: 12 April 2022;
Published: 12 May 2022.
Edited by:
Huaping Sun, Jiangsu University, ChinaReviewed by:
Zhengning Pu, Southeast University, ChinaTao Sun, Nanjing University of Aeronautics and Astronautics, China
Qingsheng Li, Linyi University, China
Copyright © 2022 Wang, Zhu, Gong and Yu. This is an open-access article distributed under the terms of the Creative Commons Attribution License (CC BY). The use, distribution or reproduction in other forums is permitted, provided the original author(s) and the copyright owner(s) are credited and that the original publication in this journal is cited, in accordance with accepted academic practice. No use, distribution or reproduction is permitted which does not comply with these terms.
*Correspondence: Weifeng Gong, gongweifeng0539@163.com