 Wenjuan Hou
 Xiaojie Li2
94% of researchers rate our articles as excellent or good
Learn more about the work of our research integrity team to safeguard the quality of each article we publish.
Find out more
ORIGINAL RESEARCH article
Front. Environ. Sci. , 12 May 2022
Sec. Environmental Economics and Management
Volume 10 - 2022 | https://doi.org/10.3389/fenvs.2022.892414
This article is part of the Research Topic Toward Carbon Neutrality: Spatial Planning and Sustainable Utilization of Natural Resource View all 12 articles
Abstract: Northwest China has become a base for wind and solar energy development due to its rich wind and solar resources and large area of desert and unutilized land. However, whether the scarce water resources in the arid regions there can meet the requirements for renewable energy development is currently a pressing, critical problem. Therefore, the life cycle water footprint (WF) of the renewable energy industry—its wind energy, photovoltaic (PV), and concentrated solar power (CSP) electricity generation enterprises—in the basin area of Golmud, Qinghai, a typical arid region in Northwest China, has been investigated in this study. Water consumption by local renewable energy enterprises was estimated under current (2020) scenarios [i.e., different (local/vs. nonlocal) origins of equipment and raw materials used, and employees hired by these enterprises] and three future scenarios (i.e., different ratios between installed capacities of wind energy, PV, and CSP at a fixed total renewable energy electricity generation capacity assuming China’s carbon emission will peak then). The results revealed that water consumption by local renewable energy enterprises in 2020 was 1.62 × 10⁶–1.31 × 10⁷ m3, accounting for 0.07–0.6% of the current total water resources in the basin area of Golmud. Water consumption by the local salt chemistry industry, a pillar industry in Golmud whose water consumption is high, accounted for 2.69% of the total water resources being 4.24–34.37 times that of the local renewable energy industry. To reach the goal of carbon emissions peaking by 2030 requires an increase of 6.17 × 10⁶ kW in the installed capacity for wind and solar power generation in Golmud, would translate into an increase of 1.57 × 10⁷–6.46 × 10⁷ m3 in water consumption, this accounting for 7.15–19.35% of the remaining available water resources in the basin area of Golmud. Our results indicate that the expansion of the local renewable energy industry has exerted significant pressure on the already scarce water resources in Golmud. Therefore, future increases in the installed capacity for renewable energy electricity generation should be planned scientifically, by considering the availability of water resources as a constraint.
The renewable energy industry has been developing rapidly against the backdrop of global warming (Celik and Ozgür, 2020). Since the Chinese President Xi Jinping declared China’s goal to reach a peak in carbon emissions by 2030 and become carbon neutral by 2060 at the 75th session of the United Nations General Assembly in September 2020, China’s electricity generation from wind, solar, hydraulic, and other renewable energy sources has been progressing rapidly. Northwest China boasts of a high solar radiation intensity and abundant wind resources (Zuo, 1981; Xue et al., 2001; Chen et al., 2011) and has a huge area of desert and unutilized land. Due to this sound base (comparative advantage) for wind and solar power generation (Cui et al., 2020), this region has been ranked at the top in China in terms of installed wind and solar power capacity (Wu et al., 2018). As evinced by the Report on China’s Electric Power Development 2020, by the end of 2020, Inner Mongolia, Xinjiang, Ningxia in the Northwest China had a grid-connected installed wind power capacity greater than 10 MW; Qinghai, Xinjiang, Inner Mongolia, and Ningxia had an installed capacity of photovoltaic (PV) exceeding 10 MW; all of China’s eight concentrated solar power (CSP) generation projects with a grid-connected installed capacity of above 5 MW were located in the northwest region (Qinghai, Gansu, and Inner Mongolia). Evidently, this vital region has taken a substantial lead in electricity generation output of wind energy, PV, and CSP.
China’s enormous efforts to boost renewable energy electricity generation have been accompanied by water resource problems. Studies have shown that the ongoing global energy structure transition will significantly reduce the carbon footprint in the future, but will very likely increase the water footprint (WF) (Mekonnen et al., 2016). Electric power and thermal energy production are expected to further increase in the future, placing more pressure on the scarce freshwater resources in arid and semiarid regions. China is one of the world’s major water-scarce countries, characterized by a per capita share of water resources that is 1/4 the global average (2200 m3/person). The arid and semiarid regions in Northwest China, especially the Qaidam Basin in northwestern Qinghai, incur severe water scarcity, and the water resource crisis there is expected to be further aggravated by renewable energy development. To maintain a high conversion efficiency of the PV and CSP, PV cells and heliostats must be cleaned regularly (Meldrum et al., 2013; Bukhary et al., 2018). In arid desert areas, they must be cleaned more frequently due to the low vegetation coverage (Mani and Pillai, 2010). The vapor circulation systems and condensers for CSP generation also use large amounts of water (Fthenakis and Kim, 2010; Ali, 2017). By contrast, operational water consumption for wind power generation is almost zero. Only the water consumption during the operation of renewable energy enterprises has been described above. From the whole life-cycle perspective, the supply-chain WF is also a major source of water consumption, including the manufacturing of wind energy, PV, and CSP generation equipment and raw materials, as well as construction materials for facilities. For example, the large amount of electricity consumed for purifying silicon and other semiconductor materials is produced by fossil-fired power plants, whose water-cooling systems also consume water. Studies have shown that the whole-life-cycle water consumption for wind power generation in China was 0.64 L/kWh (Li et al., 2012), that for PV was 1.72 L/kWh, and that for CSP was respectively 2.74 and 7.36 times that for PV and wind power (Burkhardt et al., 2011). Furthermore, renewable energy development requires the immigration of technical workers, who, like consumers, will produce a demand for huge water resources.
Golmud, a city located at the central-south margin of China’s Qaidam Desert, has an arid, low-precipitation climate but a long sunshine duration and high solar radiation intensity. Due to its rich wind and solar resources and large desert areas, Golmud’s wind and solar power generation industry has undergone rapid development; however, this has been accompanied by significantly increasing water resource requirements. In addition, among Golmud’s five major industries (including saline lake chemistry, oil and gas chemistry, and new coal chemistry), the saline lake chemistry alone consumes a vast amount of water (5.56 × 10⁷ m3/year). With the scale increase in renewable energy electricity generation in Northwest China, the mismatch between wind and solar resources and water resources is expected to worsen. Thus, rigorously quantifying the water resource requirements for renewable energy development in water-scarce Golmud has become a pressing, critical problem. Accordingly, here we estimated the current water resource requirements for renewable energy enterprises operations and by their employees. On this basis, we went on to predict their water consumption against the backdrop of climate change and renewable energy development. Our results provide a timely and theoretical basis for making the most of Golmud’s natural advantages for renewable energy electricity generation and supporting China’s sustainable energy structure transition.
Golmud, a city under the jurisdiction of Haixi Mongol and Tibetan Autonomous Prefecture, is located in western Qinghai. The city consists of two geographically different areas: a basin area and a mountainous area (the Tanggula Mountains) (Figure 1A). Golmud has a typical arid plateaucontinental climate, with an average air temperature of −7.8°C in winter and 17.1°C in summer in the basin area, and a maximum annual sunshine duration of 3323.9h (in the Xiaozaohuo area). Spatially, precipitation in the basin area decreases from east to west, with an annual precipitation of 13.7–45.5 mm in 2019, representing an increase of 0.9% over previous years. Golmud has a large total geographical area encompassing 11.92 million ha, but the proportion of its utilizable land is low, with 3.90 million ha of cropland, 47,000 ha of urban and built-up land, and 7.97 million ha of other land use types. Qinghai, of which Golmud is a jurisdiction unit, is currently ranked first in China for the ratio of the output of renewable energy electricity generation to the total output of local electricity generation, and also ranks first in terms of the ratio of PV power generation (>20%) (Figure 1B). This study focused on the basin area of Golmud, which is located at the central-south margin of the Qaidam Basin, with an area of 7.14 million ha.
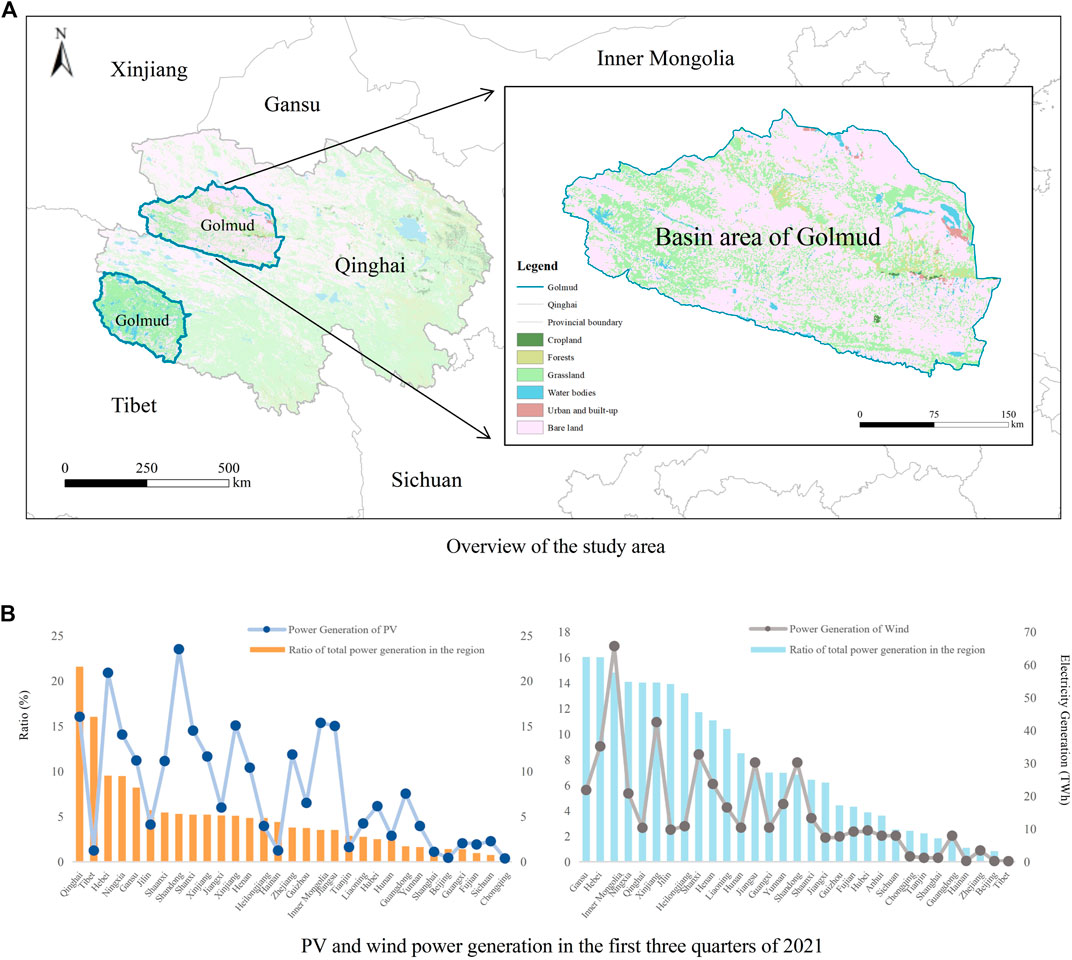
FIGURE 1. Brief profile of geographical information (A) and electricity generation (B) in the study region.
Total water resources of the Golmud region are 7.24 × 10⁹ m3, among which, the total water resources in the basin area of Golmud is 2.26 × 10⁹ m3, and the surface water is 2.06 × 10⁹ m3. The total water consumption in the basin area of Golmud was 2.04 × 10⁸ m3 in 2015. Among them, agricultural water consumption was 1.78 × 10⁸ m3, accounting for 87.26% of the total water consumption, industrial consumption is 0.19 × 10⁸ m3 (9.31%), and domestic consumption was 0.03 × 10⁸ m3 (1.47%), and ecological consumption was 0.04 × 10⁸ m3 (1.96%) (Golmud Local Chronicles Compilation Committee, 2020).
First, the water footprint (WF) of electricity generation and that of consumer were reviewed and estimated based on previous studies. Next, water consumption by the renewable energy enterprises in Golmud was assessed under four different current scenarios of the local/nonlocal origin of electricity generation equipment and raw materials used and of the employees. Then, the water consumption by these enterprises in 2030 was predicted under three different scenarios varying the scale and proportion of renewable energy installed capacities. The relations of temperature and precipitation to total water resources were quantified via multiple linear regression using meteorological and water resource data of 1997–2018. Based on the fitting results of multiple linear regression, the total water resources in basin area of Golmud in 2030 was predicted using the average of temperature and precipitation in the different models and scenarios in the Coupled Model Intercomparison Project Phase-6 (CMIP6). Finally, the water consumption by the renewable energy enterprises was analyzed vis-à-vis total available water resources, and the potential scale of renewable energy electricity generation supportable by water resources in basin area of Golmud under current and future scenarios was estimated. The aim was to provide an empirically based reference for enhanced decision making on renewable energy development and water resource conservation in Golmud (Figure 2).
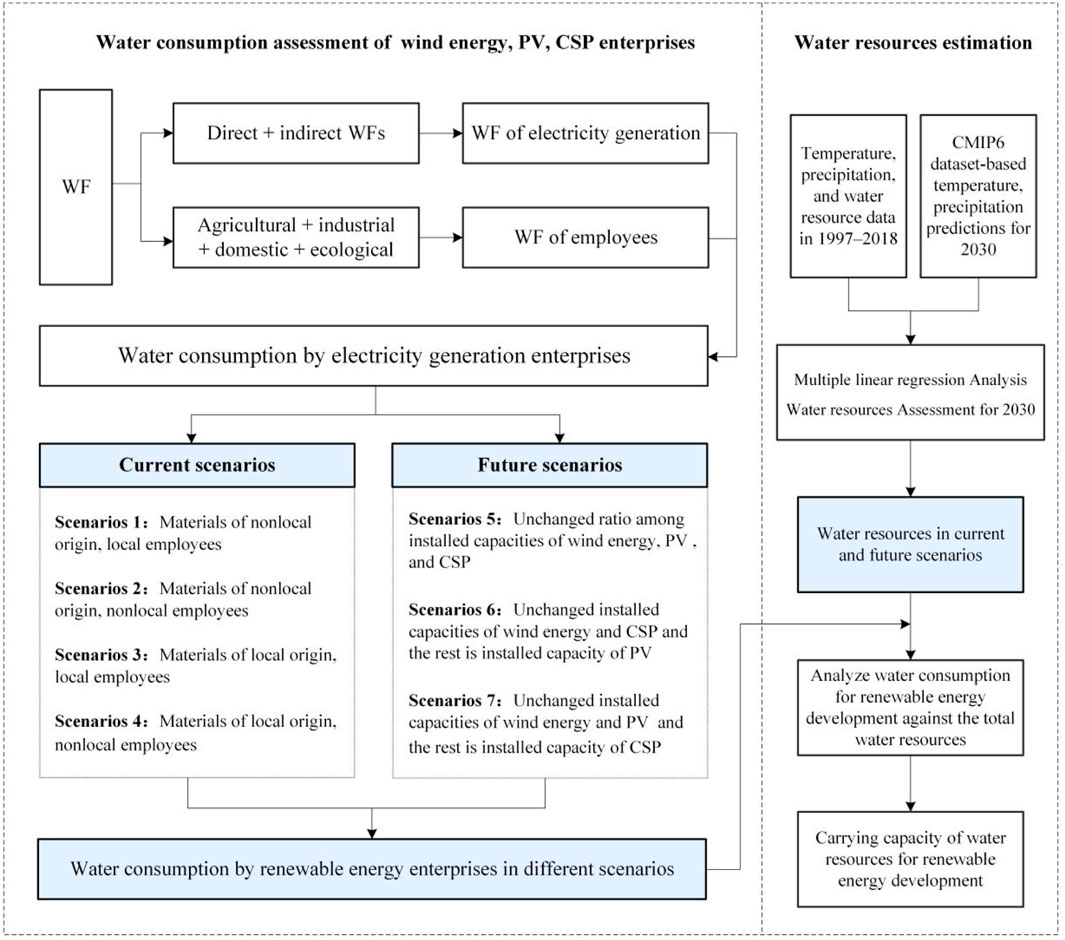
FIGURE 2. Research framework of this study.
According to the water footprint evaluation theoretical system based on water footprint network (WFN) of Hoekstra et al. (2011) and Jia et al. (2012), the WF of an enterprise includes that of its operational WF and supply-chain WF. The operational WF refers to the WF directly arising from the product production and daily use by employees, while the supply-chain WF refers to the WF of raw materials and security services required for maintaining operations. Most researchers have assessed the WF of different types of renewable energy enterprises from the life cycle perspective (Burkhardt et al., 2011; Yang et al., 2015); that is, the WF covers that of operations, raw materials, and facility construction (Meldrum et al., 2014; Mekonnen et al., 2015). Compared with the WF theoretical system of Hoekstraand Hung (2003; 2011), there is this part of the difference between domestic and industrial water consumption by enterprise employees—that is, the WF resulting from daily security services. This was calculated separately in this study as the WF of enterprise employees. Based on its comprehensive consideration, water consumption by a renewable energy enterprise was divided into two parts: water consumption for power generation and that by employees.
In this study, renewable energy enterprises were classified into three types according to the current main types of renewable energy used for power generation: PV, CSP, and wind power plants, and the WF of electricity generation was calculated by these enterprise types. The WFs of all three types of enterprises were summed as the total water requirement for electricity generation, as follows:
where AWCT is the total water consumption for electricity generation by renewable energy enterprises, AWCE,PV is the water consumption for PV generation, AWCE,W is the water consumption for wind power generation, and AWCE,CSP is the water consumption for CSP generation. WF was calculated on an annual basis. The water requirement for each type of electricity generation was calculated this way:
where WF is the water footprint of a given type of renewable energy power generation (m3/kWh), and P(p) is the output of that type of renewable energy power generation (kWh). The WF data were obtained by reviewing previous studies of different types of renewable energy enterprises (See part 3.1). P(p) was calculated by multiplying the installed capacity and operating time of electricity generation.
A water resource account is established for enterprise employees. The WF of an enterprise employee included the consumption of agricultural and manufactured products, domestic water, and ecological services:
where WFC is the WF of an individual consumer, WFagr is the agricultural WF of an individual consumer, WFind is the industrial WF of an individual consumer, WFliv is the domestic WF of an individual consumer, and WFeco is the ecological WF of an individual consumer.
The total employee WF of the renewable energy enterprises in basin area of Golmud was calculated by multiplying the number of employees in these enterprises and the per capita WF:
where AWCC is the total water consumption by the employees, WCC is the per consumer WF, and P(u) is the number of employees.
Considering that both the equipment and raw materials used and the employees hired by the renewable energy enterprises may be of local or nonlocal origin, four current scenarios were defined (Table 1). Three future scenarios of renewable energy development that considered the impact of climate change were also defined. Total water consumption for electricity generation by these enterprises in each scenario was calculated. In scenarios 1 and 2, all the equipment and raw materials used by the renewable energy enterprises were manufactured nonlocally, and all their employees were of local and nonlocal origin, respectively. In scenarios 3 and 4, all the equipment and raw materials were manufactured locally, and all the employees were of local and nonlocal origin, respectively. In scenarios 1 and 2, the renewable energy enterprises had an operational WF but lacked a supply-chain WF. In scenarios 3 and 4, the renewable energy enterprises had both operational and supply-chain WFs.
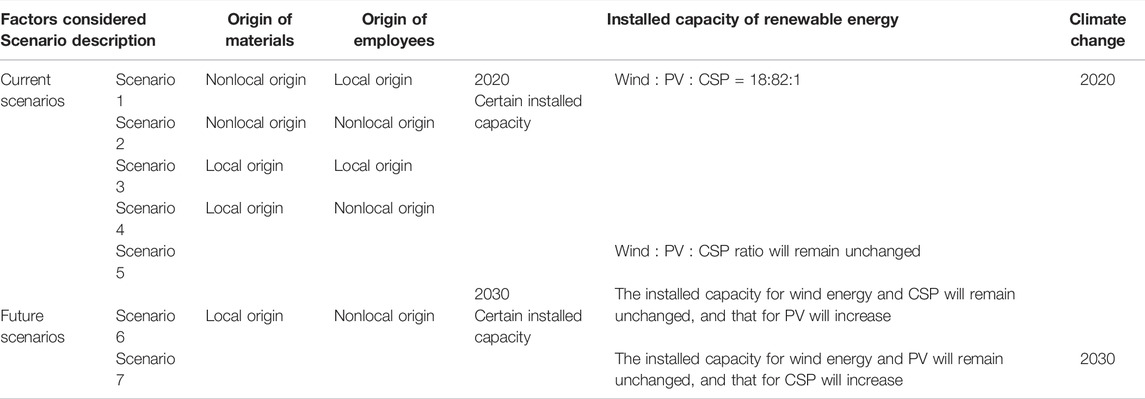
TABLE 1. Definition of scenarios.
The future scenarios of renewable energy development and climate change were based on scenario 4, which entailed the largest water consumption. Three scenarios of renewable energy development (three different ratios between the installation capacities for wind energy, PV, and CSP generation) in Golmud in 2030—when China was assumed to peak in carbon emissions (with a total installed wind and solar power generation capacity of 1.2 GW)—were considered (Table 1). The annual output of wind and solar power generation in Golmud under these future scenarios was estimated by assuming the ratio of the total installed capacity in Golmud to the national total and the electricity generator operating time in 2020 would remain unchanged in 2030. Total water resources in the future scenarios were estimated using the average temperature and precipitation in 2030 as predicted by three models (BCC-CSM2-MR, MRI-ESM2, GFDL-ESM4) in the CMIP6 (https://esgf-node.llnl.gov/projects/cmip6/) and fitted multiple linear regression model. Considering the water resources in basin area of Golmud come from precipitation and melted ice and snow, so changes in both temperature and precipitation will drive changes in the total water resources. The multiple linear regression model was obtained from temperature, precipitation, and total water resources data from 1998 to 2016.
The electricity generation WF of the three types of renewable energy enterprises (wind energy, PV, and CSP) was estimated by screening the results reported in the literature (see part 3.1), and the water footprint data applicable to this region are selected for study. The electricity generation output of Golmud’s renewable energy enterprises P(p) was estimated by multiplying their current installed capacities, as published on the official website of the Golmud government (http://www.geermu.gov.cn/details?id=bb5cf28b7cab7b40017cc4c6d02b0142), and their PV and wind power generation operating time, as published on the official website of the National Energy Administration (http://www.nea.gov.cn/2020-02/28/c_138827910.htm, http://www.gov.cn/zhengce/zhengceku/2020-05/16/content_5512148.htm) or CSP generation operating time, as estimated by Li et al. (2012), assuming operation at full capacity of solar power plants under ideal solar radiation conditions. The installed capacity data of China’s wind energy, PV, and CSP generation as of 2020 came from the Report on China’s Electric Power Development 2020 (China Electric Planning and Engineering Institute, 2021). Table 2 shows the data used for estimating the water consumption for electricity generation by the local renewable energy enterprises.
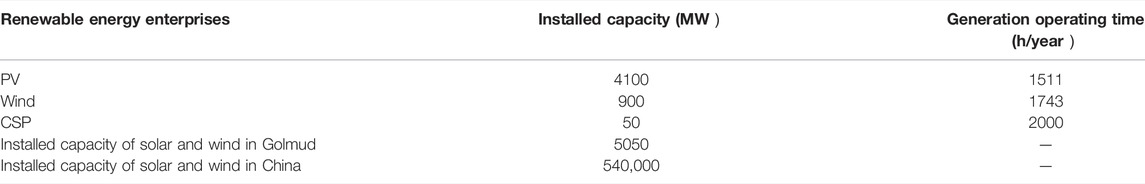
TABLE 2. Installed capacity and electricity generator operating time data of renewable energy enterprises in Golmud.
The data needed in the calculation of water consumption by the employees of local renewable energy enterprises includes: 1) The agricultural WF (per capita agricultural water consumption) was estimated by multiplying the amount of virtual water contained in a unit mass of agricultural and livestock products and their per capita consumption. The virtual water contained in a unit mass of agricultural and livestock products in Qinghai was derived from research data of the virtual water contained in a unit mass of agricultural and livestock products in Qinghai published on the official website of the Water Footprint Network (https://www.waterfootprint.org/en/); the virtual water contained in a unit mass of Chinese agricultural and livestock products estimated by Hoekstra et al. (2011); and the virtual water contained in the major agricultural and livestock products in Xinjiang, as estimated by Cheng et al. (2016). The per capita consumption data of agricultural and livestock products in Qinghai came from the Qinhai Statistical Yearbook 2020 (Qinghai Provincial Bureau of Statistics, 2020). Using the above data, the per capita agricultural WF in the study area was estimated by selecting 15 agricultural and livestock products generally consumed in China and in Golmud (Table 3). 2) The WF of industrial products is difficult to estimate using the method for agricultural products, due to the complexity of the manufacturing processes and technologies involved (Jia et al., 2012), so it is usually estimated based on their proportional relationship with agricultural products (Long et al., 2005). In this study, the virtual water contained in industrial products in Northwest China was estimated to be 7% of that contained in agricultural and livestock products, based on studies by the International Institute for Hydraulic and Environmental Engineering (2002), the researchers Old and Ksnce (2003) and Zhang and Shen (2017), with the different economic development levels of Chinese provinces considered accordingly. 3) The per capita domestic and ecological water consumption values in Qinghai were respectively estimated using data published in the China Statistical Yearbook 2020 (National Bureau of Statistics of the People’s Republic Of China, 2020). 4) The number of employees in these enterprises P(u) was estimated based on a field survey in 2021 of renewable energy enterprises in Qinghai. The number of employees in an electricity generation enterprise is related to its capacity and type of electricity generation. Generally, the ratio of the number of employees to the installed capacity was about 3 persons/10 MW for wind energy and PV installed capacity and 18 persons/10 MW for CSP installed capacity (the CSP enterprises were in the start-up stage and used complex processes, thus requiring more employees for operations and maintenance). Applying the above employee/installed capacity ratios, the number of employees in a 4100 MW PV enterprise installed capacities in 2020 was estimated to be ca. 1230; likewise, that of a 900 MW wind power enterprise was estimated to be ca. 27, and that of a 50 MW CSP enterprise was estimated to be ca. 90. Using these, the total annual water consumption by the employees of the local renewable energy enterprises was thus estimated. The number of employees in the 2030 future scenarios was also estimated using the above method.
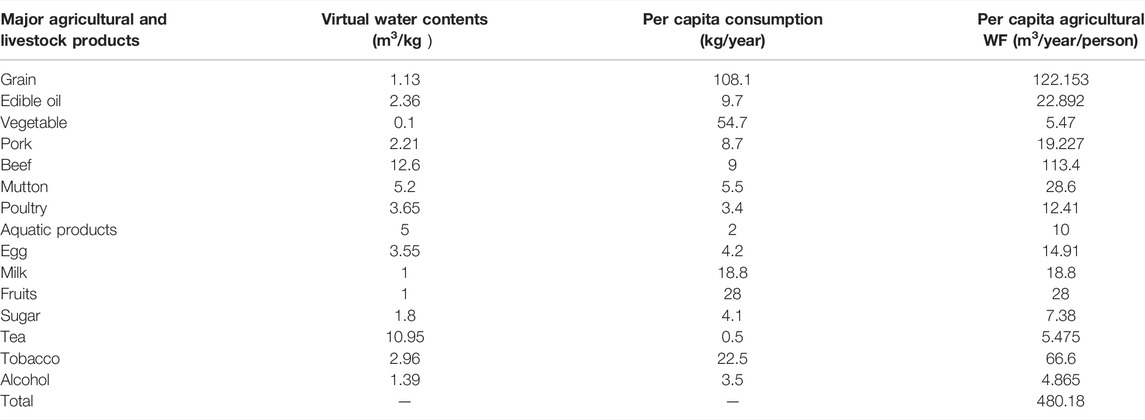
TABLE 3. Virtual water contents, per capita consumption of agricultural and livestock products and per capita agricultural WF.
The data of water resources in the study area came from the Qinghai Water Resource Communique 2020 (http://slj.haixi.gov.cn/info/1037/25916.htm). The climate data in 2030 was predicted using three models (BCC-CSM2-MR, MRI-ESM2, and GFDL-ESM4) in the CMIP6 data set (https://esgf-node.llnl.gov/projects/cmip6/). The predictions were calibrated, using the observational data from 2015 to 2020, to address differences between the simulation results yielded by the CMIP6 models for the basin area of Golmud and the observational data, thereby obtaining more accurate climate data for the future scenarios. The regression relationship of the total water resources as a function of precipitation and temperature was fitted using the observational data of the temperature, precipitation, and water resources calculated by observational data in Haixizhou, Qinghai in 1998–2016, as published in the Qinghai Water Resource Communique and on the official website of the China Meteorological Administration.
Based on previous studies, the life-cycle WF of PV generation is different due to different PV panel materials (monocrystalline silicon, polycrystalline silicon, and thin-film cadmium telluride) they used. The WF of monocrystalline silicon, the PV cell material commonly used in the study area, was 1.72 L/kWh (Fthenakis and Kim, 2010). Of the whole-life-cycle WF (1.72 L/kWh), the water consumption for the manufacturing of PV equipment and power plant construction materials accounted for the majority (89%) (Wild-Scholten and Alsema, 2005). The whole life-cycle WF of terrestrial wind power generation was 0.64 L/kWh. Similar to PV power generation, the water consumption for the manufacturing of raw materials (including the iron, steel, and glass fiber for wind turbine generator manufacturing and power plant construction materials) accounted for the majority (99.4%) (Yang et al., 2015). Unlike wind power and PV, CSP has a high whole life-cycle WF of 4.71 L/kWh, with the operational WF (wet cooling and heliostat cleaning, etc.) accounting for the majority (89%) (Burkhardt et al., 2011). The water consumption for CSP generation was estimated based on wet cooling in this study, although dry cooling and hybrid cooling systems are also used for CSP generation (Fthenakis and Kim, 2010).
Using the formulas described in Section 2 and data from the literature, the agricultural, industrial, domestic, and ecological WFs in Qinghai were estimated at 480.18, 33.61, 52.85, and 23.13 m3/person/year, respectively. The agricultural WF was the highest, being 14.27, 9.09, and 20.76 times the industrial, domestic, and ecological WFs, respectively. The per capita water consumption in Qinghai was estimated at 589.77 m3/year (Figure 3).
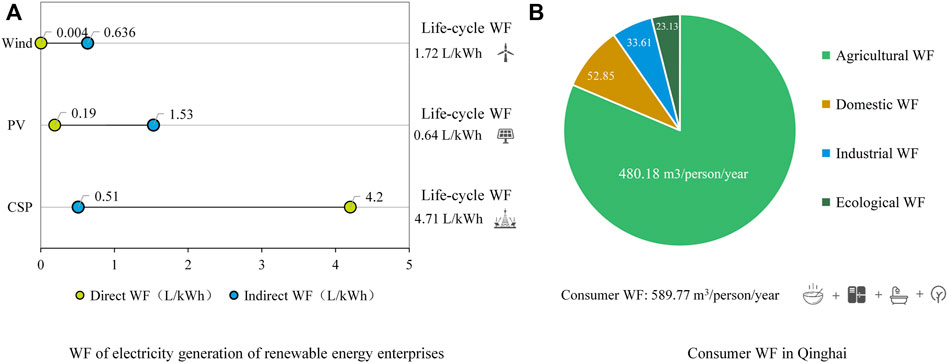
FIGURE 3. WF of renewable energy enterprises: (A) electricity generation WF; (B) employee WF.
Figure 4 shows the current water consumption by local renewable energy (wind and solar) enterprises estimated using the data and methods described above. In Scenario 1 (nonlocal origin of raw materials and local origin of employees), water consumption by the local renewable energy enterprises was minimally estimated at 1.62 × 10⁶ m3, most of which (72.9%) constituted water consumption by PV enterprises (1.18 × 10⁶ m3), followed by that of CSP enterprises (4.2 × 10⁵ m3). In Scenario 2, total water consumption increased to 2.54 × 10⁶ m3 due to the nonlocal origin of employees, with that by PV enterprises (1.90 × 10⁶ m3) again accounting for the majority of it. The WF of CSP was relatively large. In Scenario 1, the output generation of PV was 62 times that of CSP, but the water consumption for PV was only 2.8 times that of CSP. In Scenario 4 (local origin of raw materials and nonlocal origin of employees), total water consumption by local renewable energy enterprises was estimated at 1.31 × 10⁷ m3, the highest among the current scenarios, with that contributed by the PV enterprises increasing to 1.14 × 10⁷ m3. Annual water consumption by the renewable energy enterprises under the current scenarios was estimated in the range of 1.62 × 10⁶–1.31 × 10⁷ m3. In 2020, water consumption by the three salt chemistry enterprises in Golmud was 5.56 × 10⁷ m3 (with a salt output of 5.56×10⁷ t), being 4.24–34.37 times that of local renewable energy enterprises. In the 2020 scenarios, water consumption by the local renewable energy enterprises accounted for 0.2–1.2% of the total water consumption and 1–6.8% of the industrial water consumption in Haixizhou, Qinghai (Water Resources Department of Qinghai Province, 2020).
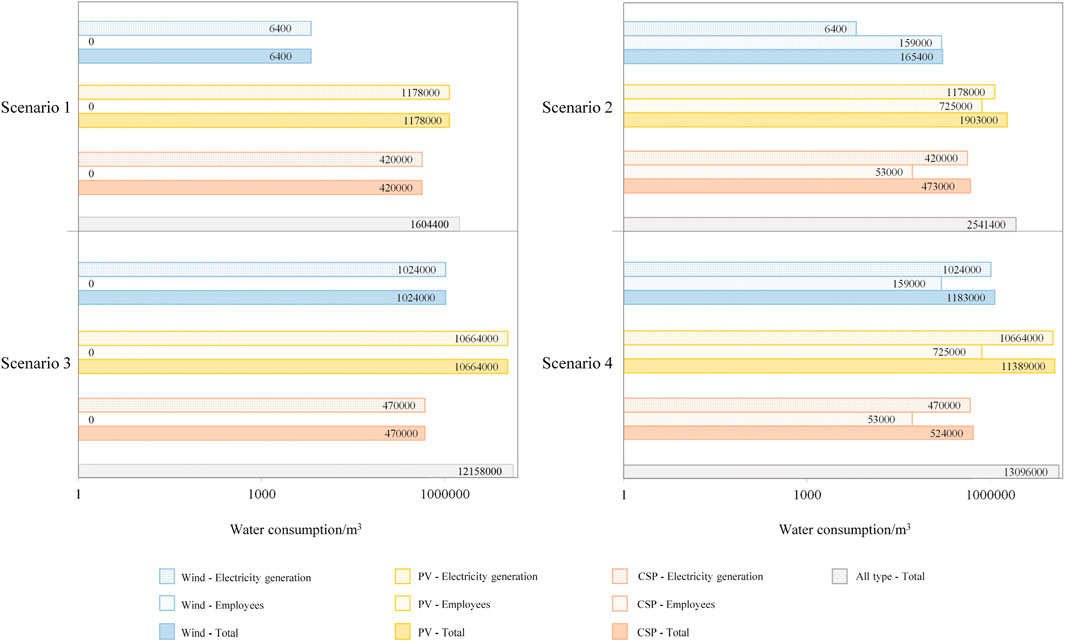
FIGURE 4. Water consumption by renewable energy enterprises in Golmud under current scenarios.
The multiple-year average of annual total water resources in the basin area of Golmud was 2.06 × 10⁹ m3, and the ecological water consumption under natural conditions was removed, leaving 7.71 × 10⁸ m3 of utilizable water resources. In the four current scenarios, the water consumption by the local renewable energy enterprises accounted for 0.07%–0.6% of the total water resources and 0.21%–1.7% of the utilizable water resources. According to estimates by relevant government departments, the utilized water resources in the basin area of Golmud reached 3.69 × 10⁸ m3 in 2015, leaving only 4.02 × 10⁸ m3 of unused water resources, these mainly concentrated in the basins of the Nalinggele River and Tuolahai River basins. Assuming that all remaining water resources are utilizable and earmarked for renewable energy electricity generation (with the water consumption by consumers not included in the remaining amount), the available water resources can support an additional electricity generation capacity of 2.34×10¹¹ kWh/year for PV, 6.28×10¹¹ kWh/year for wind power, and 8.5×10⁹ kWh/year for CSP. In Scenario 4 (with the highest water consumption among the current scenarios), water consumption by local renewable energy enterprises accounted for 30% of the remaining water resources. Thus, renewable energy development in Golmud could be shifted to those areas with more utilizable water resources, such as the Nalinggele River and Tuolaihai River basins.
Among the future scenarios of climate change and installed capacity of renewable energy expansion, water consumption by local renewable energy enterprises was the highest (7.77 × 10⁷ m3) under Scenario 7, being 5.98 times that under Scenario 4 and 40% higher than the 2020 water consumption by Golmud’s salt chemistry enterprises (Figure 5). The significant increase in the CSP installed capacity led to a significant increase in water consumption under Scenario 7 because whole life-cycle WF of CSP had reached up to 4.71 L/kWh, this 7.36 and 2.74 times that of wind power and PV, respectively. Furthermore, the number of employees required for per unit of CSP enterprises exceeded that of wind power or PV. The water consumption under Scenarios 5 and 6 were 2.88×10⁷ and 3.02 × 10⁷ m3, thus respectively 54.9% and 57.0% greater than under Scenario 4 (2020). This was a consequence of the doubling of wind power, PV, and CSP installed capacities in Scenario 5 and the significant increase in the installed PV capacity in Scenario 6 vis-à-vis the corresponding capacities in Scenario 4. The water consumption between Scenarios 5 and 6 differed by only 0.14 × 10⁷ m3. This was because the installed capacity of PV increased but the installed capacities of wind power and CSP decreased in Scenario 6 when compared with Scenario 5—that is, the increased water consumption for PV power generation was partially offset by the decreased water consumption for wind power and CSP generation and, more importantly, the installed capacities of CSP in these two future scenarios differed insignificantly.
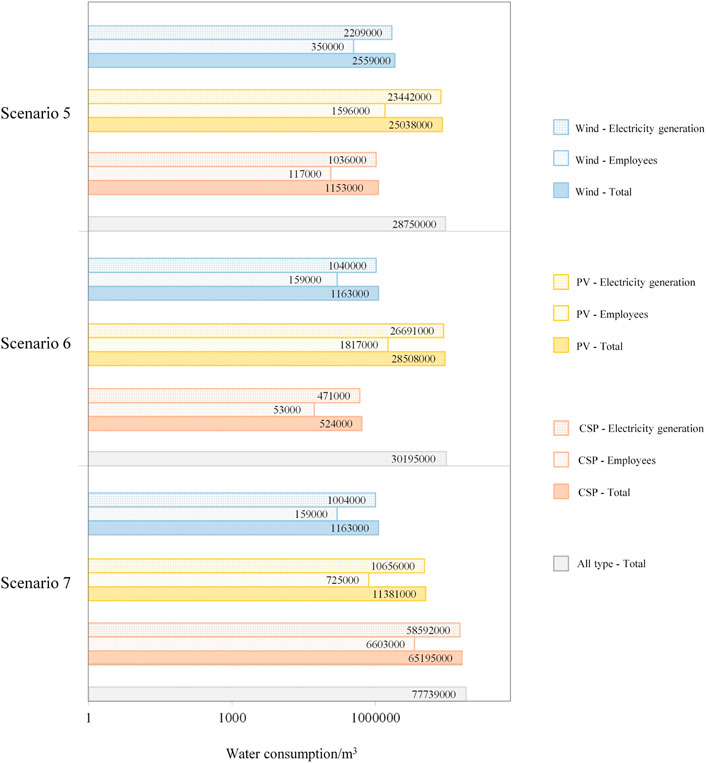
FIGURE 5. Water consumption by renewable energy enterprises in Golmud under future scenarios.
Total water resources in the basin area of Golmud in the 2030 future scenarios (2.15 × 10⁹ m3, predicted using the temperature and precipitation data of CMIP6) increased by 4.4% (9.1 × 10⁷ m3) when compared with 2020. However, due to the significant increase in the installed capacity for renewable energy electricity generation, water consumption increased by 54.9–493.6% (2.88 × 10⁷–7.77 × 10⁷ m3), accounting for 1.3%–3.6% of total water resources in 2030. The small increase in total water resources and significant increase in water consumption were expected to bring about a water crisis. In addition, the remaining water resources in 2015 reached a low level of 4.01 × 10⁸ m3—that is, renewable energy development under future scenarios was expected to consume 7.15%–19.35% of the remaining utilizable water resources, at a minimum.
Because the arid and semi-arid regions in Northwest China have high solar radiation intensity, they are deemed suitable for PV and CSP development projects. Yet the direct contradiction between high water consumption by renewable energy enterprises and long-term water resource scarcity in Northwest China inherently limits the potential increase in installed capacity of solar power there despite the rich solar energy resources it offers. In particular, CSP generation is expected to emerge as the main driver of solar power generation in China in the foreseeable future because of its advantages, such as integrated power generation and heat storage, 24-h continuous power supply, and capacity for peak regulation. In December 2018, China’s first 100 MW-class molten-salt, tower-type CSP plant finished construction and commenced its grid-connected operation; this project is equipped with the world’s largest, highest, and 24-h operating 100 MW-class molten salt tower. The State Grid has started planning a power system in Northwest China whereby fossil-fired power plants are completely replaced by CSP plants (http://www.cnste.org/html/huiyi/2021/0716/8118.html). However, the prerequisite wet cooling and the heliostat cleaning for maintaining CSP plants in desert areas together consume a tremendous amount of water resources. Undoubtedly, water resource is a factor constraining the renewable energy development in the arid and semi-arid regions of Northwest China. Thus, renewable energy development, especially the expansion of solar power generation, should be planned appropriately based on an accurate assessment of water resources available now and in the near future.
Furthermore, the quantity of water was primarily considered in the water consumption for renewable energy power generation in this study. Actually, the quality of water can also affect the efficiency of electricity generation from the various types of renewable energy sources (Meldrum et al., 2013). Nevertheless, given the present inadequate understanding of the mechanisms underlying the effects of water quality upon the efficiency of renewable energy power generation, water quality could be not considered in this study. Concerning our method to quantify water consumption, the WF of renewable energy power generation estimated here included blue water WF only, thus omitting gray water WF due to the difficulty to obtain sufficient local data on its parameters. Another challenge, more generally, is the relatively few studies on WF of PV, CSP, and wind power generation for China, especially the WF of CSP generation. Therefore, the WF estimates in our study was mainly based on the internationally unified standards of water consumption for renewable energy power generation. However, the operational and supply-chain WF of a given enterprise is influenced by its background environment—that is, enterprises in different geographical areas likely differ in the magnitude of their respective WF. Hence, the water consumption levels estimated in this study might be partially biased compared with the actual situation. Nonetheless, by considering multiple factors that are known to affect water consumption and estimating water consumption levels under four current and three future scenarios, the water consumption estimates reported here could be given as ranges of values, thereby mitigating the effect of a WF estimation deviation upon the results (and any inferences drawn from them).
For the current scenarios examined, the water resource requirements for wind power, PV, and CSP generation in Golmud ranged from 1.62 × 10⁶ to 1.31 × 10⁷ m3, accounting for ca. 0.07%–0.6% of the current total water resources in Golmud. Scenario 1 (nonlocal origin of renewable energy electricity generation equipment and raw materials and local origin of employees) featured the lowest water consumption, whereas Scenario 4 (local origin of equipment and raw materials and nonlocal origin of employees) entailed the highest water consumption. The water consumption by Golmud’s salt chemistry industry (5.56 × 10⁷ m3) is 4.24–34.37 times that of the local renewable energy industry—that is, the water resource requirement for the local renewable energy industry, despite being at the early stage of development, is also quite high. An increase of 6.17 × 10⁶ kW in the installed capacity of wind and solar power under the 2030 scenarios requires an extra 1.57 × 10⁷–6.46 × 10⁷ m3 in water resource appropriation for the local renewable energy industry, this representing 7.15%–19.35% of the remaining utilizable water resources in basin area of Golmud. Different ratios between the installed capacities of wind power, PV, and CSP lead to differing water resource requirements. Scenario 7 (unchanged installed capacity for wind power and PV generation and significantly increased installed capacity for CSP generation) has the maximum requirement of total water resources, at 7.77 × 10⁷m3, accounting for 3.6% of the total water resources in 2030. Scenarios 5 and 6 differ insignificantly in their water resource requirements. The small increase total water resources coupled with the huge expansion of the local renewable energy industry in 2030 are expected to place much greater pressure on Golmud’s water resources.
The original contributions presented in the study are included in the article/Supplementary Material, further inquiries can be directed to the corresponding author.
WH: conceptualization, methodology, formal analysis, writing—original draft. XL: methodology, data curation, and visualization. LY is responsible for conceptualization, writing—reviewing and editing and project administration. WT and XJ are responsible for investigation, writing—review and editing as well.
This study was supported by the “Strategic Priority Research Program” of the Chinese Academy of Sciences (XDA23100403), and “Strategic Research Program” of the Chinese Academy of Sciences (GHJ-ZLZX-2021-18).
The authors declare that the research was conducted in the absence of any commercial or financial relationships that could be construed as a potential conflict of interest.
All claims expressed in this article are solely those of the authors and do not necessarily represent those of their affiliated organizations, or those of the publisher, the editors, and the reviewers. Any product that may be evaluated in this article, or claim that may be made by its manufacturer, is not guaranteed, or endorsed by the publisher.
The authors acknowledge the Chinese Academy of Sciences and Ministry of Science and Technology, with gratitude.
Ali, B. (2017). The Cost of Conserved Water for Power Generation From Renewable Energy Technologies in Alberta, Canada. Energy Convers. Manag. 150, 201–213. doi:10.1016/j.enconman.2017.08.019
Bukhary, S., Ahmad, S., and Batista, J. (2018). Analyzing Land and Water Requirements for Solar Deployment in the Southwestern United States. Renew. Sust. Energ. Rev. 82 (3), 3288–3305. doi:10.1016/j.rser.2017.10.016
Burkhardt, J. J., Heath, G. A., and Turchi, C. S. (2011). Life Cycle Assessment of a Parabolic Trough Concentrating Solar Power Plant and the Impacts of Key Design Alternatives. Environ. Sci. Technol. 45, 2457–2464. doi:10.1021/es1033266
Celik, A. N., and Özgür, E. (2020). Review of Turkey's Photovoltaic Energy Status: Legal Structure, Existing Installed Power and Comparative Analysis. Renew. Sust. Energ. Rev. 134, 110344. doi:10.1016/j.rser.2020.110344
Chen, X., Song, Li., Huang, H., Liu, A., and Fan, S. (2011). Study on Characteristics of Wind Energy Resources in Two Typical Areas in China. Acta Energiae Solaris Sinica (3), 55–61.
Cheng, Z., Lu, B., Xiong, S., Wang, H., Hu, Y., and Zhang, Q. (2016). Analysis on Water Resources Carrying Capacity Based on Water Footprint Model in Xinjiang. J. Water Res. Water Eng. 27 (6), 54–59. doi:10.11705/j.issn.1672-643X.2016.06.10
China Electric Planning and Engineering Institute (2021). Report on China’s Electric Power Development 2020. Beijing: People's Daily Press.
Cui, Y., Zhang, H., Zhong, W., Zhao, Y., Wang, Z., and Xu, B. (2020). Day-ahead Scheduling Considering Participation of Price-based Demand Response and CSP Plant in Wind Power Accommodation. Power Syst. Technol. 44 (1). doi:10.13335/j.1000-3673.pst.2019.0181
Fthenakis, V., and Kim, H. C. (2010). Life-cycle Uses of Water in U.S. Electricity Generation. Renew. Sust. Energ. Rev. 14, 2039–2048. doi:10.1016/j.rser.2010.03.008
Golmud Local Chronicles Compilation Committee (2020). Golmud Yearbook. Xi’an: Shaanxi Science and Technology Press.
Hoekstra, A. Y., Chapagain, A. K., Aldaya, M. M., and Mekonnen, M. M. (2011). The Water Footprint Assessment Manual: Setting the Global Standard. London: Earthscan.
Hoekstra, A. Y., and Hung, P. Q. (2003). “Virtual Water Trade: A Quantification of Virtual Water Flows Between Nations in Relation to Internation Corp Trade,” in Proceedings of the International Expert Meeting on Virtual Water Trade 12, Delft, 25–47.
Jia, Y, Yan, Y, Wang, C, Liang, Y, Zhang, Y, Wu, G, et al. (2012). The Estimation and Application of the Water Footprint in Industrial Processes. Acta Eco Sin 32 (20), 6558–6565. doi:10.5846/stxb201201060030
Li, X., Feng, K., Siu, Y. L., and Hubacek, K. (2012). Energy-water Nexus of Wind Power in China: The Balancing Act between CO2 Emissions and Water Consumption. Energy Policy 45, 440–448. doi:10.1016/j.enpol.2012.02.054
Long, A., Zhang, Z., Xu, Z., and Su, Z. (2005). Analysis of Water Footprint and Consumption Pattern in Gansu Province. Adv. Water Sci. 16 (3), 418–425. doi:10.3321/j.issn:1001-6791.2005.03.019
Macknick, J., Meldrum, J., Nettles-Anderson, S., Heath, G., and Miara, A. (2014). Life Cycle Water Use for Photovoltaic Electricity Generation: A Review and Harmonization of Literature Estimates. Environ. Res. Lett. 8 (1), 1458–1460. doi:10.1109/pvsc.2014.6925190
Mani, M., and Pillai, R. (2010). Impact of Dust on Solar Photovoltaic (PV) Performance: Research Status, Challenges and Recommendations. Renew. Sust. Energ. Rev. 14 (9), 3124–3131. doi:10.1016/j.rser.2010.07.065
Mekonnen, M. M., Gerbens-Leenes, P. W., and Hoekstra, A. Y. (2016). Future Electricity: The Challenge of Reducing Both Carbon and Water Footprint. Sci. Total Environ. 569-570 (nov.1), 1282–1288. doi:10.1016/j.scitotenv.2016.06.204
Mekonnen, M. M., Gerbens-Leenes, P. W., and Hoekstra, A. Y. (2015). The Consumptive Water Footprint of Electricity and Heat: A Global Assessment. Environ. Sci. Water Res. Technol. 1 (3), 285–297. doi:10.1039/c5ew00026b
Meldrum, J., Nettles-Anderson, S., Heath, G., and Macknick, J. (2013). Life Cycle Water Use for Electricity Generation: A Review and Harmonization of Literature Estimates. Environ. Res. Lett. 8, 015031. doi:10.1088/1748-9326/8/1/015031
National Bureau of statistics of the people's Republic of China (2020). China Statistical Yearbook. Beijing: China Statistics Press.
Old, T., and Kance, S. (2003). “Virtual Water Trade to Japan and in the World. Virtual Water Trade,” in Proceedings of the International Expert Meeting on Virtual Water Trade, 12-13 December 2002. Editor A. Y. Hoekstra Edited (Delft, Netherlands: Value Water Res. Rep. Ser).
Qinghai Provincial Bureau of statistics, (2020). Qinghai Investigation Team of National Bureau of Statistics QinghaiStatistical Yearbook. Beijing: China Statistics Press.
Wild-Scholten, M. d., and Alsema, E. A. (2005). Environmental Life Cycle Inventory of Crystalline Silicon Photovoltaic Module Production. MRS Proc. 895, 304. doi:10.1557/proc-0895-g03-04
Wu, D., Wang, J., Li, H., Wang, Z., Zhang, N., and Kang, C. (2018). Research on Capacity and Delivery Sequence of Interconnected Northwestern-Southwestern Power Grid Towards Renewable Energy Accommodation. Power Syst. Technol. 42 (7). doi:10.13335/j.1000-3673.pst.2018.0697
Xue, H., Zhu, R., Yang, Z., and Yuan, C. (2001). Assessment of Wind Energy Reserves in China. Acta Energiae Solaris Sinica (02), 167–170. doi:10.3321/j.issn:0254-0096.2001.02.010
Yang, D., Liu, J., Yang, J., and Ding, N. (2015). Life-cycle Assessment of China's Multi-Crystalline Silicon Photovoltaic Modules Considering International Trade. J. Clean. Prod. 94, 35–45. doi:10.1016/j.jclepro.2015.02.003
Zhang, L., and Shen, J. (2017). Analysis on Temporal and Spatial Pattern Evolution and Driving Factors of Water Footprint Intensity in China. Stat. Decis. (17), 143–147. doi:10.13546/j.cnki.tjyjc.2017.17.033
Keywords: arid region, solar and wind energy, water footprint of electricity generation, water resource requirement, scenario analysis
Citation: Hou W, Li X, Yang L, Ta W and Jia X (2022) Carrying Capacity of Water Resources for Renewable Energy Development in Arid Regions in Northwest China: A Case Study of Golmud, Qinghai. Front. Environ. Sci. 10:892414. doi: 10.3389/fenvs.2022.892414
Received: 09 March 2022; Accepted: 07 April 2022;
Published: 12 May 2022.
Edited by:
Monica Salvia, Institute of Methodologies for Environmental Analysis (IMAA), ItalyCopyright © 2022 Hou, Li, Yang, Ta and Jia. This is an open-access article distributed under the terms of the Creative Commons Attribution License (CC BY). The use, distribution or reproduction in other forums is permitted, provided the original author(s) and the copyright owner(s) are credited and that the original publication in this journal is cited, in accordance with accepted academic practice. No use, distribution or reproduction is permitted which does not comply with these terms.
*Correspondence: Wenjuan Hou, aG91d2VuanVhbkBpZ3NucnIuYWMuY24=
Disclaimer: All claims expressed in this article are solely those of the authors and do not necessarily represent those of their affiliated organizations, or those of the publisher, the editors and the reviewers. Any product that may be evaluated in this article or claim that may be made by its manufacturer is not guaranteed or endorsed by the publisher.
Research integrity at Frontiers
Learn more about the work of our research integrity team to safeguard the quality of each article we publish.